Market Minds Advisory
Standalone PV Inverter Market

Standalone PV Inverter Market: Standalone PV Inverter Market: Battery Protocols, Unreliable Grids and Remote Service, 2026 to 2036

Unreliable grids rather than absent ones now drive most demand, and the inverter that wins a specification is the one that talks natively to the battery, not the one with the better conversion efficiency.

Lead Analyst

Published

September 2026

Make Smarter Decisions with Customized Research Insights

Request a free sample report and evaluate market opportunities, growth trends, and competitive dynamics relevant to your business needs.

2025 MARKET VALUE$3.2BMarket Size 2025
2036 FORECAST VALUE$8.9BBase Case , 2026 to 2036
CAGR 2026 TO 20369.8 %Bull 11.0% / Bear 8.6%
INCREMENTAL OPPORTUNITY$5.4BNet 10- year value creation
EXPANSION MULTIPLE2.55x2036 value over 2026 base
Strategic Levers
M&A Pipeline
Regional Outlook
Country Rankings
Competitive Intelligence
Segmental Deep-dive
Call-Us : 91 93563 13602

Executive Snapshot and Market Trajectory.

The buyer changed and almost nobody noticed. Standalone inverters were built for rural households with no grid at all, and most now go to households that have a grid which fails, in Lagos, Karachi, Beirut and Johannesburg. Unreliability sells far more units than absence ever did. Nobody planned for that.
Specification has moved with it. Battery-integrated hybrid inverters grow at 14.7%, half again the market rate of 9.8%, and the reason is communication rather than power electronics: an inverter that talks natively to a lithium battery management system over a supported protocol gets specified, and one that does not gets excluded. Only 62% of shipped units support closed-loop battery communication, which is the real dividing line in this market. Efficiency figures settle nothing now.
Five manufacturers hold 44% of measured shipment volume, and Chinese producers supply most of it. Field failure rates near 4.1% in the first warranty year sit against service networks that in many markets do not exist at all, and only 38% of the installed base can be reached for a firmware update. Pakistan grows at 16.8%, faster than any country anywhere, on tariff increases nobody planned around. Nobody modelled it.
Market Definition
The standalone photovoltaic inverter market covers inverters and inverter-chargers that create and hold an alternating current supply independently of any utility grid, spanning low-frequency transformer-based inverter-chargers, high-frequency transformerless off-grid inverters, battery-integrated hybrid inverters, parallel-stackable modular units, three-phase standalone inverters and sub-kilowatt converters. Sizing is measured at manufacturer revenue. Grid-tied string, central and microinverters operating only in parallel with a utility supply, charge controllers, batteries and mounting equipment are excluded.
Base Year Value
$3.2B in 2025 (MMA Primary Research Dataset, September 2026)
Forecast Period
2026 to 2036, eleven discrete annual values
CAGR
9.8% base case. Bull 11.0%. Bear 8.6%.
Fastest Growth Segment
Battery-Integrated Hybrid Inverters: 14.7% CAGR
Fastest Growth Country
Pakistan: 16.8% CAGR
Fastest Growth Region
South Asia and Pacific: 12.0% CAGR
Largest Region
South Asia and Pacific: 30% of 2025 global value
Market Leaders
Deye Technology, Growatt New Energy, Victron Energy, SMA Solar Technology, Studer Innotec. Source: MMA Analysis based on company disclosures and measured shipment volume.
Primary Survey
n=3,800 procurement and R&D decision-makers, Q4 2025, six countries
Methodology
Demand-side build-up, cross-validated against public data, 47 expert interviews

Standalone PV Inverter Market Forecast Scenarios

standalone-pv-inverter-market-size-forecast-scenario-1788412429335
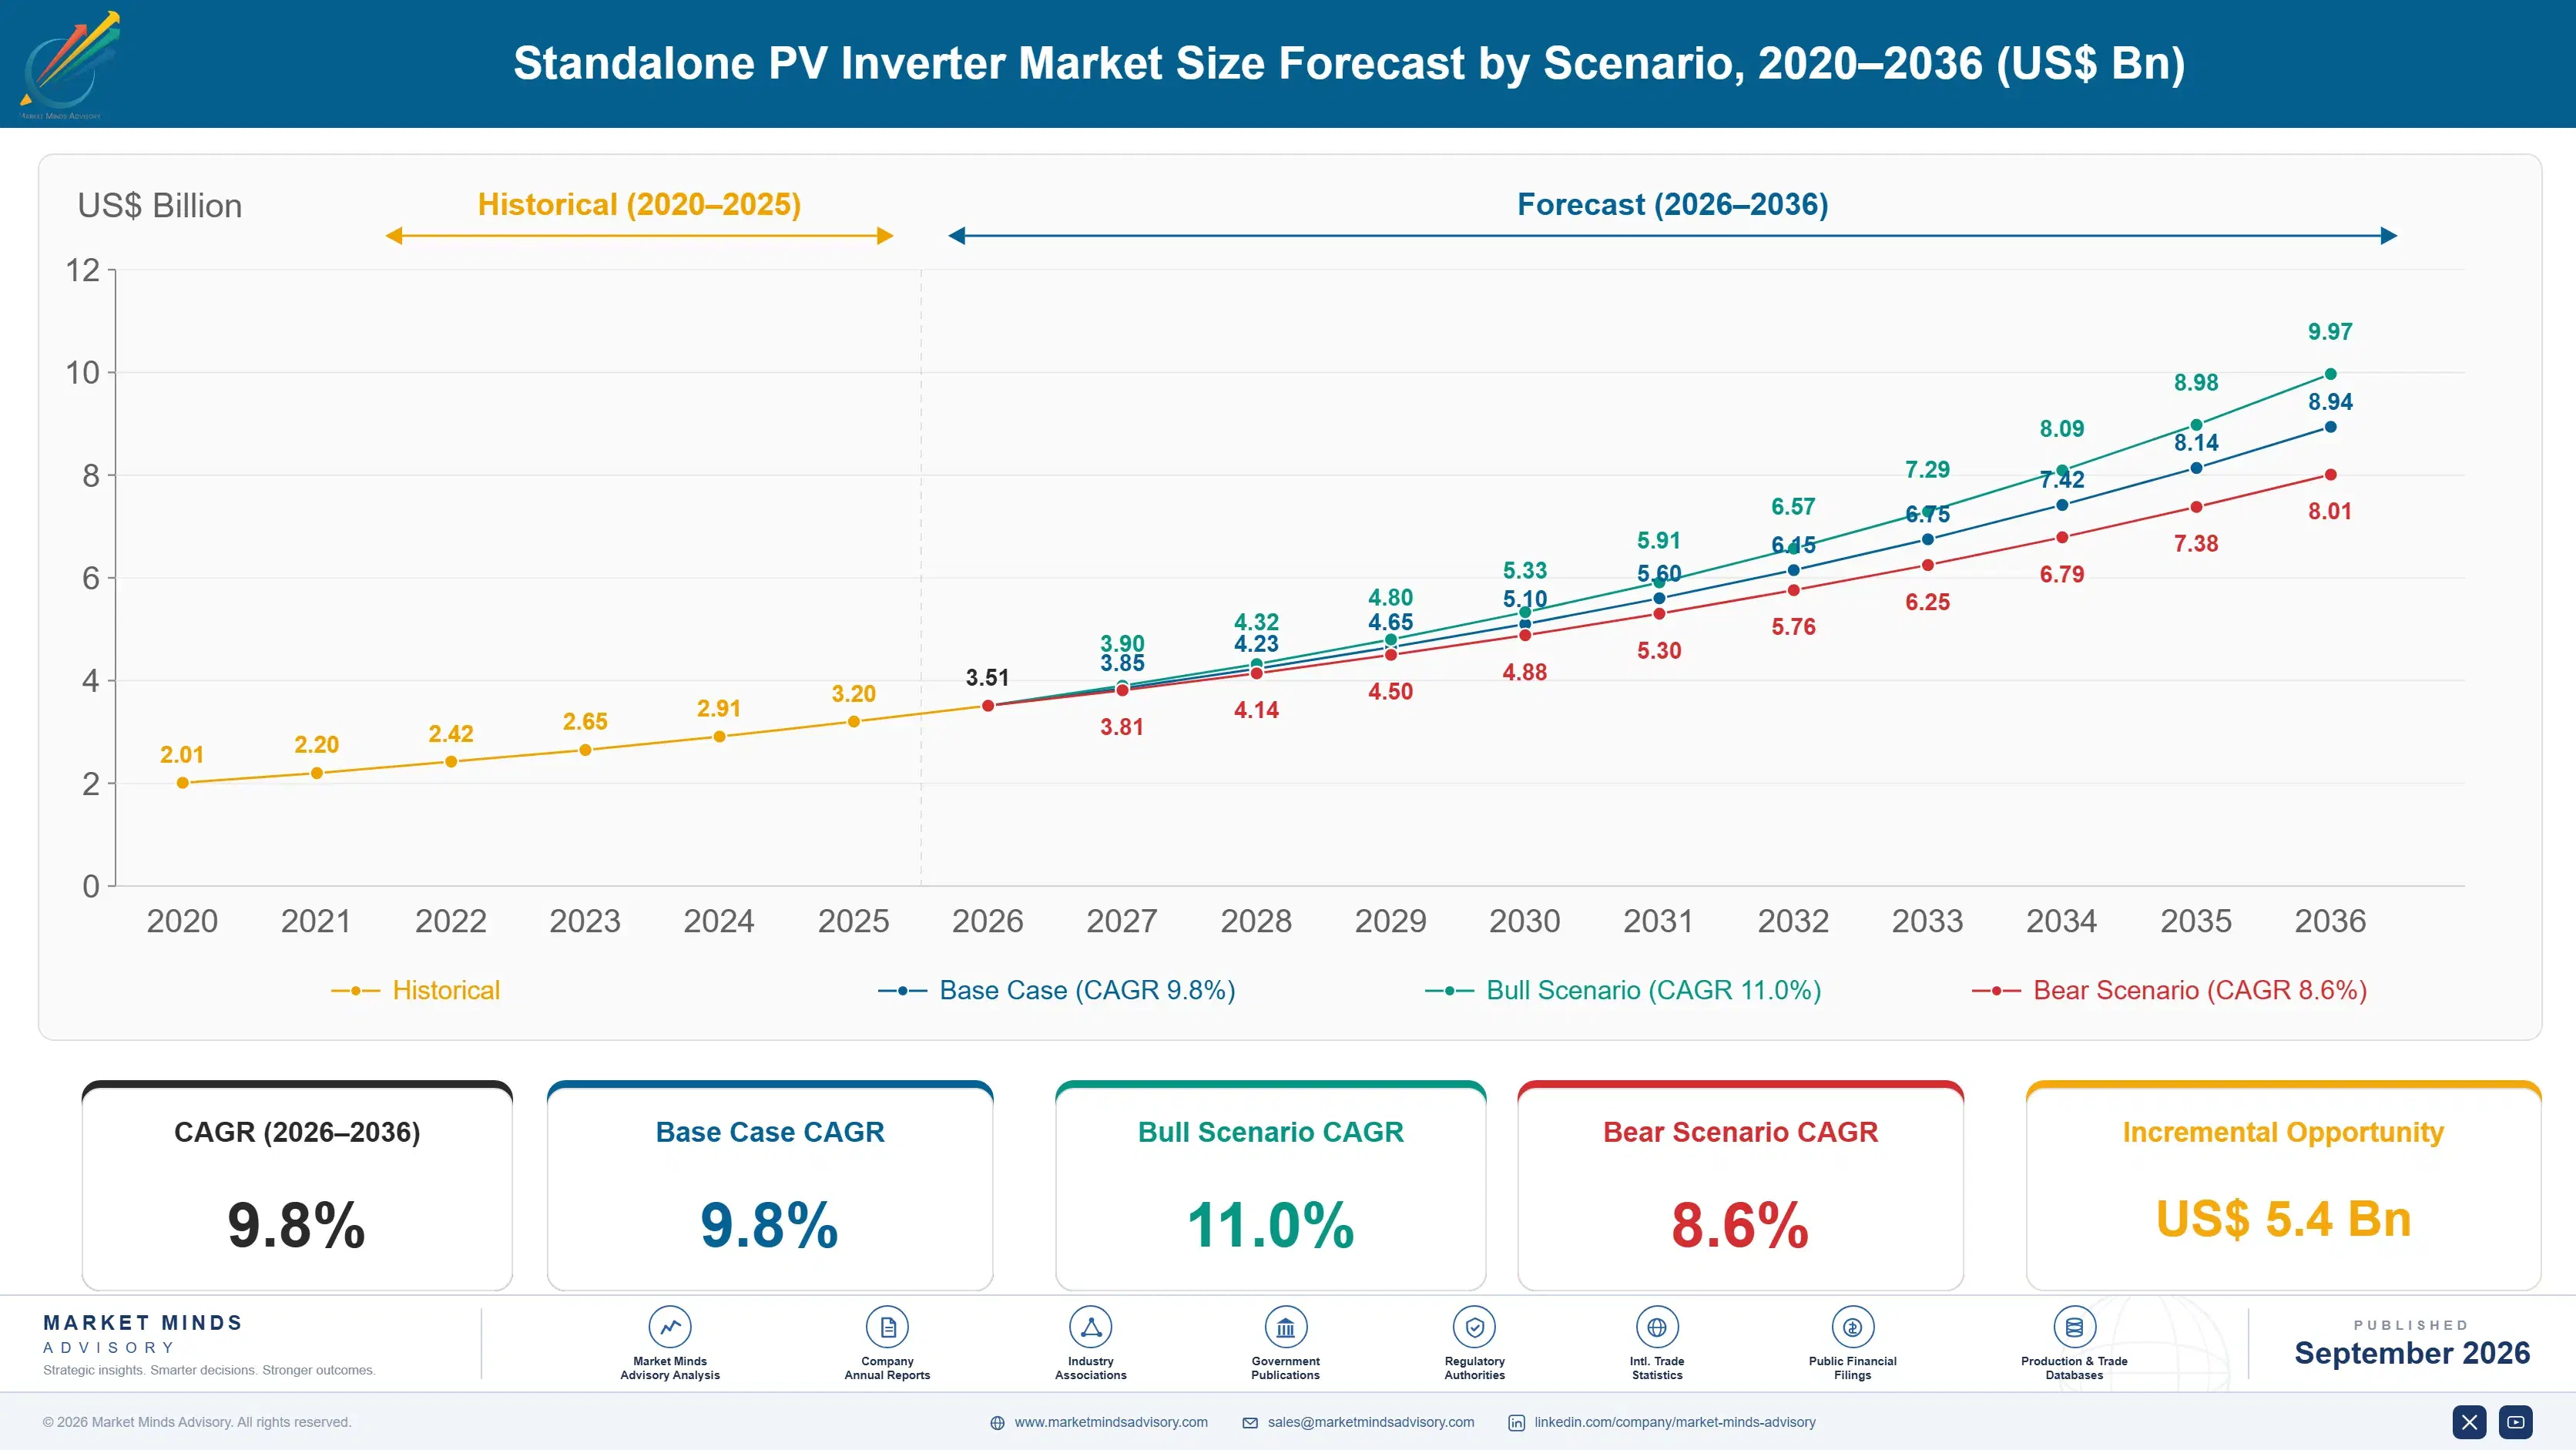
Between 2020 and 2025 the market compounded at 8.6%, and the composition changed completely inside that figure. Rural electrification demand, which drove the category for two decades, flattened as grid extension and mini-grid programmes reached the households donors had targeted. Replacing it was something nobody forecast: urban households in countries where the grid exists but cannot be relied upon, buying with their own money.
The 9.8% base case rests on three commercial mechanisms. Lithium battery prices fell far enough that a household storage system became affordable in markets where lead acid had capped adoption, and the inverter is sold with it. Electricity tariff increases across several South Asian and African markets have made self-supply pay on ordinary arithmetic rather than on any subsidy. And three-phase and stackable architectures have opened small commercial demand that single-phase products could never serve properly.
The bull case is further tariff increases across South Asia and Africa converting more urban households from backup buyers into genuine self-suppliers, which multiplies system size. The bear case is grid reliability improving materially in the two or three markets currently carrying most of the growth, since demand driven by failure disappears when the failure stops.

Why Unreliable Grids Sell More Than Absent Ones

For twenty years this was a rural electrification product, sold into villages with no grid and funded by development programmes. That market still exists and has stopped growing. What replaced it is a city household that has a connection, pays for it, and gets power for part of the day. Those buyers spend their own money, buy larger systems, and there are far more of them.
TOP FIVE CONCENTRATION44%Share of measured shipment volume held by leading manufacturers
AVERAGE SELLING PRICEUSD 310Typical manufacturer price for a mid-range single-phase unit
BATTERY PROTOCOL COVERAGE62%Portion of shipped units supporting closed-loop battery communication natively
FIRST YEAR FAILURE RATE4.1%Reported unit failures within the first warranty year
REMOTE UPDATE REACH38%Portion of installed base reachable for firmware updates remotely
DESIGN SERVICE LIFE10 yearsDesign life before replacement becomes expected in field service
The technical dividing line is not conversion efficiency, which is broadly settled, but whether the inverter communicates with a lithium battery management system over a protocol the battery actually supports. Closed-loop communication lets the battery tell the inverter its true state of charge and current limits, preventing the premature failures open-loop guessing produces. Only 62% of shipped units offer it, and installers check compatibility lists first.
Service economics are the unresolved problem. Field failure rates near 4.1% in the first warranty year would be tolerable with a service network, and in most of these markets none exists. Remote firmware update and diagnostics change that arithmetic completely, letting a manufacturer fix a fault without anyone travelling, yet only 38% is reachable. Manufacturers investing here are solving a cost problem competitors treat as unavoidable.
"Everyone in this industry talks about efficiency points that no customer can perceive. The actual purchase decision is made by an installer scrolling a battery compatibility list, and the manufacturers who understood that three years ago now hold positions the rest cannot buy their way into."
Director, Distributed Storage and Power Conversion Practice · MMA Energy and Power Practice · September 2026

Market Trends

Battery Communication Compatibility Decides The Specification

An inverter and a lithium battery must exchange state of charge, voltage and current limit data for the system to behave properly, and that exchange runs over manufacturer-specific protocols rather than any universal standard. Closed-loop operation prevents the overcharging and deep discharging that open-loop guessing produces, and it is what battery warranties increasingly require. Installers now consult compatibility lists before comparing anything else, which means an inverter absent from the list of a popular battery is simply not considered. Only 62% of shipped units support closed-loop communication natively, and the gap between those that do and do not is widening.
Market Impact: Cuts payback below 3 years
Remote Firmware Management Rewrites Service Economics

A field failure in northern Nigeria or interior Sindh costs far more to attend than the inverter is worth, so warranty obligations in these markets are frequently honoured in name only. Remote diagnostics and firmware update change that entirely: a manufacturer can identify a configuration fault, correct it and verify the fix without anyone travelling. Around 38% of the installed base is currently reachable this way. Manufacturers who built connectivity in are able to offer genuine warranties in markets where competitors cannot, and that becomes a commercial advantage rather than a technical feature.
Market Impact: Grows at 14.7% annually

Market Opportunities and Growth Drivers

Tariff Increases Make Self-Supply Pay Without Subsidy

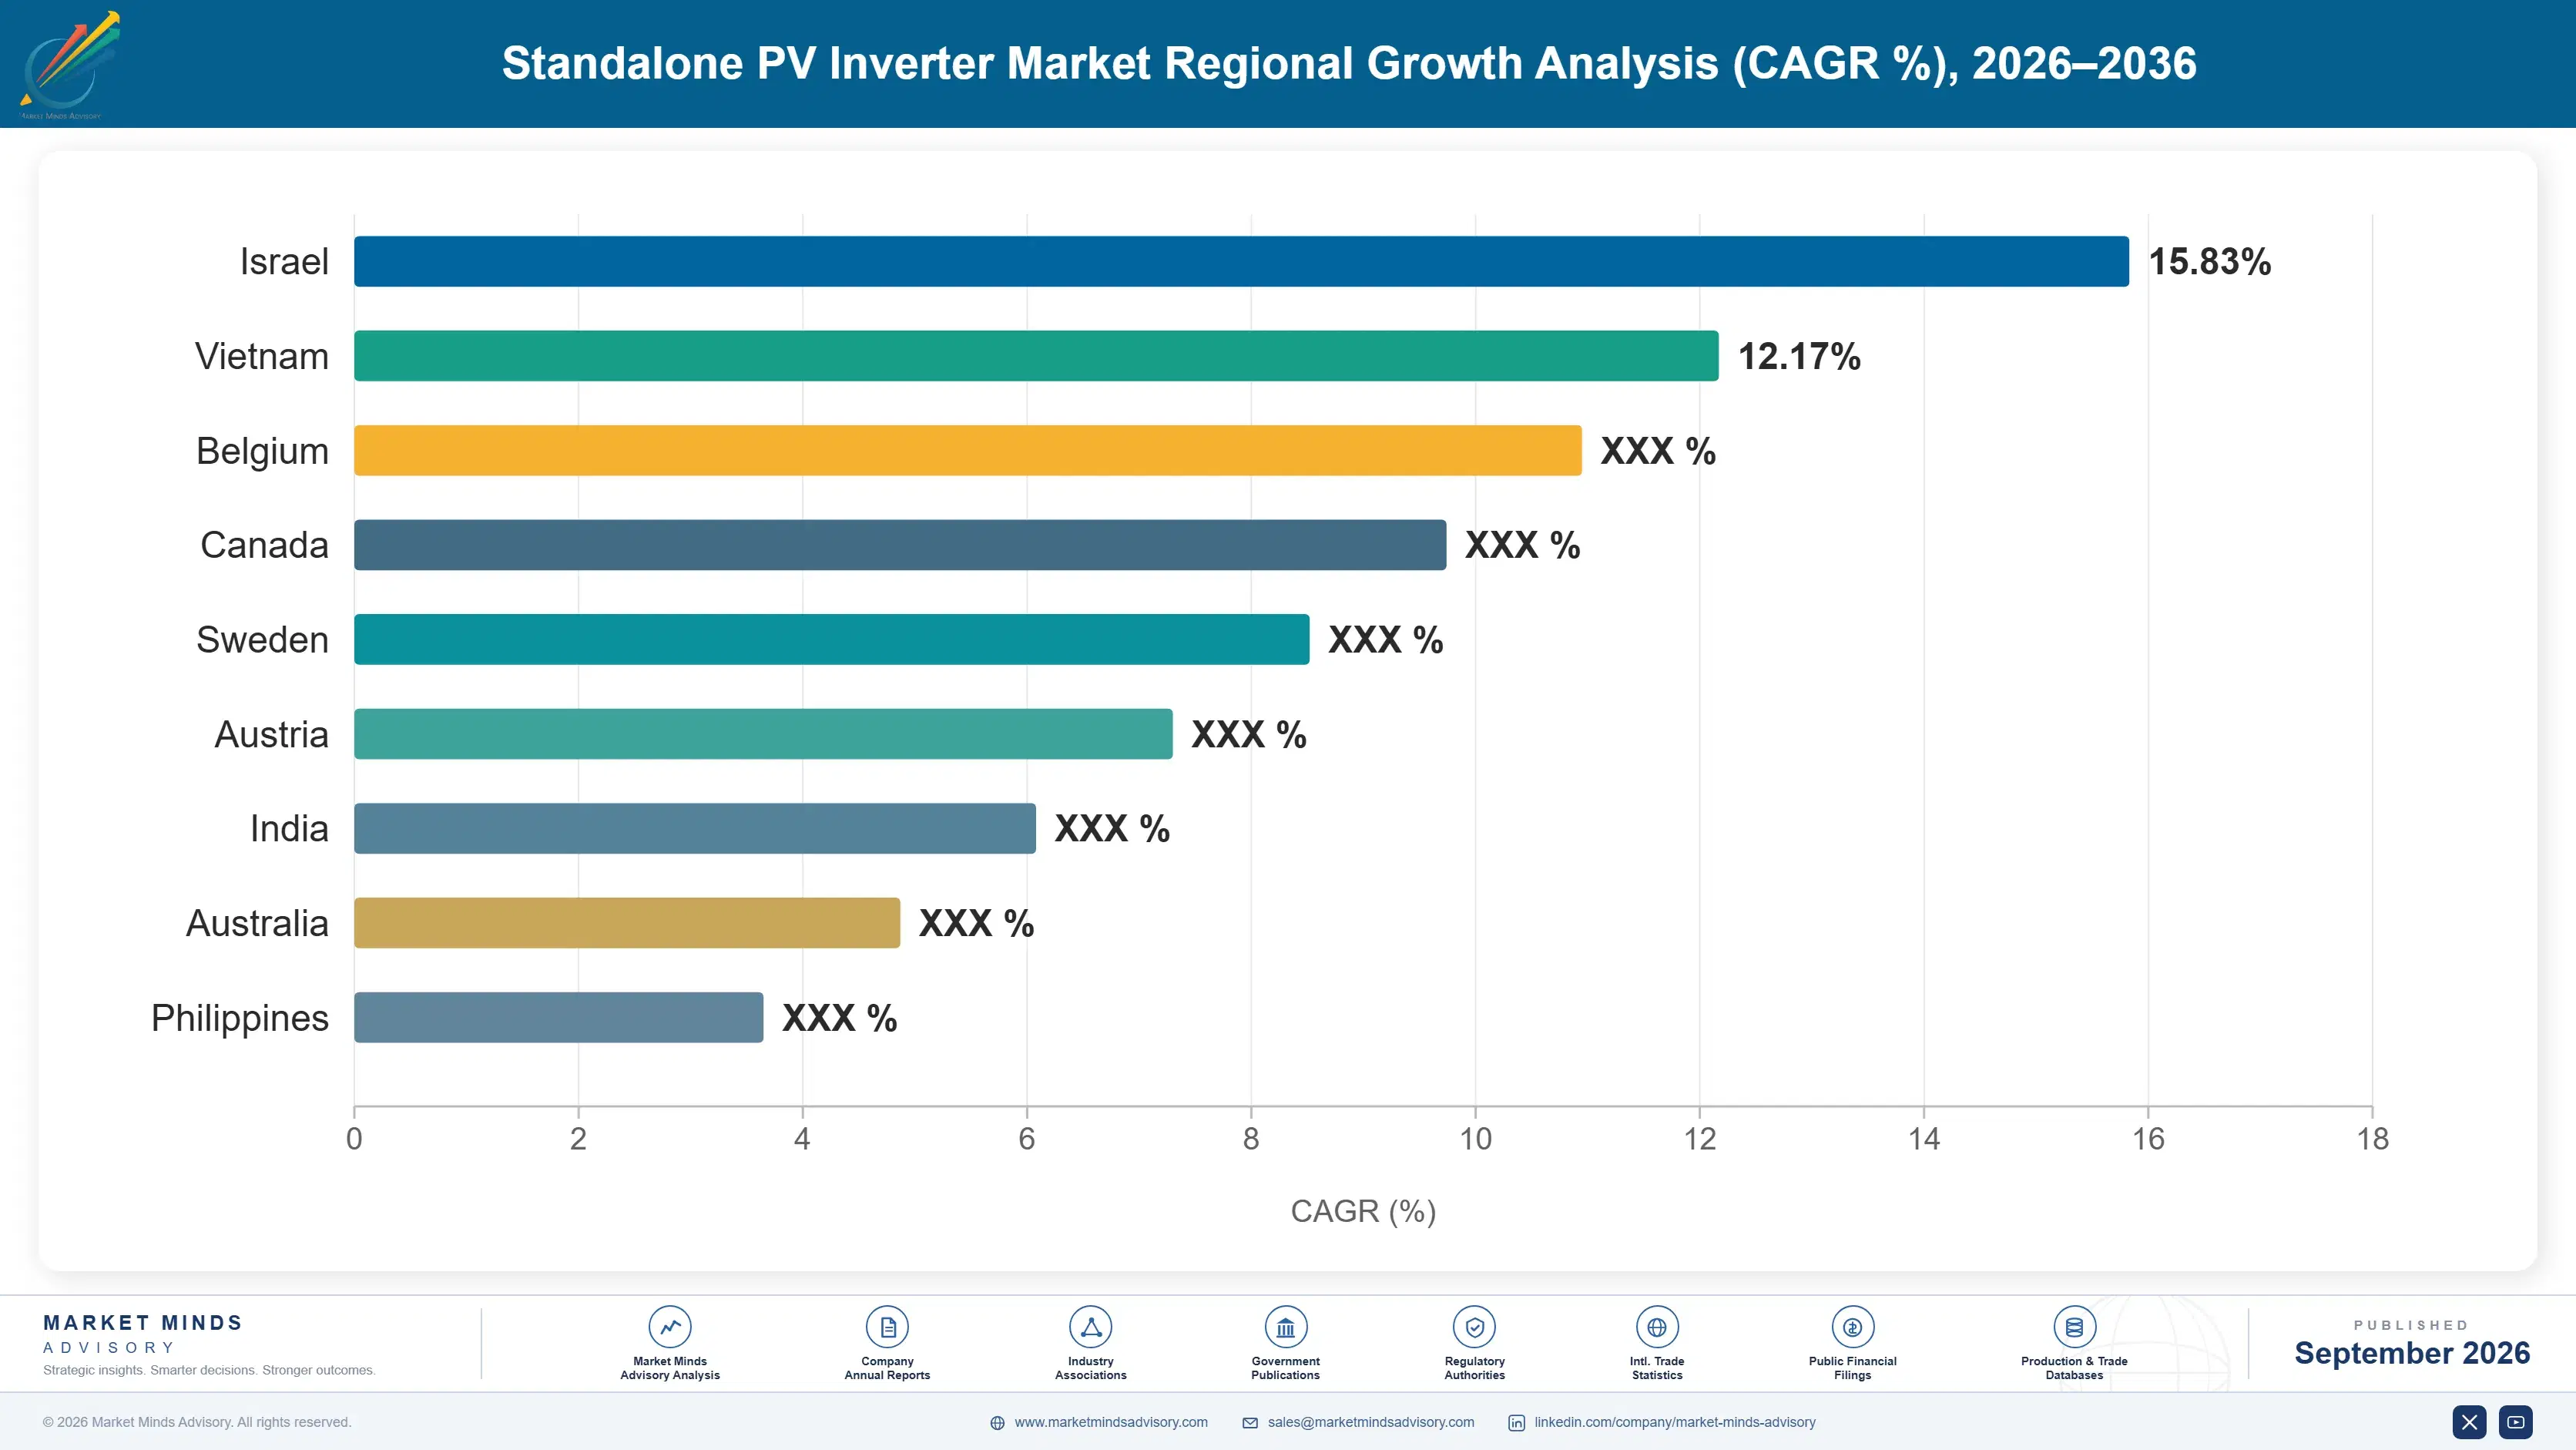
Electricity tariffs across Pakistan, Nigeria, South Africa and several other markets have risen sharply as subsidies were withdrawn and currencies weakened, and household solar with storage now pays back on ordinary arithmetic rather than on any incentive. Once payback falls below roughly three years, adoption stops being an environmental decision and becomes a financial one that spreads by word of mouth. Pakistan grows at 16.8%, faster than any country in this market, on exactly that mechanism. Import statistics from national authorities have repeatedly surprised forecasters who modelled policy rather than tariffs.
Market Impact: Leaves 62% of base unreachable

Lithium Battery Prices Opened Household Storage

Lead acid capped household storage adoption for decades because usable capacity was small, cycle life short and replacement frequent. Lithium iron phosphate changed all three at once, and the price decline through recent years brought a genuinely useful household battery within reach of middle-income buyers in these markets. The inverter is sold alongside it and increasingly as part of it. That coupling is why battery-integrated hybrid designs grow at 14.7% while conventional off-grid inverters grow at less than two-thirds of that rate. Nobody now sells an inverter separately from the battery it will run.
Market Impact: Delays 90 day payment cycles

Market Restraints and Challenges

Service Networks Do Not Exist Where Demand Is Growing

First year field failure rates near 4.1% require a service answer, and across most of the markets carrying this growth there is no network to provide one. The root cause is that demand arrived faster than any manufacturer could build distribution, and margins at these price points do not support company-owned service infrastructure. Commercial impact reaches the brand rather than the individual sale, since a household with a dead inverter tells everyone. Participants are mitigating through remote diagnostics, swap-out arrangements with distributors and installer certification programmes, though coverage remains patchy and inconsistent across most territories.
Market Impact: Covers 62% of shipped units

Currency And Import Financing Constrain The Largest Markets

The markets growing fastest are precisely those with weak currencies and restricted access to foreign exchange, so distributors struggle to open letters of credit and manufacturers carry receivable risk they would not accept elsewhere. Devaluation between order and payment has wiped out distributor margin more than once. The root cause is that demand is driven by the same economic stress that weakens the currency. Manufacturers mitigate through prepayment terms, regional stock held in hard-currency hubs and in some cases credit insurance, all of which add cost to an already price-sensitive product.
Market Impact: Reaches 38% of installed base
3 additional market trends, 4 additional growth drivers, and 2 additional restraints and challenges are covered in the full report. Contact sales@marketmindsadvisory.com to access the complete intelligence.

Segment CAGR and Growth Architecture

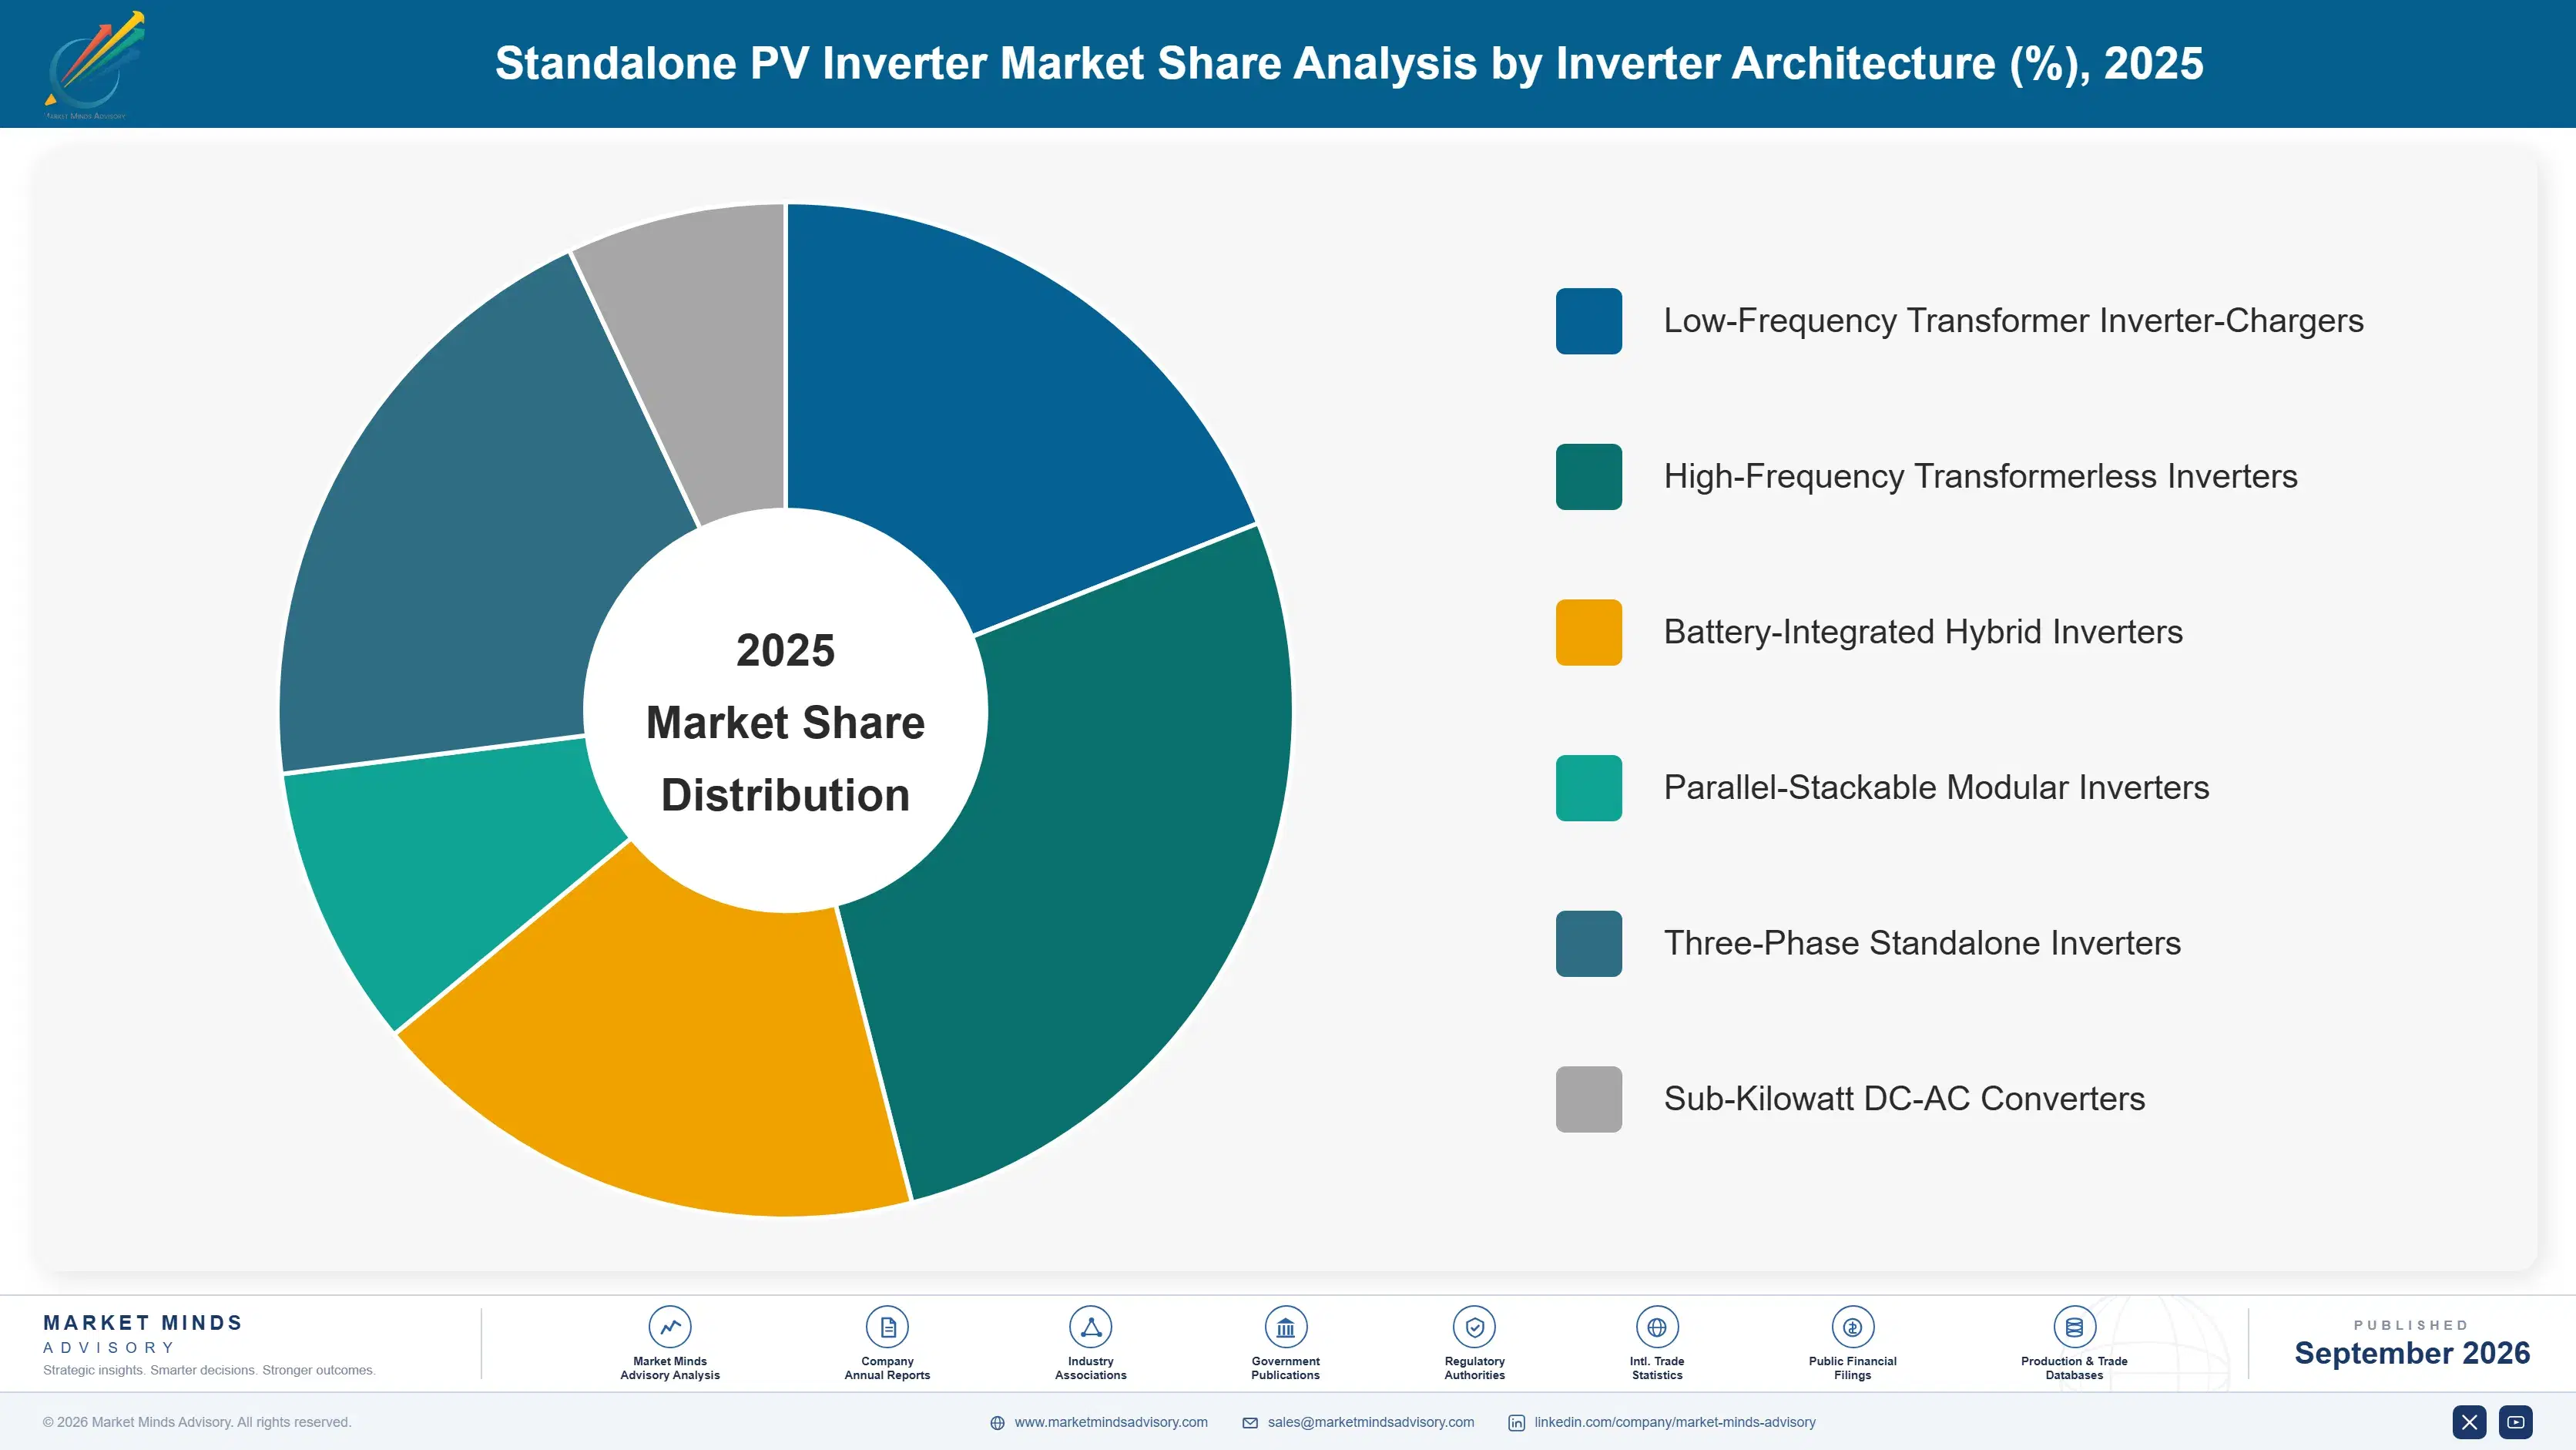
Segmentation follows inverter architecture, which determines surge capability, battery compatibility, scalability and cost, and which is how installers actually choose. Transformer-based, transformerless, battery-integrated, stackable, three-phase and sub-kilowatt designs each serve a different installation problem, and substitution between them is rare once a system has been designed. Installers think in these terms rather than in ratings.
standalone-pv-inverter-market-market-share-analysis-1788412429866

Battery-Integrated Hybrid Inverters

These units combine inverter, charge controller and battery management interface in one enclosure, designed from the start around lithium chemistry rather than adapted to it. Closed-loop communication with the battery is native rather than added, which is what installers check first and what battery warranties increasingly require. The architecture also reduces wiring, commissioning time and the number of things an inexperienced installer can get wrong, which matters enormously in markets where installation quality varies widely. Growth at 14.7% is half again the market rate of 9.8%. The trade is flexibility: a household wanting a different battery later may find itself locked to a narrow compatible list. Installation quality matters less here than anywhere else.
CAGR 14.7%

Parallel-Stackable Modular Inverters

Stackable units combine in parallel to reach ratings a single unit cannot, letting an installer size a system to a customer's present load and add capacity later without replacing anything. That suits shops, clinics, small factories and offices, which previously had to choose between an undersized household product and three-phase equipment priced well beyond them. Spares handling improves too, since one unit type covers many installations. Growth at 12.4% reflects a customer group opening rather than an existing one expanding. Parallel operation demands accurate synchronisation and load sharing, which is where cheaper implementations fail and where the established manufacturers hold a genuine engineering advantage. Spares handling improves considerably alongside it.
CAGR 12.4%
Full segment breakdown across 6 segments available in the complete report.

Regional Architecture and Country Demand Map

Demand follows grid unreliability and electricity tariffs rather than solar resource or income. South Asia and Africa together take more than half this market because that is where households pay for a grid connection and receive power for only part of the day. Solar resource explains nothing.

South Asia and Pacific

Pakistan alone has produced one of the fastest national adoption curves seen in any energy product, growing at 16.8% as tariff increases and currency pressure made household solar with storage pay on plain arithmetic. The region at 30% sits far above the standard band ceiling of 12%, justified by the sheer number of households paying for a grid connection that delivers power for part of the day. Indian demand is large and price-driven, concentrated in states with poor supply reliability. Indonesian and Philippine island demand is genuinely off-grid rather than backup, and buys differently as a result, specifying durability over capacity. Distributor currency access caps purchasing well below actual demand.
Share: 30% | CAGR: 12.0% (2026 to 2036)

Middle East and Africa

Nigerian grid collapse, South African load shedding and Lebanese supply failure have made permanent household solar and storage a mainstream purchase rather than a specialist one, which is why the region sits at 26% against a standard band ceiling of 6%. Buyers here fund systems themselves, size them to run the house rather than preserve a refrigerator, and replace them when they fail. Kenyan and Ghanaian demand is a mixture of genuine off-grid and unreliable-grid buying. Service networks are the binding constraint everywhere, and currency access limits distributor purchasing more than end demand does. Systems here are sized to run the house rather than to preserve a refrigerator, which roughly triples the value of each installation.
Share: 26% | CAGR: 10.2% (2026 to 2036)
Regional intelligence for 5 additional markets available in the complete report: East Asia, Latin America, North America, Western Europe, Eastern Europe. Contact sales@marketmindsadvisory.com.
standalone-pv-inverter-market-country-cagr-analysis-1788412430382

Where Inverter Margin Actually Holds

Four positions carry margin in a category where conversion efficiency has stopped differentiating anything. Each depends on engineering or infrastructure committed before demand arrives in a given market, which is difficult when the markets that matter appear suddenly and for reasons no manufacturer controls. All four have to be committed before the demand actually appears.

Get Onto Every Major Battery Compatibility List

Installers consult battery compatibility lists before comparing price or specification, so an inverter absent from the list of a popular battery is never considered at all. Getting on requires protocol implementation, joint testing and a working relationship with the battery manufacturer, which takes months rather than weeks. Only 62% of shipped units support closed-loop communication natively, so the position is still available. Manufacturers treating this as a firmware task rather than a commercial priority are losing specifications they never learn about. Battery makers control the list, and the relationship has to be earned rather than requested.
Market Impact: Reaches beyond the 62% already supporting closed-loop protocols

Build Remote Diagnostics Before Warranty Costs Bite

Attending a field failure in these markets costs more than the inverter is worth, which is why warranties are so often honoured only nominally. Remote diagnostics and firmware update let a manufacturer correct configuration faults without anyone travelling, and roughly 38% of the installed base is currently reachable that way. That capability converts an unaffordable warranty obligation into a genuine commercial promise competitors cannot match. It has to be designed into the product, since retrofitting connectivity into a shipped installed base is not possible. Competitors treat the same warranty exposure as simply unavoidable.
Market Impact: Serves 38% of the installed base without travel

Hold Regional Stock In Hard Currency Hubs

Distributors in the fastest growing markets struggle to open letters of credit and face devaluation between order and payment, which limits how much they can buy regardless of end demand. Stock held regionally in a hard-currency hub lets them purchase in smaller lots against actual sales, reducing their exposure and roughly halving a 90 day payment cycle. The manufacturer carries inventory risk instead of receivable risk, which is the better of the two. Few competitors are willing to fund it. The manufacturers doing this are buying market access rather than merely funding inventory.
Market Impact: Halves the 90 day distributor payment cycle entirely

Design Stackable Units For Small Commercial Buyers

Shops, clinics and small factories in unreliable-grid markets have been served badly, forced to choose between an undersized household product and three-phase equipment priced far beyond them. Stackable units combining up to 6 in parallel meet that need and let a customer add capacity as load grows. Growth of 12.4% reflects a customer group opening rather than expanding. Accurate load sharing between paralleled units is where cheaper implementations fail, which gives capable manufacturers a defensible engineering position for once. It is the one place in this market where genuine engineering quality is still recognised and paid for.
Market Impact: Combines up to 6 units in one system

Who Controls the Margin Pool

Measured on shipment volume, the basis used throughout this section, the top five hold 44%. Chinese manufacturers supply most of that volume and set pricing in third markets through competition among themselves rather than against anyone else. The gap between the leaders and the rest is battery protocol coverage and distributor depth rather than power electronics, which is mature and widely available to everybody in the industry.
Competition runs on compatibility lists, distributor credit terms and warranty credibility rather than on efficiency figures nobody can verify in the field. European manufacturers hold the premium marine, motorhome and professional off-grid positions on documentation and service, at prices several times the volume market. Chinese producers hold the fast-growing unreliable-grid markets comprehensively, and increasingly compete with each other on connectivity features rather than price alone.

Pressure comes from two directions. Battery manufacturers moving into complete systems threaten to specify the inverter themselves rather than certify several. And the markets carrying most growth depend on grid failure and tariff stress that could ease, which would leave capacity built against demand that evaporates. Rankings shift where manufacturers invested in protocol coverage and remote service rather than chasing unit cost downward.
standalone-pv-inverter-market-company-positioning-matrix-1788412430905

Competitive Moat and Risk Dimensions

DEYE TECHNOLOGY

Moat: Broadest battery protocol coverage

Native closed-loop support across an unusually wide range of battery manufacturers puts the company on compatibility lists competitors are absent from, which decides specifications before price is considered. Manufacturing scale across hybrid architectures keeps cost competitive too. That combination of breadth and cost is difficult to attack, because matching it requires protocol work and volume nobody smaller has.
DEYE TECHNOLOGY

Risk: Concentration in stressed markets

Volume is heavily weighted toward markets whose demand rests on grid failure, tariff shock and currency pressure, all of which can change quickly and none of which the company influences. Distributor receivable risk in those same markets is real. Trade measures aimed at Chinese energy equipment could restrict access to the premium markets that would otherwise diversify that exposure.
GROWATT NEW ENERGY

Moat: Distributor network and connectivity

An extensive distributor network across Africa, South Asia and Latin America gives availability and local presence that matter more than specification in markets where an installer buys what is in stock. Monitoring and remote management built across the product range supports warranty handling where physical service networks do not exist. Volume across grid-tied products spreads development cost widely.
GROWATT NEW ENERGY

Risk: Price competition among Chinese peers

Competition in the fastest growing markets is overwhelmingly between Chinese manufacturers, which compresses pricing without any foreign competitor being involved. Differentiation on connectivity is being matched quickly by peers with similar engineering capability. Reliance on distributor networks in weak-currency markets exposes the company to payment risk that grows exactly when demand is strongest.

Players Tracked

Prominent Players

Deye Technology
Growatt New Energy
Victron Energy
SMA Solar Technology
Studer Innotec

Other Key Players

Voltronic Power
Must Energy
Sol-Ark
Schneider Electric
OutBack Power
Luxpower Tek
Sungrow
GoodWe
Felicity Solar
SRNE Solar
Epever
MPP Solar
Ginlong Technologies
Phocos
Steca Elektronik

Recent Developments

JANUARY 2025

Pakistani solar equipment imports reach record annual levels

National trade statistics recorded solar panel and inverter imports at levels far above any previous year, driven by household and small commercial purchasing rather than by utility projects. Tariff increases and currency pressure were identified as the causes rather than any government incentive programme at all.
Signal: A national adoption wave built entirely on tariff arithmetic that no forecasting model had ever anticipated.
SEPTEMBER 2024

Chinese manufacturer expands hybrid inverter production capacity

A leading Chinese inverter manufacturer commissioned additional hybrid inverter assembly capacity, an organic capacity expansion rather than any acquisition or joint venture. Demand from African and South Asian unreliable-grid markets was cited as the driver, alongside battery-integrated product growth. Capacity was committed well ahead of orders.
Signal: Capacity is being built against demand created by grid failure, which is a genuinely uncomfortable dependency.
APRIL 2025

Battery and inverter makers publish joint compatibility certification

Several battery and inverter manufacturers published a jointly maintained closed-loop communication compatibility programme, a technical collaboration rather than any corporate transaction. The stated aim was reducing installation failures caused by mismatched protocol implementations in the field. Participation was open to any manufacturer meeting the published testing requirements.
Signal: Compatibility lists have quietly become the gate through which every specification in this market now passes.

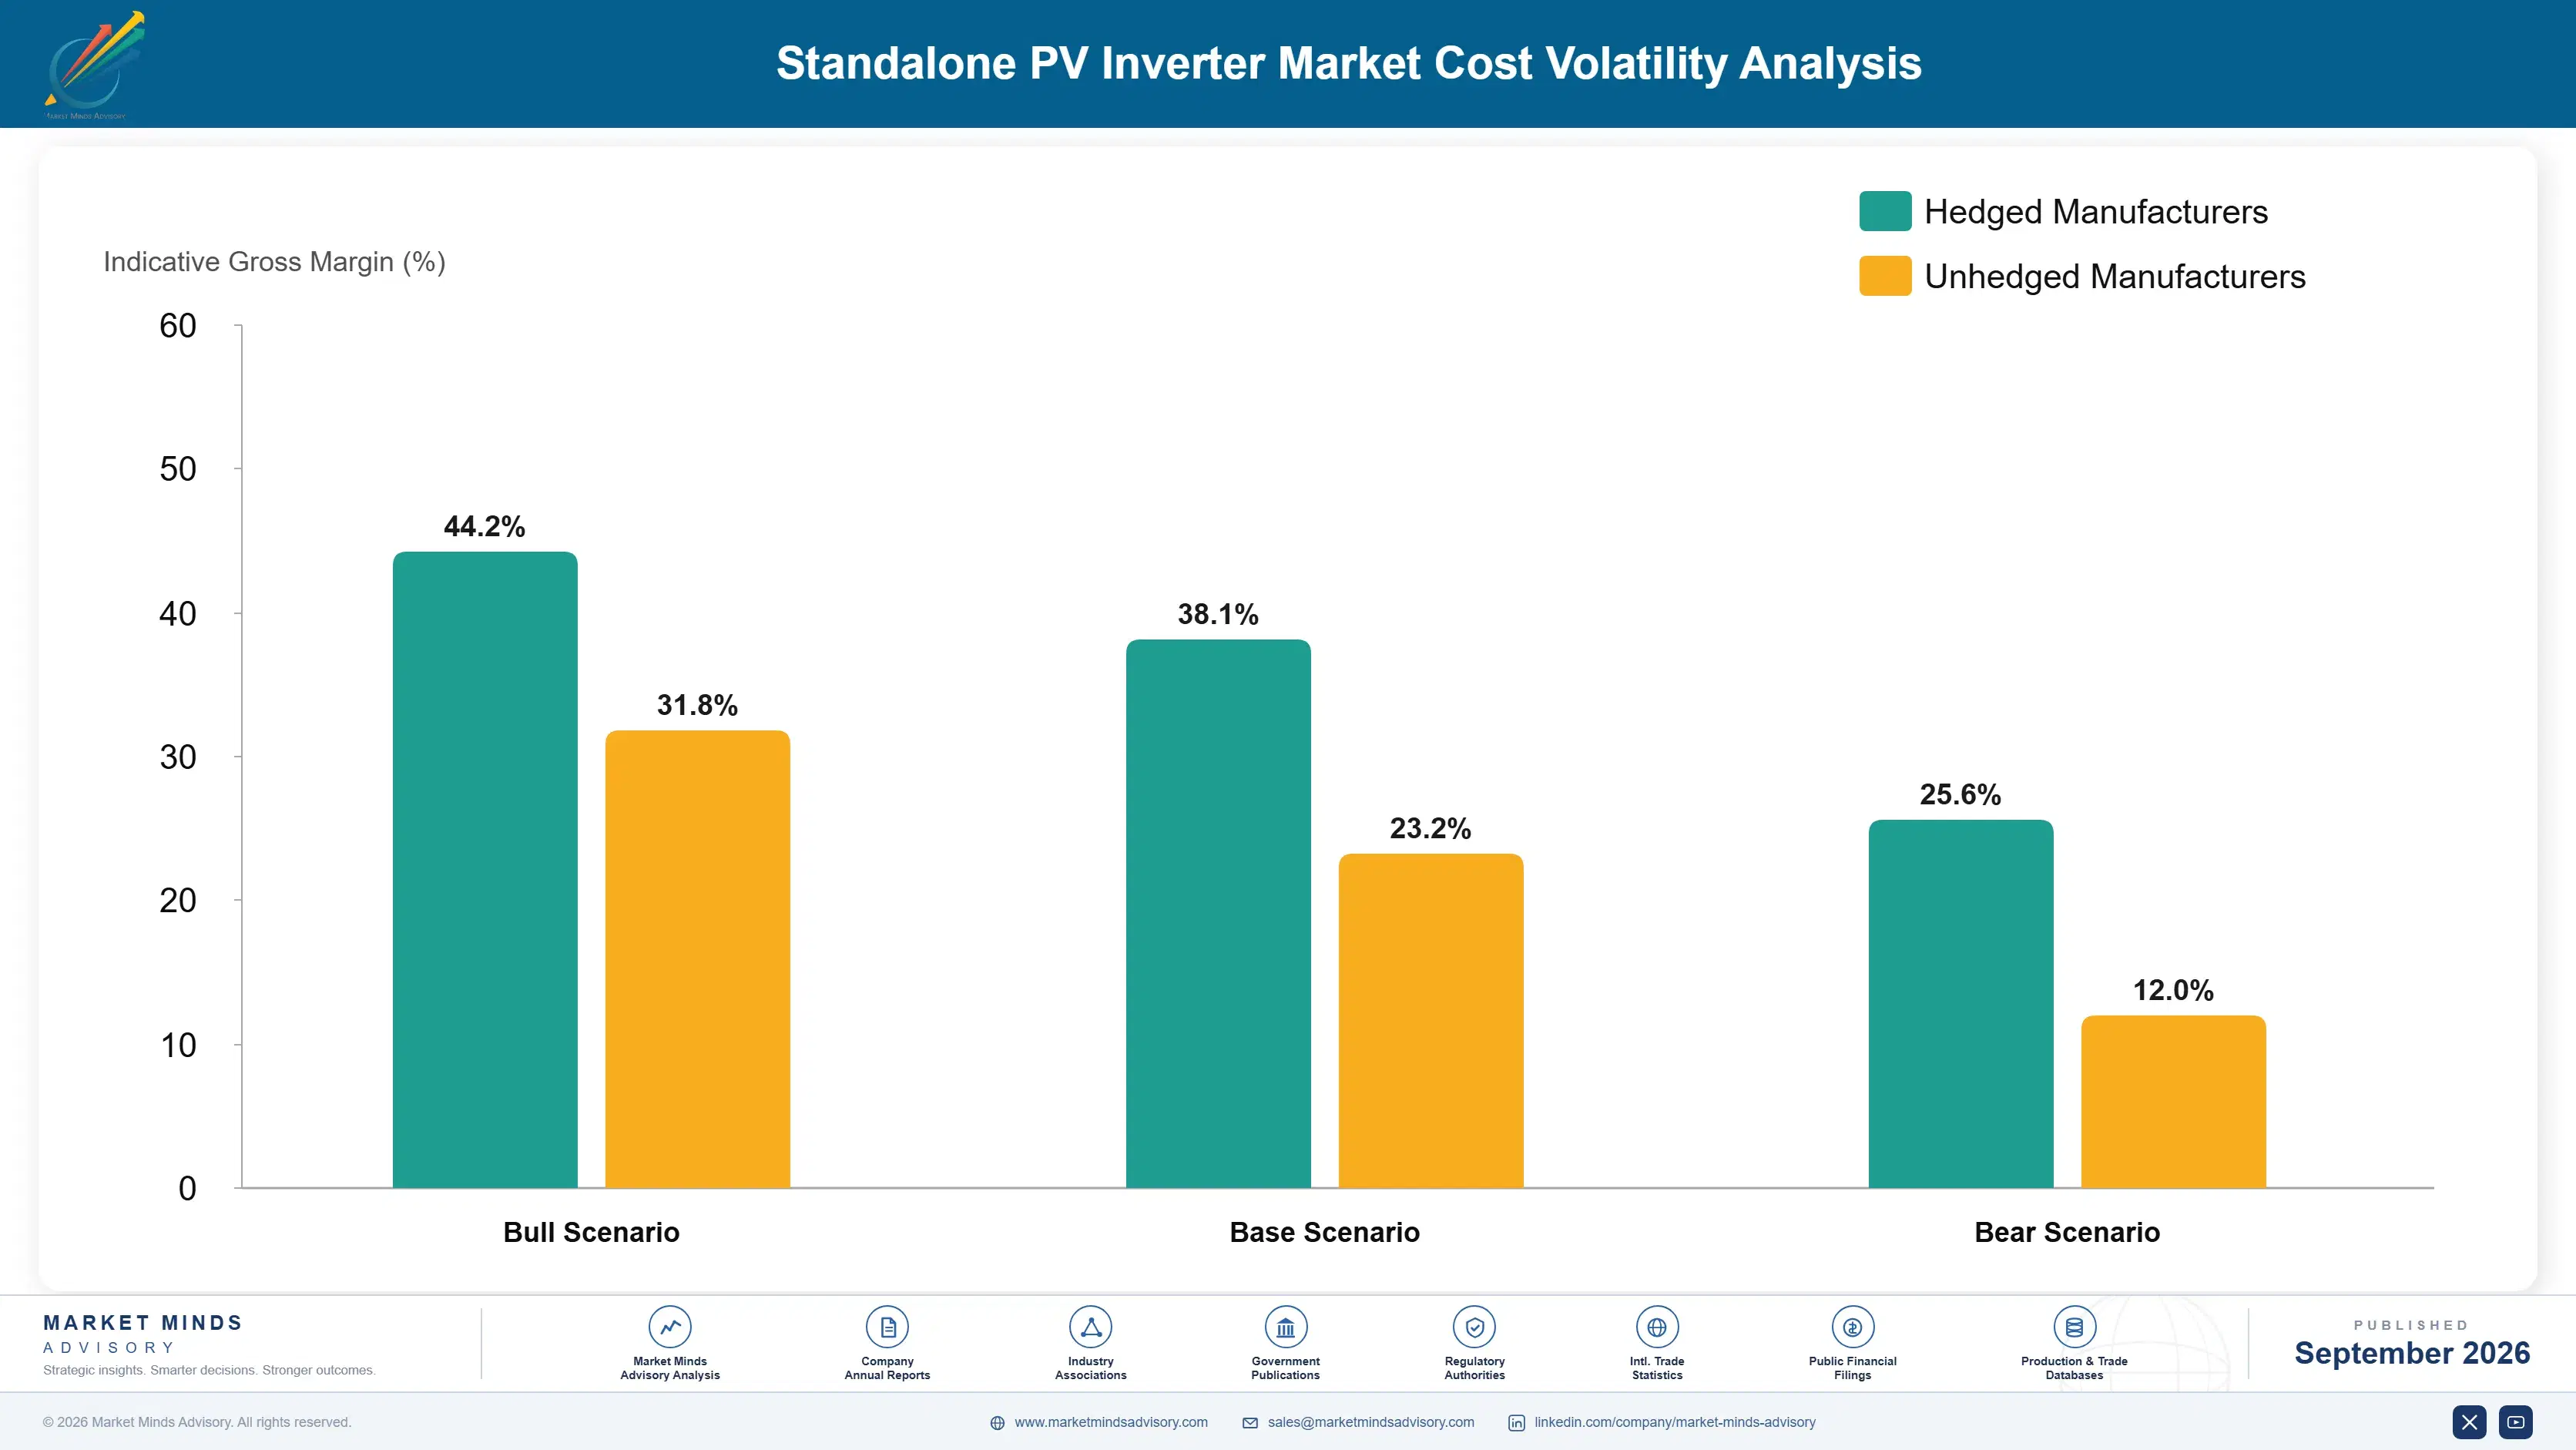
Semiconductors, Magnetics And Capacitors

Power semiconductors account for roughly 24% of manufactured cost, magnetics including copper windings and core material around 21%, electrolytic capacitors near 9%, and enclosure, heatsink and assembly the balance. Semiconductor supply is concentrated across a small number of fabricators and packaging operations, while copper supply concentration is documented by USGS commodity reporting across Chile, Peru and the Democratic Republic of the Congo.
The semiconductor shortage through 2021 and 2022 raised power device lead times to well beyond a year, and SEMI industry reporting documented capacity constraints across the period. Inverter manufacturers redesigned products around whatever devices were obtainable, some of them repeatedly, and several disclosed margin pressure and delivery failures in results covering that window. Copper pricing moved sharply over the same period and compounded the effect on magnetics cost.

The disadvantage mechanism is design flexibility rather than purchasing scale. A manufacturer whose products are qualified across several semiconductor sources can switch when one tightens; one designed around a single device family cannot, and stops shipping. Requalification takes months. Larger manufacturers hold allocation that smaller ones do not, and European producers building lower volumes at higher prices carry the worst of both positions during a shortage.
standalone-pv-inverter-market-cost-volatility-analysis-1788412431099

Multi-source qualification of power devices

Designing and qualifying products across several semiconductor suppliers costs engineering time and board area, and it is exactly what allows a manufacturer to keep shipping when one source tightens. Most companies discover the value of this only during a shortage, by which point requalification takes months they no longer have available. Few fund it in advance.

Long-term allocation agreements with device makers

Committing volume to semiconductor suppliers across multiple years secures allocation during shortages and dampens pricing movement, at the cost of flexibility if demand disappoints. Given how completely a shortage stops production, the flexibility being surrendered is worth considerably less than the certainty being bought. Manufacturers who committed early kept shipping through the last shortage while competitors simply stopped.

Design simplification to reduce component count

Integrating charge control, battery interface and inversion into a single power stage reduces component count, board area and the number of parts that can become unobtainable. It requires more capable control engineering than a modular design does, which is why smaller manufacturers assemble from blocks and carry the exposure that comes with it. Exposure falls accordingly.

Portfolio Architecture for Margin Defence

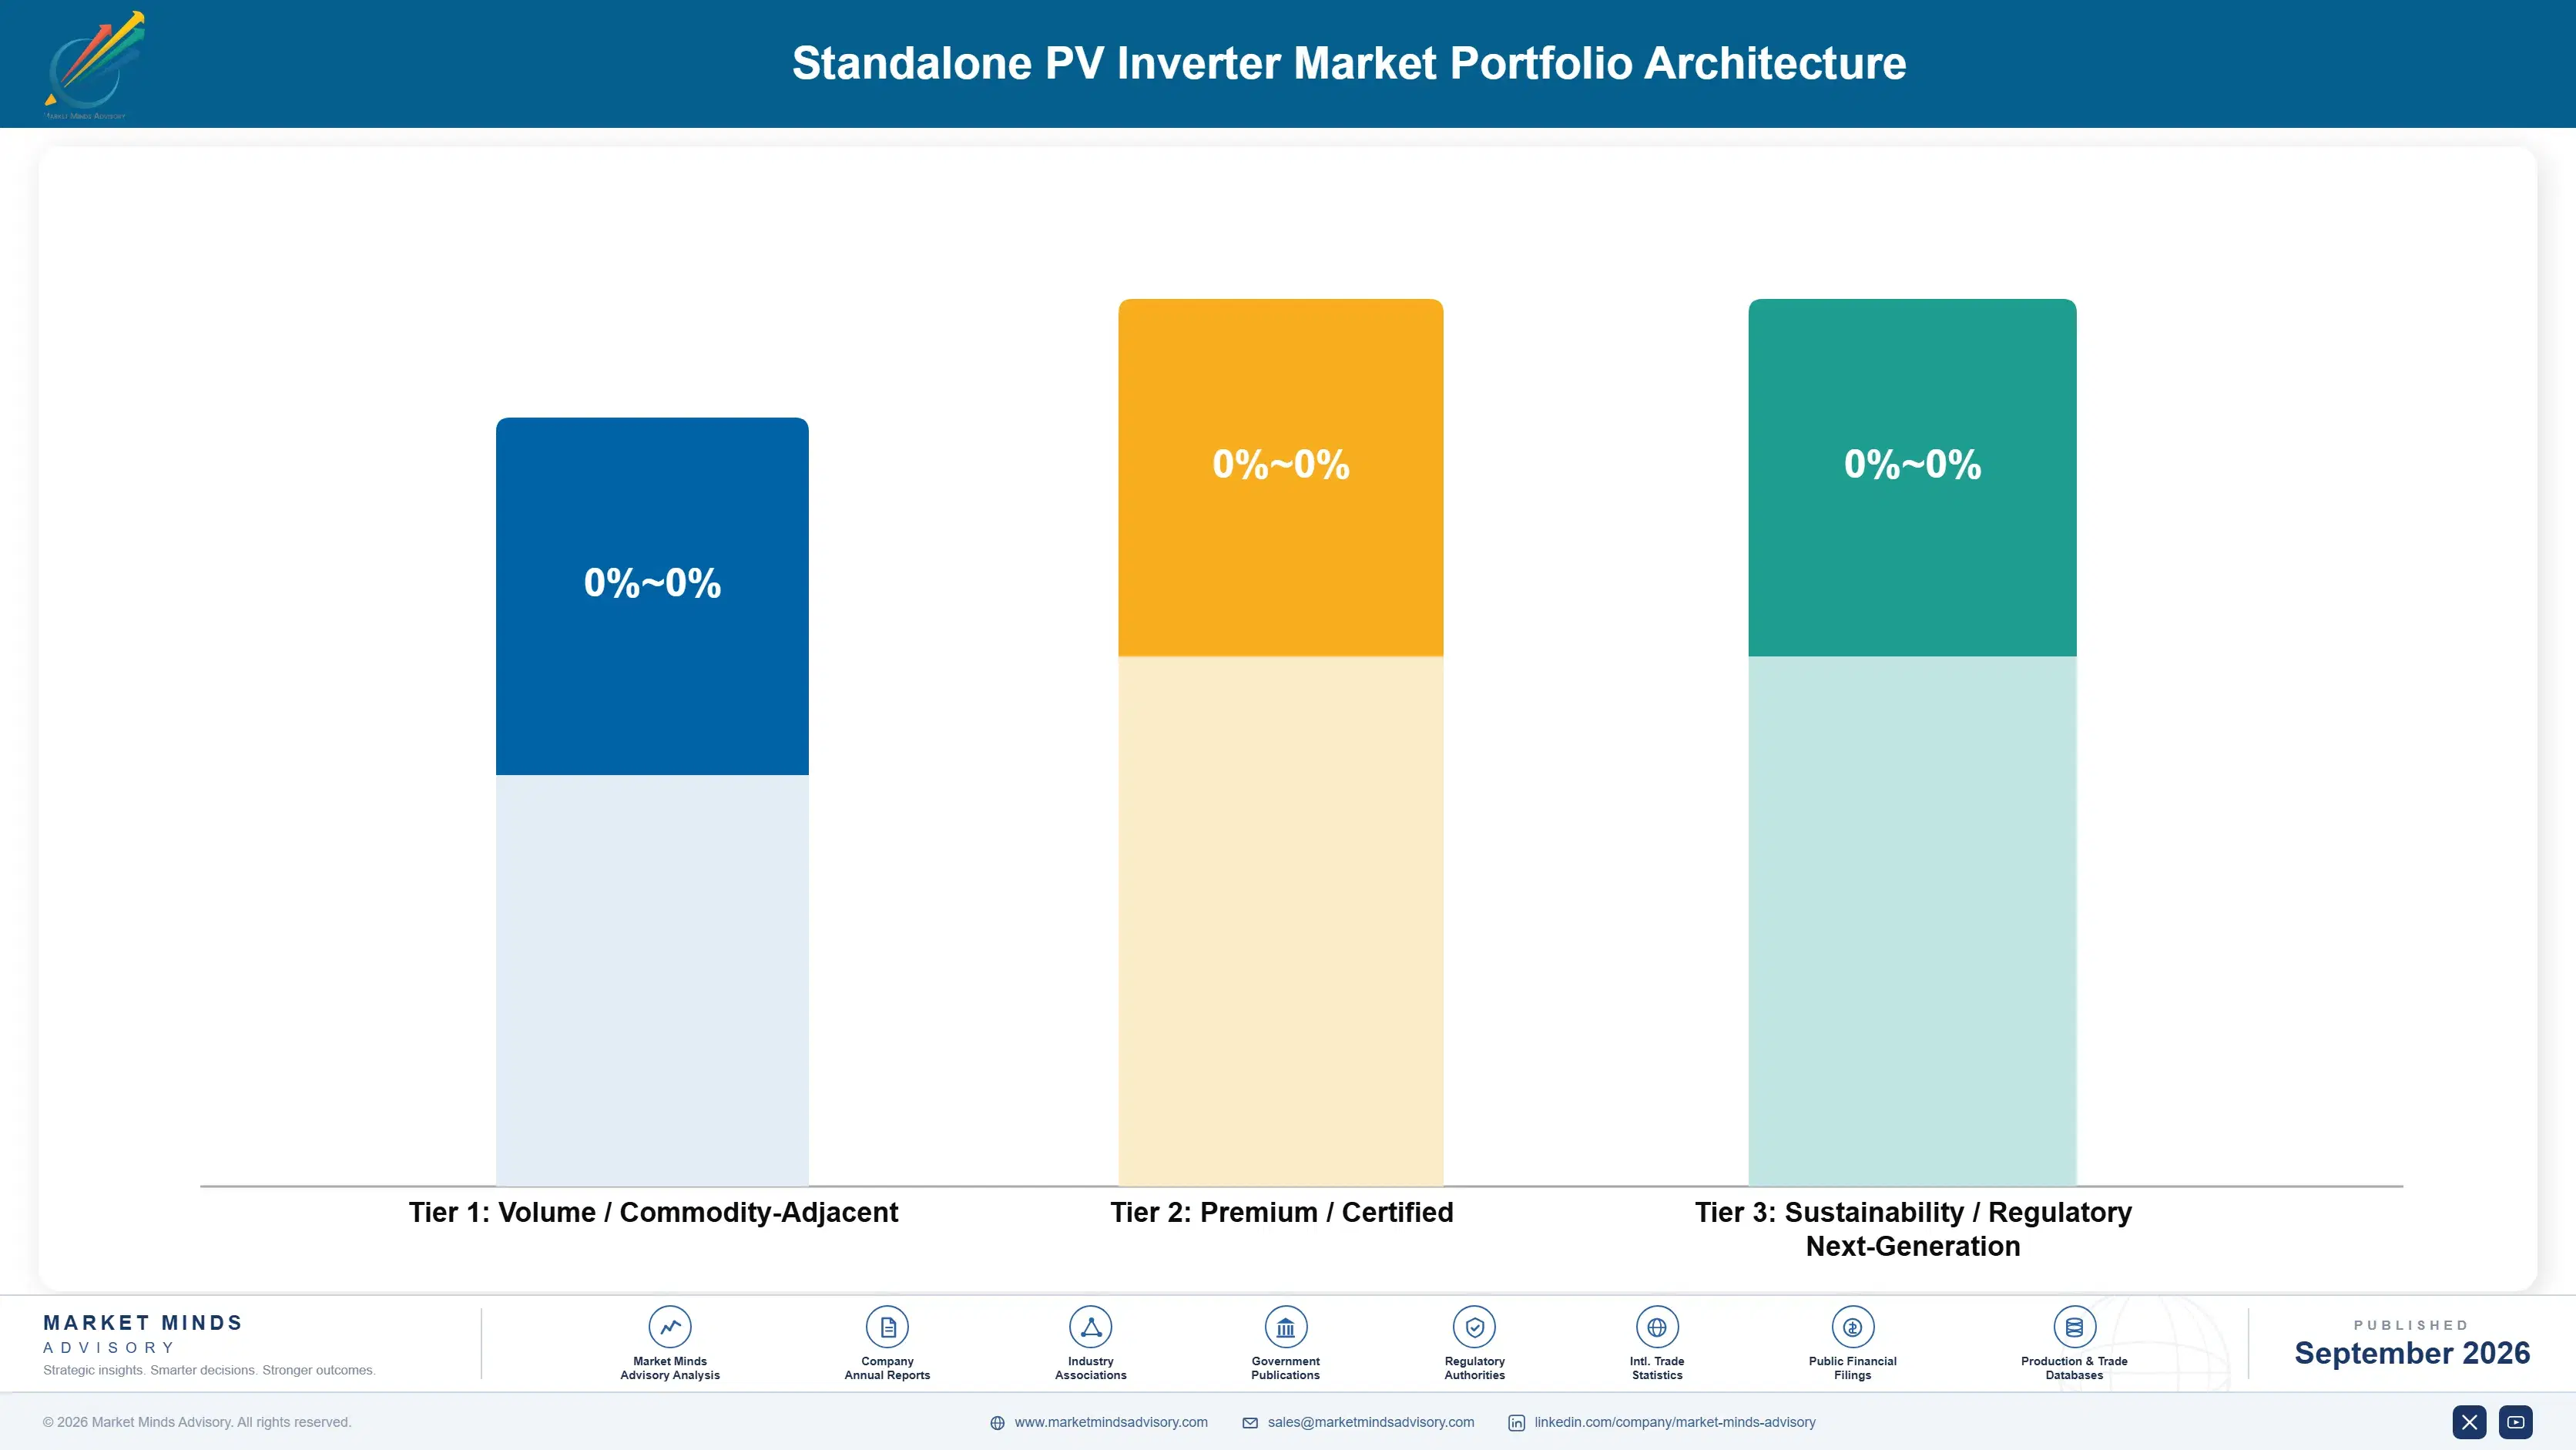
Margin separates by whether the buyer can evaluate the product. In the volume unreliable-grid markets an installer buys what a distributor has in stock and what appears on a battery compatibility list, and pricing is competed down between Chinese manufacturers with similar cost positions. In marine, motorhome and professional off-grid applications the buyer reads documentation, expects support and pays several times as much.
The volume against premium tension here is unusual because the two tiers do not compete at all. Volume production funds the development and the component allocation that premium products also depend on, and nobody reaches meaningful scale in the premium tier alone. But volume margin is thin and its demand rests on grid failure that could ease. Manufacturers using volume cash flow to build protocol coverage and remote service are converting a fragile position into a durable one.

High-value pools sit where capability rather than availability decides: professional off-grid and marine systems, three-phase and stackable small commercial installations, and any product carrying credible remote warranty support. Each requires engineering and infrastructure a low-cost assembler cannot assemble quickly. The pools are small in units and carry a disproportionate share of the industry's profit.

Volume / Commodity-Adjacent

Single-phase household off-grid and hybrid inverters sold through distributors into unreliable-grid markets on price and stock availability. Margin depends on component purchasing and assembly scale rather than on anything an installer values.
Gross Margin: 12 to 18%

Premium / Certified

Professional off-grid, marine and motorhome inverters sold on documentation, service and field reliability. The 8 point range reflects how differently marine and land applications price, and how much support obligation each carries with it.
Gross Margin: 24 to 32%

Sustainability / Regulatory / Next-Generation

Three-phase and stackable small commercial systems, and products carrying credible remote diagnostics and warranty support. The 10 point range reflects how few manufacturers can genuinely deliver remote service in the markets that most need it.
Gross Margin: 27 to 37%
standalone-pv-inverter-market-portfolio-architecture-1788412431591

High-value Sub-segments and Strategic Watch-out

Stackable Small Commercial Systems

Fastest opening pool, serving shops, clinics and small factories that were previously stuck between household and three-phase products. Accurate load sharing between paralleled units is where cheap implementations fail, which protects the position for capable manufacturers. Customers here recognise engineering quality and will pay for it.
Gross Margin: 26 to 34%

Remote-Serviceable Product Lines

Converts an unaffordable warranty obligation into a genuine commercial promise, since attending a field failure costs more than the inverter is worth. Connectivity must be designed in, because it cannot be retrofitted to an installed base afterwards. No volume competitor currently offers this in the markets that need it.
Gross Margin: 28 to 37%

Volume Household Hybrid Inverters

The volume core carrying most units and funding development for everything else, sold on stock availability and compatibility listing. Necessary for scale rather than attractive on returns, and its demand rests on grid failure continuing. Grid improvement anywhere significant would reverse this demand very quickly.
Gross Margin: 12 to 18%

Legacy Lead Acid Inverter-Chargers

Declining steadily as lithium displaces lead acid in household storage and as closed-loop communication becomes the specification requirement. Revenue continues through replacement in existing installations, but no development capital should go here now. Replacement revenue continues for several years, but the specification requirement has already moved on.
Gross Margin: 10 to 16%

How Installers Actually Choose

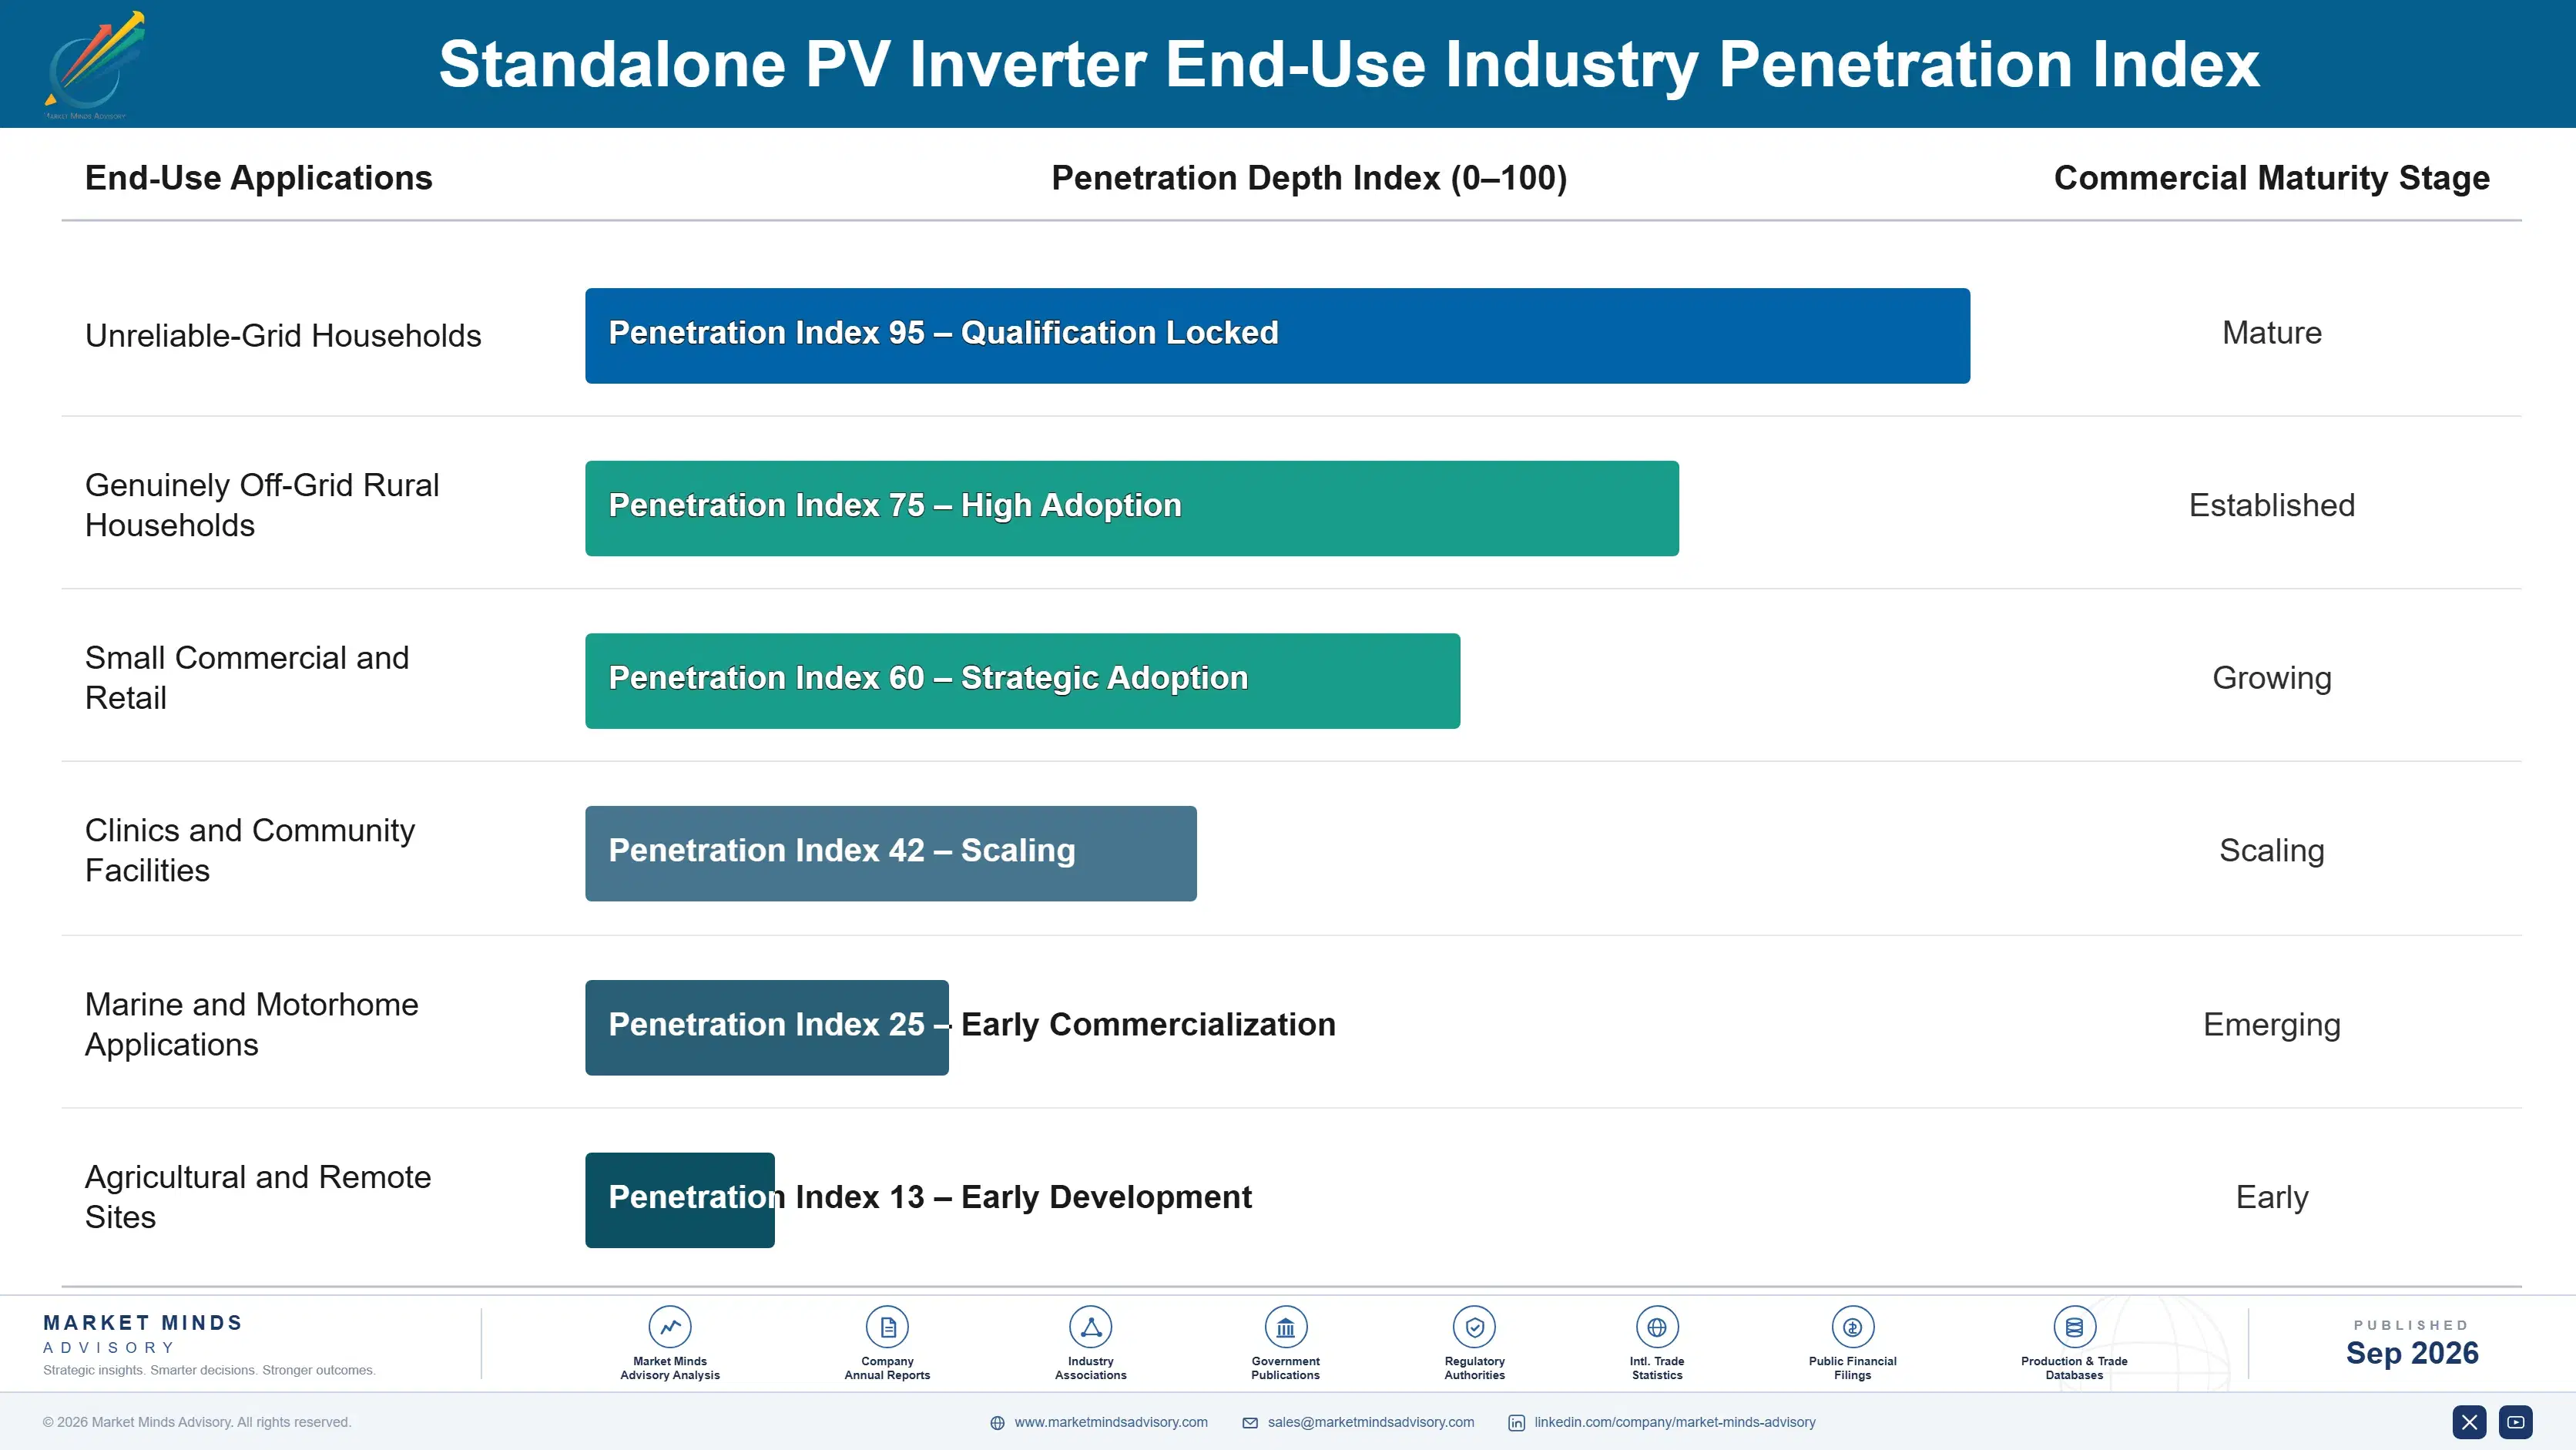
A genuine replacement cycle exists here because these units live around ten years in hard service and are replaced rather than repaired, creating recurring demand without any contract. The replacement decision is made by whichever installer the household calls, choosing from a compatibility list and a distributor's shelf. Manufacturers capture repeat business through the installer, not the household, which is where commercial effort belongs.
Adoption depth varies sharply by market condition. Unreliable-grid households buy a complete system once and judge the manufacturer entirely by whether it still works in three years. Professional off-grid and marine buyers specify deeply, read documentation and expect technical support, and they switch reluctantly. Small commercial buyers sit between the two, buying on capacity and expandability rather than on either price or documentation.

The buyer profile has shifted decisively. This category was once specified by development programme engineers and NGO procurement staff working to donor requirements. It is now bought by urban households spending their own money through local installers, and increasingly by small business owners sizing systems against their actual load. Both groups respond to installer recommendation and to visible reliability rather than to specification sheets they will never read.
standalone-pv-inverter-market-end-use-penetration-index-1788412432078

Where Manufacturers Should Compete

These are among the four positions where our research anticipates prominent divergence between winners and laggards over the coming forecast period. Each is grounded in the demand model, the regulatory perimeter, and the announced capacity pipeline.
01 / PROTOCOL COVERAGE PRIORITY

Treat battery compatibility as commercial, not technical

Installers consult battery compatibility lists before comparing price or specification at all, so an inverter absent from the list of a popular battery is never considered in the first place at all. Getting onto those lists requires protocol implementation and joint testing with the battery manufacturer, which takes months of committed work rather than a single firmware release. Only 62% of shipped units support closed-loop communication natively, so the position remains genuinely available to any manufacturer who moves on it now.
02 / REMOTE SERVICE DESIGN

Build connectivity in before warranty costs arrive

Attending a field failure in the markets carrying this growth costs considerably more than the inverter is worth, which is why warranty promises there are so often honoured only nominally by almost everybody selling there. Remote diagnostics and firmware update convert that unaffordable obligation into a commercial promise competitors operating without connectivity cannot match honestly at all. It has to be designed into the product from the start, because connectivity cannot be retrofitted into an installed base after the units have already shipped.
03 / CURRENCY RISK STRUCTURING

Carry inventory risk rather than receivable risk

Distributors in the fastest growing markets cannot open letters of credit easily and face devaluation between order and payment, which caps their purchasing well below what actual end demand would otherwise support. Regional stock held in a hard-currency hub lets them buy in smaller lots against real sales and roughly halves a 90 day payment cycle. The manufacturer then carries inventory risk instead of receivable risk, which is unambiguously the better of the two exposures for a manufacturer to hold.
04 / DEMAND FRAGILITY HEDGING

Diversify beyond markets built on grid failure

Most of this market's growth rests on grid collapse, load shedding and tariff shock in a handful of countries, none of which any manufacturer influences and all of which could ease within the space of a few years. Capacity and distribution built entirely against that demand would strand very quickly indeed if grid reliability improved. Professional off-grid, marine and small commercial pools are smaller but rest on need that does not disappear when a utility eventually fixes its own generation problem.

Engagement Snapshot From the Field

A live engagement with an industry participant carrying material or product regulatory and market exposure ahead of a defining policy shift, showing how our research translates into a defensible multi-year portfolio strategy.
MARKET MINDS ADVISORY · CLIENT ENGAGEMENT SUMMARY
Standalone PV Inverter Producer Strategic Portfolio Review and Transition Roadmap 2026·Investment Scenario on Standalone PV Inverter Exposure Evaluation 2025-26
CLIENT PROFILE
A European manufacturer of off-grid inverters and power conversion equipment with annual revenue reported at approximately USD 190 million (client-reported, unverified by MMA). The business served marine, motorhome and professional off-grid customers across Europe and North America, selling on documentation and service at prices several times those of the volume market it had never entered.
STRATEGIC CHALLENGE
Management could see enormous volume growth in African and South Asian markets and could not decide whether to pursue it. Entering on price would compete directly against Chinese manufacturers with permanently lower costs, while staying out meant surrendering the fastest growing demand in the category to competitors who would eventually move upmarket.
MMA APPROACH
MMA sized the unreliable-grid demand pool by market and system value, assessed how installers in four countries actually chose between products, and modelled the cost of remote service capability against the warranty exposure it would remove. The client's battery protocol coverage was benchmarked against the compatibility lists installers were consulting.
KEY FINDINGS
  1. Installers in all four markets consulted battery compatibility lists before anything else, and the client appeared on almost none of them despite technically capable products.
  2. Small commercial buyers, rather than households, represented the pool where the client's engineering advantage in parallel load sharing would actually be recognised and paid for.
  3. Remote diagnostics would remove enough warranty exposure to make a credible service promise affordable, which no volume competitor was currently offering in these markets.
  4. Distributor currency constraints, not end demand, capped purchasing in two of the four markets, and regional stock holding would relieve it more effectively than any price reduction.
CLIENT PROFILE
A European manufacturer of off-grid inverters and power conversion equipment with annual revenue reported at approximately USD 190 million (client-reported, unverified by MMA). The business served marine, motorhome and professional off-grid customers across Europe and North America, selling on documentation and service at prices several times those of the volume market it had never entered.
STRATEGIC CHALLENGE
Management could see enormous volume growth in African and South Asian markets and could not decide whether to pursue it. Entering on price would compete directly against Chinese manufacturers with permanently lower costs, while staying out meant surrendering the fastest growing demand in the category to competitors who would eventually move upmarket.
MMA APPROACH
MMA sized the unreliable-grid demand pool by market and system value, assessed how installers in four countries actually chose between products, and modelled the cost of remote service capability against the warranty exposure it would remove. The client's battery protocol coverage was benchmarked against the compatibility lists installers were consulting.
KEY FINDINGS
  1. Installers in all four markets consulted battery compatibility lists before anything else, and the client appeared on almost none of them despite technically capable products.
  2. Small commercial buyers, rather than households, represented the pool where the client's engineering advantage in parallel load sharing would actually be recognised and paid for.
  3. Remote diagnostics would remove enough warranty exposure to make a credible service promise affordable, which no volume competitor was currently offering in these markets.
  4. Distributor currency constraints, not end demand, capped purchasing in two of the four markets, and regional stock holding would relieve it more effectively than any price reduction.
RECOMMENDED STRATEGY
Phase 1: Phase one: complete protocol implementation and joint testing with the four battery manufacturers whose compatibility lists installers in these markets actually consult. Phase 2: Phase two: target small commercial stackable installations rather than households, where parallel load sharing quality is recognised and paid for properly. Phase 3: Phase three: establish regional stock in a hard-currency hub and offer smaller lot purchasing to distributors with constrained foreign exchange access.
OUTCOME
Within thirteen months the client had achieved listing on three major battery compatibility programmes, opened a regional stock position, and reported unit volumes into unreliable-grid markets up 62% from a small base (client-reported, unverified by MMA). Blended margin held despite the lower price points because volume entered through the commercial tier.

Frequently Asked Questions

Foundational context covering the market sizes, CAGR, scope, country, region and competition that inform every finding below. This section is provided to cover basics and most often pre-purchase conversations, answered from the MMA Primary Research Dataset.

What is the current size of the Standalone PV Inverter Market?

The market was valued at USD 3.2 billion in 2025 and reaches USD 3.51 billion in 2026. Most demand now comes from unreliable-grid households rather than genuinely off-grid ones.

How large will the Standalone PV Inverter Market be by 2036?

MMA forecasts USD 8.94 billion by 2036, an increase of USD 5.43 billion over the 2026 base. That represents an expansion multiple of 2.55 times.

What is the CAGR for the Standalone PV Inverter Market 2026 to 2036?

The base case CAGR is 9.8%, with a bull case of 11.0% and a bear case of 8.6%. The historical rate between 2020 and 2025 was 8.6%.

Which segment is growing fastest?

Battery-integrated hybrid inverters grow at 14.7%, half again the market rate of 9.8%. Native closed-loop battery communication is what installers now check before anything else.

Who are the major companies in the Standalone PV Inverter Market?

Deye Technology, Growatt New Energy, Victron Energy, SMA Solar Technology and Studer Innotec lead on measured shipment volume. Together they account for roughly 44% of the market.

Which country is growing fastest?

Pakistan grows fastest at 16.8%, driven by electricity tariff increases and by currency pressure that made household solar with storage pay back on plain arithmetic.

Report Segmentation Architecture

The full report scope spans multiple orthogonal segmentation dimensions, with cross-tabulated demand data provided for each dimension pair. Coverage extends further to regional breakdowns, trend trajectories, and the competitive detail needed to support segment-level decision-making.

By Inverter Architecture

  • Low-Frequency Transformer Inverter-Chargers
  • High-Frequency Transformerless Inverters
  • Battery-Integrated Hybrid Inverters
  • Parallel-Stackable Modular Inverters
  • Three-Phase Standalone Inverters
  • Sub-Kilowatt DC-AC Converters

By End-Use Industry

  • Unreliable-Grid Households
  • Genuinely Off-Grid Rural Households
  • Small Commercial and Retail
  • Clinics and Community Facilities
  • Marine and Motorhome Applications
  • Agricultural and Remote Sites

By Application and Distribution Channel

  • Backup and Load Shedding Supply
  • Full Household Self-Supply
  • Island-Mode Commercial Systems
  • Distributor and Installer Channel
  • Direct Manufacturer Project Supply
  • Programme and Donor Procurement

By Region

  • South Asia and Pacific
  • Middle East and Africa
  • East Asia
  • Latin America
  • North America
  • Western Europe
  • Eastern Europe

Scope, Methodology, and Coverage

Every figure in this report is reproducible from documented input assumptions. The scope below maps the historical period, the forecast horizon, the segmentation dimensions, and the countries covered, alongside the underlying primary and qualitative methodology.
Historical Period
2020 to 2025
Forecast Period
2026 to 2036
Base Year
2025 (USD billions; MMA Primary Research Dataset, September 2026)
Market Definition
The standalone photovoltaic inverter market covers inverters and inverter-chargers that create and hold an alternating current supply independently of any utility grid, spanning low-frequency transformer-based inverter-chargers, high-frequency transformerless off-grid inverters, battery-integrated hybrid inverters, parallel-stackable modular units, three-phase standalone inverters and sub-kilowatt converters. Sizing is measured at manufacturer revenue. Grid-tied string, central and microinverters operating only in parallel with a utility supply, charge controllers, batteries and mounting equipment are excluded.
Quantitative Units
USD billions at manufacturer revenue, with supporting unit shipments and installed capacity in megawatts by region
Segmentation Dimensions
Inverter architecture, end-use industry, application and distribution channel, region
Regions Covered
South Asia and Pacific, Middle East and Africa, East Asia, Latin America, North America, Western Europe, Eastern Europe
Countries Covered
Pakistan, India, Bangladesh, Indonesia, Philippines, Nigeria, Kenya, Ghana, South Africa, Egypt, Lebanon, China, Japan, Brazil, Dominican Republic, Mexico, United States, Germany
Key Companies Profiled
Deye Technology, Growatt New Energy, Victron Energy, SMA Solar Technology, Studer Innotec, Voltronic Power, Must Energy, Sol-Ark, Schneider Electric, OutBack Power, Luxpower Tek, Sungrow, GoodWe, Felicity Solar, SRNE Solar, Epever, MPP Solar, Ginlong Technologies, Phocos, Steca Elektronik
Quantitative Methodology
Primary survey, n=3,800 respondents, Q4 2025, six countries; demand-side model with trade association cross-validation
Qualitative Methodology
47 expert interviews, Q4 2025; applied to validate demand model assumptions, identify emerging dynamics, and assess competitive positioning
Report Format
PDF and XLSX data workbook (Word format preview document)
Publisher
Market Minds Advisory
Report Code
MMA-2026-ENE-551
Published
September 2026
Contact
sales@marketmindsadvisory.com | www.marketmindsadvisory.com

Purchase the full Standalone PV Inverter Market Report (2026 to 2036).

The full report separates unreliable-grid demand from genuinely off-grid demand throughout, which is the distinction that explains why this category grew when rural electrification programmes stopped expanding. It sizes six inverter architectures with individual growth rates, seven regions built from grid reliability and tariff levels, and the battery protocol coverage that now decides specifications. Competitive analysis covers twenty manufacturers on a consistent shipment volume basis, with compatibility listing and remote service capability treated as the decisive variables. Input cost modelling breaks out semiconductor, magnetics and capacitor exposure by design flexibility.
Six inverter architectures with individual growth rates
Unreliable-grid and off-grid demand sized separately
Battery protocol coverage mapped across shipped units
Remote service reach and warranty cost modelling
Twenty manufacturers on consistent shipment volume basis
Semiconductor and magnetics cost exposure analysis

Built For The People Who Decide

From boardroom strategy to bench-side execution, this report is read cover-to-cover by leaders shaping the next decade of their industry, turning demand scenarios, market dynamics and valuation benchmarks into decisions.
CXOs/ Presidents/ VPs/ Managers
M&A and Corporate Development
Strategy Teams and R&D Heads
Procurement and Product Directors
Regulatory and Compliance Leaders
Investor Relations and Equity Analysts