Market Minds Advisory
Stainless Steel Market

Stainless Steel Market: Stainless Steel: A Nickel Position With a Steel Mill Attached

Alloy surcharges hand the nickel price straight to the customer, so mills earn a conversion spread and carry the working capital, which means a metal rally creates a cash problem rather than a profit.

Lead Analyst

Bilal Shaikh

Published

September 2026

Make Smarter Decisions with Customized Research Insights

Request a free sample report and evaluate market opportunities, growth trends, and competitive dynamics relevant to your business needs.

2025 MARKET VALUE$128.0BMarket Size 2025
2036 FORECAST VALUE$201.3BBase Case , 2026 to 2036
CAGR 2026 TO 20364.2 %Bull 5.4% / Bear 3.0%
INCREMENTAL OPPORTUNITY$67.9BNet 10- year value creation
EXPANSION MULTIPLE1.51x2036 value over 2026 base
Strategic Levers
M&A Pipeline
Regional Outlook
Country Rankings
Competitive Intelligence
Segmental Deep-dive
Call-Us : 91 93563 13602

Executive Snapshot and Market Trajectory.

Mills here do not sell steel so much as convert somebody else's nickel. Alloy surcharges pass metal cost to the customer with a lag near 60 days, which leaves the producer earning a conversion spread while carrying the working capital on an input it does not control.
Indonesia rewrote the cost curve inside a decade. Nickel pig iron fed directly into stainless melting took the country from negligible exports to roughly eleven times its former volume, which restructured global trade flows and triggered defensive measures almost everywhere. That single development explains more about current pricing and capacity decisions than any demand forecast ever will. Every capacity decision now starts from that cost curve.
Quality has quietly bifurcated too. Manganese substituted 200-series grades now account for around 21% of world output, bought on price in applications where the corrosion performance gap is real but not immediately visible. Duplex grades grow fastest at 6.3% at the other end, where nickel content is lower and strength is higher, which is a rather better answer to the same problem. Both answer the same nickel exposure from opposite ends. Both are gaining share.
Market Definition
Stainless steel produced in flat and long product form across all alloy families, covering 300-series austenitic, 400-series ferritic, 200-series austenitic, duplex and super duplex, martensitic and precipitation hardening, and super austenitic and high alloy grades. Measured at mill selling value including alloy surcharge. Excludes nickel alloys without iron base, carbon and alloy steels, stainless castings, welding consumables, and downstream fabrication or distribution services.
Base Year Value
$128.0B in 2025 (MMA Primary Research Dataset, August 2026)
Forecast Period
2026 to 2036, eleven discrete annual values
CAGR
4.2% base case. Bull 5.4%. Bear 3.0%.
Fastest Growth Segment
Duplex and Super Duplex: 6.3% CAGR
Fastest Growth Country
India: 8.4% CAGR
Fastest Growth Region
South Asia and Pacific: 6.4% CAGR
Largest Region
East Asia: 46% of 2025 global value
Market Leaders
Tsingshan Holding Group, TISCO, Outokumpu, POSCO, Acerinox. Source: MMA Primary Research Dataset, July 2026.
Primary Survey
n=3,800 procurement and R&D decision-makers, Q4 2025, six countries
Methodology
Demand-side build-up, cross-validated against public data, 47 expert interviews

Stainless Steel Market Forecast Scenarios

stainless-steel-foil-market-trends-size-forecast-scenario-1787595359601
Growth ran near 3.4% between 2020 and 2025 in value terms, and tonnage grew faster than value as Indonesian and Chinese capacity pressed on conversion spreads. The 2022 nickel squeeze demonstrated that the hedging mechanism underpinning alloy surcharges can itself fail, which left mills exposed on positions they had believed were covered. Trade defence measures multiplied across the period in response to redirected export flows.
Base case 4.2% rests on three mechanisms. Duplex and super duplex grades grow at 6.3% as designers substitute for 316 on strength and reduced nickel content in chemical, marine and infrastructure applications. India grows fastest of any country at 8.4% on construction, transport and consumer durable demand from low consumption per head. And carbon border pricing begins separating scrap based production from nickel pig iron integrated routes commercially. Trade measures shape where each of those lands.
The bull case at 5.4% assumes carbon border adjustment pricing biting hard enough that low emission scrap based supply commands a genuine premium rather than a marketing claim. The bear case at 3.0% is continued capacity expansion outrunning demand growth, compressing conversion spreads to a level where higher cost European and North American capacity closes rather than competes.

Conversion Spread, Not Metal Margin

The most useful thing to understand about a stainless mill is that it barely sells steel. Alloy surcharges hand nickel, chromium and molybdenum cost straight to the customer, so the producer earns a conversion spread on top of metal it has merely passed through. Alloy is around 62% of austenitic grade cost and the recovery lag runs near 60 days, so a nickel rally produces a working capital problem rather than a profit.
TOP FIVE CONCENTRATION39%Capacity remains widely spread despite two decades of consolidation
ALLOY SHARE OF COST62%Metal input portion of austenitic grade production cost
RECYCLED INPUT RATE42%Recycled scrap content across world stainless steel production
SURCHARGE RECOVERY LAG60 daysDelay between alloy purchase and customer surcharge recovery
INDONESIAN EXPORT EXPANSION11xGrowth in exported output across the past decade
MANGANESE GRADE SHARE21%Substituted grades as a portion of world output
Indonesia changed the industry's economics more than any demand shift has. Feeding nickel pig iron directly into stainless melting removed a refining step and produced a cost position established producers could not answer, taking exports up roughly elevenfold within a decade. Trade defence measures followed across Europe, North America and India, redirecting flows rather than removing capacity, and the cost advantage remains intact.
Underneath the trade argument, what counts as stainless has diverged. Manganese substituted 200-series grades hold around 21% of world output, bought on price where reduced corrosion performance will not show up for years. Duplex grades answer the same nickel cost problem from the opposite direction, delivering higher strength at lower nickel content, and they grow fastest at 6.3% as a result.
"Every downturn produces the same conversation about consolidation, and every recovery produces new capacity somewhere with cheaper metal. The mills that survive are the ones that treated the alloy surcharge as a financing problem rather than a pricing mechanism, which is a much less comfortable thing to explain to a board."
Director, Steel and Specialty Alloys Practice · MMA Chemicals and Materials Practice · August 2026

Market Trends

Nickel pig iron integration resetting the global cost curve

Feeding nickel pig iron directly into stainless melting removes a refining step and delivers a cost position that established producers buying refined nickel cannot answer through operating improvement. Indonesian exports grew roughly elevenfold across a decade on that basis, and trade defence measures across Europe, North America and India have redirected the flows without touching the underlying advantage. Capacity decisions everywhere now start from that cost curve rather than from any assessment of regional demand growth. Established producers buying refined nickel are competing against a metallurgical route rather than against a more efficient operator, which is a fundamentally different problem.
Market Impact: India growing fastest at 8.4%
Duplex substitution answering nickel cost through metallurgy

Duplex grades deliver roughly twice the yield strength of 316 at materially lower nickel content, which lets a designer reduce section thickness and alloy exposure at the same time. Growth at 6.3% comes from chemical processing, marine structures, desalination and infrastructure where both strength and corrosion performance matter. Adoption is limited by fabrication familiarity rather than by cost or availability, since welding and forming duplex demands discipline that many fabricators have never had to develop. Mills providing welding procedure support convert specifications that would otherwise revert to 316 at fabrication stage, which is where adoption is actually lost.
Market Impact: Scrap already supplies 42%

Market Opportunities and Growth Drivers

Indian consumption rising from low levels per head

India grows fastest of any country at 8.4%, with construction, railway rolling stock, process industry and consumer durable demand all expanding from consumption per head far below developed market levels. Domestic capacity has expanded alongside it, though import competition from Indonesian and Chinese supply has driven repeated trade defence action. The grade mix skews toward 200-series and ferritic material on price, which shapes what domestic mills invest in rather more than any technical preference does. Consumption per head remains far below developed market levels, which leaves considerable room ahead. That runway is unusually long.
Market Impact: Runs roughly 60 days behind

Carbon border pricing separating scrap based production commercially

Scrap based electric arc furnace production carries a fraction of the embedded emissions of nickel pig iron integrated routes, and recycled input already accounts for around 42% of world stainless output. Carbon border adjustment mechanisms turn that difference into a delivered cost variable for the first time rather than a sustainability claim. European producers with high scrap rates gain a defensible position, provided the mechanism is enforced consistently enough for buyers to price it properly. Producers holding the position have generally not quantified or communicated it to the compliance functions that would actually value it.
Market Impact: Manganese grades hold 21% share

Market Restraints and Challenges

Alloy surcharge recovery lag consuming working capital

Alloy carries around 62% of austenitic grade cost and surcharge recovery runs roughly 60 days behind purchase, which means every nickel rally forces mills to fund a growing metal position out of their own balance sheets. The root cause is the surcharge mechanism itself, designed to protect margin rather than cash. Commercially it punishes exactly the producers whose order books are growing. Hedging and inventory discipline are the mitigations, and 2022 showed the hedging route can fail outright. Shortening the surcharge cycle attacks the cash rather than the margin. Cash rather than margin is what fails first.
Market Impact: Exports grew roughly 11 times

Persistent overcapacity compressing conversion spreads globally

Capacity additions in China and Indonesia have consistently outrun demand growth, and conversion spreads have compressed to levels where higher cost producers cover fixed costs rather than earn returns. The root cause is that capacity decisions follow metal cost position rather than regional demand. Commercially it drives the trade defence cycle that now shapes flows everywhere. Product mix shift toward duplex and high alloy grades is the mitigation, since those spreads have compressed considerably less. Operating improvement recovers nothing that capacity expansion has already taken away from the spread. Mix shift is the only defence still available.
Market Impact: Delivers 2 times yield strength
3 additional market trends, 4 additional growth drivers, and 2 additional restraints and challenges are covered in the full report. Contact sales@marketmindsadvisory.com to access the complete intelligence.

Segment CAGR and Growth Architecture

Six segments are split by alloy family, because alloy family determines the metal cost exposure, the corrosion and mechanical performance available, the applications a grade can serve and the conversion spread a mill can realistically earn. Product forms and finishes sit inside each family. End-use industry and channel are handled separately in the framework.
stainless-steel-foil-market-trends-market-share-analysis-1787595360174

Duplex and Super Duplex

Growing at 6.3%, half again the market rate of 4.2%, duplex grades combine austenitic and ferritic structure to deliver roughly twice the yield strength of 316 at materially lower nickel content, which reduces both section thickness and alloy exposure for the designer. Chemical processing, marine structures, desalination, offshore and infrastructure applications drive the demand. Adoption is limited by fabrication familiarity rather than availability, since welding and forming demand heat input discipline many fabricators have never developed. Conversion spreads here have compressed far less than on commodity austenitic grades, which makes the mix shift attractive to mills. Mills providing welding procedure support and fabrication training convert specifications that would otherwise revert to conventional austenitic material.
CAGR 6.3%

Super Austenitic and High Alloy

At 5.8% these highly alloyed grades containing elevated molybdenum, nickel and nitrogen serve chemical processing, flue gas desulphurisation, seawater handling and pharmaceutical applications where standard austenitic grades pit or crevice corrode within an unacceptable service life. Metal content is high and so is the conversion spread, because relatively few mills hold the melting and processing capability required to make them consistently. Demand follows capital project cycles in process industries rather than general industrial activity, which makes it lumpy but considerably more defensible than commodity grade supply. Project specifications name these grades explicitly years before purchase, which means the commercial work happens with process and materials engineers rather than through any distribution channel or purchasing conversation at all.
CAGR 5.8%
Full segment breakdown across 6 segments available in the complete report.

Regional Architecture and Country Demand Map

East Asia holds 46% of value on Chinese production and consumption at a scale no other region approaches. North America follows at 15% and Western Europe at 14%, both well below their usual bands given that concentration. South Asia and Pacific also exceeds its band on Indian demand.

North America

Share sits at 15%, below the standard band, because Chinese production and consumption dominate this market to a degree few industries match. Regional mills run high scrap rates through electric arc furnaces, which delivers both cost stability and a low embedded emissions position that carbon pricing would reward. Demand runs to food processing, chemical, architectural and automotive exhaust applications. Trade defence measures shape import flows heavily. Growth at 3.4% reflects mature consumption per head with substitution toward ferritic grades continuing steadily. Carbon border pricing would reward the scrap position these mills already hold, though it has not yet been quantified or communicated to customers in any systematic way. Substitution toward ferritic grades continues.
Share: 15% | CAGR: 3.4% (2026 to 2036)

Western Europe

At 14% the share falls below the standard band for the same reason, since East Asian scale compresses every other region's proportion. European producers hold the highest scrap input rates anywhere and would gain most from consistently enforced carbon border pricing, the clearest defence available against imported nickel pig iron based material. Demand skews toward high specification chemical, pharmaceutical and process industry grades. Growth of 2.6% is the slowest anywhere on mature consumption and persistent import pressure. Industrial electricity costs remain the principal burden, sitting awkwardly beside an emissions position that only pays if carbon rules are enforced. Consumption has been broadly flat for years, which leaves grade capability and emissions position as the only arguments regional mills hold.
Share: 14% | CAGR: 2.6% (2026 to 2036)
Regional intelligence for 5 additional markets available in the complete report: East Asia, South Asia and Pacific, Latin America, Middle East and Africa, Eastern Europe. Contact sales@marketmindsadvisory.com.
stainless-steel-foil-market-trends-country-cagr-analysis-1787595360696

Four Moves on a Compressed Spread

Conversion spreads have compressed for two decades and no amount of operating improvement recovers what capacity expansion took away. The moves that matter change what a mill makes, how it funds the metal it carries, and whether the emissions position it already holds gets paid for by anybody at all. All three are within reach.

Shift mix toward duplex and high alloy grades

Duplex grows at 6.3% and super austenitic at 5.8%, and conversion spreads on both have compressed far less than on commodity austenitic product because relatively few mills hold the melting and processing capability. Moving even 10% of tonnage into those families changes mill economics more than any efficiency programme available. The constraint is fabricator familiarity rather than demand, which technical support and welding training address directly. Welding procedure support and fabrication training cost very little against the tonnage they move, and they attack the constraint where it actually sits. The tonnage moves quietly.
Market Impact: Moves 10% of tonnage into better spreads directly

Treat the alloy surcharge as a financing problem

Alloy at around 62% of austenitic cost with roughly 60 days of recovery lag means every nickel rally forces mills to fund a growing metal position from their own balance sheet, and growth makes it worse rather than better. Shortening the surcharge cycle, tightening inventory turns and holding disciplined hedge positions address cash rather than margin. The 2022 squeeze showed hedging alone is not sufficient protection. Growth worsening the cash position is the opposite of how most producers plan, and it catches boards by surprise every cycle. Inventory turns matter as much as hedging.
Market Impact: Addresses the 60 day surcharge recovery lag directly

Price the scrap based emissions position explicitly

Scrap already supplies around 42% of world stainless input and European and North American mills run far above that, which delivers embedded emissions a fraction of nickel pig iron integrated routes. Carbon border pricing makes that a delivered cost variable rather than a claim. Documenting and pricing it reaches sustainability and compliance functions holding budgets that procurement never sees, and the position cannot be replicated by an integrated competitor. An integrated nickel pig iron competitor cannot replicate the position at any capital cost. Sustainability and compliance functions hold budgets that purchasing teams never see or control at all.
Market Impact: Builds on the 42% scrap input across production

Support fabricators rather than selling through distribution

Duplex adoption is limited by welding heat input discipline and forming practice rather than by price or availability, which means the constraint sits with the fabricator and not the specifier. Mills providing welding procedure support and fabrication training convert specifications that would otherwise default to 316 at higher nickel cost. That support costs a fraction of one percent of revenue and moves tonnage into the grades where spreads still exist. Specifications lost at the welding bench are lost quietly, and most mills never learn that it happened. Nobody reports a specification that quietly reverted.
Market Impact: Costs under 1% of annual mill revenue overall

Who Controls the Margin Pool

Participation is measured on annual crude stainless melting capacity, and the top five hold 39%. Concentration remains modest despite two decades of consolidation talk, because capacity keeps being added where metal cost is lowest rather than where existing producers sit. Tsingshan Holding Group leads on capacity by a wide margin, and the gap to established producers is nickel access rather than any deficit in metallurgical capability. Capacity follows metal cost rather than existing footprints.
Competition runs on three fronts. Metal cost position decides commodity grade economics almost entirely, which is where nickel pig iron integration reset everything. Grade capability decides access to duplex and high alloy families where spreads survive. And trade measures decide which markets a producer can actually reach, regardless of cost. Fabrication support has become a fourth front, because duplex specifications are lost at the welding bench rather than at the specification stage.

Pressure ahead comes from carbon border pricing potentially rewarding scrap based routes, and from continued capacity expansion compressing commodity spreads further. Expect European and North American producers to defend on emissions and grade capability. Rankings shift on whether carbon mechanisms are enforced consistently enough to price. Concentration is unlikely to rise much either way.
stainless-steel-foil-market-trends-company-positioning-matrix-1787595361221

Competitive Moat and Risk Dimensions

TSINGSHAN HOLDING GROUP

Moat: Nickel pig iron melting integration

Integrating nickel pig iron production directly into stainless melting removes a refining step and delivers a metal cost position that producers buying refined nickel cannot answer through any operating improvement. That integration required control of both mining and melting assets in the same location, which is a decade of investment rather than a process choice available to competitors.
TSINGSHAN HOLDING GROUP

Risk: Trade defence market access

Cost advantage matters only in markets a producer can actually reach, and trade defence measures across Europe, North America and India have restricted access to exactly the markets paying the highest prices. That exposure is political rather than commercial, and carbon border pricing would compound it by penalising the emissions profile that integration route carries.
OUTOKUMPU

Moat: High scrap and grade capability

Running scrap input well above the world average of 42% delivers both cost stability and embedded emissions a fraction of integrated nickel pig iron routes, which carbon border pricing converts from a claim into a delivered cost advantage. Combined with duplex and high alloy melting capability, it positions the business where conversion spreads have compressed least across the industry.
OUTOKUMPU

Risk: European energy and demand exposure

European industrial energy costs and mature regional demand both weigh on a business concentrated in the slowest growing major market, where consumption has been broadly flat for years. The emissions advantage only pays if carbon border mechanisms are enforced consistently, which is a policy outcome the company cannot influence or reliably forecast.

Players Tracked

Prominent Players

Tsingshan Holding Group
TISCO
Outokumpu
POSCO
Acerinox

Other Key Players

Aperam
Jindal Stainless
Nippon Steel Stainless
JFE Steel
Baosteel Desheng
Yieh United Steel
Walsin Lihwa
Viraj Profiles
Marcegaglia
Ugitech
Sandvik
ArcelorMittal
Hyundai Steel
Delong Holdings
Tsingtuo Group

Recent Developments

FEBRUARY 2026

Carbon border pricing begins applying to imported stainless flat product

Carbon border adjustment reporting moved into financial application for imported stainless flat product, converting embedded emissions from a disclosure requirement into a delivered cost variable. Producers running high scrap rates gained a measurable position against integrated imports. Import pricing adjusted within the first quarter. Buyers began requesting emissions documentation.
Signal: Emissions intensity becomes a price variable only when a mechanism actually charges for it for that material
AUGUST 2025

Trade defence measures extended against redirected stainless export flows

Trade defence measures were extended against stainless flat product after export flows redirected into markets left open by earlier measures elsewhere. The action changed where material landed rather than removing any of the capacity that produced it in the first place. Producers in the newly affected markets sought further action.
Signal: Trade measures redirect flows without touching the underlying cost position that created them anywhere at all
NOVEMBER 2025

Desalination project specifies super duplex over conventional austenitic

A large seawater desalination project specified super duplex grades in place of conventional austenitic material, citing chloride pitting resistance and reduced section thickness at lower nickel content. Fabricator welding qualification rather than material availability set the project timetable. Welding procedure qualification took several months to complete.
Signal: Duplex adoption is constrained by fabrication capability rather than by price or supply in most project cases

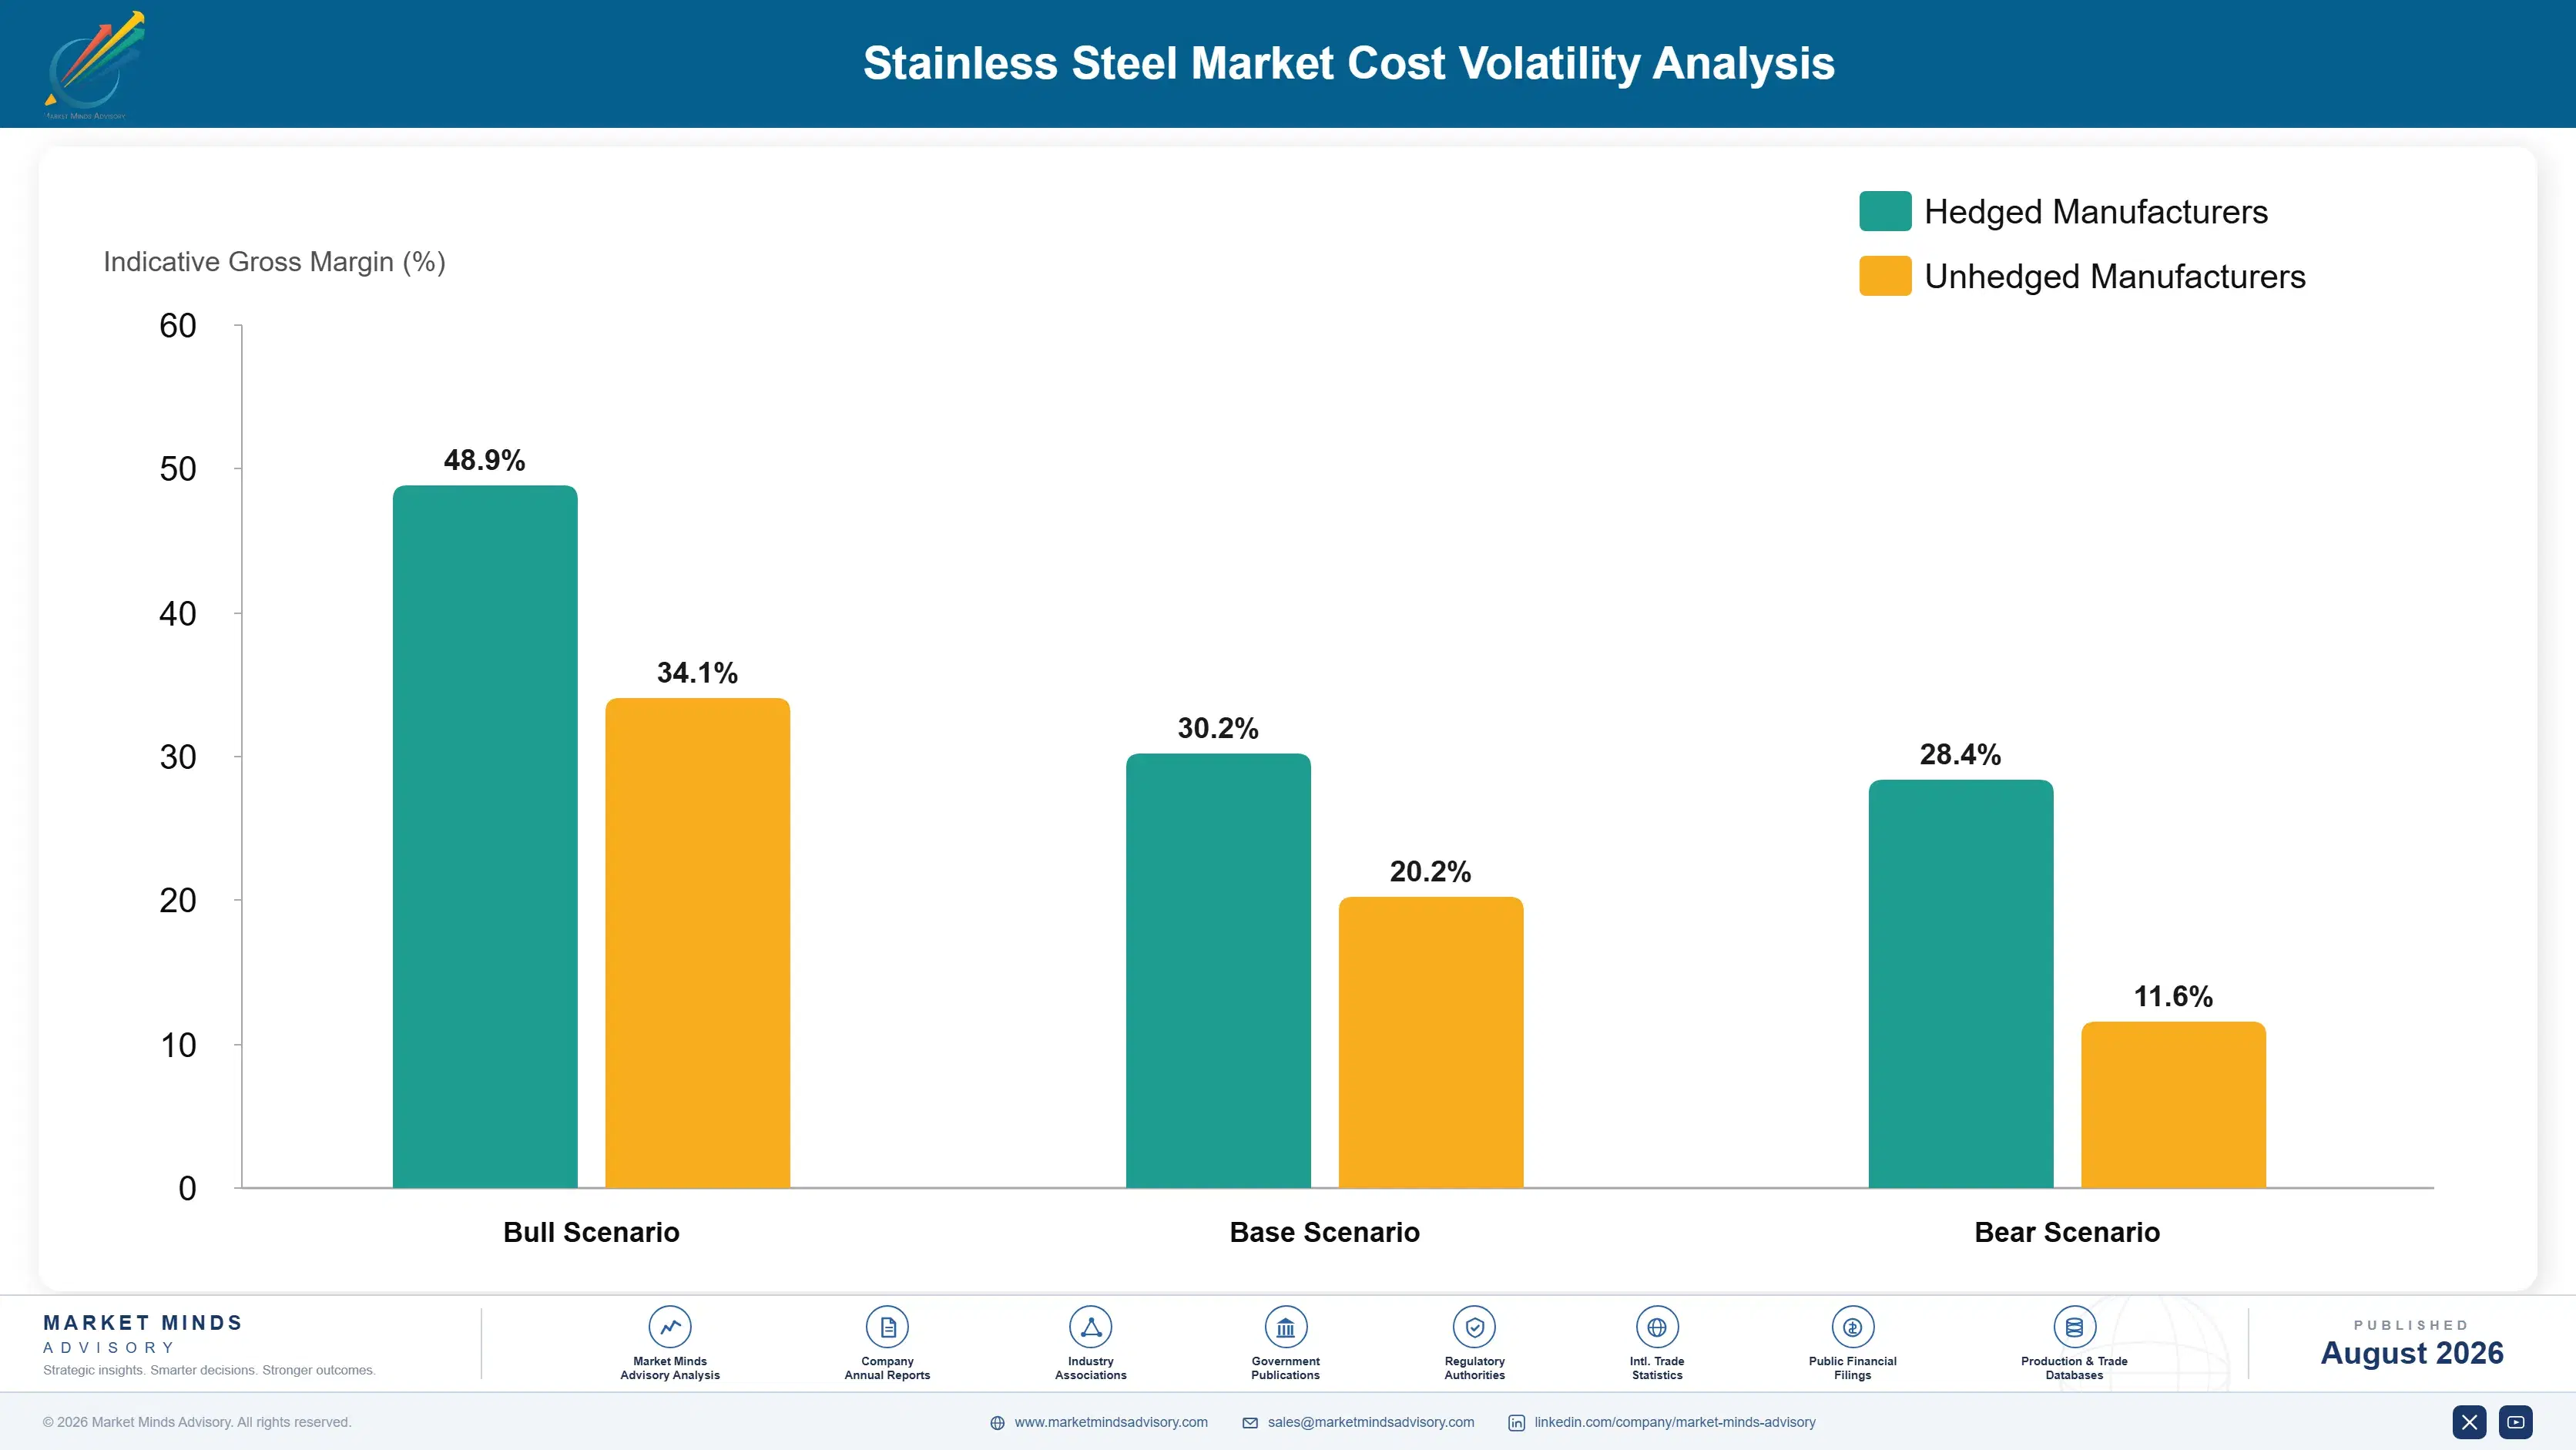
Nickel, Chrome and Electricity

Nickel, chromium and molybdenum together carry around 62% of austenitic grade cost, sourced from mining and ferroalloy supply chains concentrated in Indonesia, the Philippines, South Africa and Kazakhstan. Scrap accounts for roughly 42% of metallic input across the industry and substitutes directly for primary alloy. Electricity carries about 14% for electric arc furnace operations. Refractories, gases, labour and conversion overhead absorb the balance.
The 2022 London Metal Exchange nickel squeeze suspended trading and cancelled executed trades, which broke the hedging mechanism mills had relied on to cover alloy surcharge exposure, per Outokumpu Annual Report 2025 and Acerinox Annual Report 2025 disclosures on metal price risk. Several producers carried unhedged positions through extreme volatility, and the episode changed how the industry treats counterparty and exchange risk. Position sizing against genuine physical need became standard practice afterwards.

Exposure divides on metallic input route rather than on scale. A high scrap electric arc furnace producer carries electricity and scrap pricing, while an integrated melter carries mining and energy cost in a different profile. European mills carry the highest electricity exposure and the lowest embedded emissions at once, which is a burden or an advantage depending on whether carbon pricing is enforced.
stainless-steel-foil-market-trends-cost-volatility-analysis-1787595361420

Shorten the alloy surcharge cycle and tighten inventory turns

Alloy at around 62% of cost recovered roughly 60 days after purchase means growth consumes cash rather than generating it during any nickel rally. Shortening the surcharge cycle with customers and tightening inventory turns attacks the working capital directly, which matters more to survival than the margin the surcharge was designed to protect. Cash is what actually fails first.

Diversify hedge instruments and counterparties after 2022

The nickel squeeze cancelled executed trades and left mills exposed on positions they believed were covered, which was a failure of the mechanism rather than of judgement. Spreading hedge exposure across instruments and counterparties, and sizing positions against genuine physical need, is the practical response most producers have since adopted. Counterparty concentration was the real lesson.

Raise scrap input rates wherever melting practice permits

Scrap substitutes directly for primary alloy at around 42% of industry metallic input, and higher rates cut both metal cost exposure and embedded emissions at once. Melting practice and grade requirements limit how far it goes, but most producers have room to move before quality constraints genuinely bind on their output. Melting practice sets the practical ceiling.

Portfolio Architecture for Margin Defence

Margin here follows grade capability rather than operating efficiency, because conversion spreads on commodity product have compressed to levels where scale and metal access decide everything. Commodity austenitic and 200-series flat product earn margins in the low to high single digits, since capacity is abundant and buyers compare base price plus surcharge across interchangeable suppliers. Metal cost position is the only real variable left.
Ferritic and standard long product grades do modestly better in the low to high teens, because grade specific melting practice and surface requirements narrow the supplier field somewhat, and automotive and appliance customers qualify mills rather than simply buying against a specification at each renewal. Mill qualification takes time to obtain and is disruptive to reopen, which holds the position through cycles that flatten commodity volume.

Duplex, super austenitic and high alloy grades hold the strongest position, reaching into the low thirties, where relatively few mills hold the melting and processing capability and project specifications name grades rather than prices. Those margins reflect metallurgical capability and technical support rather than any advantage in metal cost position. Fabrication support is what converts those specifications into actual tonnage rather than lost opportunities.

Commodity Austenitic and 200-Series Flat

High volume flat product where base price plus surcharge decides awards across interchangeable suppliers. The six point range reflects metal cost position and scale rather than any capability difference between the producers competing.
Gross Margin: 3-9%

Ferritic and Qualified Long Products

Grade specific product where melting practice, surface requirements and customer mill qualification narrow the supplier field. The eight point range reflects qualification depth with automotive and appliance customers rather than metal cost advantage.
Gross Margin: 11-19%

Duplex, Super Austenitic and High Alloy

Highly alloyed grades where few mills hold the melting capability and project specifications name grades directly. The eleven point range reflects metallurgical capability and how much fabrication support the producer provides alongside supply.
Gross Margin: 22-33%
stainless-steel-foil-market-trends-portfolio-architecture-1787595361973

High-value Sub-segments and Strategic Watch-out

Duplex and Super Duplex

High value and the fastest growth at 6.3%, delivering roughly twice the yield strength of 316 at lower nickel content. Fabrication familiarity rather than price or availability limits adoption, which technical support addresses directly. Specifications are lost at the welding bench rather than at the drawing.
Gross Margin: 24-33%

Super Austenitic and High Alloy

High value and growing at 5.8% on chemical, desalination and flue gas applications where standard grades corrode too quickly. Few mills hold the melting capability, which keeps spreads intact through commodity downturns. Project specification rather than distribution decides who supplies it. Engineers name the grade.
Gross Margin: 22-32%

Commodity Austenitic Flat Product

The volume core, where capacity expansion has compressed conversion spreads to levels that cover fixed cost rather than earn returns. Metal cost position decides everything and no operating programme changes that. Trade defence measures redirect the flows without removing the capacity. Metal cost decides everything.
Gross Margin: 3-9%

Alloy Surcharge Working Capital

The strategic watch-out. Alloy at 62% of cost recovered 60 days late means growth consumes cash during rallies, and the range reflects how far a producer has shortened cycles and diversified hedging since 2022. The 2022 squeeze showed hedging alone is not enough. Growth makes the problem worse.
Gross Margin: 2-30%

Specified Grades, Traded Tonnes

Demand splits between tonnage bought against a base price plus surcharge and tonnage specified by grade in a project or a component drawing. Commodity flat product moves through distribution on price and availability. Duplex and high alloy grades are named in a chemical plant specification or a desalination design years before anybody issues a purchase order, which is an entirely different commercial process.
Stickiness follows that split closely. Commodity supply reopens at every contract, since the material is genuinely interchangeable and surcharge mechanics are identical across suppliers. Automotive and appliance mill qualification holds for years because requalification is disruptive. Project grade specifications hold longest of all, because the design work has been done around a named material and reopening it means revisiting the engineering.

Buyer profiles have shifted as carbon accounting arrived. Distribution buying still sits with traders on price. Automotive and appliance qualification sits with supplier quality functions. Project specification sits with process and materials engineers, who are increasingly joined by sustainability functions asking about embedded emissions in ways that never featured in a steel conversation before. Most mills have nobody assigned to answer that question.
stainless-steel-foil-market-trends-end-use-penetration-index-1787595362475

Where We Would Put Effort

These are among the four positions where our research anticipates prominent divergence between winners and laggards over the coming forecast period. Each is grounded in the demand model, the regulatory perimeter, and the announced capacity pipeline.
01 / GRADE MIX MIGRATION

Move tonnage where the spread still exists

Duplex grows at 6.3% and super austenitic at 5.8% against a market rate of 4.2%, and conversion spreads on both have compressed far less than on commodity austenitic product because few mills hold the melting capability required. Shifting even a tenth of tonnage into those families changes mill economics more than any efficiency programme realistically can. The constraint is fabricator familiarity rather than demand, and technical support addresses that directly and at a cost well below what the tonnage is worth.
02 / SURCHARGE CASH DISCIPLINE

It is a financing problem, not pricing

Alloy carries around 62% of austenitic cost and surcharge recovery runs roughly 60 days behind purchase, which means a nickel rally forces mills to fund a growing metal position from their own balance sheets. Growth makes that worse rather than better, which is the opposite of how most producers plan. Shortening the cycle and tightening inventory turns addresses cash directly, and 2022 demonstrated that hedging alone offers nothing like sufficient protection in a case where the exchange mechanism itself simply fails.
03 / EMISSIONS POSITION PRICING

Somebody should pay for the scrap advantage

Scrap already supplies around 42% of world stainless metallic input and European and North American mills run well above that, delivering embedded emissions a fraction of nickel pig iron integrated routes. Carbon border pricing converts that from a sustainability claim into a delivered cost variable that buyers must account for. Documenting and pricing it reaches compliance and sustainability functions holding budgets procurement neither controls nor generally even gets to see, which makes it a different conversation with a different budget behind it.
04 / FABRICATOR CAPABILITY SUPPORT

The constraint sits at the welding bench

Duplex specifications default back to 316 at higher nickel cost when a fabricator lacks confidence in heat input control and forming practice, which is a capability gap rather than a commercial objection. Mills providing welding procedure support and fabrication training convert those specifications directly into tonnage in the grades where spreads survive. The cost sits below one percent of revenue and the effect lands exactly where mill economics need it most, which is unusual for a commercial investment of any kind at all.

Engagement Snapshot From the Field

A live engagement with an industry participant carrying material or product regulatory and market exposure ahead of a defining policy shift, showing how our research translates into a defensible multi-year portfolio strategy.
MARKET MINDS ADVISORY · CLIENT ENGAGEMENT SUMMARY
Stainless Steel Producer Strategic Portfolio Review and Transition Roadmap 2026·Investment Scenario on Stainless Steel Exposure Evaluation 2025-26
CLIENT PROFILE
A European stainless steel producer operating electric arc furnace melting with scrap input well above the industry average, supplying flat and long products across chemical, food processing and automotive customers, at annual revenue near 2.1 billion euros (client-reported, unverified by MMA). Duplex output was modest and fabricator support minimal. Commodity austenitic output dominated the tonnage.
STRATEGIC CHALLENGE
Conversion spreads on commodity austenitic product had compressed for four years against imported material, and a nickel rally had consumed working capital exactly when order books grew. Management could not tell whether the business needed cost reduction, capacity closure or a different product mix entirely. A capacity decision was due within months.
MMA APPROACH
MMA separated conversion spread performance by alloy family across five years, quantified working capital consumption against surcharge recovery timing, modelled carbon border pricing effects on delivered cost against imported nickel pig iron based material, and assessed why duplex specifications in the client's markets defaulted back to austenitic grades. Interviews with 47 experts covered stainless melting, fabrication and project specification.
KEY FINDINGS
  1. Commodity austenitic spreads covered fixed costs without earning a return in three of the five years examined, while duplex spreads held throughout the same period.
  2. Working capital consumption tracked order book growth during nickel rallies, meaning commercial success actively worsened the cash position rather than improving it.
  3. Duplex specifications in the client's markets reverted to 316 at fabrication stage in most cases examined, on welding confidence rather than any material cost objection.
  4. Carbon border pricing would deliver a measurable delivered cost advantage against imported material, which the client had not quantified or communicated to any customer.
CLIENT PROFILE
A European stainless steel producer operating electric arc furnace melting with scrap input well above the industry average, supplying flat and long products across chemical, food processing and automotive customers, at annual revenue near 2.1 billion euros (client-reported, unverified by MMA). Duplex output was modest and fabricator support minimal. Commodity austenitic output dominated the tonnage.
STRATEGIC CHALLENGE
Conversion spreads on commodity austenitic product had compressed for four years against imported material, and a nickel rally had consumed working capital exactly when order books grew. Management could not tell whether the business needed cost reduction, capacity closure or a different product mix entirely. A capacity decision was due within months.
MMA APPROACH
MMA separated conversion spread performance by alloy family across five years, quantified working capital consumption against surcharge recovery timing, modelled carbon border pricing effects on delivered cost against imported nickel pig iron based material, and assessed why duplex specifications in the client's markets defaulted back to austenitic grades. Interviews with 47 experts covered stainless melting, fabrication and project specification.
KEY FINDINGS
  1. Commodity austenitic spreads covered fixed costs without earning a return in three of the five years examined, while duplex spreads held throughout the same period.
  2. Working capital consumption tracked order book growth during nickel rallies, meaning commercial success actively worsened the cash position rather than improving it.
  3. Duplex specifications in the client's markets reverted to 316 at fabrication stage in most cases examined, on welding confidence rather than any material cost objection.
  4. Carbon border pricing would deliver a measurable delivered cost advantage against imported material, which the client had not quantified or communicated to any customer.
RECOMMENDED STRATEGY
Phase 1: Phase one: build fabricator welding and forming support capability, since duplex specifications are being lost at the bench rather than at the specification stage. Phase 2: Phase two: shorten alloy surcharge recovery cycles with customers and tighten inventory turns to stop growth consuming cash during rallies. Phase 3: Phase three: quantify and communicate the embedded emissions position to compliance and sustainability functions rather than to purchasing. Purchasing will not value it.
OUTCOME
The producer established fabricator support and reported duplex tonnage rising materially across 2026, with surcharge cycles shortened on roughly half the customer base (client-reported, unverified by MMA). Commodity austenitic output was reduced rather than defended. Working capital consumption fell despite tonnage growing across the year.

Frequently Asked Questions

Foundational context covering the market sizes, CAGR, scope, country, region and competition that inform every finding below. This section is provided to cover basics and most often pre-purchase conversations, answered from the MMA Primary Research Dataset.

What is the current size of the Stainless Steel Market?

MMA sizes it at USD 128.0 billion in 2025, rising to USD 133.38 billion in 2026. The figure covers all alloy families at mill selling value including alloy surcharge.

How large will the Stainless Steel Market be by 2036?

USD 201.27 billion by 2036, an incremental USD 67.89 billion over the 2026 base and an expansion multiple of 1.51 times. Duplex grades account for a disproportionate share.

What is the CAGR for the Stainless Steel Market 2026 to 2036?

4.2% in the base case, with a bull case at 5.4% and a bear case at 3.0%. The spread turns on carbon border pricing enforcement against continued capacity expansion compressing spreads.

Which segment is growing fastest?

Duplex and super duplex at 6.3%, half again the market rate of 4.2%. The grades deliver roughly twice the yield strength of 316 at materially lower nickel content.

Who are the major companies in the Stainless Steel Market?

Tsingshan Holding Group, TISCO, Outokumpu, POSCO and Acerinox lead on crude melting capacity. Fifteen further participants are profiled in the full report on that same basis.

Which country is growing fastest?

India at 8.4%, driven by construction, railway, process industry and consumer durable demand rising from consumption per head well below developed market levels. Domestic capacity has expanded alongside it.

Report Segmentation Architecture

The full report scope spans multiple orthogonal segmentation dimensions, with cross-tabulated demand data provided for each dimension pair. Coverage extends further to regional breakdowns, trend trajectories, and the competitive detail needed to support segment-level decision-making.

By Alloy Family

  • 300-Series Austenitic
  • 400-Series Ferritic
  • 200-Series Austenitic
  • Duplex and Super Duplex
  • Martensitic and Precipitation Hardening
  • Super Austenitic and High Alloy

By End-Use Industry

  • Construction and Architecture
  • Chemical and Process Industry
  • Food Processing and Catering Equipment
  • Automotive and Transport
  • Consumer Appliances and Housewares
  • Energy, Desalination and Marine

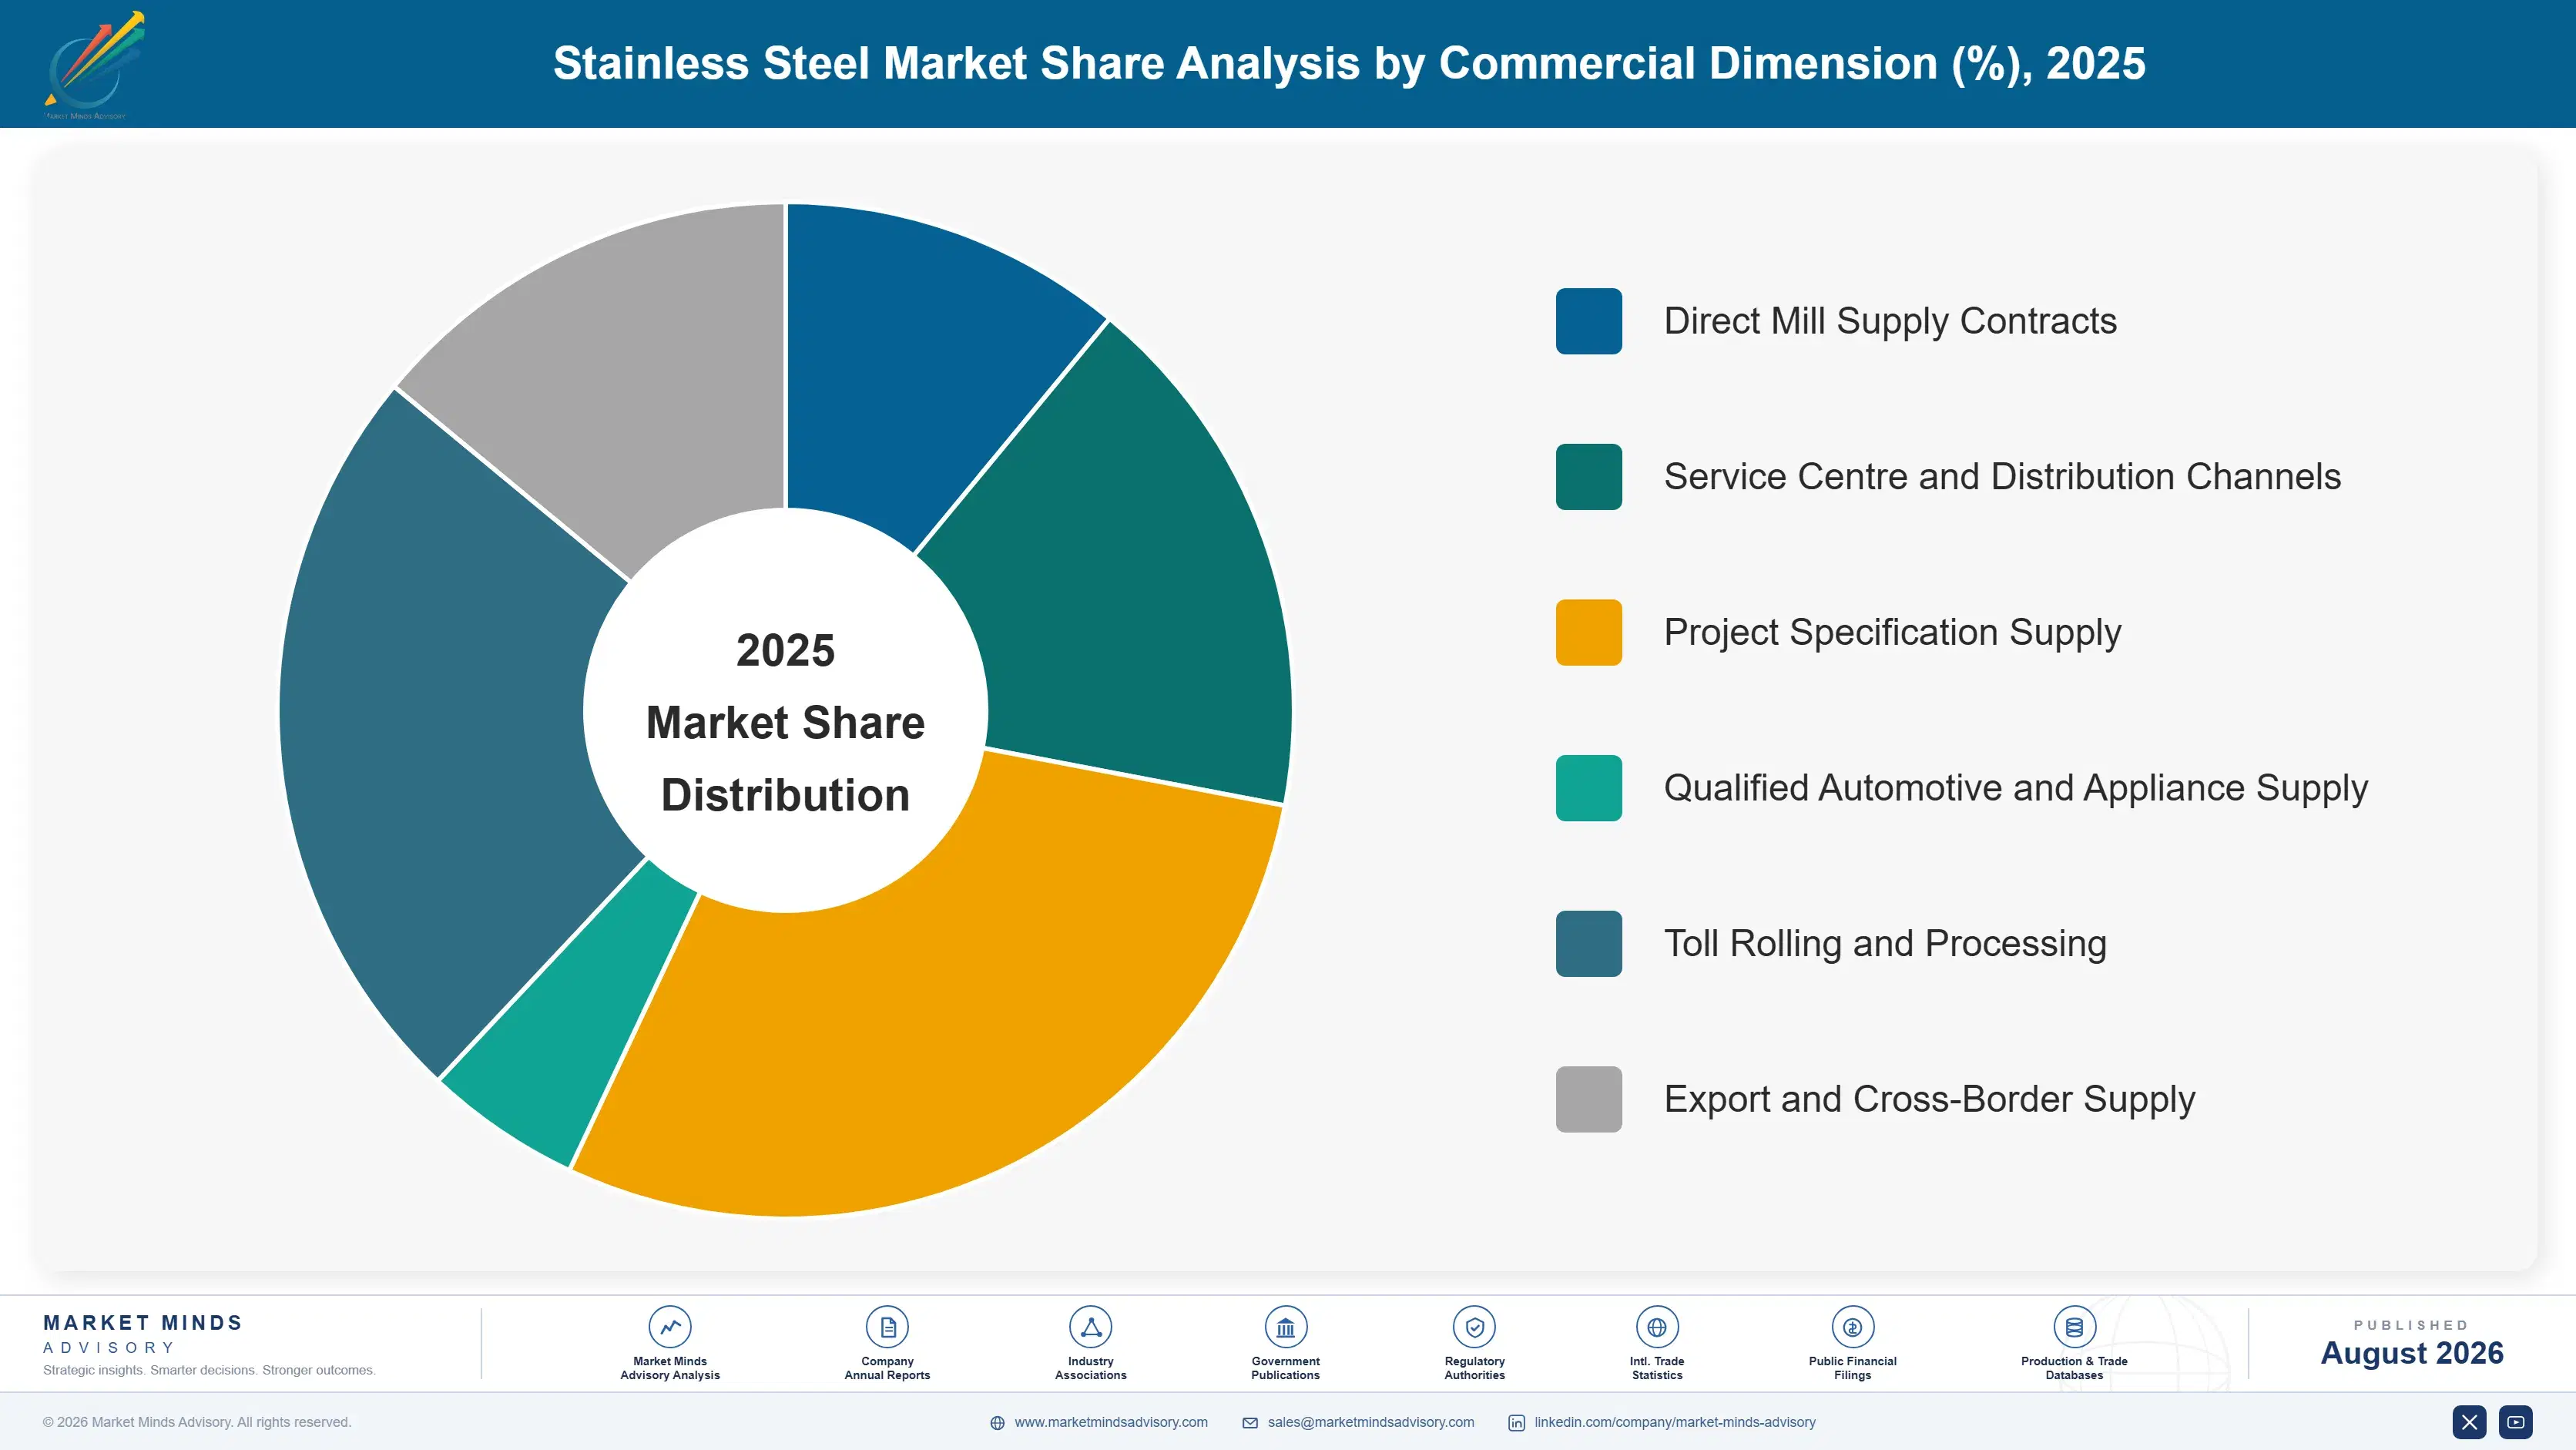
By Commercial Dimension

  • Direct Mill Supply Contracts
  • Service Centre and Distribution Channels
  • Project Specification Supply
  • Qualified Automotive and Appliance Supply
  • Toll Rolling and Processing
  • Export and Cross-Border Supply

By Region

  • North America
  • Western Europe
  • East Asia
  • South Asia and Pacific
  • Latin America
  • Middle East and Africa
  • Eastern Europe

Scope, Methodology, and Coverage

Every figure in this report is reproducible from documented input assumptions. The scope below maps the historical period, the forecast horizon, the segmentation dimensions, and the countries covered, alongside the underlying primary and qualitative methodology.
Historical Period
2020 to 2025
Forecast Period
2026 to 2036
Base Year
2025 (USD billions; MMA Primary Research Dataset, August 2026)
Market Definition
Stainless steel produced in flat and long product form across all alloy families, covering 300-series austenitic, 400-series ferritic, 200-series austenitic, duplex and super duplex, martensitic and precipitation hardening, and super austenitic and high alloy grades. Measured at mill selling value including alloy surcharge. Nickel alloys without iron base, carbon and alloy steels, stainless castings, welding consumables, and downstream fabrication or distribution services are excluded from scope.
Quantitative Units
USD billions (current prices); million tonnes crude production; USD per tonne by alloy family
Segmentation Dimensions
Alloy family; end-use industry; commercial dimension; region
Regions Covered
North America, Western Europe, East Asia, South Asia and Pacific, Latin America, Middle East and Africa, Eastern Europe
Countries Covered
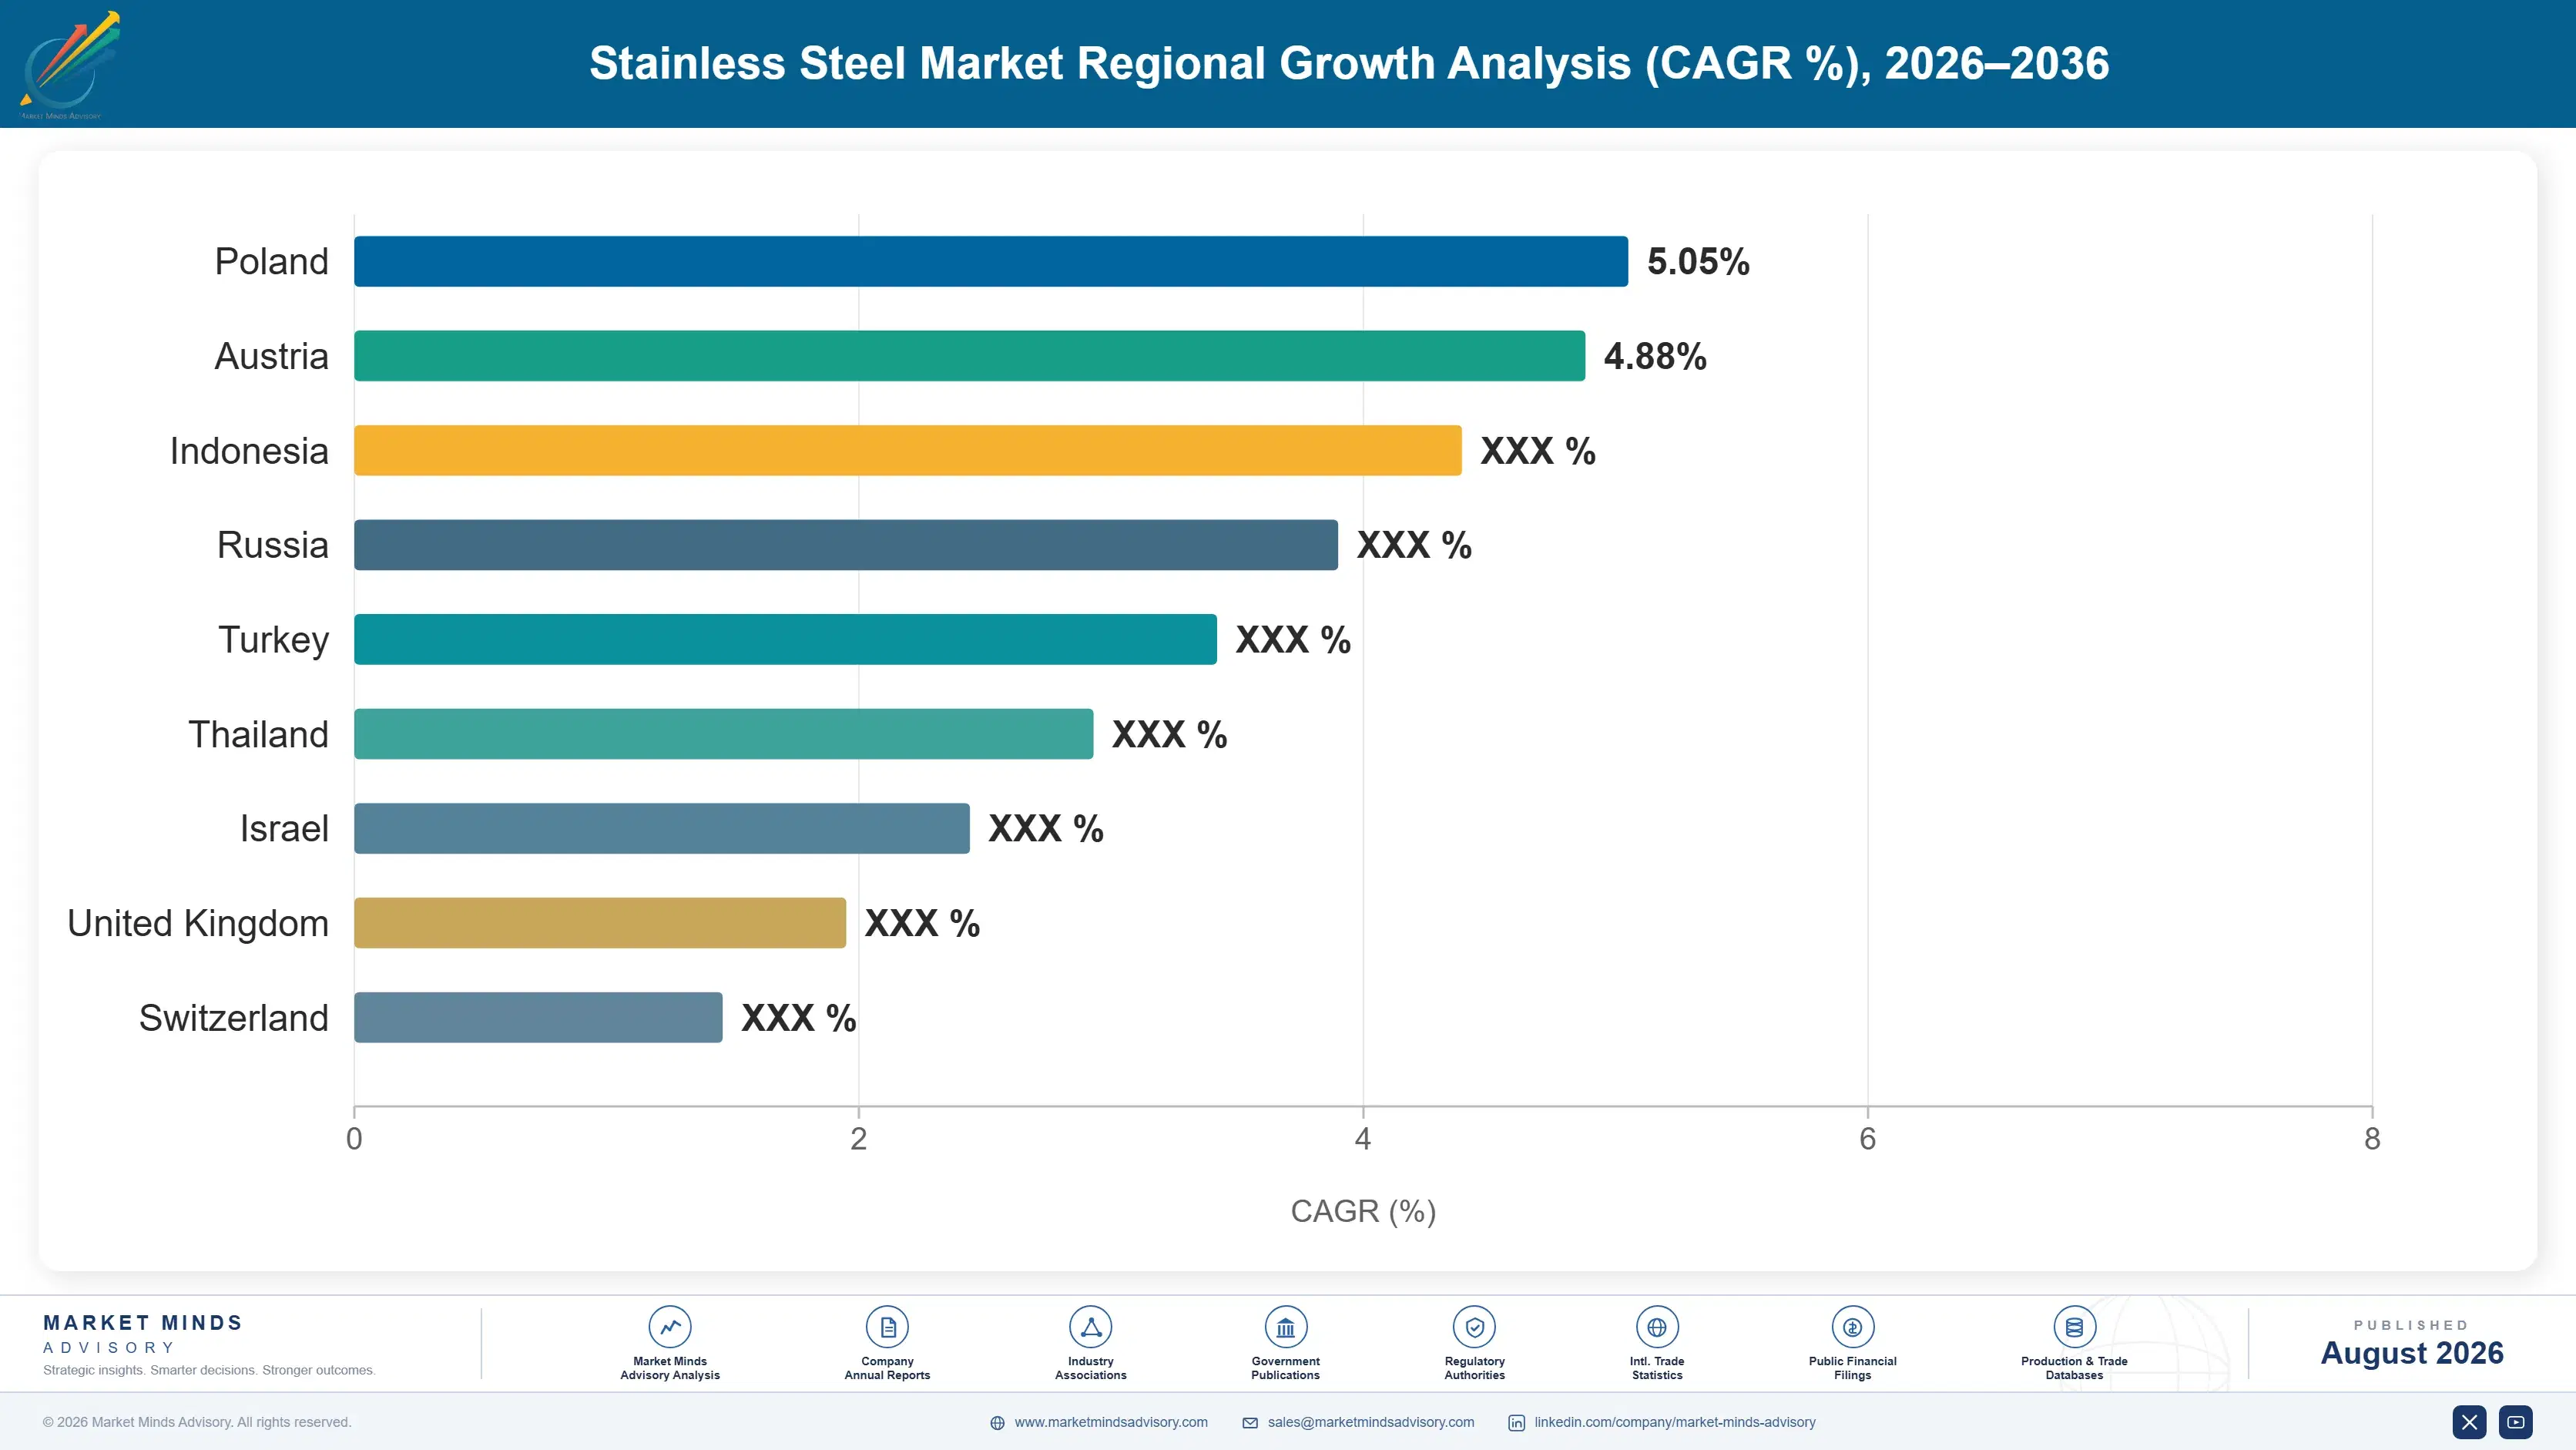
United States, Canada, Mexico, Germany, Italy, Spain, France, Finland, China, Japan, South Korea, Taiwan, India, Indonesia, Australia, Brazil, Chile, Saudi Arabia, South Africa, Poland
Key Companies Profiled
Tsingshan Holding Group, TISCO, Outokumpu, POSCO, Acerinox, Aperam, Jindal Stainless, Nippon Steel Stainless, JFE Steel, Baosteel Desheng, Yieh United Steel, Walsin Lihwa, Viraj Profiles, Marcegaglia, Ugitech, Sandvik, ArcelorMittal, Hyundai Steel, Delong Holdings, Tsingtuo Group
Quantitative Methodology
Primary survey, n=3,800 respondents, Q4 2025, six countries; demand-side model with trade association cross-validation
Qualitative Methodology
47 expert interviews, Q4 2025; applied to validate demand model assumptions, identify emerging dynamics, and assess competitive positioning
Report Format
PDF and XLSX data workbook (Word format preview document)
Publisher
Market Minds Advisory
Report Code
MMA-2026-CHM-139
Published
August 2026
Contact
sales@marketmindsadvisory.com | www.marketmindsadvisory.com

Purchase the full Stainless Steel Market Report (2026 to 2036).

The full report separates conversion spread performance by alloy family, because commodity and high alloy economics have diverged far enough that a single market view now misleads. It sizes all six alloy families independently through 2036, quantifies alloy surcharge working capital consumption against recovery timing, and models carbon border pricing effects on delivered cost by production route. Regional chapters cover all seven regions with production and consumption analysed separately throughout. Competitive profiling covers 20 participants on one consistent melting capacity basis. Fabrication capability constraints are assessed by region throughout.
Six alloy families sized independently through 2036
Conversion spreads analysed separately by alloy family
Alloy surcharge working capital consumption quantified against recovery timing
Carbon border pricing modelled by production route and region
Trade defence measures mapped against redirected export flows
Twenty participants profiled on one consistent melting capacity basis

Built For The People Who Decide

From boardroom strategy to bench-side execution, this report is read cover-to-cover by leaders shaping the next decade of their industry, turning demand scenarios, market dynamics and valuation benchmarks into decisions.
CXOs/ Presidents/ VPs/ Managers
M&A and Corporate Development
Strategy Teams and R&D Heads
Procurement and Product Directors
Regulatory and Compliance Leaders
Investor Relations and Equity Analysts