Market Minds Advisory
Sports Turf Sensors Market

Sports Turf Sensors Market: Sports Turf Sensors Market. Trends and Forecast 2026 to 2036

Professional stadiums and elite golf courses are replacing manual soil testing with networked moisture, compaction, and imaging sensors that let groundskeepers catch turf stress before it becomes visible damage during championship-week broadcasts.

Lead Analyst

Published

September 2026

Make Smarter Decisions with Customized Research Insights

Request a free sample report and evaluate market opportunities, growth trends, and competitive dynamics relevant to your business needs.

2025 MARKET VALUE$0.3BMarket Size 2025
2036 FORECAST VALUE$1.4BBase Case , 2026 to 2036
CAGR 2026 TO 203613.5 %Bull 14.8% / Bear 12.2%
INCREMENTAL OPPORTUNITY$1.0BNet 10- year value creation
EXPANSION MULTIPLE3.55x2036 value over 2026 base
Strategic Levers
M&A Pipeline
Regional Outlook
Country Rankings
Competitive Intelligence
Segmental Deep-dive
Call-Us : 91 93563 13602

Executive Snapshot and Market Trajectory.

Professional sports venues and golf courses are replacing manual soil probing with networked sensor arrays that continuously track moisture, compaction, and turf health across entire playing surfaces in real time throughout every match day, practice session, and off-season maintenance window across the calendar year.
Major League Baseball and Premier League clubs increasingly treat playing surface condition as a competitive and broadcast liability, pushing groundskeeping budgets toward sensor networks that flag stress before it becomes visible on camera during nationally televised matches watched by millions. NDVI imaging sensors, which detect vegetation health invisible to the naked eye, are growing fastest of all product types as venues seek earlier warning before a damaged surface affects player safety or match outcomes.
The Toro Company and Rain Bird dominate through existing irrigation equipment relationships with groundskeeping staff, while specialty sensor makers like POGO Technologies and METER Group compete on measurement precision rather than integrated equipment bundling across venue types nationwide and internationally. Budget-constrained municipal and collegiate facilities remain the slowest adopters, creating a bifurcated market between elite venues investing heavily and everyone else still relying on manual inspection routines.
Market Definition
The Sports Turf Sensors Market covers hardware and connected sensor systems that monitor soil moisture, compaction, turf health, weather, and surface wear on athletic fields and golf courses, measured by device and subscription revenue. It excludes general agricultural soil sensors sold for row-crop farming and standalone irrigation controllers lacking dedicated turf condition sensing capability.
Base Year Value
$0.3B in 2025 (MMA Primary Research Dataset, September 2026)
Forecast Period
2026 to 2036, eleven discrete annual values
CAGR
13.5% base case. Bull 14.8%. Bear 12.2%.
Fastest Growth Segment
Turf Health and NDVI Imaging Sensors: 16.5% CAGR
Fastest Growth Country
United States: 15.5% CAGR
Fastest Growth Region
South Asia and Pacific: 15.5% CAGR
Largest Region
North America: 32% of 2025 global value
Market Leaders
Leading participants include The Toro Company, Rain Bird, METER Group, POGO Technologies, and GreenSight.
Primary Survey
n=3,800 procurement and R&D decision-makers, Q4 2025, six countries
Methodology
Demand-side build-up, cross-validated against public data, 47 expert interviews

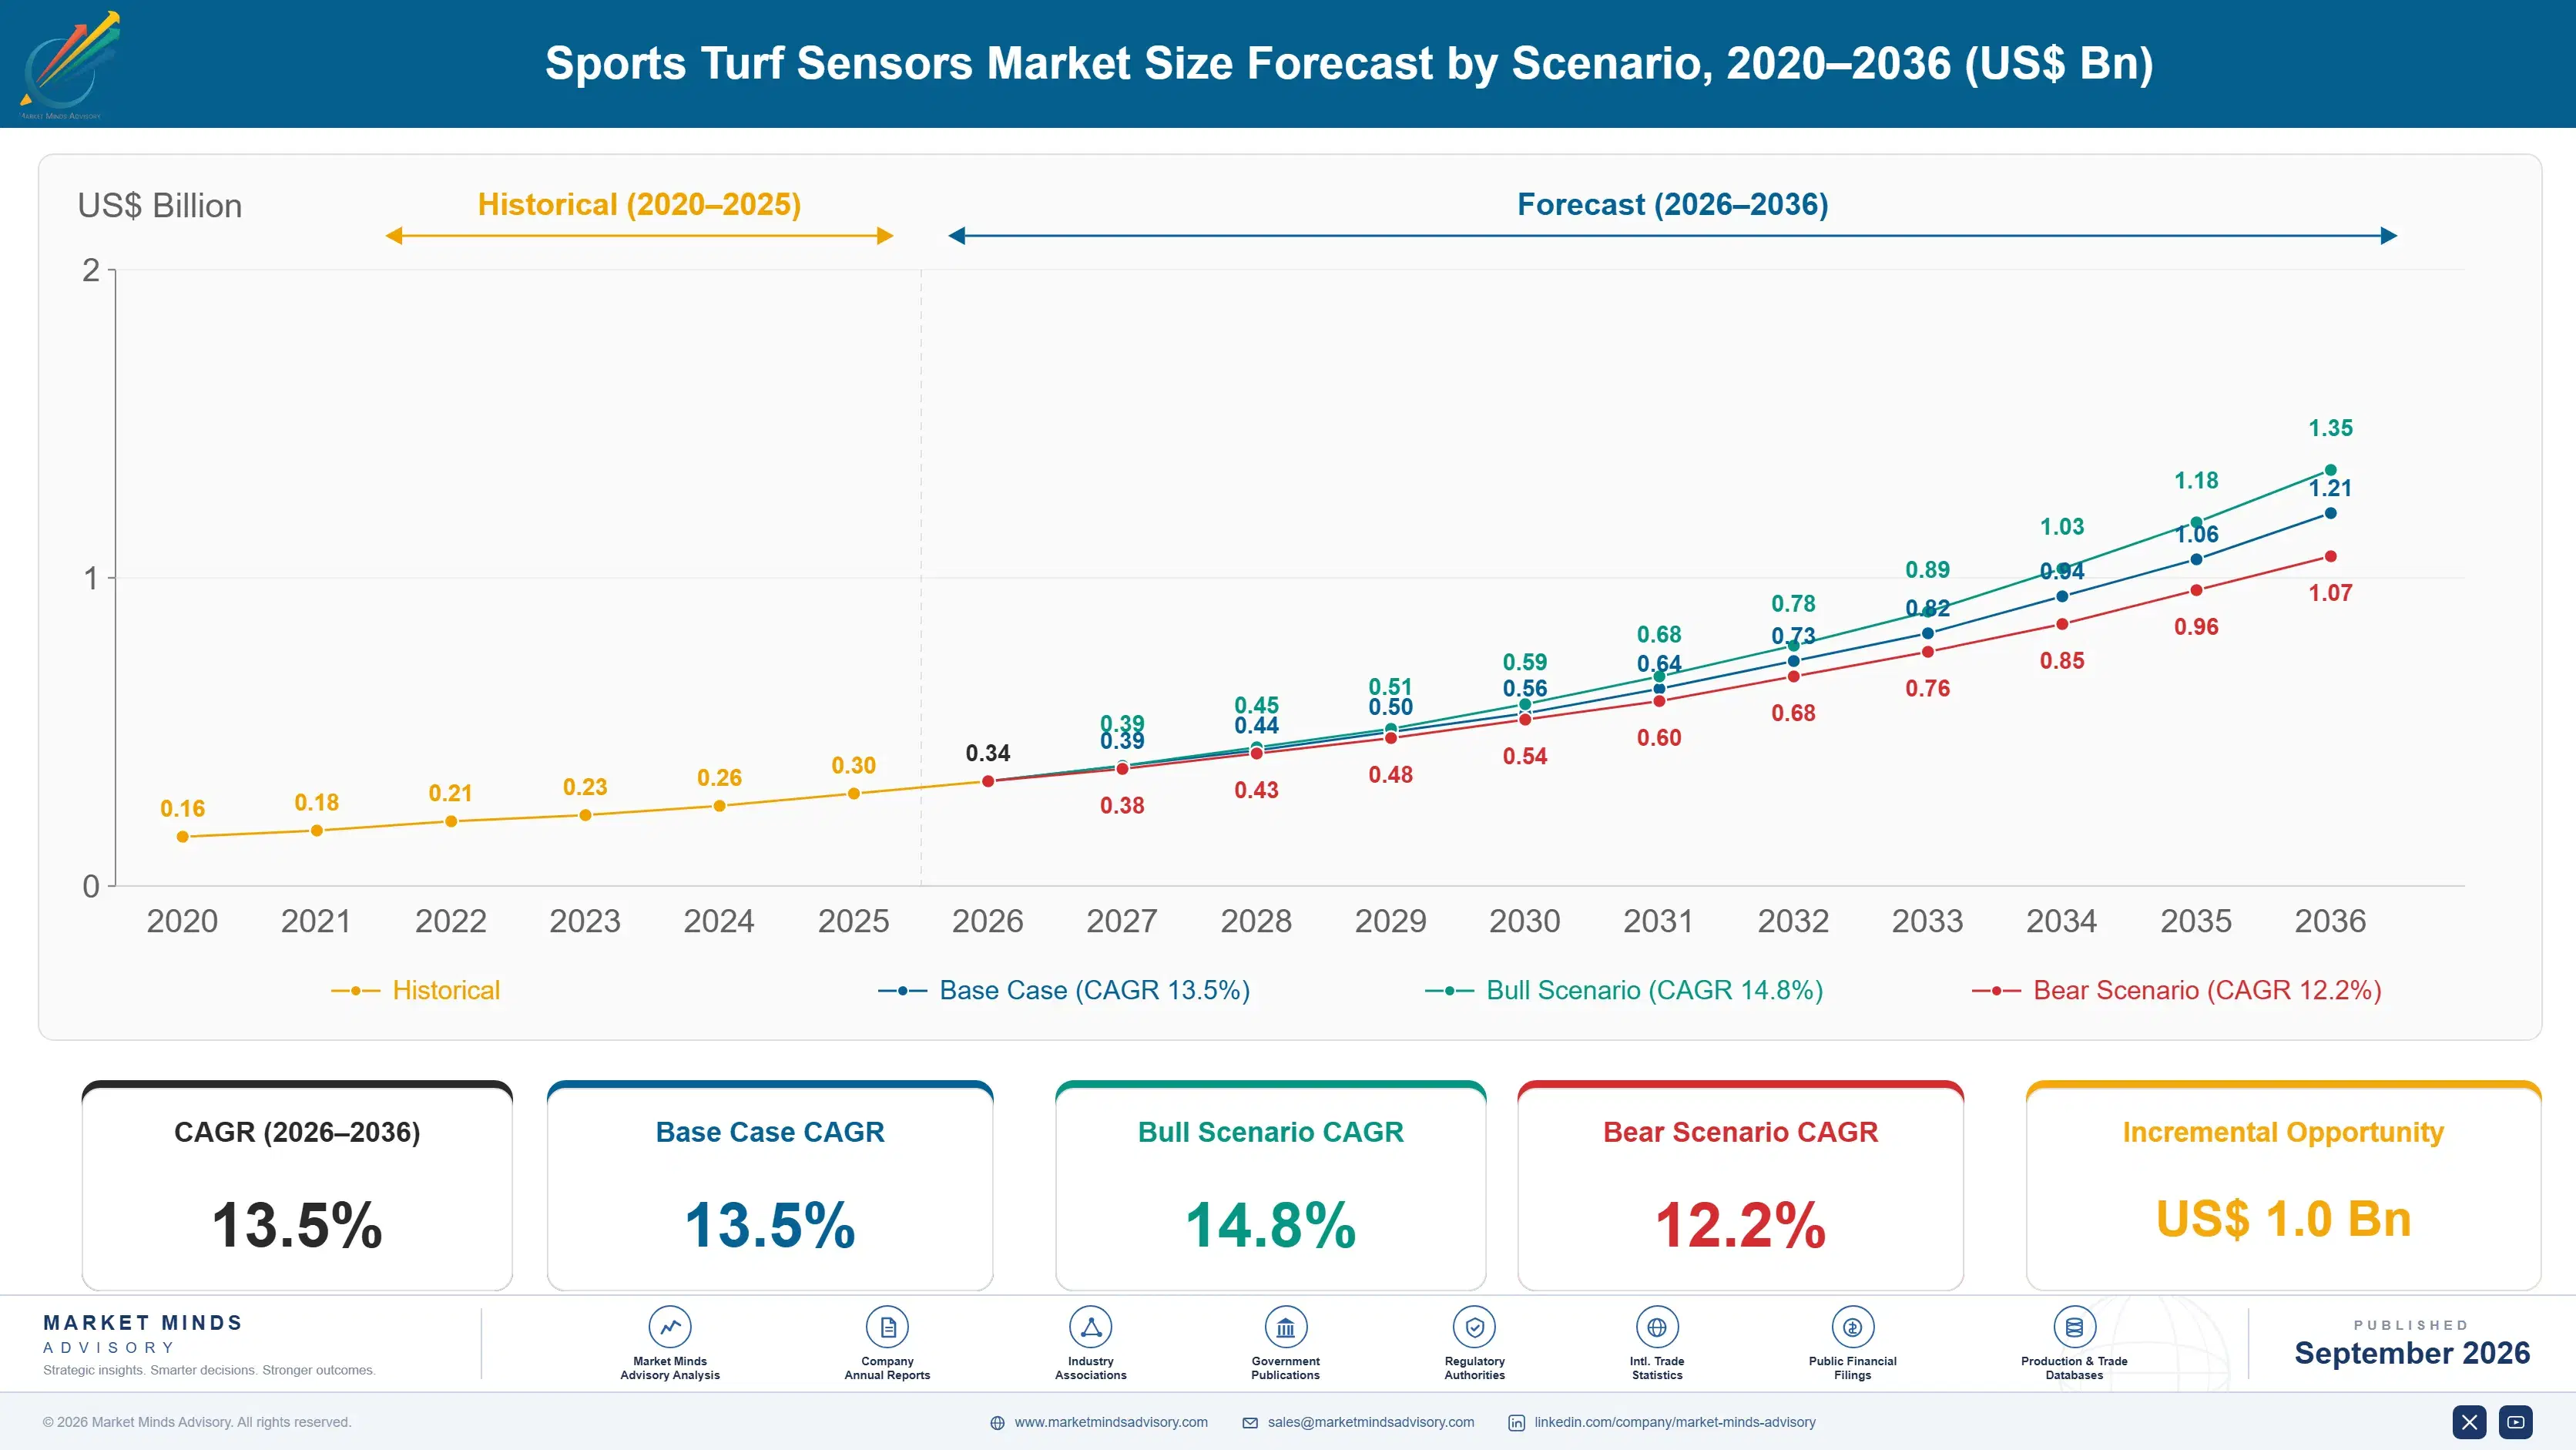
Sports Turf Sensors Market Forecast Scenarios

sports-turf-sensors-market-size-forecast-scenario-1788414089998
Sports turf sensor adoption grew steadily through the historical period as elite venues gradually replaced manual soil testing with connected monitoring, though the category remained a niche specialty purchase largely confined to professional stadiums and championship golf courses. The 12.5% historical growth rate reflects early-adopter concentration rather than broad market penetration across most facility types.
The base case assumes continued elite venue investment as broadcast scrutiny of playing surface quality intensifies, expanding NDVI imaging adoption beyond baseball and football into golf and rugby, and falling sensor hardware costs that bring networked monitoring within reach of well-funded collegiate athletic programs. These three mechanisms support 13.5% compound annual growth through 2036, with imaging and GPS mapping segments outpacing basic moisture sensing as venues prioritize earlier problem detection over simple threshold alerts.
A bull case turns on major sports leagues mandating minimum sensor coverage standards across member venues to reduce playing surface injury liability exposure and protect broadcast production quality. A bear case centers on budget-constrained municipal and collegiate facilities never adopting sensors at scale, since elite venue penetration alone cannot sustain double-digit category growth indefinitely without broader adoption.

The Broadcast Scrutiny Behind Elite Venue Spending

Pricing bifurcates sharply between basic moisture sensing networks and full imaging-equipped systems, with NDVI-capable installations commanding roughly double the cost of standard soil sensor arrays across most product categories sold today nationwide and consistently. Elite venues increasingly justify this premium given the broadcast and liability stakes of a visibly damaged playing surface during a nationally televised championship match watched widely by millions.
MARKET CONCENTRATION38% CR5top five vendors hold a moderate combined revenue share
AVERAGE SYSTEM PRICE$45,000 per fieldtypical full-field networked sensor system installation cost estimate
TOP ADOPTING COUNTRY41% United Statesshare of global elite venue sensor deployment revenue
ELITE VENUE PENETRATION52% of stadiumsshare of top-tier professional venues with sensor coverage
IMAGING ADOPTION RATE29% of installsproportion of systems now including NDVI imaging capability
REPLACEMENT CYCLE LENGTH6 to 8 yearstypical interval before venues upgrade sensor hardware fully
Adoption concentrates heavily among professional and elite collegiate venues, with roughly 52% of top-tier stadiums now carrying some form of networked sensor coverage while municipal and lower-division facilities remain almost entirely dependent on manual inspection routines still practiced today. This gap reflects both budget constraints and the lower broadcast visibility of surface quality issues at non-elite venues lacking national television exposure.
Vendors increasingly bundle sensor hardware with subscription-based data analytics platforms that translate raw moisture and compaction readings into actionable groundskeeping recommendations, since most facility staff lack the technical background to interpret raw sensor output directly without assistance or extensive training. This bundling shift is reshaping vendor economics toward recurring revenue and away from one-time equipment sales that previously dominated the category entirely.
"Every groundskeeper already knows their field intuitively after years of walking it daily. What sensors actually sell is defensibility, meaning documented proof the surface was properly maintained when something goes wrong on camera."
Senior Analyst, Sports Facility Technology Practice · MMA Agriculture Practice · September 2026

Market Trends

NDVI Imaging Sensors Expand Beyond Elite Stadiums

NDVI imaging technology, which detects vegetation stress invisible to the naked eye by measuring light reflectance across specific wavelengths, is spreading from flagship professional stadiums into well-funded collegiate athletic programs and premium golf courses seeking earlier warning of turf stress before visible damage appears. Roughly 29% of new sensor installations now include imaging capability, up meaningfully from negligible adoption just a few years earlier when the technology remained prohibitively expensive for most facilities. This expansion reflects falling camera and processing hardware costs that have brought imaging within reach of a considerably broader buyer base than originally targeted.
Market Impact: Elite venue penetration reached 52%
Data Analytics Subscriptions Replace One-Time Hardware Sales

Vendors increasingly bundle sensor hardware with ongoing subscription-based analytics platforms that translate raw readings into specific groundskeeping recommendations, converting what was historically a single equipment purchase into a recurring revenue relationship with facility management staff and budget planners. This shift reflects genuine buyer demand, since most groundskeeping staff lack the technical training to interpret raw sensor data without software assistance translating numbers into concrete maintenance actions taken daily. Subscription attach rates among new installations now exceed 45%, reshaping vendor revenue models considerably away from hardware margins alone toward recurring fees.
Market Impact: System pricing fell roughly 30% recently

Market Opportunities and Growth Drivers

Broadcast Scrutiny Elevates Playing Surface Liability Stakes

Major sports leagues face intensifying broadcast and social media scrutiny whenever a visibly damaged playing surface affects player safety or match outcome during nationally televised competition, creating direct financial and reputational incentive for venues to invest proactively in early-warning sensor systems well ahead of any incident. Several high-profile playing surface failures during televised matches have accelerated procurement conversations across professional leagues previously reluctant to fund sensor networks beyond basic irrigation control. This dynamic has pushed elite venue sensor penetration to roughly 52% of top-tier stadiums currently tracked in this report.
Market Impact: Budget constraints delay adoption 3 years

Falling Sensor Hardware Costs Expand Addressable Buyer Base

Component cost declines across soil moisture probes, imaging cameras, and wireless connectivity modules have brought networked sensor systems within reach of well-funded collegiate athletic programs and premium golf courses previously priced entirely out of the category by high upfront equipment cost and installation expense combined. Average system pricing has fallen by roughly 30% over the past several years even as measurement accuracy and data resolution have both improved considerably, expanding the addressable buyer base well beyond the flagship professional venues that originally defined this market when it first emerged commercially.
Market Impact: Skepticism delays adoption 18 months

Market Restraints and Challenges

Municipal and Collegiate Budget Constraints Limit Adoption

Municipal athletic fields and smaller collegiate athletic departments face budget constraints that make networked sensor systems, even at falling price points, a difficult purchase to justify against competing facility maintenance and staffing priorities within already stretched annual budgets. This restraint stems from these facilities generating minimal broadcast revenue that could otherwise offset sensor investment cost, unlike elite venues where broadcast stakes directly justify spending. Vendors are responding by developing simplified, lower-cost product tiers specifically targeting budget-constrained facilities, though adoption among this segment remains slow and uneven across different regions and funding structures.
Market Impact: Imaging adoption reached 29% of installs

Groundskeeper Skepticism Slows Sensor Data Trust and Use

Veteran groundskeepers with decades of hands-on field experience often distrust sensor readings that contradict their own intuitive assessment of turf condition, creating internal resistance to fully incorporating sensor data into daily maintenance decisions even after hardware installation is already fully complete and paid for by the venue. This skepticism stems from early-generation sensors producing unreliable readings that damaged trust before measurement accuracy improved considerably in more recent hardware generations sold today. Vendors are addressing this through simplified dashboards and on-site training programs designed specifically to build groundskeeper confidence in sensor-driven recommendations over time.
Market Impact: Subscription attach rates now exceed 45%
3 additional market trends, 4 additional growth drivers, and 2 additional restraints and challenges are covered in the full report. Contact sales@marketmindsadvisory.com to access the complete intelligence.

Segment CAGR and Growth Architecture

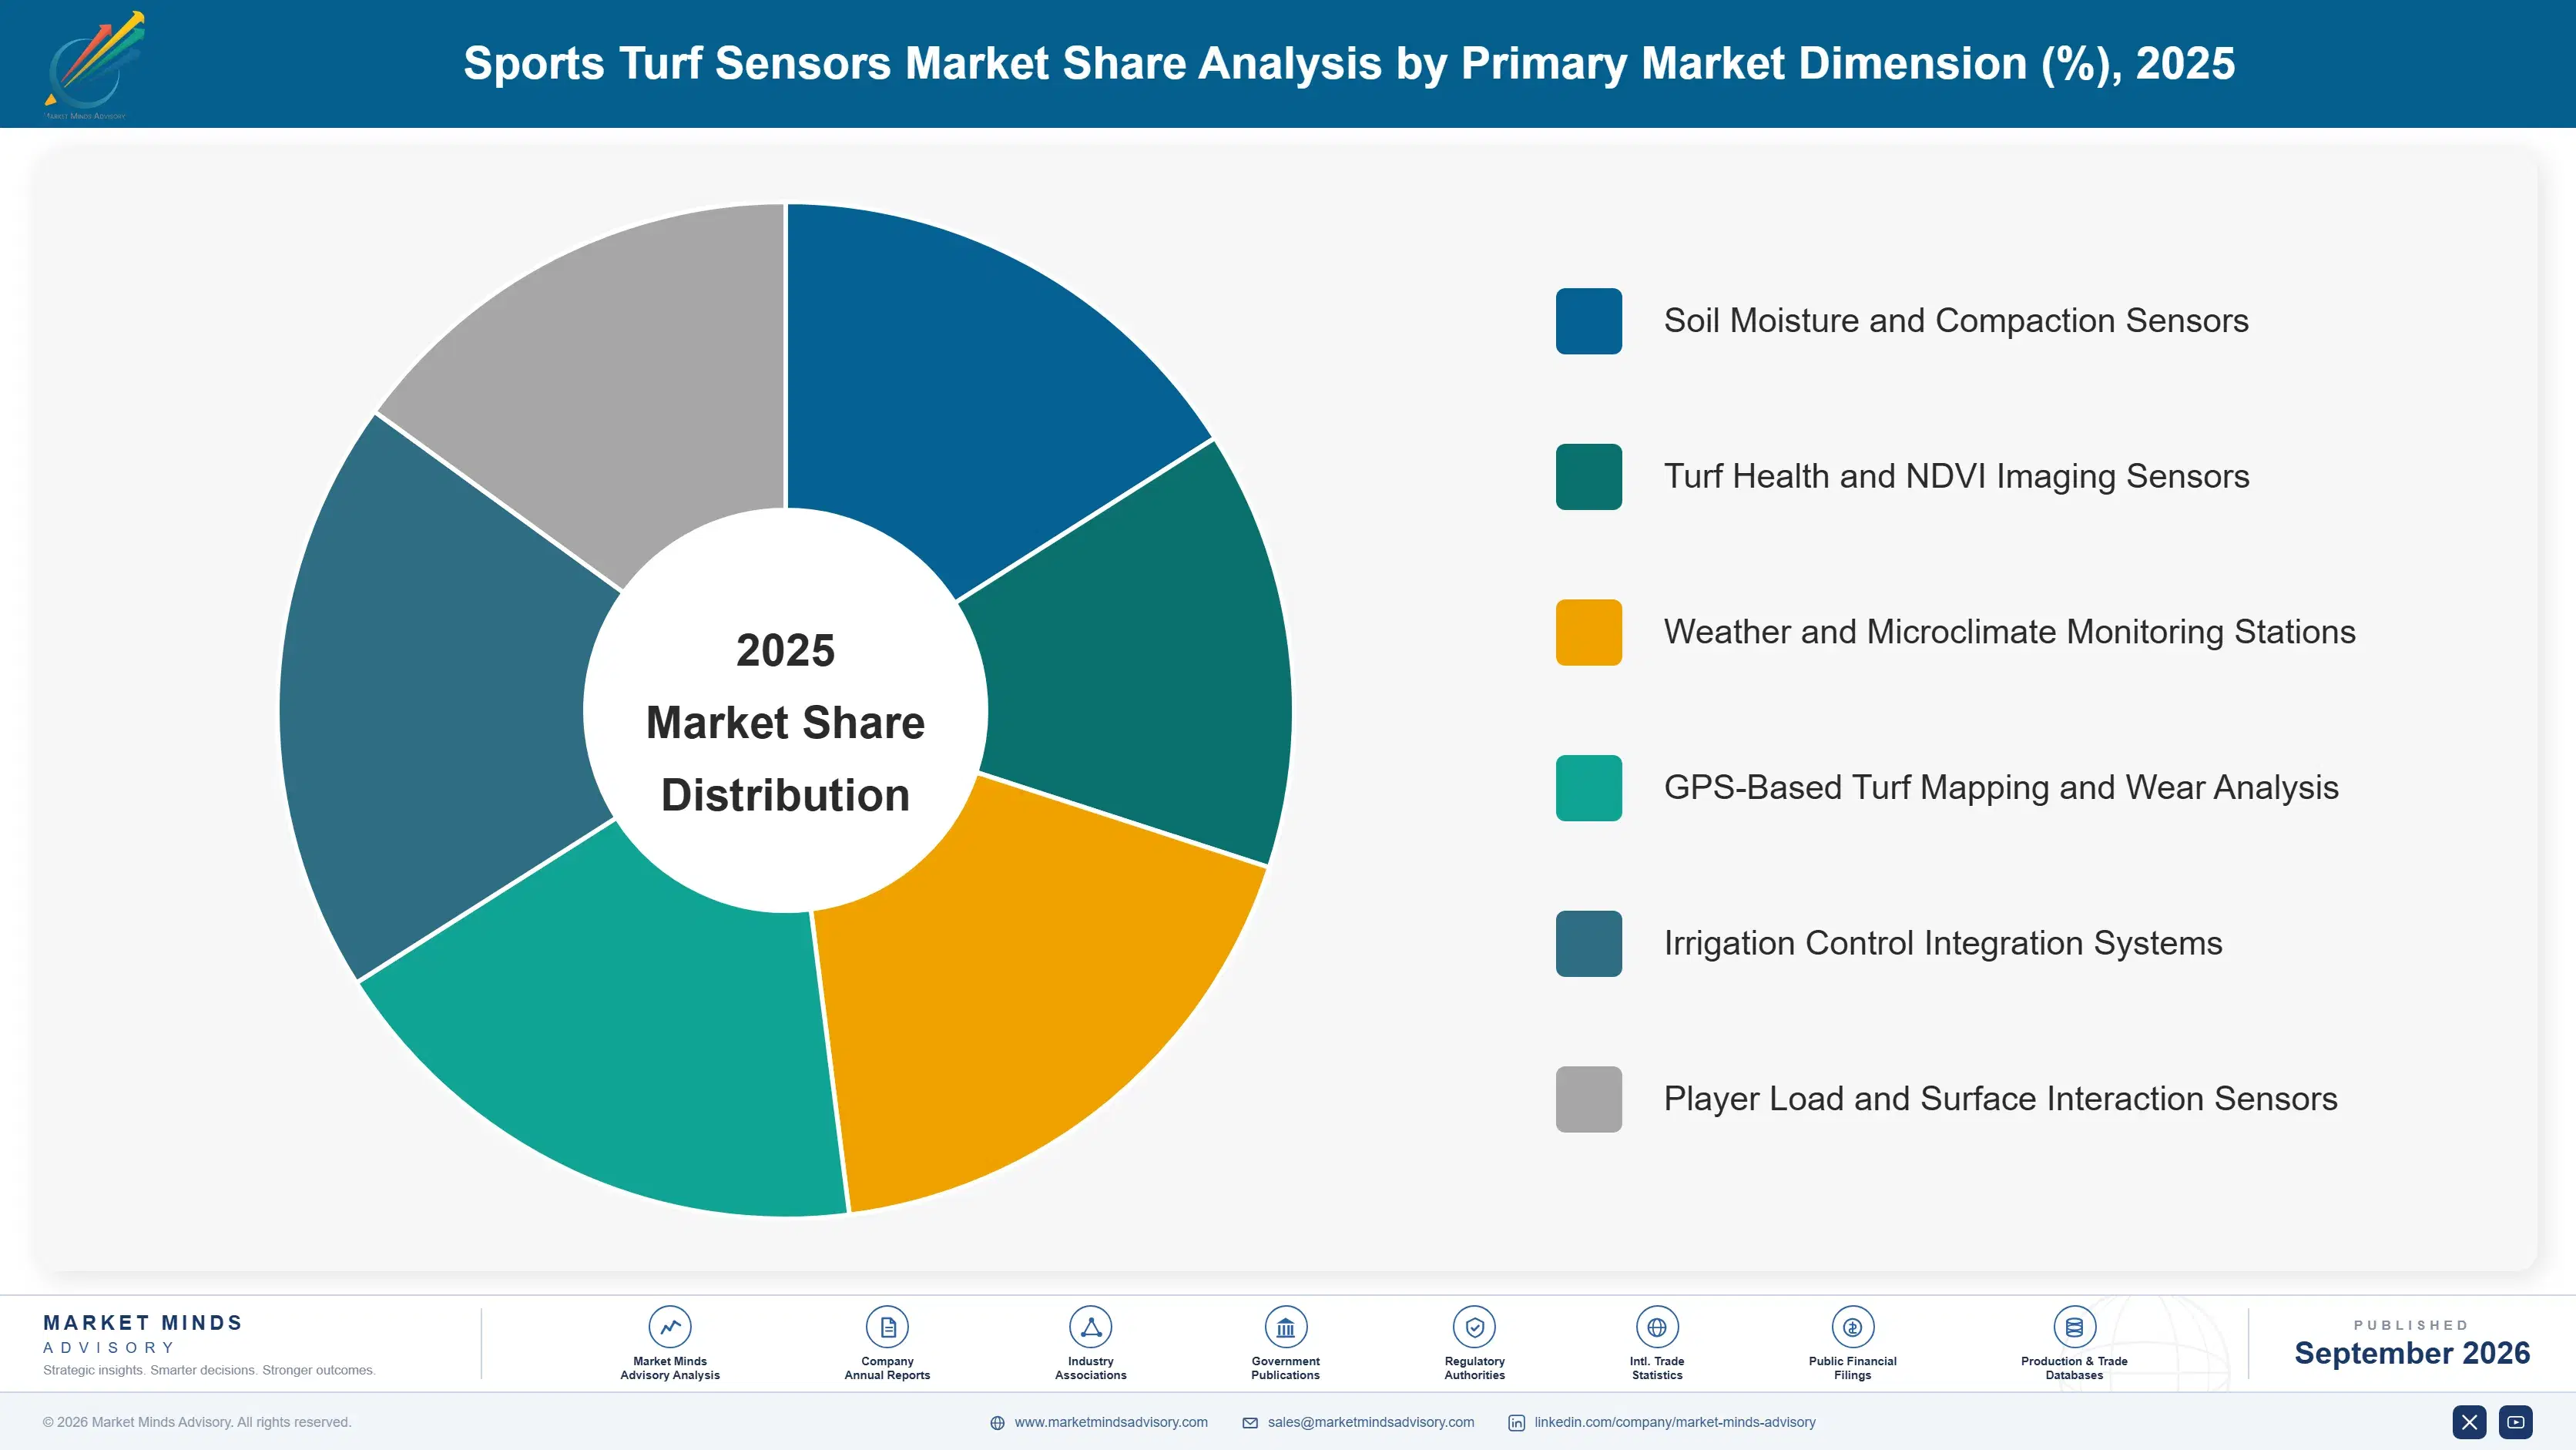
The Sports Turf Sensors Market segments by measurement technology, spanning soil moisture and compaction sensing through NDVI imaging, weather monitoring, and GPS-based wear mapping serving distinct groundskeeping and facility management needs across venue types. Imaging and GPS mapping segments are pulling ahead of basic moisture sensing as venues prioritize earlier stress detection this decade.
sports-turf-sensors-market-market-share-analysis-1788414090527

Turf Health and NDVI Imaging Sensors

Turf health and NDVI imaging sensors represent the fastest-growing segment, expanding at 16.5% annually as elite venues seek earlier warning of vegetation stress invisible to the naked eye before visible turf damage appears on camera during nationally televised matches watched by millions of viewers worldwide each week. This segment benefits directly from falling camera and processing hardware costs that have brought imaging technology within reach of well-funded collegiate programs previously priced out of the category entirely by prohibitive equipment expense. Adoption concentrates among flagship professional stadiums and premium golf courses where broadcast visibility and liability exposure justify the meaningful cost premium imaging carries over basic soil moisture sensing arrays sold today.
CAGR 16.5%

GPS-Based Turf Mapping and Wear Analysis

GPS-based turf mapping and wear analysis systems form the second-fastest segment, growing at 15.0% annually as venues seek precise data on player traffic patterns and surface wear concentration across specific field zones subjected to repeated heavy use throughout each competitive season and lengthy off-season practice periods as well each year. This segment benefits from integration with existing player tracking systems many professional venues already operate for performance analytics, letting groundskeepers correlate wear patterns directly with actual game and practice usage data collected continuously across every single session. Demand concentrates among venues hosting multiple overlapping sports or frequent non-sporting events, where precise wear tracking helps optimize maintenance scheduling between back-to-back bookings efficiently.
CAGR 15.0%
Full segment breakdown across 6 segments available in the complete report.

Regional Architecture and Country Demand Map

North America leads the Sports Turf Sensors Market given its dense concentration of professional stadiums, golf courses, and well-funded collegiate athletic programs found consistently nationwide today, while Western Europe follows closely behind through sustained Premier League and elite football club investment activity spending each year.

North America

The United States hosts the largest concentration of professional sports venues and premium golf courses anywhere in the world, giving domestic manufacturers including The Toro Company, Rain Bird, and POGO Technologies an outsized home market advantage that international competitors struggle to match. Major League Baseball, the National Football League, and the PGA Tour each carry substantial broadcast revenue that creates direct financial incentive for member venues to invest in early-warning sensor systems protecting playing surface quality. Canada contributes a smaller but growing base of demand tied primarily to professional hockey and curling facility ice and turf transition management. This concentration explains why roughly 41% of global sensor deployment revenue originates from United States venues specifically.
Share: 32% | CAGR: 14.5% (2026 to 2036)

Western Europe

Premier League and other top-tier European football clubs increasingly treat playing surface quality as a competitive differentiator, pushing groundskeeping budgets toward sensor networks that flag stress before it affects match outcomes broadcast to global television audiences. The United Kingdom hosts TurfTrax, a specialty GPS turf mapping vendor with deep relationships across English football and horse racing venues that rely on precise surface condition data. Germany and France contribute steady demand tied to Bundesliga and Ligue 1 club facility upgrades following broader European football commercial growth. Growth here trails North America somewhat given smaller golf course density relative to population, though elite club investment intensity remains comparable to top American professional venues overall.
Share: 22% | CAGR: 12.0% (2026 to 2036)
Regional intelligence for 5 additional markets available in the complete report: East Asia, South Asia and Pacific, Latin America, Middle East and Africa, Eastern Europe. Contact sales@marketmindsadvisory.com.
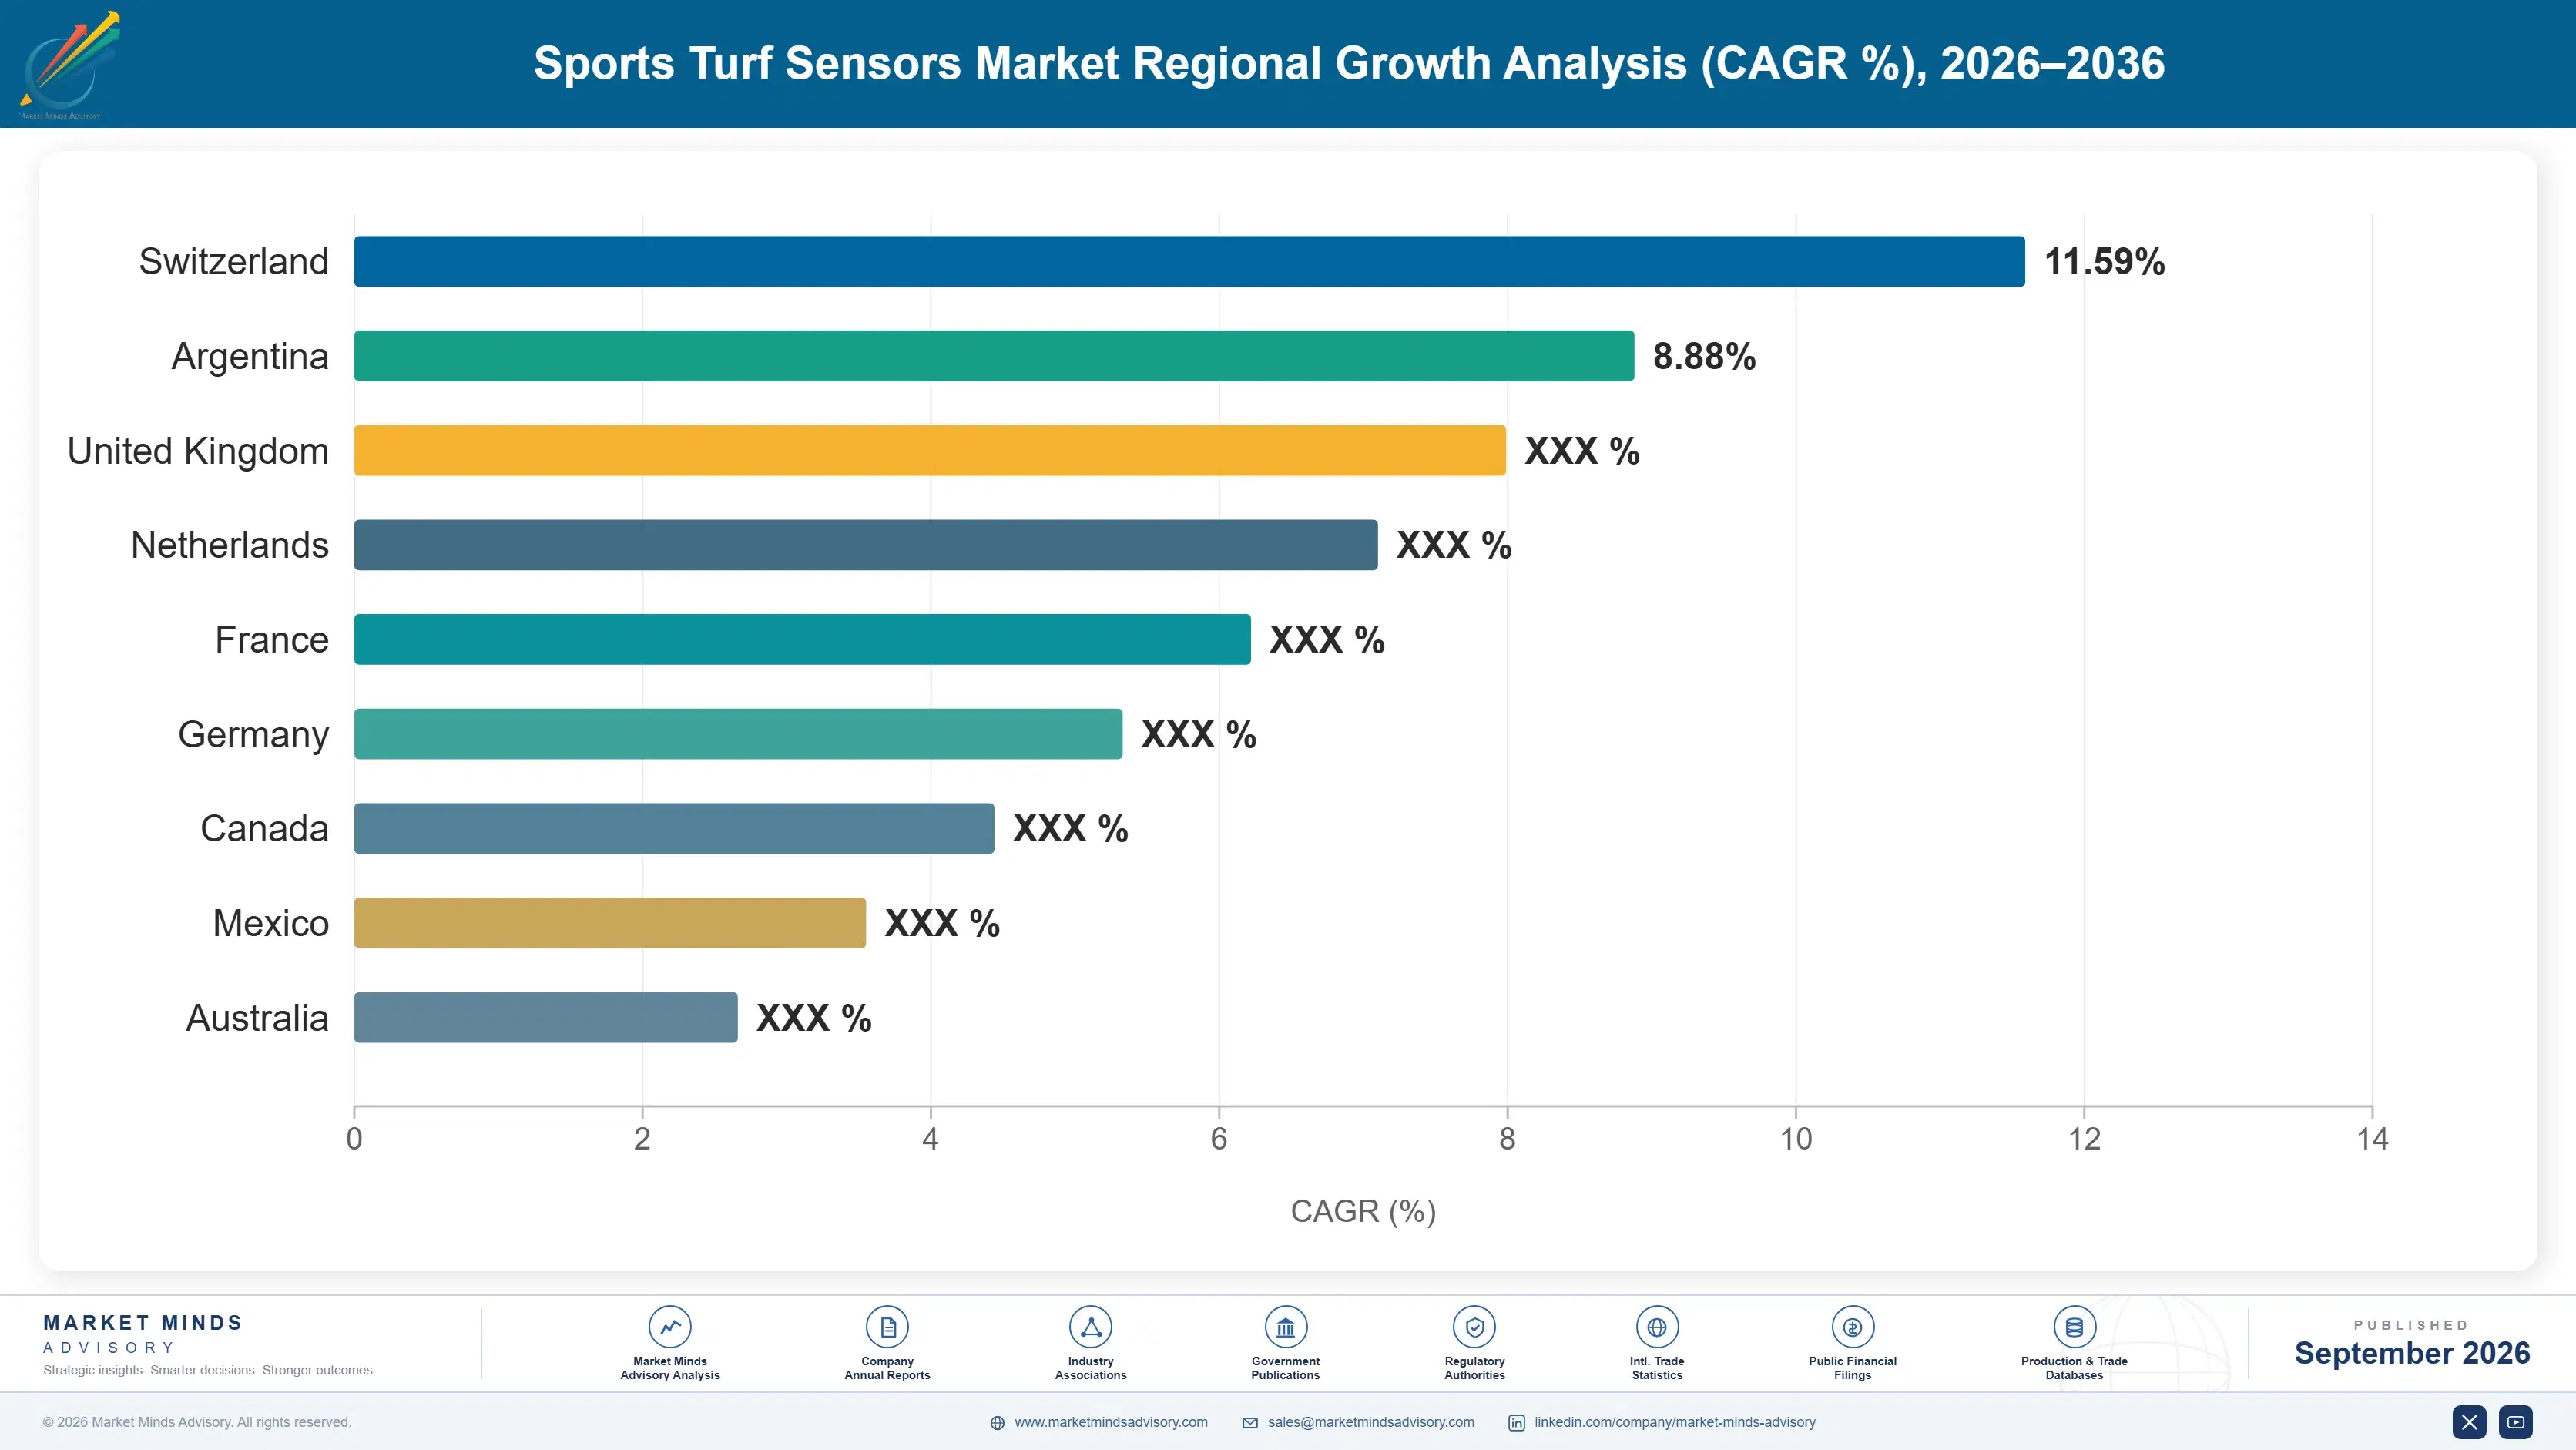
sports-turf-sensors-market-country-cagr-analysis-1788414091045

How Vendors Turn Hardware Into Recurring Contracts

Vendors expand revenue beyond one-time sensor hardware sales by pricing data analytics as an ongoing subscription, bundling installation and calibration services directly into multi-year facility contracts, licensing imaging algorithms out to broader equipment manufacturers, and selling premium groundskeeper training and dedicated technical support packages to elite venues specifically at each annual contract renewal cycle.

Data Analytics Subscriptions for Groundskeeping Recommendations

Vendors increasingly bundle sensor hardware with an ongoing subscription that translates raw moisture and imaging readings into specific, actionable groundskeeping recommendations, since most facility staff lack the technical background to interpret raw sensor output without software assistance guiding daily decisions. Subscription attach rates among new installations now exceed 45%, converting what was historically a single equipment transaction into a recurring revenue relationship with the venue's groundskeeping and facility management staff. This recurring stream generates meaningfully higher lifetime value per installed system than the original hardware sale alone ever did previously, before subscriptions existed.
Market Impact: Analytics subscriptions now reach a 45% attach rate

Bundled Installation and Multi-Year Calibration Contracts

Vendors increasingly bundle professional installation and ongoing sensor calibration service directly into multi-year facility contracts, capturing service revenue that previously went entirely to independent third-party installers unfamiliar with vendor-specific hardware and calibration requirements across different product lines, configurations, and venue types nationwide and internationally. This bundled approach has lifted average contract value by roughly 32% compared to hardware-only sales, since facility managers value having a single accountable vendor responsible for both equipment accuracy and ongoing system upkeep across an entire multi-field campus over its full operational lifetime and service term.
Market Impact: Bundled contracts lift contract value by roughly 32%

Imaging Algorithm Licensing to Equipment Manufacturers

Specialty sensor makers increasingly license their proprietary NDVI imaging analysis algorithms to broader turf equipment manufacturers seeking to embed vegetation health detection into mowers and irrigation controllers rather than building comparable software internally from scratch at considerable expense and delay. This licensing arrangement lets smaller specialty vendors monetize their algorithm development investment well beyond direct hardware sales alone, capturing royalty revenue on every equipment unit shipped by manufacturing partners across multiple product categories and price tiers. Licensing revenue already represents roughly 12% of total specialty vendor revenue currently reported industry-wide.
Market Impact: Algorithm licensing already adds roughly 12% of revenue

Premium Groundskeeper Training and Support Packages

Vendors sell premium training and priority technical support packages specifically to elite venues that cannot tolerate sensor system downtime or groundskeeper misinterpretation of critical data during championship-week preparation windows carrying substantial broadcast stakes and revenue exposure at risk. These packages typically carry gross margins roughly 3 times higher than the underlying hardware sale itself, since actual support call volume runs considerably lower than what venues pay for the confidence these premium packages provide during high-stakes competition weeks each season. Adoption concentrates among flagship venues where broadcast exposure makes any visible turf failure meaningfully costly.
Market Impact: Support packages carry margins roughly 3x hardware margins

Who Controls the Margin Pool

The Toro Company, Rain Bird, METER Group, POGO Technologies, and GreenSight together hold an estimated 38% combined share of tracked revenue, a moderate concentration reflecting the category's continued fragmentation across many smaller specialty players. Toro and Rain Bird lead through existing irrigation equipment relationships that give them direct access to groundskeeping staff, while POGO Technologies and METER Group compete on measurement precision rather than integrated equipment bundling.
Competitive activity centers on imaging capability and data analytics sophistication, since venues increasingly evaluate vendors on how effectively raw sensor readings translate into actionable groundskeeping guidance rather than on hardware specifications alone. Vendors are racing to add NDVI imaging to existing moisture sensing product lines, and several have begun acquiring smaller analytics software companies to close capability gaps quickly rather than building comparable software internally.

Pressure is building from drone-based imaging specialists like GreenSight, which threaten to bypass ground-based sensor networks entirely for imaging-specific use cases requiring only periodic rather than continuous monitoring. Rankings could shift meaningfully if a major irrigation equipment manufacturer acquires a specialty sensor company to bundle comprehensive monitoring directly into its existing distribution and service relationships with groundskeeping staff.
sports-turf-sensors-market-company-positioning-matrix-1788414091565

Competitive Moat and Risk Dimensions

THE TORO COMPANY

Moat: Existing Irrigation Equipment Distribution

Toro's decades-long relationships with groundskeeping staff through its irrigation and turf equipment business give it direct distribution access that specialty sensor-only vendors must build from scratch. This existing channel lets Toro bundle sensor hardware into equipment purchases groundskeepers were already planning to make, reducing the incremental sales friction that pure-play sensor competitors face pitching an entirely new category.
THE TORO COMPANY

Risk: Measurement Precision Perception Gap

Specialty vendors like METER Group and POGO Technologies, who focus exclusively on measurement science, often outperform Toro's sensor offerings on raw accuracy and data resolution according to independent facility manager feedback. If this precision perception gap persists among the most demanding elite venues, Toro risks losing premium contracts to specialists even while retaining broader mainstream share through its distribution advantage.
METER GROUP

Moat: Scientific Measurement Precision Reputation

METER Group built its reputation over decades supplying research-grade soil moisture sensors to academic and agricultural research institutions before entering the sports turf category, giving it a measurement precision credibility that newer entrants cannot easily replicate. This scientific reputation lets METER command premium pricing among elite venues and research-oriented turf management programs that prioritize measurement accuracy over integrated equipment convenience.
METER GROUP

Risk: Limited Distribution Relative to Incumbents

METER Group lacks the existing groundskeeping equipment distribution relationships that Toro and Rain Bird have built over decades, forcing it to compete for attention through direct sales rather than bundled equipment purchases groundskeepers already plan to make. This distribution gap limits METER's addressable market among smaller facilities lacking dedicated procurement staff to evaluate specialty sensor vendors independently.

Players Tracked

Prominent Players

The Toro Company
Rain Bird
METER Group
POGO Technologies
GreenSight

Other Key Players

Hunter Industries
John Deere
Campbell Scientific
Spectrum Technologies
TurfTrax
Baroness
Stevens Water Monitoring Systems
Netafim
Rapid Blue Systems
ETwater
Weathermatic
HydroPoint Data Systems
Sentek Technologies
Irrometer Company
Wiedenmann

Recent Developments

MARCH 2025

The Toro Company acquired a smaller specialty NDVI imaging sensor startup to add vegetation health detection capability to its existing irrigation and moisture sensing product line, addressing rising elite venue demand for imaging technology. The acquisition expands Toro's addressable product portfolio beyond its traditional irrigation equipment core business considerably.
Signal: Confirms incumbent irrigation manufacturers now acquiring imaging capability rather than building it fully internally from scratch.
AUGUST 2025

GreenSight launched a new drone-based imaging service specifically targeting collegiate athletic programs previously priced out of ground-based sensor networks, offering periodic aerial imaging at a fraction of continuous monitoring installation cost. The launch targets budget-constrained facilities seeking imaging benefits without full sensor network capital investment.
Signal: Signals drone-based imaging emerging as a genuinely lower-cost alternative to ground-based continuous sensor networks broadly nationwide.
NOVEMBER 2025

POGO Technologies signed a licensing agreement with a major turf equipment manufacturer to embed its proprietary soil sensing algorithms directly into the manufacturer's mower and irrigation controller product lines, generating royalty revenue on every unit shipped. The agreement reflects growing algorithm licensing activity across the category broadly.
Signal: Marks specialty sensor vendors monetizing algorithm development through licensing rather than direct hardware sales alone increasingly.

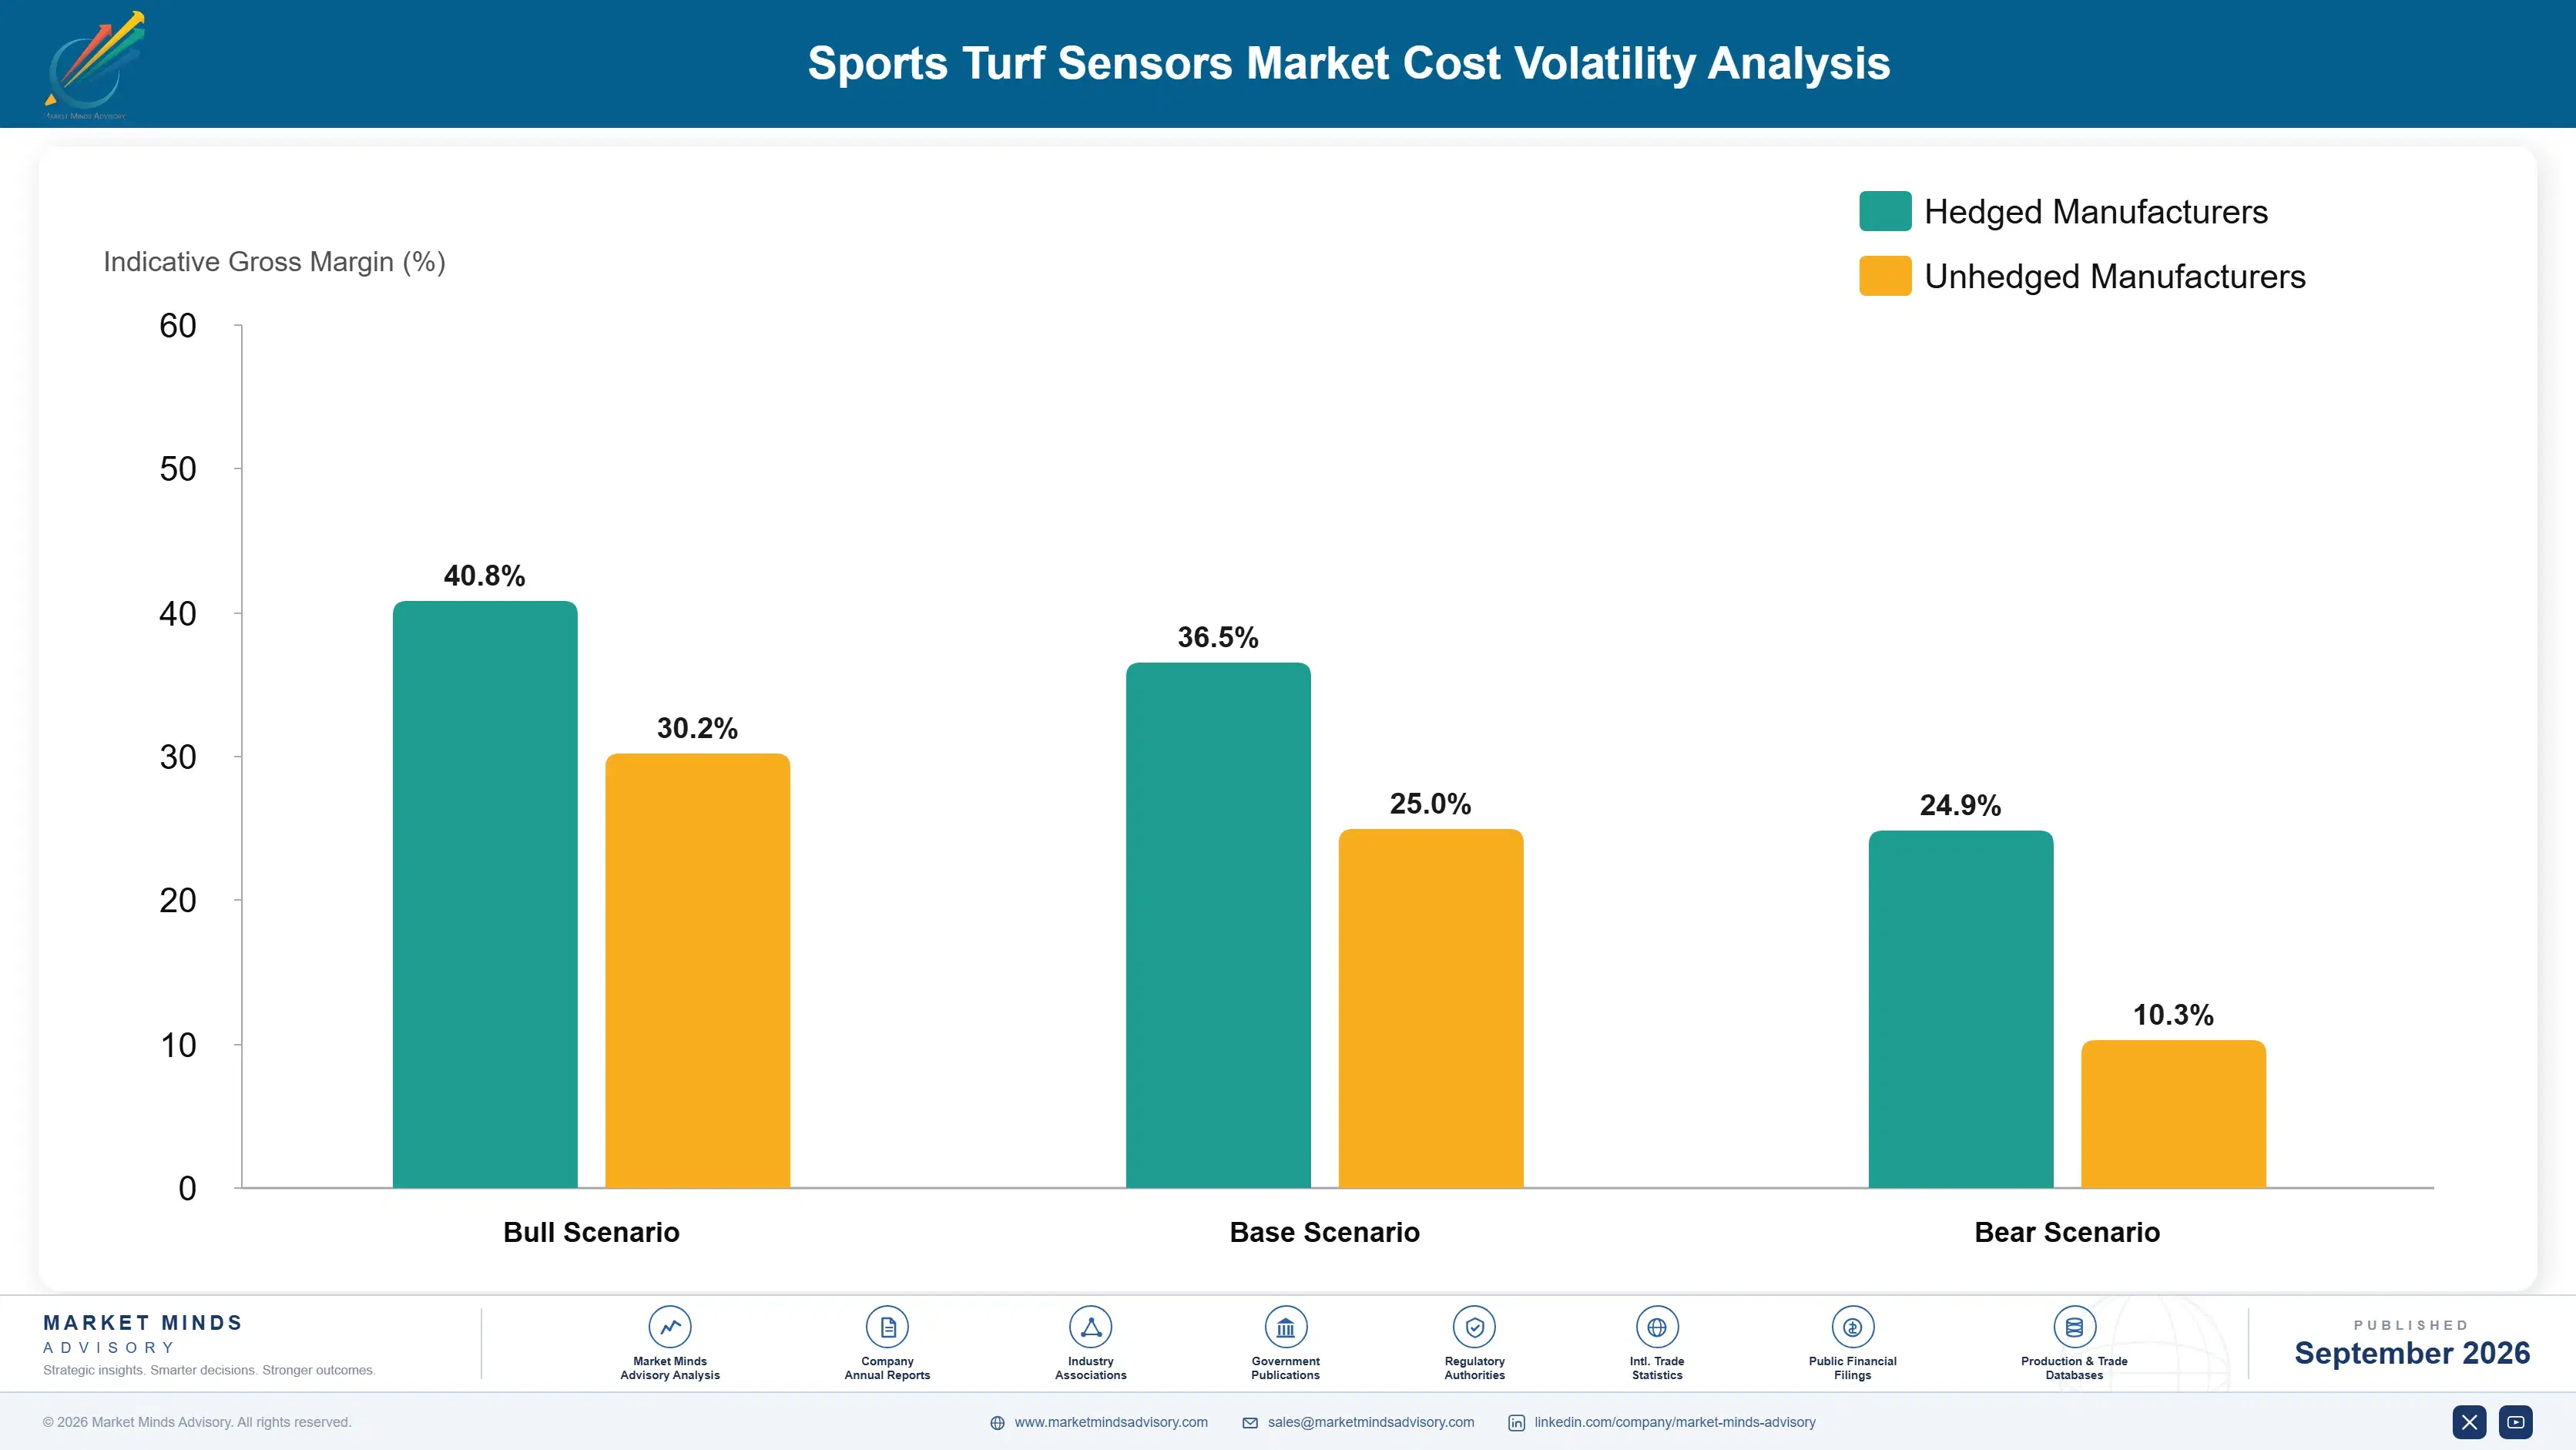
Precision Sensor Component Cost Exposure

Sports turf sensor manufacturers carry a components-driven cost structure typical of specialty environmental hardware: precision measurement chips and imaging sensors represent roughly 35% to 45% of unit cost, with the remainder split between wireless connectivity modules, weatherproof enclosures, and calibration labor performed carefully before shipment to demanding elite venue customers who expect consistently reliable accuracy.
Semiconductor supply disruptions during 2021 and 2022, documented across the broader electronics sector in company annual reports, forced several sensor manufacturers to substitute alternative measurement chip suppliers at meaningfully higher unit cost or delay installation schedules during peak shortage periods affecting elite venue commitments. One manufacturer disclosed component cost increases exceeding 20% during the worst months of the shortage, a margin hit that took several quarters to fully pass through given existing multi-year facility contracts already signed at fixed pricing.

Smaller specialty vendors without direct semiconductor supplier relationships face a durable cost disadvantage against larger manufacturers like Toro who negotiate component pricing across a much broader product portfolio spanning irrigation equipment beyond sensors alone. This dynamic concentrates pricing power among diversified equipment manufacturers even as measurement precision and imaging quality remain genuinely distributed across many smaller specialty competitors serving particular niche use cases.
sports-turf-sensors-market-cost-volatility-analysis-1788414091762

Multi-Source Sensor Chip Qualification

Manufacturers increasingly qualify multiple alternative measurement chip and imaging sensor suppliers well in advance of any actual shortage, letting them switch sourcing quickly without redesigning circuit boards or requalifying finished products for accuracy certification. This approach adds modest upfront engineering cost but meaningfully reduces exposure to any single supplier's capacity constraints during future disruptions.

Portfolio Diversification Beyond Pure Sensor Sales

Larger manufacturers diversify component purchasing across a broader equipment portfolio spanning irrigation controllers, mowers, and sensors combined, letting them negotiate better component pricing than pure-play sensor vendors purchasing at smaller individual volumes across fewer product lines. This approach favors diversified manufacturers with existing equipment businesses over sensor-only startups lacking comparable purchasing scale and negotiating leverage.

Portfolio Architecture for Margin Defence

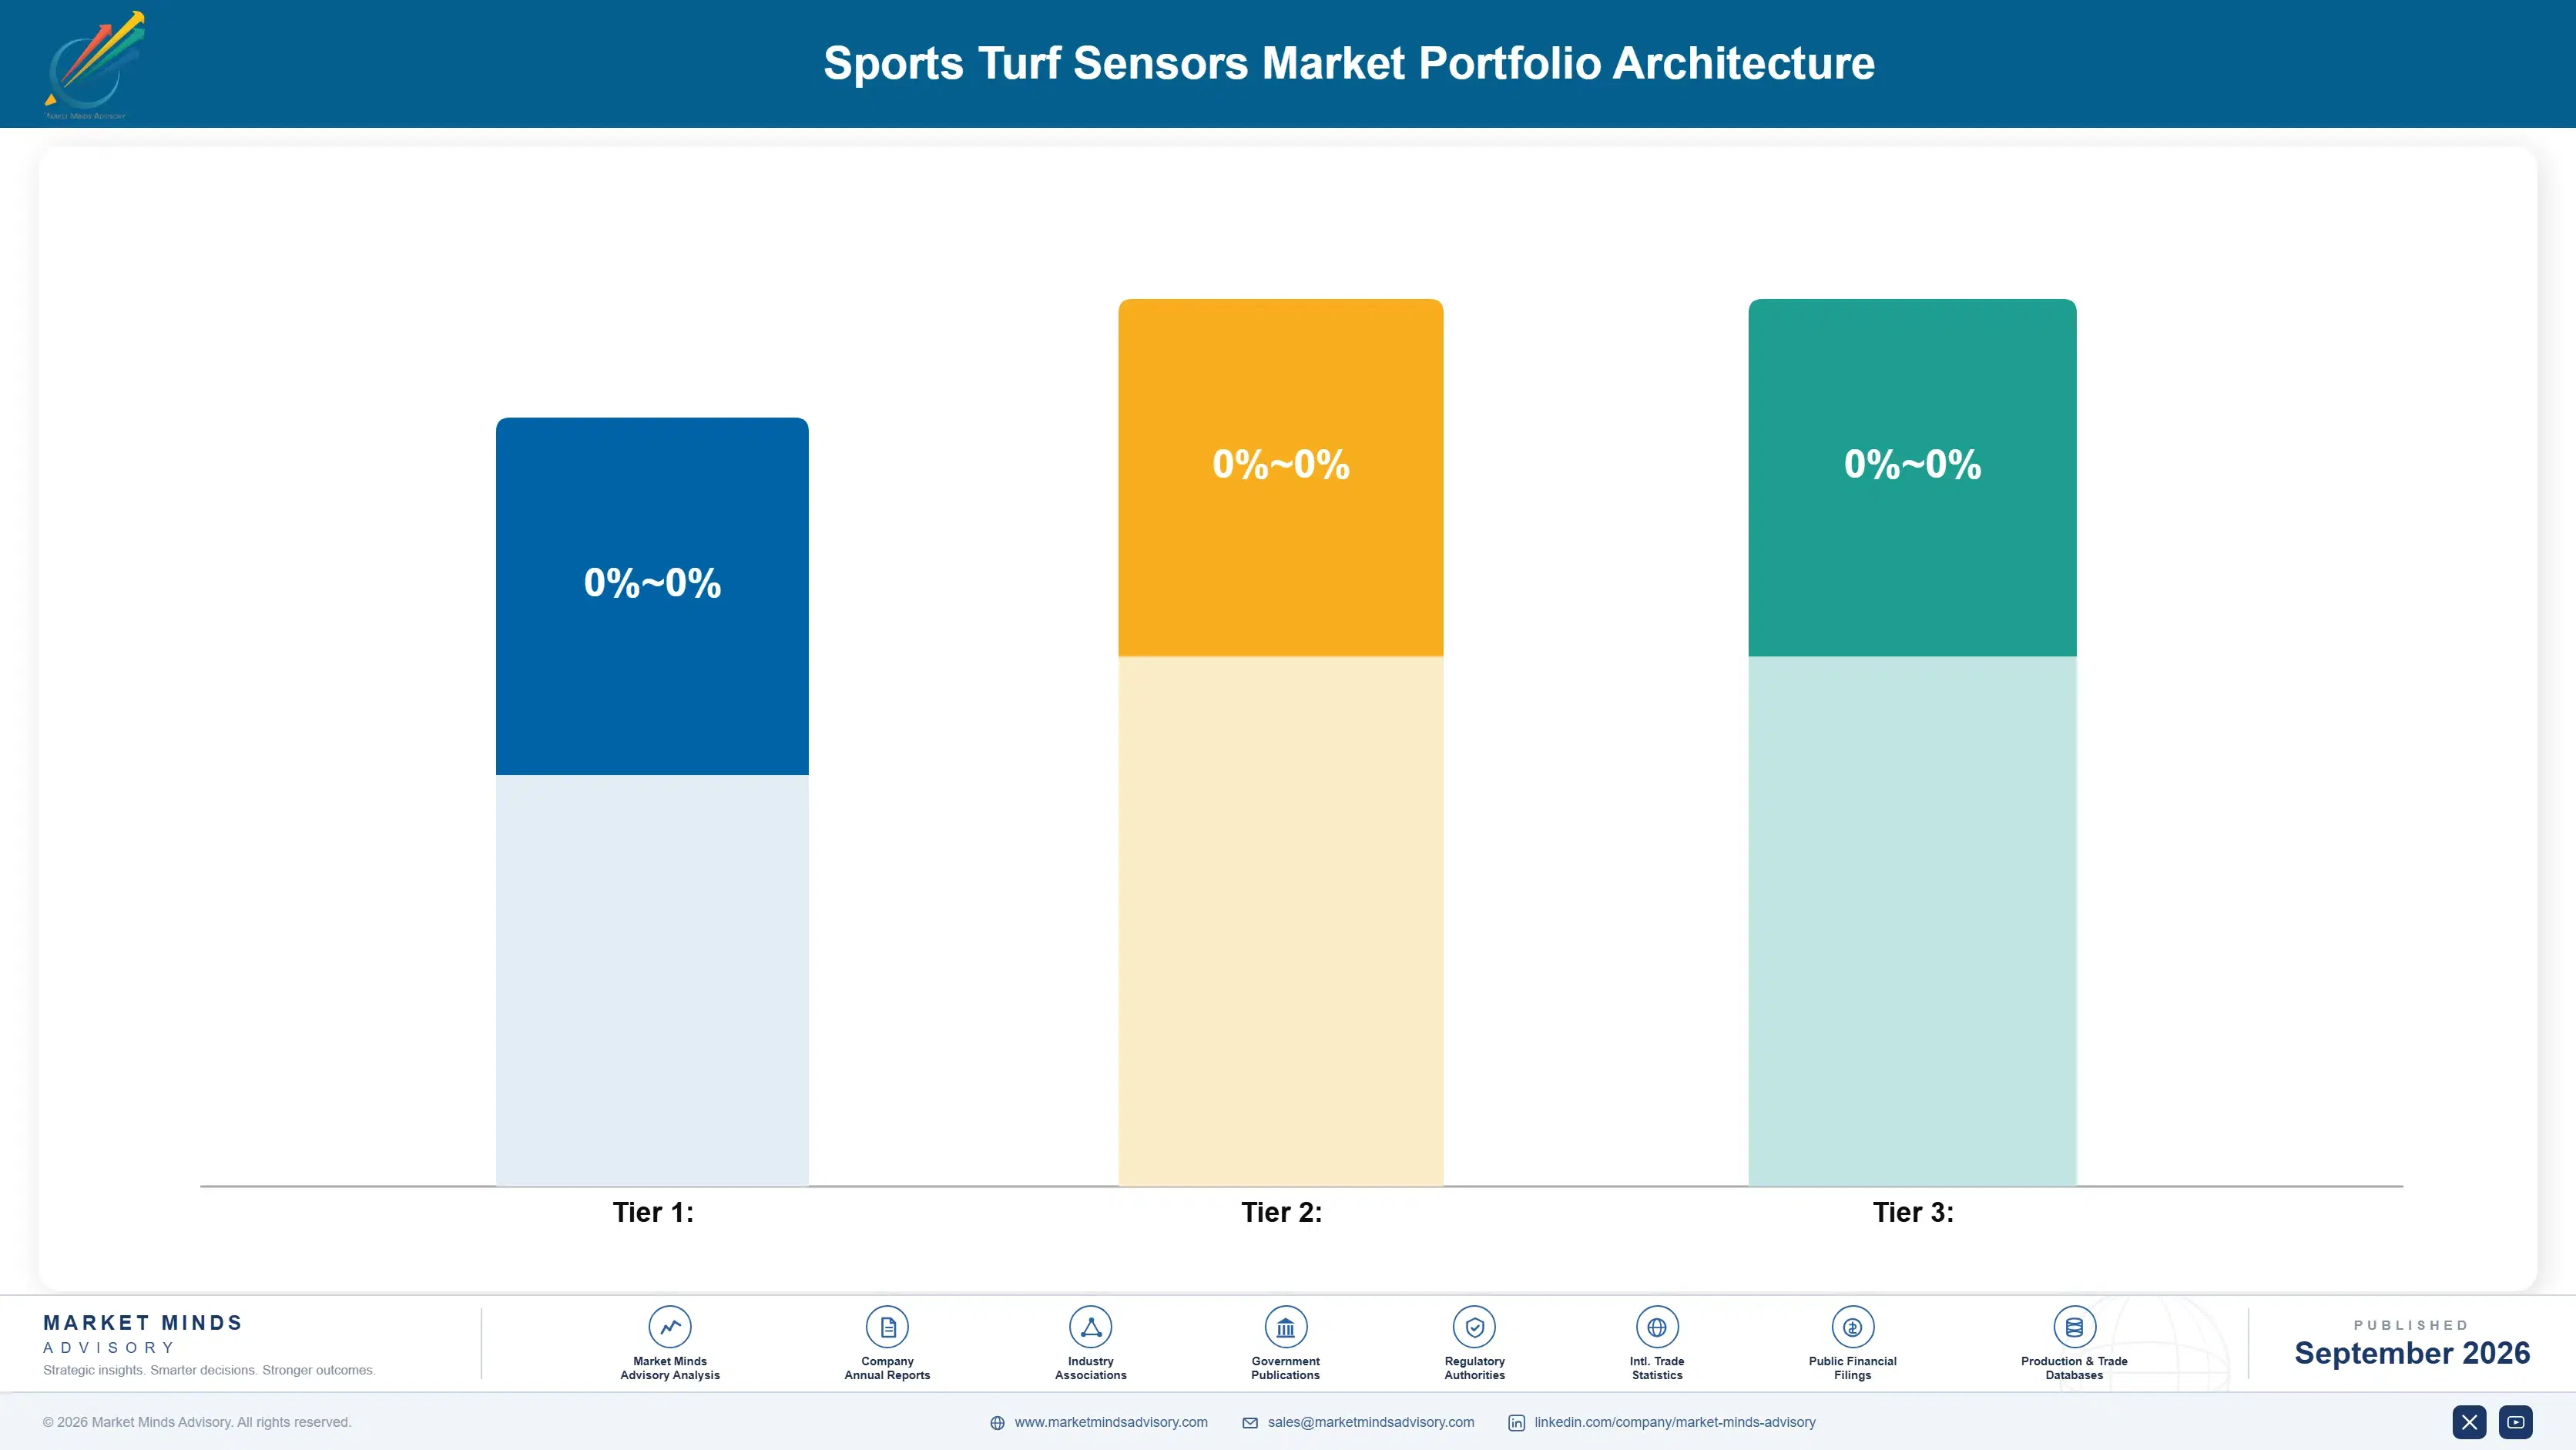
Sports turf sensor revenue organizes into three commercially distinct tiers separated by measurement sophistication and venue budget rather than by manufacturer size alone. Volume tiers cover basic moisture sensing sold to budget-conscious municipal and collegiate facilities, while premium tiers add NDVI imaging and analytics subscriptions. The newest tier bundles algorithm licensing and premium support commanding the steepest margins across the category.
Gross margins vary considerably across tiers because basic moisture sensors face price competition from generic agricultural sensor makers entering the category, while imaging and analytics components carry software elements that scale at near-zero marginal cost once developed. Premium and next-generation tiers therefore capture disproportionate profit relative to their share of total unit shipment volume across the broader category.

High-value pools concentrate overwhelmingly in elite venue contracts bundling imaging, analytics subscriptions, and premium support rather than in commodity basic moisture sensing, which faces mounting price pressure from generic agricultural sensor competitors entering the category. The volume tier remains essential for maintaining overall market presence and brand visibility among budget-constrained facilities, but incremental profit growth increasingly comes from premium tier expansion and recurring subscription revenue rather than additional hardware unit sales alone.

Basic soil moisture sensing sold to budget-conscious municipal and collegiate facilities facing generic agricultural sensor competition, priced to maximize adoption volume with gross margins in the 25% to 35% range.
Gross Margin

NDVI imaging and analytics subscription bundles sold to elite professional and collegiate venues, carrying gross margins between 45% and 55% as recurring subscription revenue supplements the initial hardware sale meaningfully.
Gross Margin

Algorithm licensing and premium training and support packages commanding gross margins above 60% because software and service components carry near-zero marginal cost once initial development is fully complete and certified.
Gross Margin
sports-turf-sensors-market-portfolio-architecture-1788414092257

High-value Sub-segments and Strategic Watch-out

Turf Health and NDVI Imaging Sensors

High-value and high-growth, this segment combines the fastest expansion rate in the market with the steepest pricing premiums as broadcast scrutiny pushes elite venues toward earlier vegetation stress detection technology adoption nationwide, a trend expected to continue and even accelerate meaningfully for years to come.

GPS-Based Turf Mapping and Wear Analysis

High-value with moderate growth, GPS mapping systems capture meaningful pricing premiums through player tracking integration even though adoption trails the fastest imaging segment considerably across most tracked venue types currently evaluated in this study, one published in July 2026 for industry reference and planning purposes.

Soil Moisture and Compaction Sensors

Volume core of the market, basic moisture sensing remains the largest segment by unit shipment and the primary entry point for new facilities, though pricing power here continues eroding steadily each passing year as competition intensifies across most regions, venue categories, and facility budget tiers covered.

Player Load and Surface Interaction Sensors

Strategic watch-out segment, growing steadily as venues seek to correlate player injury risk with surface condition data, but facing uncertain long-term differentiation as broader player tracking platforms expand aggressively into this adjacent space over time and well beyond that distant competitive horizon entirely and permanently.

The Recurring Value of Sensor Contracts

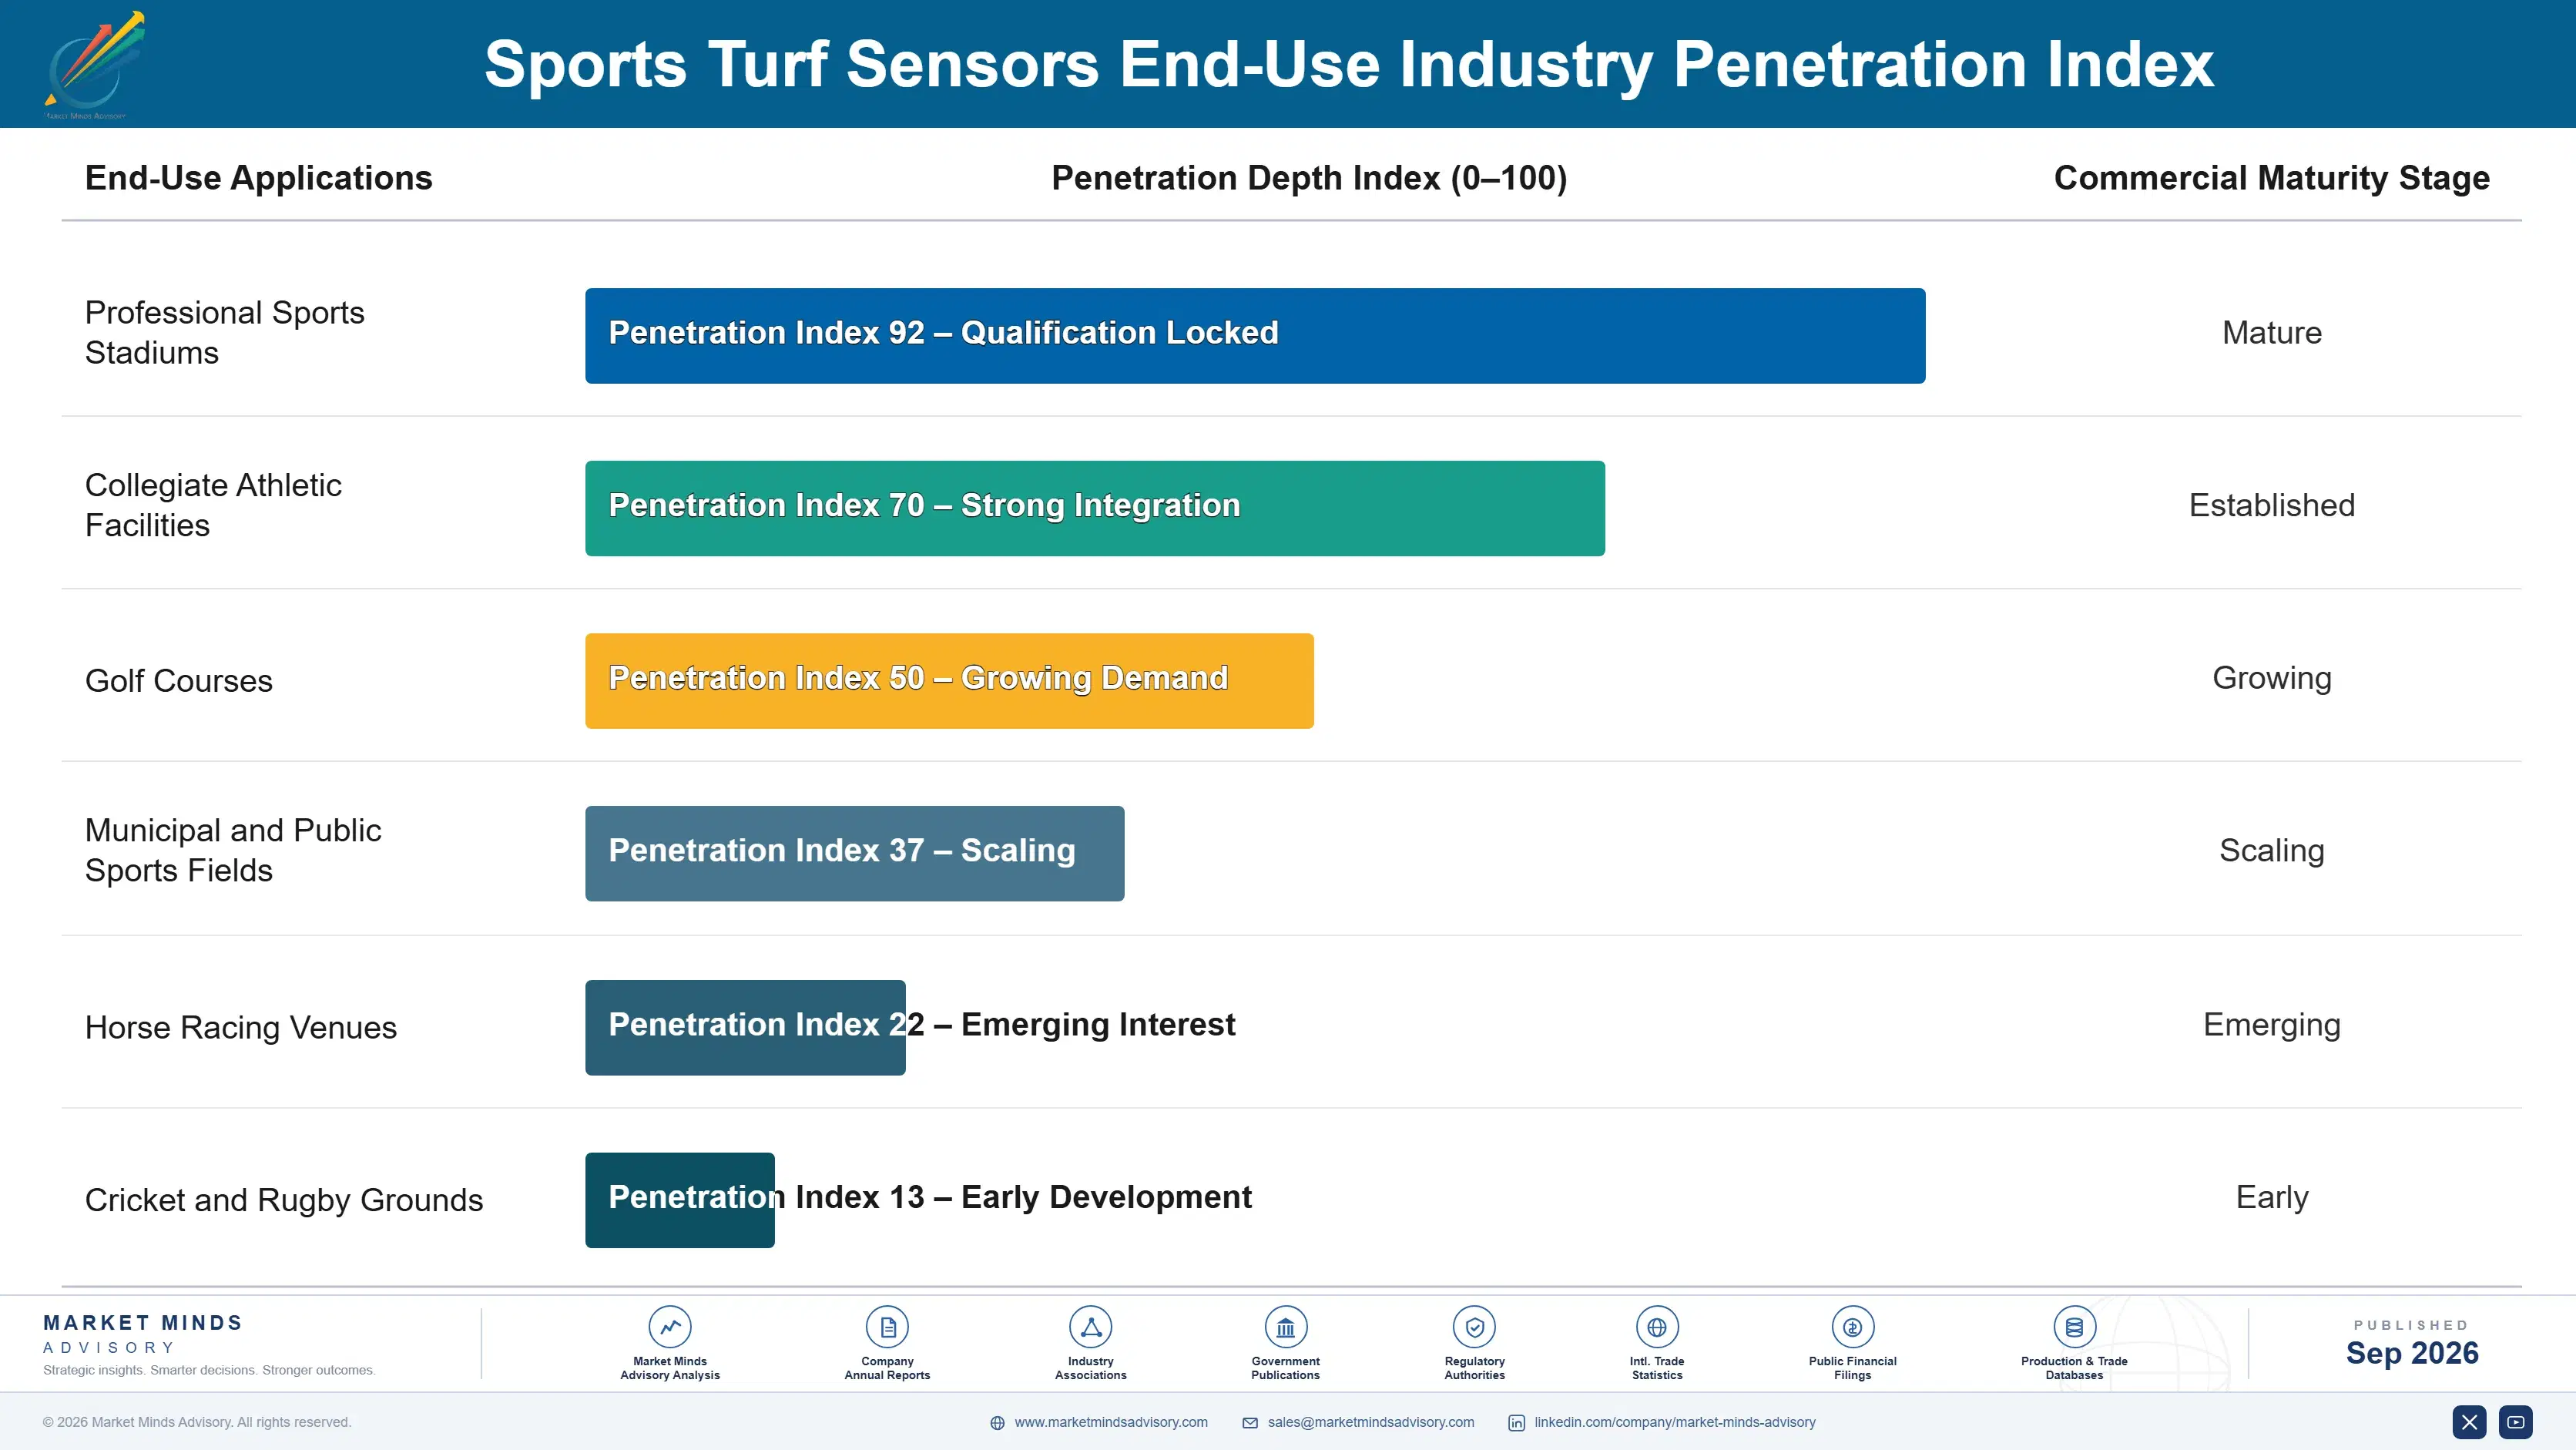
Sports turf sensor revenue increasingly behaves like an annuity once analytics subscriptions and calibration contracts attach to the initial hardware sale, since venues rarely churn given the switching cost of replacing installed field-wide sensor infrastructure entirely across multiple playing surfaces. Subscription renewal rates already exceed 70% at annual renewal points, reflecting how deeply these recurring services embed into daily groundskeeping operations and decision-making routines.
Adoption stickiness varies considerably by end-use vertical across the category. Elite professional stadiums show the deepest dependency given broadcast liability stakes and dedicated groundskeeping technical staff capable of fully using sensor data, while municipal and lower-division facilities show shallower engagement since limited staff often lack the training to interpret complex sensor output without ongoing vendor support and hands-on guidance provided regularly throughout the season.

A generational shift is underway in who manages these systems day to day. Facility groundskeeping staff increasingly include dedicated data-literate technicians alongside traditional turf management veterans who built their expertise through decades of hands-on field experience. Younger groundskeeping staff with technology backgrounds are gradually displacing longtime turf veterans in sensor-related purchasing and interpretation decisions, reflecting the category's genuinely evolving technical and commercial logic.
sports-turf-sensors-market-end-use-penetration-index-1788414092738

Where Vendors Should Focus Investment

These are among the four positions where our research anticipates prominent divergence between winners and laggards over the coming forecast period. Each is grounded in the demand model, the regulatory perimeter, and the announced capacity pipeline.
01 / IMAGING INVESTMENT TIMING

Adopt NDVI imaging before broadcast incidents force reactive spending

Elite venues that wait for a visible turf failure during a nationally televised match to justify imaging investment consistently pay a reputational cost that proactive adopters avoid entirely by catching stress before it becomes visible. Vendors and venues alike should treat imaging adoption as a proactive risk management decision tied to broadcast exposure level rather than a reactive purchase triggered only after a public failure. This positioning matters most for venues carrying the heaviest broadcast revenue and corresponding reputational exposure.
02 / SUBSCRIPTION ATTACH STRATEGY

Prioritize analytics subscription attach over pure hardware unit sales

Analytics subscriptions already generate meaningfully higher lifetime value per installed system than the original hardware transaction alone across most tracked venue categories. Yet many vendors still measure commercial success primarily through unit shipment volume rather than subscription attach and retention rates that better predict long-term revenue durability. Vendors should restructure sales incentives around maximizing subscription attach at the point of hardware sale, since this recurring stream proves far more resilient during budget-constrained facility procurement cycles than one-time hardware transactions alone ever could.
03 / GROUNDSKEEPER TRUST BUILDING

Invest in training programs to overcome veteran staff skepticism

Veteran groundskeepers with decades of intuitive field experience often distrust sensor readings that contradict their own assessment, creating internal resistance that can leave expensive installed hardware underutilized long after purchase and installation are already fully complete and paid for. Vendors should invest in simplified dashboards and on-site training programs specifically designed to build groundskeeper confidence gradually rather than assuming installation alone guarantees full data adoption across the entire staff. This investment directly protects the lifetime value of every hardware sale made.
04 / BUDGET-TIER PRODUCT DEVELOPMENT

Build simplified lower-cost tiers to expand beyond elite venues

Elite venue penetration alone cannot sustain double-digit category growth indefinitely, since municipal and collegiate facilities represent a far larger addressable venue count than the flagship stadiums currently driving most category revenue today and each season. Vendors should develop simplified, lower-cost product tiers specifically targeting budget-constrained facilities lacking broadcast revenue to justify premium pricing, since this segment represents the primary path toward sustained long-term category growth beyond elite venues. This strategy requires considerable patience given the slower budget cycles typical of public facilities.

Engagement Snapshot From the Field

A live engagement with an industry participant carrying material or product regulatory and market exposure ahead of a defining policy shift, showing how our research translates into a defensible multi-year portfolio strategy.
MARKET MINDS ADVISORY · CLIENT ENGAGEMENT SUMMARY
Sports Turf Sensors Producer Strategic Portfolio Review and Transition Roadmap 2026·Investment Scenario on Sports Turf Sensors Exposure Evaluation 2025-26
CLIENT PROFILE
A Major League Baseball franchise managing its home stadium field and two minor league affiliate facilities had relied entirely on manual soil testing and veteran groundskeeper judgment for many long decades, facing rising pressure from league officials after a widely publicized playing surface incident affected a nationally televised postseason game earlier during that previous year.
STRATEGIC CHALLENGE
Leadership needed to justify a substantial capital investment in sensor infrastructure to team ownership while facing skepticism from veteran groundskeeping staff who had successfully managed the field for many decades using intuitive judgment and manual inspection methods alone, without any networked sensor systems ever previously installed anywhere in the organization.
MMA APPROACH
MMA benchmarked five candidate vendors against the franchise's specific requirements for imaging capability, integration with existing player tracking infrastructure already installed, and groundskeeper training support, then carefully modeled expected liability risk reduction and broadcast reputation protection value across a full five-year sensor deployment scenario covering all three separate team facilities.
KEY FINDINGS
  1. Veteran groundskeeping staff resistance softened considerably once training demonstrated sensor data confirmed rather than contradicted their existing field intuition (client-reported, unverified by MMA) most of the time.
  2. Imaging-equipped sensor systems detected early vegetation stress in a specific outfield zone weeks before it would have become visible to the naked eye (client-reported, unverified by MMA) otherwise.
  3. Integration with existing player tracking infrastructure let groundskeepers correlate specific wear patterns directly with actual game usage data collected during the season (client-reported, unverified by MMA) continuously.
  4. The franchise's minor league affiliate facilities received simplified, lower-cost sensor tiers appropriate to their smaller maintenance budgets and staffing levels (client-reported, unverified by MMA) compared to the flagship stadium.
CLIENT PROFILE
A Major League Baseball franchise managing its home stadium field and two minor league affiliate facilities had relied entirely on manual soil testing and veteran groundskeeper judgment for many long decades, facing rising pressure from league officials after a widely publicized playing surface incident affected a nationally televised postseason game earlier during that previous year.
STRATEGIC CHALLENGE
Leadership needed to justify a substantial capital investment in sensor infrastructure to team ownership while facing skepticism from veteran groundskeeping staff who had successfully managed the field for many decades using intuitive judgment and manual inspection methods alone, without any networked sensor systems ever previously installed anywhere in the organization.
MMA APPROACH
MMA benchmarked five candidate vendors against the franchise's specific requirements for imaging capability, integration with existing player tracking infrastructure already installed, and groundskeeper training support, then carefully modeled expected liability risk reduction and broadcast reputation protection value across a full five-year sensor deployment scenario covering all three separate team facilities.
KEY FINDINGS
  1. Veteran groundskeeping staff resistance softened considerably once training demonstrated sensor data confirmed rather than contradicted their existing field intuition (client-reported, unverified by MMA) most of the time.
  2. Imaging-equipped sensor systems detected early vegetation stress in a specific outfield zone weeks before it would have become visible to the naked eye (client-reported, unverified by MMA) otherwise.
  3. Integration with existing player tracking infrastructure let groundskeepers correlate specific wear patterns directly with actual game usage data collected during the season (client-reported, unverified by MMA) continuously.
  4. The franchise's minor league affiliate facilities received simplified, lower-cost sensor tiers appropriate to their smaller maintenance budgets and staffing levels (client-reported, unverified by MMA) compared to the flagship stadium.
RECOMMENDED STRATEGY
Phase 1: Phase one installed full imaging-equipped sensor coverage at the flagship stadium ahead of the following season's opening day and home opener. Phase 2: Phase two rolled out simplified moisture sensing tiers at both minor league affiliate facilities within that very same calendar year. Phase 3: Phase three established an ongoing groundskeeper training program to build staff confidence in sensor-driven maintenance recommendations gradually over the season.
OUTCOME
The franchise avoided any repeat playing surface incidents through the following two full seasons and reported measurably improved groundskeeper confidence in sensor-driven recommendations overall (client-reported, unverified by MMA), while extending simplified sensor tiers to all remaining affiliate facilities across the entire organization structure and staff.

Frequently Asked Questions

Foundational context covering the market sizes, CAGR, scope, country, region and competition that inform every finding below. This section is provided to cover basics and most often pre-purchase conversations, answered from the MMA Primary Research Dataset.

What is the current size of the Sports Turf Sensors Market?

The Sports Turf Sensors Market reached an estimated $0.35 billion in global revenue in 2025. This figure covers hardware and connected sensor systems monitoring soil moisture, turf health, and surface wear at athletic venues.

How large will the Sports Turf Sensors Market be by 2036?

MMA projects the market will reach approximately $1.41 billion by 2036, driven mainly by NDVI imaging adoption and expanding subscription analytics revenue. That represents roughly a 3.55 fold expansion from 2026 levels.

What is the CAGR for the Sports Turf Sensors Market 2026 to 2036?

The market is forecast to grow at a 13.5% compound annual rate between 2026 and 2036. Bull and bear scenarios range between roughly 12.2% and 14.8% depending on elite venue investment pace.

Which segment is growing fastest?

Turf health and NDVI imaging sensors lead all segments, expanding at an estimated 16.5% annually. That is well above the overall market's 13.5% average growth rate through the forecast period to 2036.

Who are the major companies in the Sports Turf Sensors Market?

The Toro Company, Rain Bird, METER Group, POGO Technologies, and GreenSight form the five leading vendors tracked in this report. Together they hold an estimated 38% combined share of tracked revenue as of 2025.

Which country is growing fastest?

The United States posts the fastest national growth rate in the study, expanding at an estimated 15.5% annually. Its dense concentration of professional stadiums and golf courses drives unusually rapid sensor adoption there.

Report Segmentation Architecture

The full report scope spans multiple orthogonal segmentation dimensions, with cross-tabulated demand data provided for each dimension pair. Coverage extends further to regional breakdowns, trend trajectories, and the competitive detail needed to support segment-level decision-making.

By Primary Market Dimension

  • Soil Moisture and Compaction Sensors
  • Turf Health and NDVI Imaging Sensors
  • Weather and Microclimate Monitoring Stations
  • GPS-Based Turf Mapping and Wear Analysis
  • Irrigation Control Integration Systems
  • Player Load and Surface Interaction Sensors

By End-Use Industry

  • Professional Sports Stadiums
  • Collegiate Athletic Facilities
  • Golf Courses
  • Municipal and Public Sports Fields
  • Horse Racing Venues
  • Cricket and Rugby Grounds

By Commercial Dimension

  • Direct Venue Procurement
  • Equipment Manufacturer Bundling
  • Analytics Subscription Contracts
  • Third-Party Installer Distribution

By Region

  • North America
  • Western Europe
  • East Asia
  • South Asia and Pacific
  • Latin America
  • Middle East and Africa
  • Eastern Europe

Scope, Methodology, and Coverage

Every figure in this report is reproducible from documented input assumptions. The scope below maps the historical period, the forecast horizon, the segmentation dimensions, and the countries covered, alongside the underlying primary and qualitative methodology.
Historical Period
2020 to 2025
Forecast Period
2026 to 2036
Base Year
2025 (USD billions; MMA Primary Research Dataset, September 2026)
Market Definition
The Sports Turf Sensors Market covers hardware and connected sensor systems that monitor soil moisture, compaction, turf health, weather, and surface wear on athletic fields and golf courses, measured by device and subscription revenue. It excludes general agricultural soil sensors sold for row-crop farming and standalone irrigation controllers lacking dedicated turf condition sensing capability.
Quantitative Units
USD Billion, CAGR (%), Share (%), 2020 to 2036
Segmentation Dimensions
By Primary Market Dimension; By End-Use Industry; By Commercial Dimension; By Region
Regions Covered
North America, Western Europe, East Asia, South Asia and Pacific, Latin America, Middle East and Africa, Eastern Europe
Countries Covered
United States, Canada, United Kingdom, Germany, France, Japan, China, South Korea, Australia, India, Thailand, Vietnam, Brazil, Argentina, Mexico, United Arab Emirates, Saudi Arabia, Qatar, South Africa, Poland, Russia, Ukraine, and additional markets relevant to this sector.
Key Companies Profiled
The Toro Company, Rain Bird, METER Group, POGO Technologies, GreenSight, Hunter Industries, John Deere, Campbell Scientific, Spectrum Technologies, TurfTrax, Baroness, Stevens Water Monitoring Systems, Netafim, Rapid Blue Systems, ETwater, Weathermatic, HydroPoint Data Systems, Sentek Technologies, Irrometer Company, Wiedenmann
Quantitative Methodology
Primary survey, n=3,800 respondents, Q4 2025, six countries; demand-side model with trade association cross-validation
Qualitative Methodology
47 expert interviews, Q4 2025; applied to validate demand model assumptions, identify emerging dynamics, and assess competitive positioning
Report Format
PDF and XLSX data workbook (Word format preview document)
Publisher
Market Minds Advisory
Report Code
MMA-2026-AGR-606
Published
September 2026
Contact
sales@marketmindsadvisory.com | www.marketmindsadvisory.com

Purchase the full Sports Turf Sensors Market Report (2026 to 2036).

This report delivers a comprehensive assessment of the global Sports Turf Sensors Market, covering sizing, segmentation, and competitive dynamics across moisture sensing, imaging, and mapping product categories worldwide today. It examines regional venue concentration, revenue diversification strategies, and semiconductor component cost exposure shaping vendor profitability through 2036 in detail. The analysis draws on primary survey data, expert interviews, and company disclosures to size the opportunity precisely and rigorously. Buyers gain a structured view of where competitive advantage concentrates as broadcast scrutiny reshapes venue investment priorities.
Ten-year market sizing and forecast model through 2036
Six-segment measurement-technology-based market breakdown and analysis
Seven-region venue and demand concentration analysis
Competitive benchmarking of twenty tracked specialty vendors
Precision sensor component cost exposure assessment
Anonymized professional sports franchise case study

Built For The People Who Decide

From boardroom strategy to bench-side execution, this report is read cover-to-cover by leaders shaping the next decade of their industry, turning demand scenarios, market dynamics and valuation benchmarks into decisions.
CXOs/ Presidents/ VPs/ Managers
M&A and Corporate Development
Strategy Teams and R&D Heads
Procurement and Product Directors
Regulatory and Compliance Leaders
Investor Relations and Equity Analysts