

Market Minds Advisory
Sports Analytics Market

Sports Analytics Market: Sports Analytics Market: Coaching Authority, League Data Rights and Insight That Loses To Instinct 2026 to 2036

A coach who has won things does not need a model, and a coach who has not will be replaced before the model pays back. That tension has capped this category for fifteen years.

Lead Analyst

Published

September 2026

Make Smarter Decisions with Customized Research Insights

Request a free sample report and evaluate market opportunities, growth trends, and competitive dynamics relevant to your business needs.

2025 MARKET VALUE$4.1BMarket Size 2025
2036 FORECAST VALUE$16.2BBase Case , 2026 to 2036
CAGR 2026 TO 203613.2 %Bull 14.5% / Bear 11.9%
INCREMENTAL OPPORTUNITY$11.5BNet 10- year value creation
EXPANSION MULTIPLE3.45x2036 value over 2026 base
Strategic Levers
M&A Pipeline
Regional Outlook
Country Rankings
Competitive Intelligence
Segmental Deep-dive
Call-Us : 91 93563 13602

Executive Snapshot and Market Trajectory.

A coach who has won things does not need a model, and a coach who has not won will be replaced long before any model pays back. That tension has capped this category for fifteen years and it has not resolved. Analytics changes around 23% of coaching decisions.
The market reaches USD 4.7 billion in 2026 and USD 16.2 billion by 2036, a 3.45 times expansion at 13.2% annually. Injury risk and load management analytics grow at 19.8%, half again the market rate of 13.2%, because a player's availability is worth more than any tactical insight. East Asia holds 24% of spending on league investment and India compounds fastest at 21.4%. Data rights decide who can supply.
Five vendors hold 26% of spending, extraordinarily low, because leagues, clubs, broadcasters and betting operators all buy analytics for entirely different purposes. Stats Perform, Genius Sports, Catapult, Hudl and Sportradar lead. League data rights rather than analytical capability determine who can supply anything. Around 58% of revenue comes from leagues, broadcasters and betting operators rather than from club performance departments, because those buyers fund against revenue that actually scales. Concentration is extraordinarily low.
Market Definition
This report covers sports analytics: data collection, modelling and decision software applied to athletic performance and the commercial operation of sport. It spans injury risk and load management analytics, athlete tracking and performance measurement systems, tactical and opposition analysis platforms, officiating and rules technology, fan engagement and commercial analytics, and the data rights and feed distribution supporting them. It excludes broadcast production technology, ticketing and venue management systems, sports betting platforms themselves, consumer fitness wearables, and general team administration software.
Base Year Value
$4.1B in 2025 (MMA Primary Research Dataset, September 2026)
Forecast Period
2026 to 2036, eleven discrete annual values
CAGR
13.2% base case. Bull 14.5%. Bear 11.9%.
Fastest Growth Segment
Injury Risk And Load Management Analytics: 19.8% CAGR
Fastest Growth Country
India: 21.4% CAGR
Fastest Growth Region
South Asia and Pacific: 15.4% CAGR
Largest Region
East Asia: 24% of 2025 global value
Market Leaders
Stats Perform, Genius Sports, Catapult, Hudl and Sportradar lead on sports analytics platform and data revenue. Source: MMA Analysis.
Primary Survey
n=3,800 procurement and R&D decision-makers, Q4 2025, six countries
Methodology
Demand-side build-up, cross-validated against public data, 47 expert interviews

Sports Analytics Market Forecast Scenarios

sports-analytics-market-size-forecast-scenario-1790004251771
Between 2020 and 2025 the category compounded at 11.8%, and the money moved away from the pitch. Performance analytics grew respectably while data rights, officiating technology and betting feeds grew far faster, because those buyers have budgets that scale with broadcast and wagering revenue rather than with a coaching department's discretionary allowance. The category grew where budgets grew rather than where the technology improved.
The base case holds 13.2% on three mechanisms. Injury and availability analytics keep growing because a squad's wage bill sitting in a treatment room is a number a chief executive understands immediately. Officiating technology keeps expanding as leagues face scrutiny that human judgement alone cannot answer. And emerging league investment keeps building analytics capability from the outset rather than retrofitting it onto established coaching cultures. Those three mechanisms run largely independently of one another.
The bull case at 14.5% assumes betting and media rights holders keep expanding data requirements, since those buyers fund at a scale clubs never will. The bear case at 11.9% is coaching resistance holding firm, where performance analytics stays advisory in most organisations and the category grows only where commercial rather than sporting decisions are being informed.

Instinct Still Beats Models

The buyer with authority is rarely the buyer with budget. Average head coach tenure runs about two years, which means any analytical programme requiring behavioural change outlasts the person who agreed to it. Analytical input measurably changes around 23% of coaching decisions. Vendors selling tactical insight into that environment are asking somebody with two years of job security to trust a model over judgement that got them hired.
TOP FIVE CONCENTRATION26%Extraordinarily low, reflecting leagues, clubs and broadcasters buying separately
HEAD COACH TENURE2 yearsAverage time in post before replacement across major professional leagues
SQUAD WAGE IN TREATMENT14%Player wage bill unavailable through injury across a typical season
COMMERCIAL BUYER SHARE58%Revenue from leagues, broadcasters and betting rather than clubs
DATA RIGHTS COST SHARE31%Vendor cost consumed by league data rights and collection obligations
MODEL ADOPTION IN SELECTION23%Coaching decisions where analytical input measurably changed the outcome
Availability is the argument that actually lands. Around 14% of a squad wage bill sits unavailable through injury across a typical season, and that is a number a chief executive understands without any explanation of the underlying method. Injury risk and load management analytics grow at 19.8% against 13.2% for the market, because they reach the person who controls spending rather than the person who controls selection.
Most of the money is commercial rather than sporting. Around 58% of revenue comes from leagues, broadcasters and betting operators rather than from club performance departments, because those buyers fund against broadcast and wagering revenue rather than a coaching allowance. Data rights absorb around 31% of vendor cost, which means access rather than analytical capability determines who can supply anything at all.
"Clubs are where the romance is and leagues are where the money is. I have watched brilliant performance products fail because the head coach left, and mediocre data feeds print money for a decade because somebody locked up the rights."
Director, Sports Technology and Performance Data Practice · MMA Technology Practice · September 2026

Market Trends

Coaching Tenure Outlasts No Analytical Programme

Average head coach tenure runs about two years across major professional leagues, which means any programme requiring behavioural change outlasts whoever agreed to it and starts again with a successor who has their own convictions. Analytical input measurably changes around 23% of coaching decisions. Vendors selling tactical insight are asking somebody with two years of security to trust a model over the judgement that got them the position in the first place. Programmes surviving a coaching change are those an executive owns rather than those a manager championed personally. Conviction expires.
Market Impact: Injury holds 14% of wage bill
Commercial Buyers Fund What Clubs Cannot

Around 58% of revenue comes from leagues, broadcasters and betting operators rather than club performance departments, because those buyers fund against broadcast and wagering revenue that scales rather than against a coaching allowance that does not. Data rights absorb around 31% of vendor cost, which makes access rather than analytical capability the thing that determines who can supply. Vendors organised entirely around club sales are competing for the smaller and poorer half. Data rights positions also generate revenue for years without further product development, which club software never does at all.
Market Impact: India compounds at 21.4% yearly

Market Opportunities and Growth Drivers

Player Availability Reaches The Chief Executive Directly

Around 14% of a squad wage bill sits unavailable through injury across a typical season, and that figure needs no explanation of underlying method to land with somebody controlling the budget. Injury risk and load management analytics grow at 19.8% against 13.2% for the market as a direct result. This is the one performance application that reaches the person who controls spending rather than only the person who controls team selection. It also survives a coaching change intact, because the next coach inherits exactly the same wage bill and the same treatment room.
Market Impact: Analytics changes 23% of decisions

Emerging League Investment Builds Capability From Scratch

India compounds at 21.4%, ahead of every other market, because league investment is building analytical capability from the outset rather than retrofitting it onto established coaching cultures with settled convictions. East Asia holds 24% of spending on similar mechanisms across several developing competitions. Organisations without an incumbent coaching orthodoxy adopt analytical practice as normal rather than as a challenge to somebody's professional authority. Adopting analytics as normal practice rather than as a challenge to somebody's professional authority removes the single largest obstacle this category faces anywhere. Nobody defends orthodoxy they never had.
Market Impact: Rights absorb 31% of vendor cost

Market Restraints and Challenges

Coaching Authority Rejects What It Did Not Author

Analytical input measurably changes around 23% of coaching decisions, and the rest are taken on judgement that the coach was hired for and will be dismissed over. The root cause is that accountability sits entirely with the coach while the model carries none of it. Commercially this caps performance analytics adoption. Mitigation runs through analytics embedded in staff the coach chose, through availability arguments reaching executives instead, and through tools that inform rather than recommend. Accountability without authorship is what makes a model unwelcome regardless of how good it is.
Market Impact: Coach tenure averages 2 years

Data Rights Costs Exclude Smaller Analytics Vendors

League data rights and collection obligations absorb around 31% of vendor cost, and those rights are negotiated centrally at prices set against total league revenue rather than any vendor's volume. The root cause is that leagues monetise access rather than licensing capability. Commercially this excludes vendors without scale entirely. Mitigation runs through partnership with rights holders, through derived rather than official data where permitted, and through applications outside rights-controlled competitions. Rights costs are fixed against league revenue rather than vendor sales, which punishes weak commercial execution severely. Scale decides participation.
Market Impact: Commercial buyers fund 58% of revenue
4 additional market trends, 3 additional growth drivers, and 2 additional restraints and challenges are covered in the full report. Contact sales@marketmindsadvisory.com to access the complete intelligence.

Segment CAGR and Growth Architecture

Segmentation follows application and buyer, since each carries quite different budget source, adoption friction and rights dependency. Six classes cover the market: injury risk and load management analytics, data rights and feed distribution, officiating and rules technology, athlete tracking and performance measurement, tactical and opposition analysis, and fan engagement and commercial analytics. Organisation type sits elsewhere.
sports-analytics-market-market-share-analysis-1790004252338

Injury Risk And Load Management Analytics

Injury risk and load management analytics grow at 19.8%, half again the market rate of 13.2%, because around 14% of a squad wage bill sits unavailable through injury across a typical season and that figure lands with a chief executive without requiring any explanation of method. This is the one performance application reaching the person who controls spending rather than only the person controlling selection. It also survives a coaching change, since the next coach inherits the same wage bill and the same treatment room. Executive reach rather than model accuracy is what makes this segment durable. The next coach inherits exactly the same wage bill and the same treatment room regardless.
CAGR 19.8%

Data Rights And Feed Distribution

Data rights and feed distribution compound at 16.4% because leagues monetise access rather than licensing analytical capability, and rights absorb around 31% of vendor cost across the category. That structure excludes vendors without scale entirely regardless of what their models can do. It also produces unusually durable revenue: a rights position held through a cycle generates income for years without requiring any product development, which is why this segment funds the performance analytics that clubs will not pay properly for. Leagues have also learned considerably more about what those positions are worth to the vendors holding them. Renewal negotiations reflect that learning. Vendors without scale are excluded regardless of what their models actually do.
CAGR 16.4%
Full segment breakdown across 6 segments available in the complete report.

Regional Architecture and Country Demand Map

East Asia holds 24% of spending, the largest regional share, because league investment and broadcast rights values are both growing quickly across several competitions. North America follows at 23% on established analytics culture and betting data demand. India compounds fastest at 21.4% on new league investment.

East Asia

East Asia takes 24% of spending, the largest regional share, because league investment and broadcast rights values are both growing quickly across football, basketball and baseball competitions that were previously modest commercially. Chinese and Japanese leagues are building analytical capability alongside commercial infrastructure rather than retrofitting either. Officiating technology adoption is unusually rapid given scrutiny on competition integrity. Growth at 14.2% runs above the global rate on league investment rather than on club performance spending. Competitions building commercial and analytical infrastructure together avoid the retrofit problem that established leagues face constantly. Officiating technology adoption is unusually rapid across the region given competition integrity scrutiny. Retrofit problems rarely arise here. Growth follows league investment.
Share: 24% | CAGR: 14.2% (2026 to 2036)

North America

North America accounts for 23% of spending, where analytical culture in professional sport is most established and where betting data demand grew fastest after regulatory change. Stats Perform, Genius Sports and Hudl all built positions here across league, club and media buyers. Coaching resistance is lower in leagues with long-established analytical practice, though head coach tenure remains around two years everywhere. Growth at 13.7% sits above the global rate on betting and media data rather than performance work. Betting data requirements grew fastest after regulatory change, which shifted category revenue decisively toward commercial buyers here. Coaching resistance is somewhat lower in leagues with long-established analytical practice behind them. Tenure still runs short.
Share: 23% | CAGR: 13.7% (2026 to 2036)
Regional intelligence for 5 additional markets available in the complete report: Western Europe, South Asia and Pacific, Latin America, Middle East and Africa, Eastern Europe. Contact sales@marketmindsadvisory.com.
sports-analytics-market-country-cagr-analysis-1790004252872

Where Sports Data Revenue Sits

Coaching authority rather than analytical quality limits performance adoption, commercial buyers fund at scales clubs never reach, and data rights rather than modelling determine who can supply. The four levers below follow those conditions rather than any argument about model accuracy. Each addresses a budget or authority condition rather than an analytical one. Accuracy converged.

Sell Availability To Executives, Not Tactics To Coaches

Around 14% of a squad wage bill sits unavailable through injury across a season, and that number reaches a chief executive without requiring any explanation of method. Average coach tenure runs about 2 years, so anybody selling tactical insight is asking a person with two years of security to override the judgement that got them hired. Availability analytics reach budget authority and survive the coaching change that ends tactical programmes. Executives own wage bills permanently. Coaches own selection and nothing else that carries a budget line. Budget authority decides. Tenure ends everything else.
Market Impact: Injury now holds 14% of the wage bill

Secure Rights Before Building Any Models

League data rights absorb around 31% of vendor cost and are negotiated centrally at prices set against league revenue rather than vendor volume, which excludes anybody without scale regardless of analytical capability. A rights position generates revenue for years without further product development. Vendors building models against data they cannot license are constructing something they will never be permitted to sell into the competitions that matter commercially. Access rather than capability decides supply. Models built on unlicensable data reach nobody who matters commercially. Rights precede everything else. Access comes first here.
Market Impact: Rights now absorb 31% of all vendor cost

Follow Commercial Budgets Rather Than Sporting Ones

Around 58% of revenue comes from leagues, broadcasters and betting operators funding against broadcast and wagering revenue rather than a coaching department allowance that barely moves. Those buyers also make decisions on commercial rather than sporting grounds, which removes the authority problem entirely. Vendors organised around club performance sales are competing for the smaller and considerably poorer half of this whole category. Around 58% of the money sits with commercial buyers making commercial decisions, which removes the coaching authority problem entirely. Sporting judgement never enters it. Authority never arises. Budgets actually scale.
Market Impact: Commercial buyers now fund 58% of all revenue

Enter Leagues Building Practice From The Start

India compounds at 21.4% because league investment is building analytical capability from the outset rather than retrofitting it onto coaching cultures with settled convictions and professional authority to defend. Organisations without incumbent orthodoxy adopt analytics as normal practice rather than as a challenge to anybody. Vendors concentrating on established leagues are selling into the environments where resistance is highest and tenure shortest. Tenure runs about 2 years in established leagues. Resistance is highest where practice is oldest, which is exactly where most vendors concentrate their effort. Greenfield leagues are open.
Market Impact: India now compounds at fully 21.4% each year

Who Controls the Margin Pool

Five vendors hold 26% of sports analytics spending, extraordinarily low even for a fragmented category, because leagues, clubs, broadcasters and betting operators all buy analytics for entirely different purposes and rarely evaluate the same products. Stats Perform, Genius Sports, Catapult, Hudl and Sportradar lead. All participants are assessed on sports analytics platform and data revenue rather than on broader media, betting or wearable device businesses. Concentration this low reflects four buyer groups that share almost no purchasing process between them.
Competition runs on data rights position and buyer coverage far more than on modelling capability, which converged across serious vendors years ago. The second dimension is whether a product survives a coaching change, because average tenure of about two years ends any programme that depended on one person's conviction rather than on an organisational requirement.

Pressure is emerging from leagues building analytics capability internally and licensing it to member clubs. Rankings shift where league investment grows and where betting data requirements expand, particularly across India, East Asia and the Gulf at present. Vendors dependent on club performance budgets carry the most exposure to that shift.
sports-analytics-market-company-positioning-matrix-1790004253398

Competitive Moat and Risk Dimensions

GENIUS SPORTS

Moat: League Rights Position

Genius Sports holds official data rights across competitions that betting and media buyers cannot legally source elsewhere, and rights absorb around 31% of vendor cost across this category. That position generates revenue for years without further product development being required. Competitors with better analytics and no rights cannot supply the buyers who fund at scale, whatever their models demonstrate.
GENIUS SPORTS

Risk: Rights Renewal Exposure

Rights are held on cycles and renegotiated against league revenue that keeps rising, which means the cost of holding a position increases faster than the revenue it generates in many cases. Leagues also increasingly consider building distribution internally. A business resting on rights faces a renewal where the counterparty has learned exactly what the position is worth.
CATAPULT

Moat: Athlete Load Measurement

Catapult holds athlete tracking and load measurement position feeding injury and availability analytics, which is the one performance application that reaches a chief executive rather than only a coach. Around 14% of a squad wage bill sits injured across a season. That argument survives coaching changes because the next coach inherits the same wage bill and the same treatment room.
CATAPULT

Risk: Club Budget Ceiling

Club performance departments fund from allowances that do not scale with broadcast or wagering revenue, and around 58% of category money sits with commercial buyers instead. Hardware and performance software compete for the smaller pool. A position strong in club performance grows with club budgets rather than with the commercial revenue expanding around them.

Players Tracked

Prominent Players

Stats Perform
Genius Sports
Catapult
Hudl
Sportradar

Other Key Players

Second Spectrum
SkillCorner
Zone7
Kitman Labs
STATSports
Wyscout
Sportlogiq
Kinexon
Teamworks
PlayerData
Sportsbox AI
Hawk-Eye Innovations
ChyronHego
Signality
Sportsdata

Recent Developments

MARCH 2025

Clubs Shift Analytics Budget Toward Availability Programmes

Professional clubs moved analytics spending toward injury risk and load management rather than tactical analysis, a budgeting development rather than any corporate transaction. Around 14% of a squad wage bill sits unavailable through injury across a season, which reaches a chief executive without any explanation of the underlying analytical method.
Signal: Availability arguments now survive the coaching changes that eventually end every tactical programme anywhere at all.
SEPTEMBER 2024

Leagues Reprice Data Rights Against Rising Broadcast Values

Several leagues repriced official data rights against rising broadcast and wagering revenue, a commercial development rather than any acquisition. Rights already absorb around 31% of vendor cost across the category, and leagues have learned considerably more about what those positions are actually worth to the vendors holding them.
Signal: Rights holders now face renewals where the counterparty fully understands the position's real commercial value today.
JUNE 2025

Indian League Investment Builds Analytics From Commissioning

Indian league investment built analytical capability alongside commercial infrastructure rather than adding it to established operations, a development in practice rather than any corporate event. India compounds at 21.4%, and organisations without incumbent coaching orthodoxy adopt analytics as normal rather than as a challenge to professional authority.
Signal: New competitions adopt analytics as normal practice where established ones still treat it as a challenge.

What Sports Data Costs

League data rights and collection obligations absorb roughly 31% of vendor cost, and those payments are fixed against league revenue rather than against how much a vendor sells. Data collection operations including human operators and venue equipment take around 24%. Product engineering absorbs about 21%, with sales into fragmented buyer groups taking most of the remaining balance across the category.
Data rights costs rose sharply through 2023 and 2024 as leagues repriced against broadcast and wagering revenue growth and competition for official positions intensified. Genius Sports Annual Report 2024 and Sportradar Annual Report 2024 both record rights costs and collection operations among principal operating variables. Vendors holding multi-year rights agreements signed before the repricing carried a cost advantage competitors bidding currently could not match. Repricing hit vendors bidding currently hardest.

The competitive disadvantage mechanism is rights cost fixity rather than product cost. A vendor paying fixed rights against league revenue carries that expense whether it sells well or badly in any given year, which punishes weak commercial execution far more than in ordinary software. Exposure concentrates among vendors with narrow buyer coverage, since the same rights payment must be recovered across fewer customers and fewer applications entirely.
sports-analytics-market-cost-volatility-analysis-1790004253596

Recover Rights Cost Across Multiple Buyer Types

League data rights absorb roughly 31% of vendor cost and are fixed against league revenue rather than vendor sales, which punishes narrow buyer coverage severely. Selling one rights position into betting, media, club and league applications spreads that fixed cost across several revenue streams. Narrow vendors recover the same payment from far fewer customers.

Automate Data Collection Away From Human Operators

Collection operations including human operators and venue equipment absorb around 24% of cost and scale directly with matches covered rather than with revenue earned. Automated tracking and event detection reduce that as coverage expands. The engineering investment is substantial and it is the only route to covering lower tier competitions where manual collection could never be economic.

Sign Rights Agreements Across Longer Terms

Rights costs rose sharply as leagues repriced against broadcast and wagering revenue growth, and competition for official positions keeps intensifying across every major competition. Longer agreements signed before a repricing carry material cost advantage for their duration. The commitment is real and the alternative is renegotiating against a counterparty that has learned exactly what the position is worth.

Portfolio Architecture for Margin Defence

Margin architecture separates on buyer budget source rather than analytical difficulty. Tactical and opposition analysis earns least, since it sells into coaching allowances that barely move and dies with the coach who bought it. Athlete tracking and fan analytics sit above on hardware and commercial economics. Injury analytics, data rights and officiating technology earn most, because each reaches a budget that scales or a requirement that persists.
The volume versus premium tension runs between club performance sales and commercial rights positions, which reward opposite investments entirely. Club sales require product breadth and coaching relationships against budgets that do not grow. Rights positions require capital and negotiation against leagues that keep repricing. Vendors attempting both frequently fund rights costs from club revenue that cannot possibly cover them.

High-value pools concentrate in data rights and in injury analytics, and neither is reached through modelling capability. Rights require capital and league relationships built over cycles. Injury analytics require reaching an executive with an availability argument rather than a coach with a tactical one. Both explain why concentration sits at only 26% while the vendors with durable positions are far fewer than that number suggests.

Volume / Commodity-Adjacent

Tactical and opposition analysis platforms, selling into coaching allowances that barely grow and frequently ending when the coach who championed them leaves the club. The thirteen point spread separates vendors with multi-club standardisation from those selling individually into single organisations.
Gross Margin: 38% to 51%

Premium / Certified

Athlete tracking and performance measurement systems and fan engagement and commercial analytics, where hardware economics or commercial budgets determine value rather than coaching preference. The thirteen point spread tracks how much collection cost each vendor has automated against manual operation per match.
Gross Margin: 56% to 69%

Sustainability / Regulatory / Next-Generation

Injury risk and load management analytics, data rights and feed distribution and officiating and rules technology, each reaching a scaling budget or a persistent requirement. The fifteen point spread reflects rights position durability and buyer coverage breadth taken together.
Gross Margin: 73% to 88%
sports-analytics-market-portfolio-architecture-1790004254097

High-value Sub-segments and Strategic Watch-out

Injury Risk And Load Management Analytics

Grows at 19.8% because around 14% of a squad wage bill sits unavailable through injury across a season. The fifteen point spread reflects executive reach. This application survives coaching changes that end every tactical programme eventually. Wage bills persist through every change. Method needs no explaining.
Gross Margin: 73% to 88%

Data Rights And Feed Distribution

Grows at 16.4% because leagues monetise access rather than licensing capability, and rights absorb 31% of vendor cost. The fifteen point spread reflects buyer coverage breadth. A rights position generates revenue for years without product development. Scale rather than modelling decides entry. Capital rather than product.
Gross Margin: 73% to 88%

Officiating And Rules Technology

Grows at 15.7% as leagues face integrity scrutiny that human judgement alone cannot adequately answer any more. The fifteen point spread reflects accreditation depth. League rather than club budgets fund this work entirely, which changes the economics. Integrity scrutiny keeps rising steadily. League budgets fund it.
Gross Margin: 73% to 88%

Tactical And Opposition Analysis Platforms

Grows at 8.2%, slowest of the six classes, selling into coaching allowances that barely move against tenure averaging two years. The thirteen point spread reflects multi-club standardisation. Programmes frequently end when the coach who championed them departs. Coaching allowances barely move at all. Champions leave and take it.
Gross Margin: 38% to 51%

Why Budgets Outlast Coaches

The annuity here is the organisational requirement rather than any individual's enthusiasm. A data rights position or an officiating obligation persists regardless of who holds a coaching post, while a tactical programme championed by one manager ends when that manager does. Average tenure runs about two years. Vendors whose revenue depends on personal conviction are running a subscription against employment risk they cannot influence at all.
Depth varies by whose budget funds it. Around 58% of revenue comes from leagues, broadcasters and betting operators funding against revenue that scales with the sport's commercial success. Club performance departments fund from allowances that barely move whatever the club earns. The same analytical capability therefore produces entirely different growth depending which budget it was sold into originally.

The buyer who decides is rarely the one with authority over outcomes. A head coach evaluates whether analytical input threatens the judgement they were hired for. A chief executive evaluates whether 14% of the wage bill sitting injured can be reduced. A league commercial director evaluates data rights against broadcast value. Only the first has any real say over performance decisions, and only the first has almost no budget.
sports-analytics-market-end-use-penetration-index-1790004254590

What Wins Sports Data Work

These are among the four positions where our research anticipates prominent divergence between winners and laggards over the coming forecast period. Each is grounded in the demand model, the regulatory perimeter, and the announced capacity pipeline.
01 / AVAILABILITY ARGUMENT FRAMING

Sell Wage Bill, Not Tactical Advantage

Around 14% of a squad wage bill sits unavailable through injury across a typical season, and that figure reaches a chief executive without requiring any explanation of the analytical method behind it. Average head coach tenure runs about two years, so tactical programmes end with the person who championed them. Availability analytics reach budget authority and survive the coaching change that terminates every tactical engagement eventually, because the wage bill outlasts every appointment and every squad rebuild the club undertakes.
02 / RIGHTS POSITION PRIORITY

Buy Access Before Building Models

League data rights absorb around 31% of vendor cost and are negotiated centrally at prices set against league revenue rather than any vendor's volume, which excludes participants without scale entirely. A rights position generates revenue for years without further product development being required at all. Vendors building models against data they cannot license are constructing something they will never be permitted to sell into competitions that matter commercially at all or in any meaningful volume at any price that matters.
03 / COMMERCIAL BUDGET TARGETING

Follow Broadcast Money, Not Coaching Allowances

Around 58% of category revenue comes from leagues, broadcasters and betting operators funding against broadcast and wagering revenue that scales with the sport's commercial success. Club performance departments fund from allowances that barely move whatever the club actually earns in any season. Vendors organised around club performance sales are competing for the smaller and considerably poorer half of this whole category, and against buyers who cannot fund growth from a fixed departmental allowance that never grows whatever the club earns.
04 / GREENFIELD LEAGUE ENTRY

Start Where No Orthodoxy Exists

India compounds at 21.4% because league investment is building analytical capability from the outset rather than retrofitting it onto coaching cultures with settled convictions and professional authority to defend against it. Organisations without incumbent orthodoxy adopt analytics as normal practice rather than as a challenge to anybody's judgement. Vendors concentrating on established leagues sell where resistance runs highest and coaching tenure shortest and budgets are smallest against entrenched professional authority and shortest tenure among head coaches and settled conviction throughout.

Engagement Snapshot From the Field

A live engagement with an industry participant carrying material or product regulatory and market exposure ahead of a defining policy shift, showing how our research translates into a defensible multi-year portfolio strategy.
MARKET MINDS ADVISORY · CLIENT ENGAGEMENT SUMMARY
Sports Analytics Producer Strategic Portfolio Review and Transition Roadmap 2026·Investment Scenario on Sports Analytics Exposure Evaluation 2025-26
CLIENT PROFILE
A professional football club three years into a performance analytics programme that had survived one coaching change and was stalling under a second, while its injury costs ran above league average across two consecutive seasons. Management had approved further analytics investment, without establishing why the previous spending had changed so little. Nobody had costed the injury burden against it.
STRATEGIC CHALLENGE
The sporting director wanted tactical analytics investment to match rivals. The head coach had largely stopped using the existing platform. Nobody had costed the injury burden against the analytics budget, and the wage bill sitting in the treatment room exceeded the entire analytics programme cost several times over across the season.
MMA APPROACH
MMA costed the injury burden as unavailable wage bill and compared it against the analytics programme spend and its measurable effect on decisions. We reviewed which analytical outputs had survived the previous coaching change and which had not. Work drew on 47 expert interviews conducted in Q4 2025 with clubs, leagues and analytics vendors.
KEY FINDINGS
  1. Unavailable wage bill through injury exceeded the entire analytics programme cost by more than 6 times across the previous single season alone.
  2. Tactical analytics use fell close to zero within 4 months of each coaching change, while medical and load data continued being used throughout.
  3. The existing platform was contracted against tactical capability the club had effectively stopped using altogether some months earlier (client-reported, unverified by MMA).
  4. Load management analytics reached the chief executive directly, whereas the tactical outputs had never once left the coaching department at any point.
CLIENT PROFILE
A professional football club three years into a performance analytics programme that had survived one coaching change and was stalling under a second, while its injury costs ran above league average across two consecutive seasons. Management had approved further analytics investment, without establishing why the previous spending had changed so little. Nobody had costed the injury burden against it.
STRATEGIC CHALLENGE
The sporting director wanted tactical analytics investment to match rivals. The head coach had largely stopped using the existing platform. Nobody had costed the injury burden against the analytics budget, and the wage bill sitting in the treatment room exceeded the entire analytics programme cost several times over across the season.
MMA APPROACH
MMA costed the injury burden as unavailable wage bill and compared it against the analytics programme spend and its measurable effect on decisions. We reviewed which analytical outputs had survived the previous coaching change and which had not. Work drew on 47 expert interviews conducted in Q4 2025 with clubs, leagues and analytics vendors.
KEY FINDINGS
  1. Unavailable wage bill through injury exceeded the entire analytics programme cost by more than 6 times across the previous single season alone.
  2. Tactical analytics use fell close to zero within 4 months of each coaching change, while medical and load data continued being used throughout.
  3. The existing platform was contracted against tactical capability the club had effectively stopped using altogether some months earlier (client-reported, unverified by MMA).
  4. Load management analytics reached the chief executive directly, whereas the tactical outputs had never once left the coaching department at any point.
RECOMMENDED STRATEGY
Phase 1: Phase one: stop further tactical analytics investment, since usage collapsed within four months of each coaching change the club experienced. Phase 2: Phase two: redirect that budget into injury risk and load management, where the unavailable wage bill exceeds programme cost several times over. Phase 3: Phase three: contract analytics against outcomes the chief executive owns rather than against capability a departing coach happened to value.
OUTCOME
The club redirected analytics budget from tactical work into injury and load management (client-reported, unverified by MMA). Unavailable wage bill fell materially across the following season, and the programme survived a further coaching change intact. Analytics is now contracted against executive-owned outcomes, which is the change that outlasted the engagement itself.

Frequently Asked Questions

Foundational context covering the market sizes, CAGR, scope, country, region and competition that inform every finding below. This section is provided to cover basics and most often pre-purchase conversations, answered from the MMA Primary Research Dataset.

What is the current size of the Sports Analytics Market?

Global value reaches USD 4.7 billion in 2026, measured as sports analytics platform and data revenue. The 2025 base was USD 4.1 billion on the same basis.

How large will the Sports Analytics Market be by 2036?

The market reaches USD 16.2 billion by 2036, an increase of USD 11.5 billion across the forecast period. That represents 3.45 times expansion from the 2026 base.

What is the CAGR for the Sports Analytics Market 2026 to 2036?

The base case runs at 13.2% annually, with a bull case at 14.5% if betting and media data requirements expand and a bear case at 11.9% if coaching resistance holds firm.

Which segment is growing fastest?

Injury risk and load management analytics grow at 19.8%, half again the market rate of 13.2%. A player's availability is worth more than any tactical insight.

Who are the major companies in the Sports Analytics Market?

Stats Perform, Genius Sports, Catapult, Hudl and Sportradar lead on platform and data revenue, holding 26% between them. Second Spectrum and Zone7 hold specialist positions.

Which country is growing fastest?

India leads at 21.4%, because league investment is building analytical capability from the outset rather than retrofitting it onto established coaching cultures. Saudi Arabia follows.

Report Segmentation Architecture

The full report scope spans multiple orthogonal segmentation dimensions, with cross-tabulated demand data provided for each dimension pair. Coverage extends further to regional breakdowns, trend trajectories, and the competitive detail needed to support segment-level decision-making.

By Application And Buyer

  • Injury Risk And Load Management Analytics
  • Data Rights And Feed Distribution
  • Officiating And Rules Technology
  • Athlete Tracking And Performance Measurement
  • Fan Engagement And Commercial Analytics
  • Tactical And Opposition Analysis Platforms

By End-Use Industry

  • Professional Club Operations
  • League And Competition Administration
  • Broadcast And Media Rights Holders
  • Sports Betting And Wagering Operators
  • National Governing Bodies And Federations
  • Collegiate And Development Academies

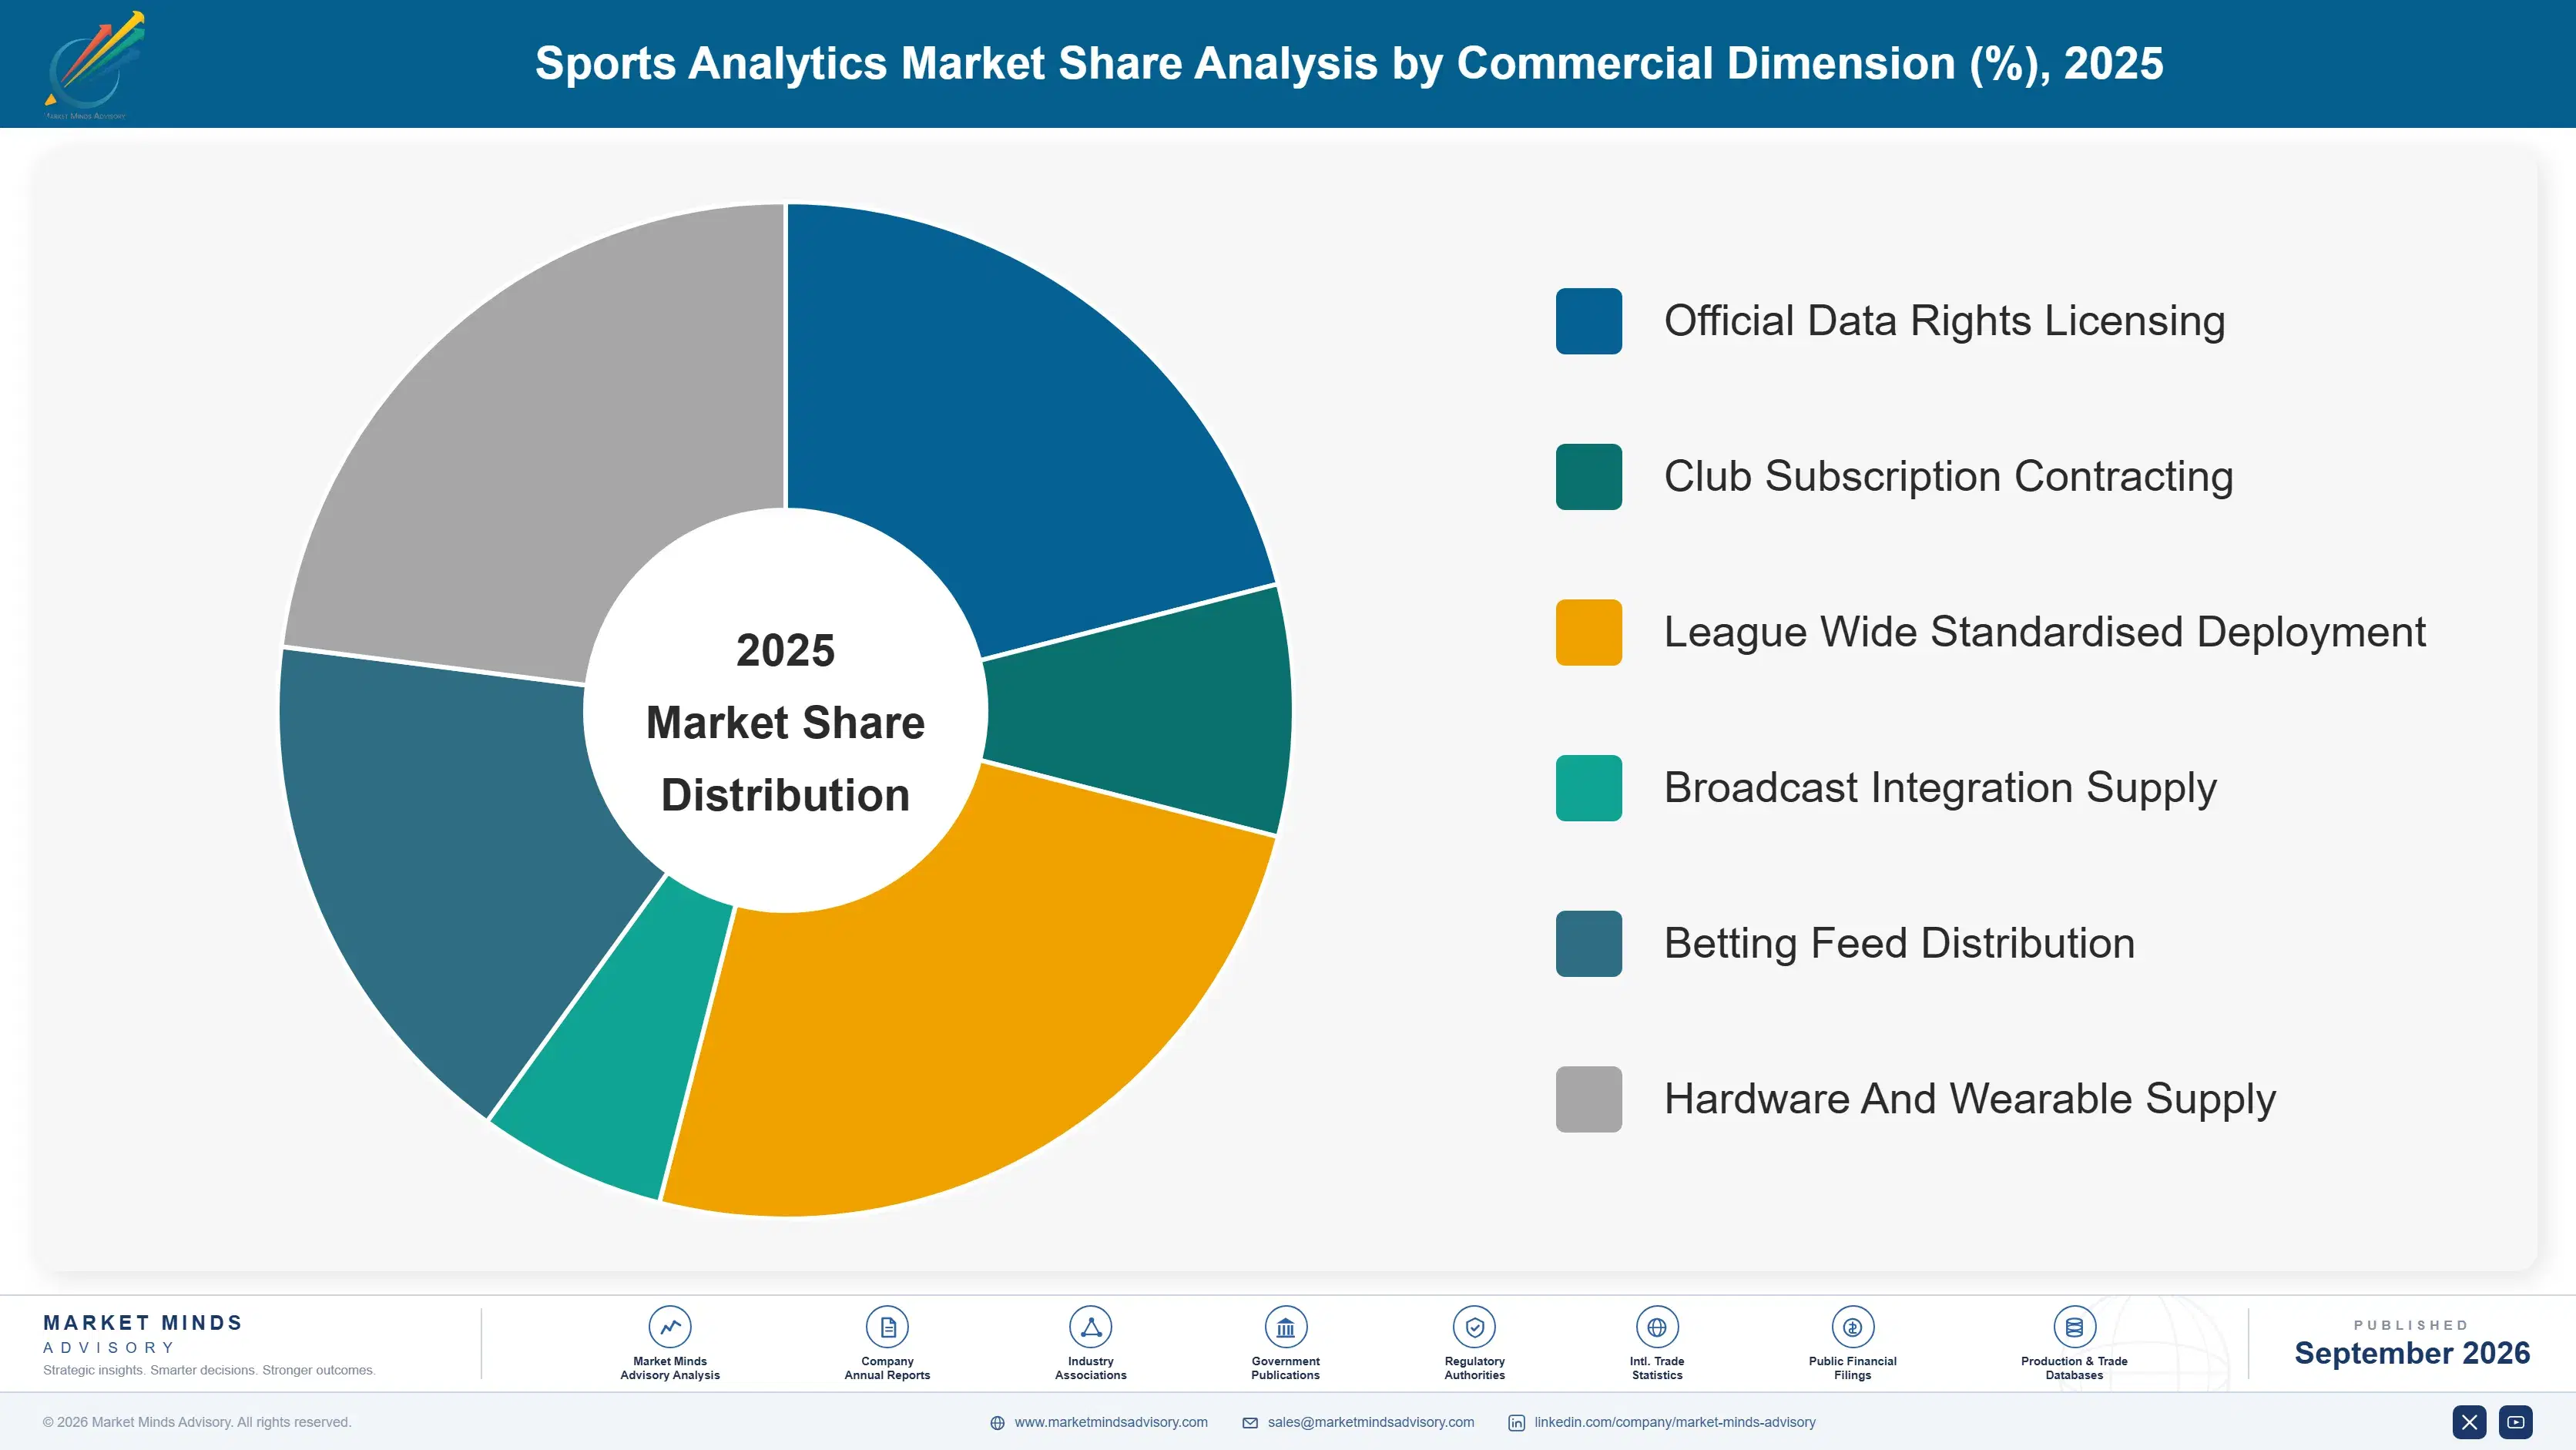
By Commercial Dimension

  • Official Data Rights Licensing
  • Club Subscription Contracting
  • League Wide Standardised Deployment
  • Broadcast Integration Supply
  • Betting Feed Distribution
  • Hardware And Wearable Supply

By Region

  • North America
  • Western Europe
  • East Asia
  • South Asia and Pacific
  • Latin America
  • Middle East and Africa
  • Eastern Europe

Scope, Methodology, and Coverage

Every figure in this report is reproducible from documented input assumptions. The scope below maps the historical period, the forecast horizon, the segmentation dimensions, and the countries covered, alongside the underlying primary and qualitative methodology.
Historical Period
2020 to 2025
Forecast Period
2026 to 2036
Base Year
2025 (USD billions; MMA Primary Research Dataset, September 2026)
Market Definition
This report covers sports analytics: data collection, modelling and decision software applied to athletic performance and the commercial operation of sport, spanning injury risk and load management analytics, athlete tracking and performance measurement, tactical and opposition analysis, officiating and rules technology, fan engagement and commercial analytics, and data rights and feed distribution. It excludes broadcast production technology, ticketing and venue systems, betting platforms themselves, consumer fitness wearables, and team administration software.
Quantitative Units
USD millions, sports analytics platform and data revenue basis; competitions and clubs covered; head coach tenure in years; squad wage bill unavailable through injury; commercial buyer share of revenue; data rights share of vendor cost; analytical influence on coaching decisions.
Segmentation Dimensions
Application and buyer type; end-use organisation; commercial licensing route; geography across seven regions.
Regions Covered
North America, Western Europe, East Asia, South Asia and Pacific, Latin America, Middle East and Africa, Eastern Europe
Countries Covered
United States, Canada, Mexico, Brazil, Argentina, United Kingdom, Spain, Germany, Italy, France, Netherlands, Poland, China, Japan, South Korea, India, Australia, Singapore, Saudi Arabia, South Africa.
Key Companies Profiled
Stats Perform, Genius Sports, Catapult, Hudl, Sportradar, Second Spectrum, SkillCorner, Zone7, Kitman Labs, STATSports, Wyscout, Sportlogiq, Kinexon, Teamworks, Hawk-Eye Innovations.
Quantitative Methodology
Primary survey, n=3,800 respondents, Q4 2025, six countries; demand-side model with trade association cross-validation
Qualitative Methodology
47 expert interviews, Q4 2025; applied to validate demand model assumptions, identify emerging dynamics, and assess competitive positioning
Report Format
PDF and XLSX data workbook (Word format preview document)
Publisher
Market Minds Advisory
Report Code
MMA-2026-TEC-301
Published
September 2026
Contact
sales@marketmindsadvisory.com | www.marketmindsadvisory.com

Purchase the full Sports Analytics Market Report (2026 to 2036).

This report sizes the global sports analytics market from 2026 to 2036 across six applications, six organisation types and seven regions. It explains why head coach tenure averaging about two years ends any programme depending on one person's conviction, and why analytical input measurably changes only around 23% of coaching decisions. Around 58% of revenue coming from commercial rather than sporting buyers is analysed as where the money actually sits. Data rights absorbing around 31% of vendor cost are examined as the barrier determining who can supply anything. Regional analysis explains why East Asia holds 24% of spending.
Six analytics applications sized through to 2036
Coaching tenure quantified against programme survival rates
Data rights costs analysed as a supply barrier
Twenty named vendors assessed on analytics revenue
Four revenue levers with quantified commercial impact
Anonymised football club investment engagement documented in full

Built For The People Who Decide

From boardroom strategy to bench-side execution, this report is read cover-to-cover by leaders shaping the next decade of their industry, turning demand scenarios, market dynamics and valuation benchmarks into decisions.
CXOs/ Presidents/ VPs/ Managers
M&A and Corporate Development
Strategy Teams and R&D Heads
Procurement and Product Directors
Regulatory and Compliance Leaders
Investor Relations and Equity Analysts