Market Minds Advisory
Spectral Sensor Market

Spectral Sensor Market: Spectral Sensor Market: Sensing Architectures, Calibration Economics and Deployment Position 2026 to 2036

A laboratory spectrometer gives a far better measurement than a twelve dollar module ever will. The module is on the harvester, and the laboratory is four days away from the sample by post.

Lead Analyst

Published

September 2026

Make Smarter Decisions with Customized Research Insights

Request a free sample report and evaluate market opportunities, growth trends, and competitive dynamics relevant to your business needs.

2025 MARKET VALUE$1.9BMarket Size 2025
2036 FORECAST VALUE$6.9BBase Case , 2026 to 2036
CAGR 2026 TO 203612.4 %Bull 13.7% / Bear 11.1%
INCREMENTAL OPPORTUNITY$4.7BNet 10- year value creation
EXPANSION MULTIPLE3.21x2036 value over 2026 base
Strategic Levers
M&A Pipeline
Regional Outlook
Country Rankings
Competitive Intelligence
Segmental Deep-dive
Call-Us : 91 93563 13602

Executive Snapshot and Market Trajectory.

A worse measurement in the right place beats a better one in the wrong place, and this industry took twenty years to accept it. A twelve dollar module on a harvester answers the question while it still matters. A laboratory answers it four days later.
The market reaches USD 2.14 billion in 2026 and USD 6.88 billion by 2036, a 3.21 times expansion at 12.4%. Miniaturised near-infrared modules grow at 18.6%, half again the market rate of 12.4%, because deployment position beats precision in almost every commercial application. East Asia holds 38% of module shipment revenue on manufacturing and consumer integration, and China alone grows at 17.2%. Laboratory grade instruments are not the competition here.
Five suppliers hold 49% of module shipment revenue, concentrated by calibration capability rather than by silicon. ams OSRAM and Sony reach consumer and industrial volume through existing semiconductor positions. Hamamatsu Photonics and Teledyne hold scientific and industrial depth built across decades. Viavi supplies the optical filters most of the industry depends on. Everybody sells sensors and the money sits in the models. Nobody in this industry says that out loud very often at all.
Market Definition
This report covers spectral sensing components and modules that measure light across multiple wavelength bands: miniaturised near-infrared spectrometer modules, multispectral filter array sensors, hyperspectral line-scan imagers, Raman spectroscopy modules, colour and ambient light sensors, and Fourier transform infrared modules. It excludes benchtop laboratory instruments, satellite and airborne imaging payloads, medical diagnostic analysers, machine vision cameras without spectral capability, and standalone illumination sources.
Base Year Value
$1.9B in 2025 (MMA Primary Research Dataset, September 2026)
Forecast Period
2026 to 2036, eleven discrete annual values
CAGR
12.4% base case. Bull 13.7%. Bear 11.1%.
Fastest Growth Segment
Miniaturised Near-Infrared Spectrometer Modules: 18.6% CAGR
Fastest Growth Country
China: 17.2% CAGR
Fastest Growth Region
South Asia and Pacific: 14.5% CAGR
Largest Region
East Asia: 38% of 2025 global value
Market Leaders
ams OSRAM, Hamamatsu Photonics, Teledyne Technologies, Viavi Solutions and Sony Semiconductor Solutions lead on spectral sensor component and module shipment revenue. Source: MMA Analysis.
Primary Survey
n=3,800 procurement and R&D decision-makers, Q4 2025, six countries
Methodology
Demand-side build-up, cross-validated against public data, 47 expert interviews

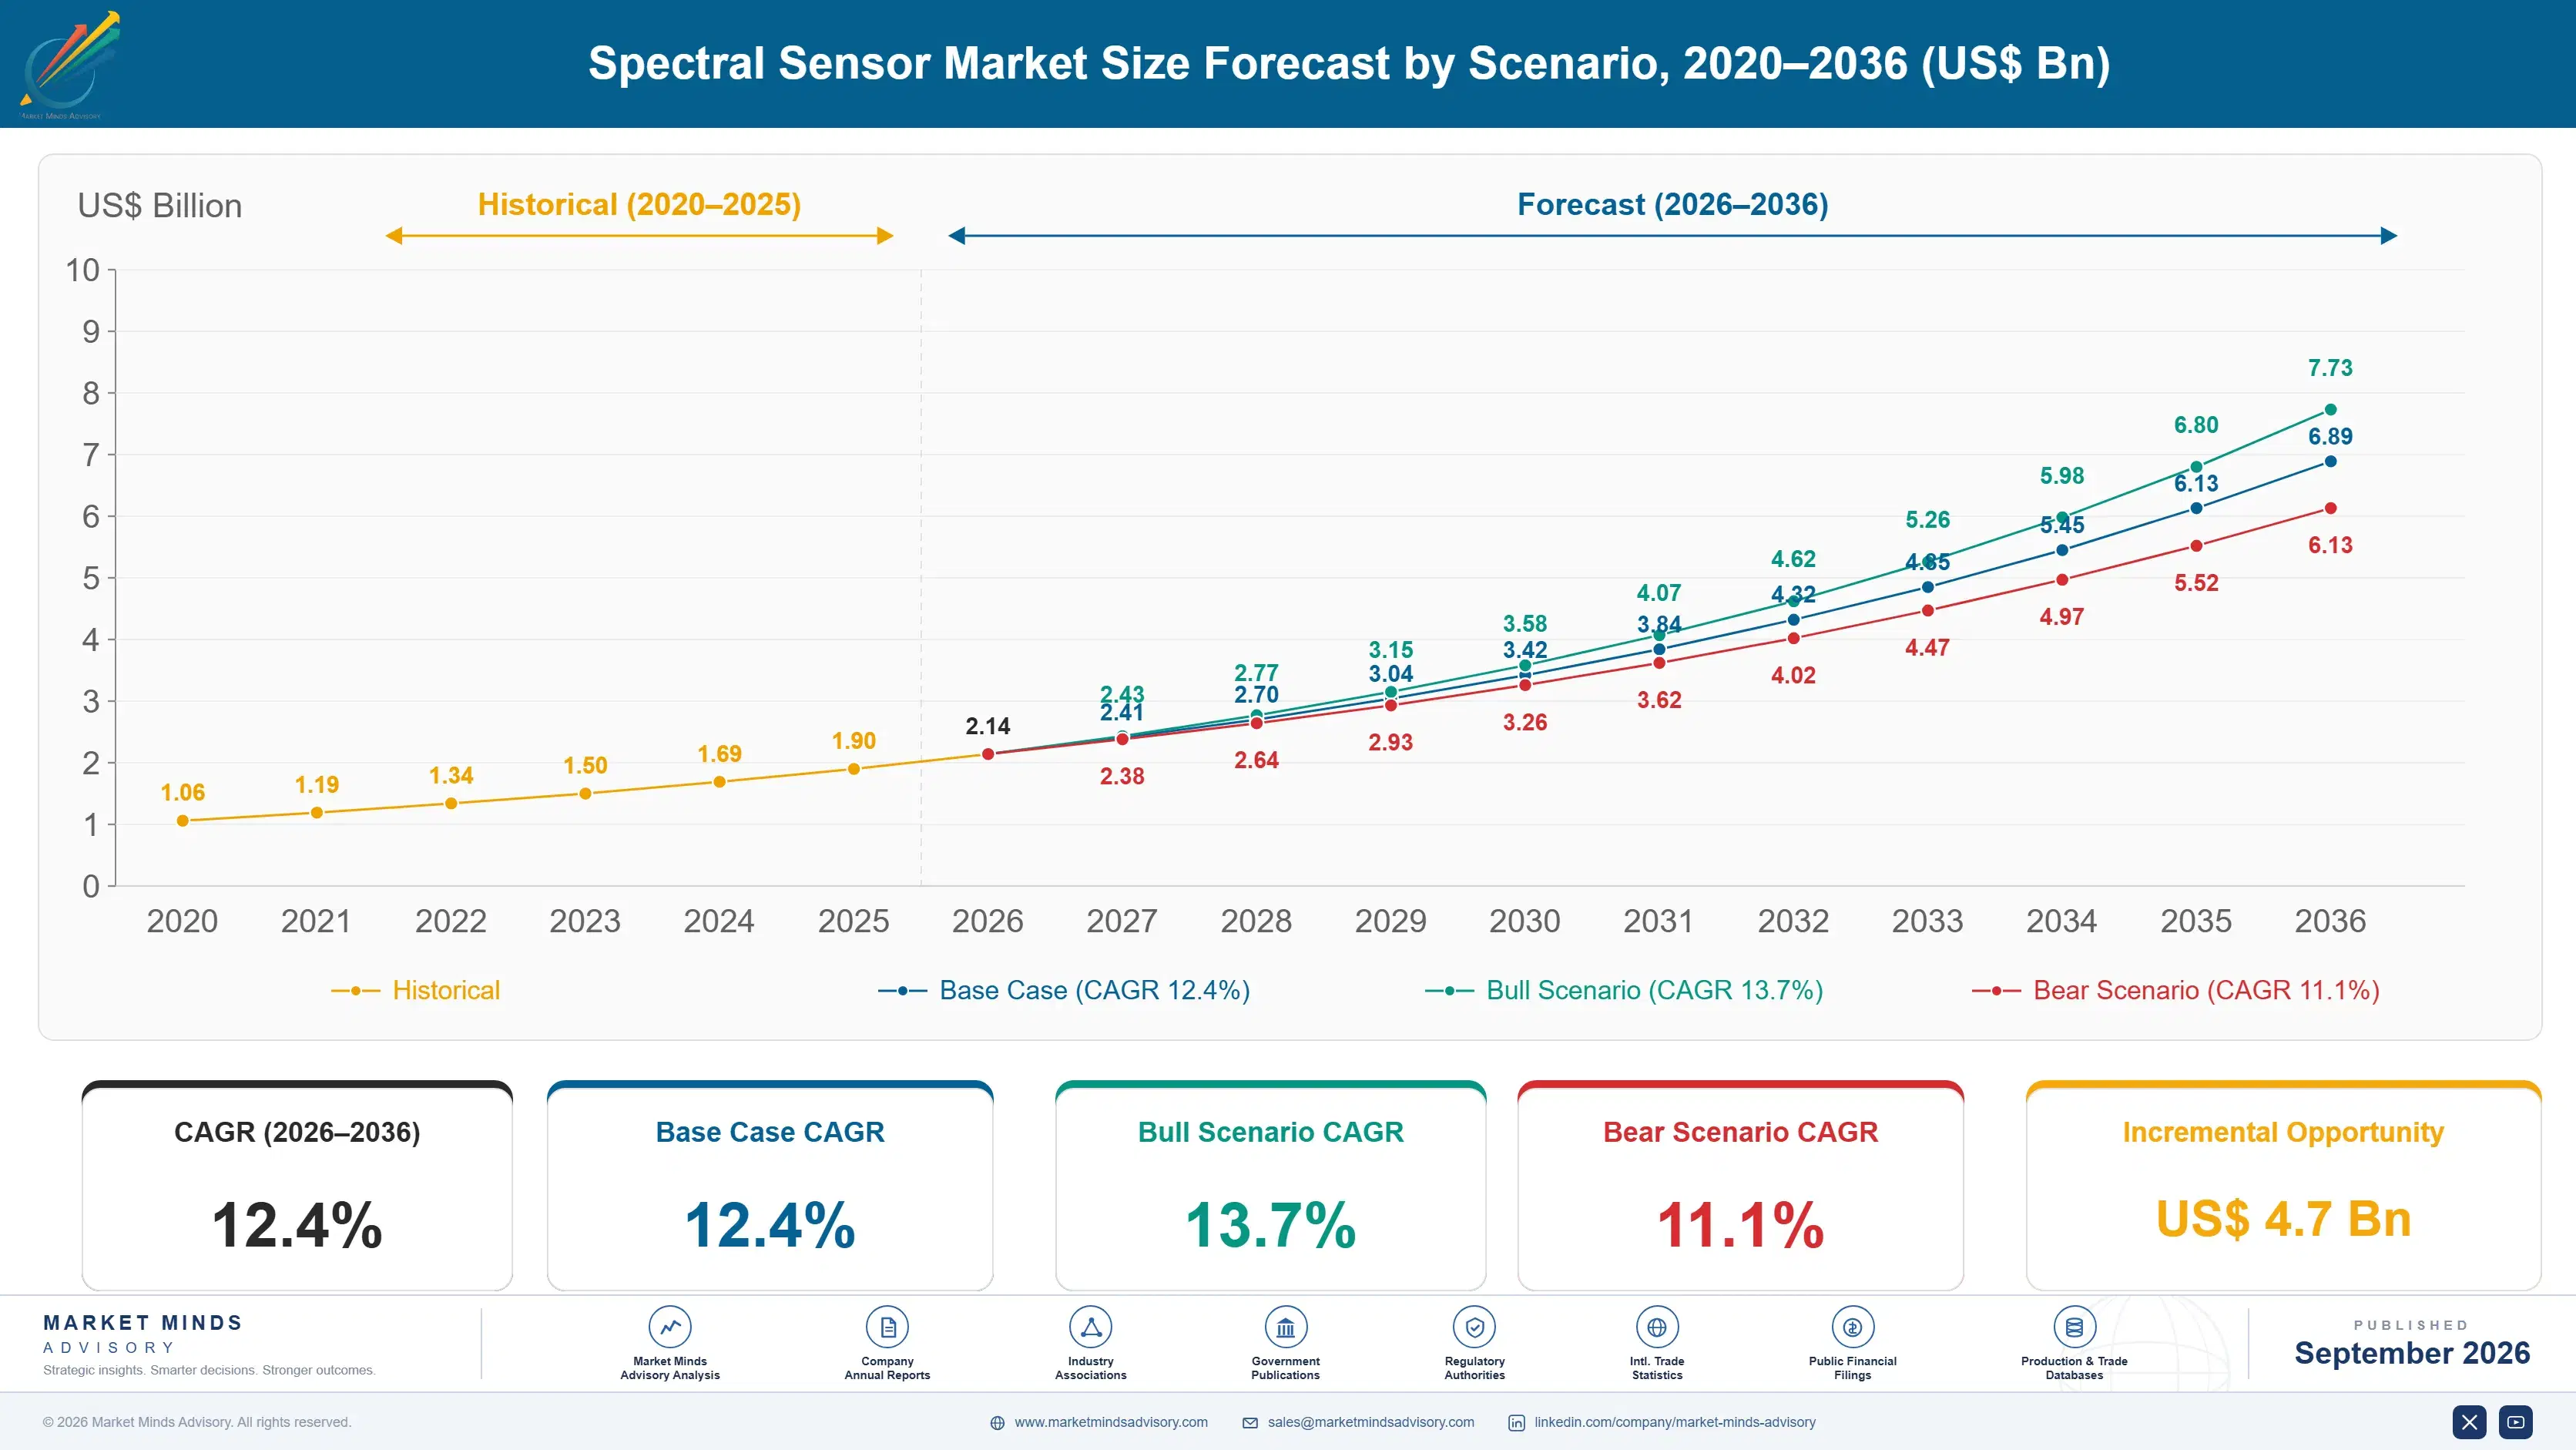
Spectral Sensor Market Forecast Scenarios

spectral-sensor-market-size-forecast-scenario-1789988928299
Between 2020 and 2025 the category compounded at 11.2%, and the growth arrived somewhere nobody predicted. The industry spent years preparing for consumer spectral sensing in smartphones, which did not happen because a module behind a phone cover cannot deliver the accuracy a consumer question requires. The volume went to agriculture, food processing and industrial inspection instead, where samples can be presented properly.
The base case holds 12.4% on three mechanisms. Agricultural equipment manufacturers are integrating near-infrared sensing directly into harvesters and sprayers, which puts measurement at the point of decision rather than in a laboratory days later. Food safety and authenticity regulation keeps tightening across major importing markets, and spectral verification is faster than chromatography. And plastics sorting for recycling has become a regulated requirement in the European Union rather than a voluntary practice.
The bull case at 13.7% assumes calibration model libraries become transferable between sensor units, which would remove the largest cost in every deployment and open applications currently uneconomic. The bear case at 11.1% is component price erosion outrunning volume growth, since a module at around USD 12 has considerably further to fall and Chinese suppliers are entering the category with familiar intent.

Position Beats Precision Almost Everywhere

The commercial logic of this industry is counterintuitive and took two decades to establish. A laboratory spectrometer measures far better than a module achieving around twelve nanometre resolution, and it sits in a laboratory. A sensor on the harvester, the sorting line or the mixing vessel answers the question while the decision is still open. Worse measurement, better position, and position wins almost everywhere.
TOP FIVE CONCENTRATION49%Concentrated among photonic makers holding genuine calibration capability
MINIATURE MODULE UNIT PRICEUSD 12Average for a near-infrared spectrometer module at volume
REFERENCE SAMPLES PER CALIBRATION1,800Laboratory measured samples required to build a chemometric model
SPECTRAL RESOLUTION ACHIEVED12 nanometresTypical for a miniaturised module against laboratory grade instruments
WAVELENGTH RANGE COVERED1350 nanometresSpan from visible through short wave infrared in modules
DESIGN WIN CYCLE22 monthsFrom sample delivery to production shipment at industrial customers
The product is not the sensor and most suppliers sell it as though it were. A spectral sensor produces a curve, and converting that curve into a number a customer cares about requires a chemometric model built on around 1,800 laboratory reference samples. That model is the intellectual property. Companies shipping silicon compete on a module price near USD 12 and falling. Companies shipping calibrated answers do not compete on price at all.
The consumer application everybody prepared for did not arrive. Spectral sensing in smartphones was expected by 2020 and remains marginal, because measuring food freshness or body composition through a phone cover demands accuracy that a three millimetre module cannot deliver. Sample presentation matters more than sensor capability. Industrial and agricultural applications control presentation, which is why the volume landed there.
"Every company in this category will tell you about their sensor's resolution and wavelength range. Ask how many reference samples went into the calibration and who owns that model, and you find out whether they are selling a component or an actual business."
Director, Photonic Components and Sensing Systems Practice · MMA Technology Practice · September 2026

Market Trends

Miniaturisation Moved Measurement To The Decision Point

A near-infrared module costing around USD 12 achieves roughly twelve nanometre resolution against laboratory instruments doing considerably better, and it wins anyway because of where it sits. Grain moisture measured on the harvester changes what the operator does in the next minute. The same measurement in a laboratory four days later changes nothing at all. Miniaturised modules compound at 18.6% against 12.4% for the market on exactly this logic, and the industry spent twenty years arguing about resolution before noticing that deployment position was the entire commercial question. Position was always the whole commercial question.
Market Impact: Design cycles run about 22 months
Calibration Models Became The Actual Product

A spectral sensor outputs a reflectance curve and nothing a customer can use directly. Turning that into fat content, moisture percentage or polymer type requires a chemometric model trained against around 1,800 laboratory reference samples for each material and each condition. Building that library takes months and considerable expense, and it does not transfer cleanly between sensor units without recalibration. Suppliers shipping silicon compete on a falling module price. Suppliers shipping validated models for specific applications hold pricing power that has nothing to do with the component underneath. Nobody buys a curve they cannot interpret.
Market Impact: Sorting sensors compound at 15.7%

Market Opportunities and Growth Drivers

Agricultural Machinery Is Integrating Sensing At Source

Harvester and sprayer manufacturers are building near-infrared measurement directly into machinery, so grain protein, moisture and forage quality are measured as the crop moves through rather than sampled afterwards. That changes what the operator does immediately, adjusts storage decisions at the point of loading, and produces a record buyers accept for pricing. Design win cycles run around 22 months at these customers and the resulting positions last a full machine generation. The application requires ruggedisation and calibration work that consumer-focused suppliers have generally not built. Consumer suppliers consistently underestimate what that work costs to build.
Market Impact: Transfer work follows all 1,800 samples

Plastics Sorting Regulation Turned Voluntary Practice Compulsory

European Union recycled content requirements oblige packaging producers to demonstrate polymer composition rather than assert it, and near-infrared sorting is the only method that identifies plastics at conveyor speed. Sorting facilities that previously used density separation and optical colour sorting now need spectral identification to meet documented content thresholds. Multispectral filter array sensors compound at 15.7% on this, and the demand is regulatory rather than economic, which makes it considerably more predictable than most industrial sensing applications. Black plastics remain genuinely difficult and nobody has fully solved that yet. Regulatory demand is considerably easier to forecast than economic demand.
Market Impact: Modules under 3 millimetres struggle

Market Restraints and Challenges

Calibration Does Not Transfer Between Sensor Units

A chemometric model built on one sensor performs worse on the next one off the same line, because small variations in filter deposition and detector response shift the spectral signature enough to matter. The root cause is manufacturing tolerance in optical components, which is far tighter than semiconductor tolerance and considerably harder to hold. Commercially this means every deployment carries calibration transfer work, which caps how far the category scales like a component business. Mitigation runs through standardisation references, transfer algorithms and tighter optical process control that raises unit cost.
Market Impact: Modules now cost around USD 12

Consumer Applications Keep Failing On Sample Presentation

Spectral sensing in phones has been expected for a decade and remains marginal, because the questions consumers ask require accuracy that a three millimetre module behind a cover glass cannot deliver. The root cause is sample presentation rather than sensor capability: distance, angle, ambient light and surface condition all move the measurement more than the sensor specification does. Commercially this removed the volume application the industry planned around. Mitigation runs through guided capture, application scoping toward questions the physics can answer, and honesty about what a phone genuinely cannot measure.
Market Impact: Calibration needs 1,800 reference samples
3 additional market trends, 4 additional growth drivers, and 2 additional restraints and challenges are covered in the full report. Contact sales@marketmindsadvisory.com to access the complete intelligence.

Segment CAGR and Growth Architecture

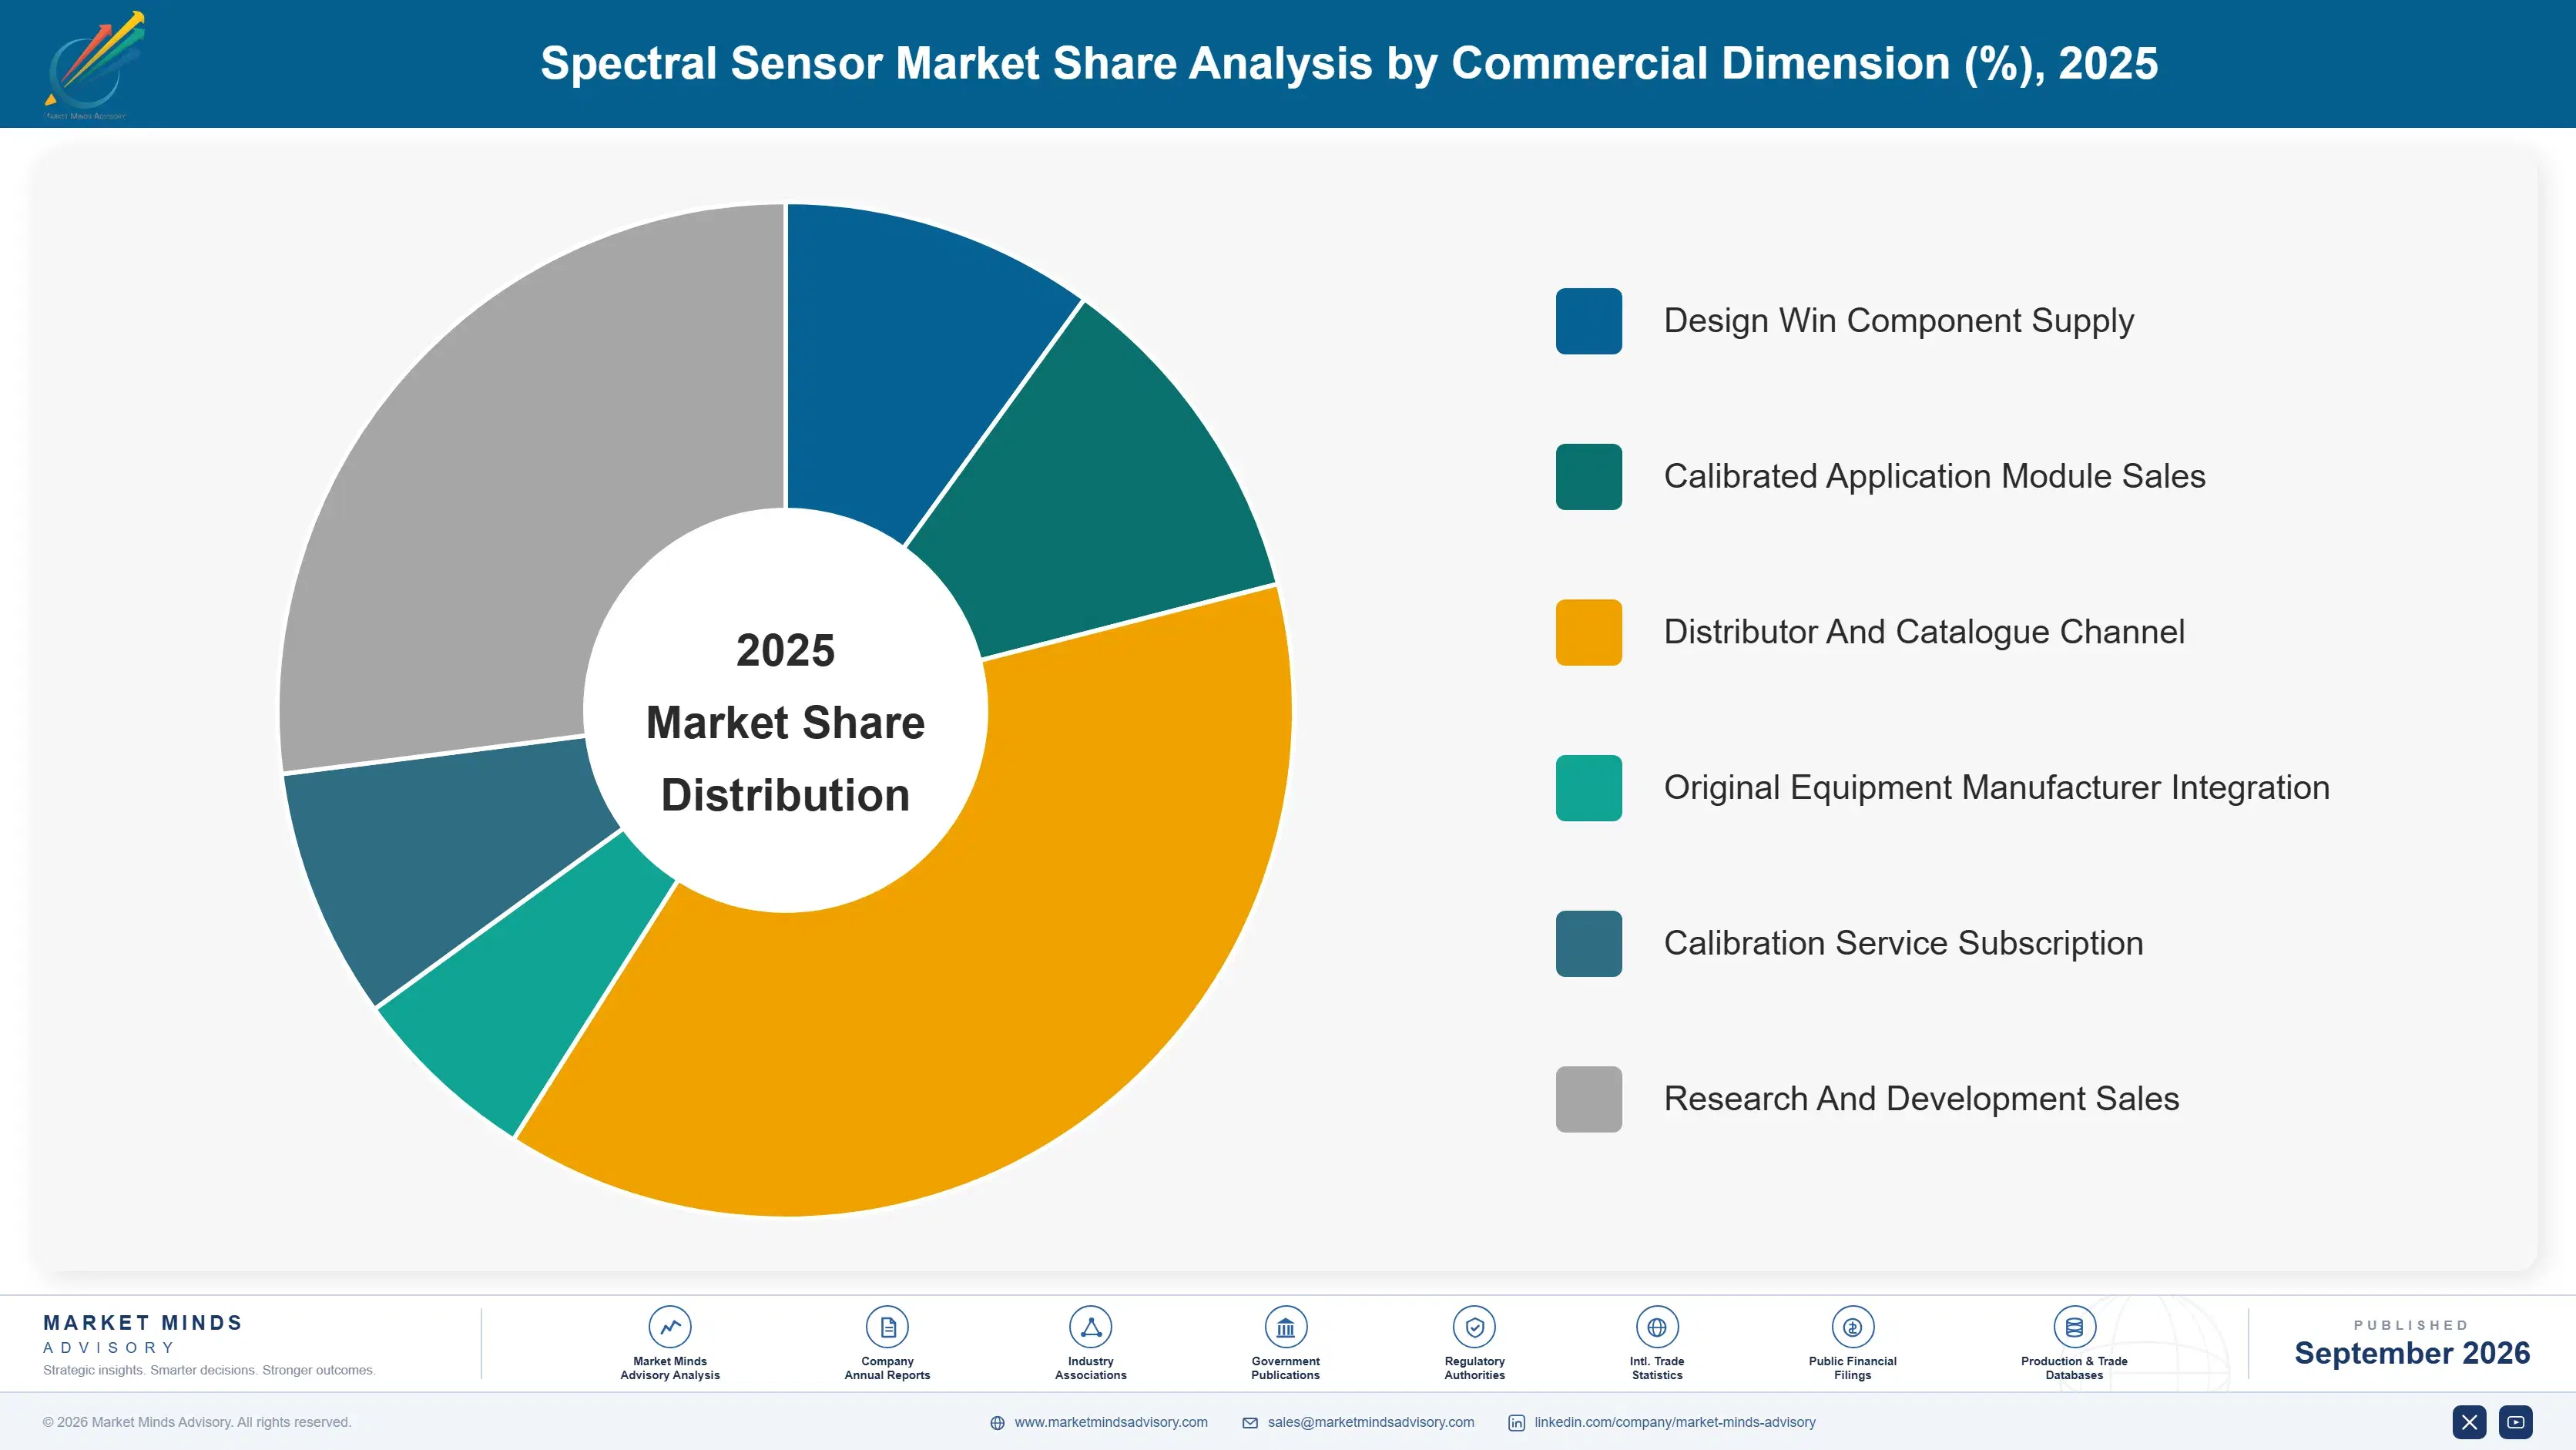
Segmentation follows sensing architecture, since how a device separates wavelengths determines its cost, its resolution and the applications it can serve. Six architectures cover the market: miniaturised near-infrared spectrometer modules, multispectral filter array sensors, Raman spectroscopy modules, hyperspectral line-scan imagers, Fourier transform infrared modules, and colour and ambient light sensors. Application vertical and calibration model are separate dimensions.
spectral-sensor-market-market-share-analysis-1789988928865

Miniaturised Near-Infrared Spectrometer Modules

Miniaturised near-infrared modules grow at 18.6%, half again the market rate of 12.4%, on deployment position rather than on measurement quality. A module costing around USD 12 achieves roughly twelve nanometre resolution while a laboratory instrument does considerably better, and the module wins because it sits on the harvester, the sorting line or the mixing vessel where the decision is actually taken. Grain moisture measured in the field changes what the operator does immediately; the same number four days later changes nothing. The remaining constraint is calibration, since each application needs a chemometric model built on around 1,800 laboratory reference samples before the module produces anything useful at all. Calibration remains the real barrier.
CAGR 18.6%

Multispectral Filter Array Sensors

Multispectral filter array sensors compound at 15.7% on regulation rather than on any economic argument. European Union recycled content rules require packaging producers to demonstrate polymer composition instead of asserting it, and near-infrared identification at conveyor speed is the only practical method for doing that. Sorting facilities running density separation and colour sorting now need spectral identification to document what they actually produce. The architecture places filters directly over pixel arrays, which is cheaper than dispersive optics and gives fewer bands, and that trade suits identification tasks far better than quantification. Black plastics absorb across the useful range and remain a genuinely unsolved problem. That single limitation shapes how sorting facilities are actually designed today.
CAGR 15.7%
Full segment breakdown across 6 segments available in the complete report.

Regional Architecture and Country Demand Map

East Asia leads at 38% of module shipment revenue, far above the standard band, because spectral sensors are semiconductor and optical components and almost everything in that description is manufactured there. North America and Western Europe hold the calibration and application depth without holding any of the volume.

East Asia

East Asia holds 38% of module shipment revenue, far above the 30% band ceiling, because a spectral sensor is a semiconductor with optical filters on top and both halves of that are made here. Sony Semiconductor Solutions and Hamamatsu Photonics hold genuine technology positions from Japan, and Chinese suppliers are entering the module category with the pricing intent familiar from every adjacent component business. China grows at 17.2%, well beyond the regional rate, on food inspection, agricultural adoption and consumer device integration together. Korean and Taiwanese assembly absorbs substantial volume. Manufacturing concentration here is not going to reverse in any timeframe worth modelling. Volume and technology both sit here, which is unusual for any component category.
Share: 38% | CAGR: 13.6% (2026 to 2036)

North America

North America takes 22% of module shipment revenue, at the band floor, and the position is calibration depth rather than manufacturing volume. Teledyne Technologies and Viavi Solutions hold industrial and optical filter positions built across decades, and Viavi supplies filters much of the rest of the industry depends on. Agricultural equipment manufacturers integrating sensing into harvesters are largely American, which is where the highest value application currently sits. Food safety regulation and pharmaceutical process analytical technology requirements both drive steady demand. Growth at 11.8% sits below the global rate on a mature base with limited consumer volume behind it. Calibration depth and application knowledge here considerably exceed what the shipment share implies about the region.
Share: 22% | CAGR: 11.8% (2026 to 2036)
Regional intelligence for 5 additional markets available in the complete report: Western Europe, South Asia and Pacific, Latin America, Middle East and Africa, Eastern Europe. Contact sales@marketmindsadvisory.com.
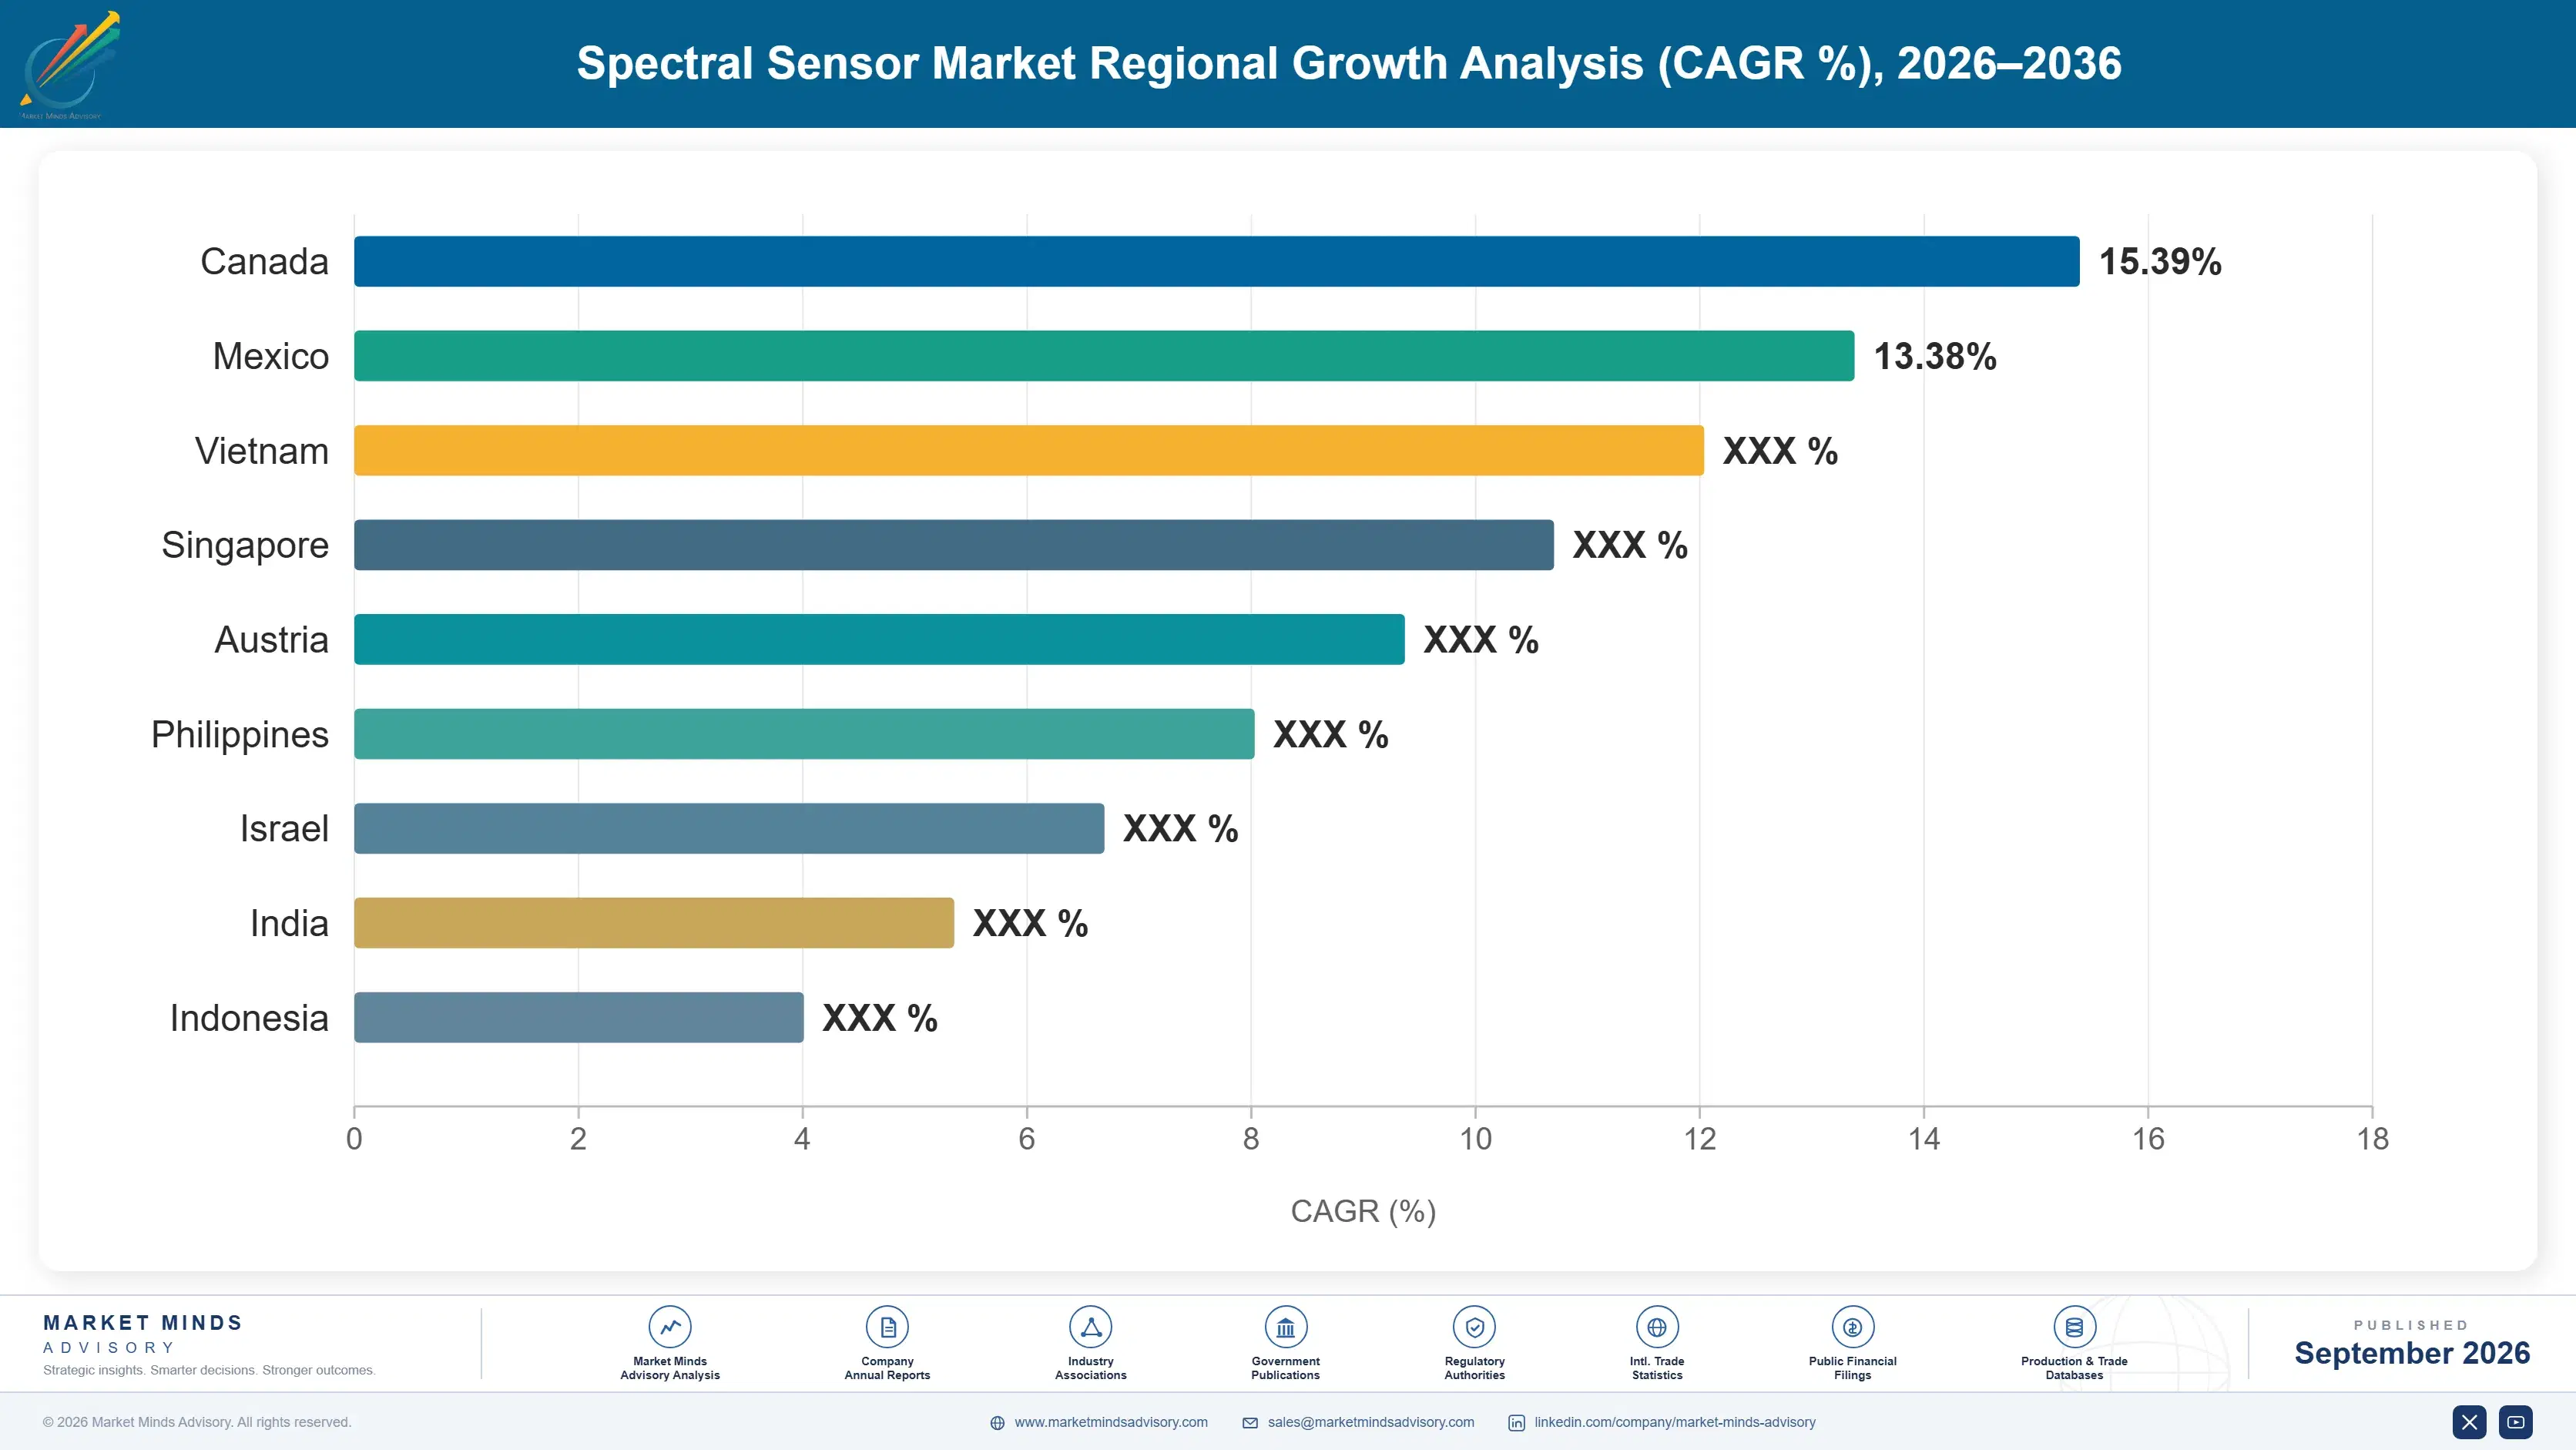
spectral-sensor-market-country-cagr-analysis-1789988929393

Where This Category Earns Margin

Module prices fall every single year without exception, the consumer smartphone application that this whole industry once prepared for never actually arrived at all, and the thing that customers genuinely need is a calibration model rather than a bare component. Each of the four levers below responds directly to one of those three facts.

Sell The Calibration Model, Not The Sensor

A spectral sensor outputs a reflectance curve that no customer can use, and converting it into fat content, moisture or polymer type requires a chemometric model trained on around 1,800 laboratory reference samples. Building that library takes months and real expense, which is exactly why it holds value. Suppliers shipping silicon compete on a module price near USD 12 that keeps falling, while suppliers shipping validated application models price against the value of the answer instead. Most of this industry is still selling components and calling the calibration a support activity.
Market Impact: Models built on 1,800 samples hold real pricing

Design Into Machinery Rather Than Instruments

A module on a harvester measuring grain protein as the crop moves through changes the operator's next decision, while the identical measurement in a laboratory four days later changes nothing whatever. Design win cycles at agricultural and industrial equipment manufacturers run around 22 months and the resulting positions hold for a full machine generation. That is slow, defensible revenue rather than component sales renegotiated annually. Reaching it requires ruggedisation and application calibration that consumer-focused suppliers have generally not built and consistently underestimate. Most consumer-oriented suppliers never build that capability at all.
Market Impact: A 22 month cycle holds for machine generations

Follow Regulation Into Compulsory Applications Instead

European Union recycled content rules oblige packaging producers to document polymer composition, and near-infrared identification at conveyor speed is the only practical method available for that. Multispectral filter array sensors compound at 15.7% on demand that is regulatory rather than economic, which makes it far more predictable than any industrial sensing application driven by payback calculations. Food authenticity enforcement creates similar compulsory demand across importing markets. Suppliers tracking rulemaking know where volume appears years ahead, and remarkably few of them actually do it. Volume appears where the rulebook says it will.
Market Impact: Regulated sorting compounds at 15.7% every single year

Solve Calibration Transfer Between Individual Units

A chemometric model built on one sensor performs measurably worse on the next unit off the same line, because filter deposition and detector response vary enough to shift the signature. Every deployment therefore carries transfer work on top of the original 1,800 sample calibration, which caps how far this category scales like a component business at all. Whoever makes models genuinely portable across units removes the largest cost in every deployment and opens applications that are currently uneconomic. It is an optical process control problem more than an algorithmic one.
Market Impact: Transfer work repeats the whole 1,800 sample cost

Who Controls the Margin Pool

Five suppliers hold 49% of spectral sensor component and module shipment revenue, concentrated by calibration capability rather than by silicon manufacturing. ams OSRAM and Sony Semiconductor Solutions reach volume through established semiconductor positions. Hamamatsu Photonics and Teledyne Technologies hold scientific and industrial depth accumulated over decades. Viavi Solutions supplies optical filters much of the rest of the industry depends on. All participants are assessed on component and module shipment revenue.
Competition runs on application calibration rather than on sensor specification, which datasheets obscure completely. Two modules with identical resolution perform very differently on a real material, because one supplier built a model on 1,800 reference samples and the other supplied a curve. Customers discover this during evaluation and the discovery decides the design win, which is why specification comparisons predict outcomes so poorly.

Rankings shift as Chinese suppliers enter module manufacturing with the pricing behaviour familiar from adjacent component categories. The defensible response is calibration depth rather than cost, since a model built on thousands of reference samples is not something capital acquires quickly. The second pressure is equipment manufacturers building sensing capability internally once volumes justify it.
spectral-sensor-market-company-positioning-matrix-1789988929931

Competitive Moat and Risk Dimensions

AMS OSRAM

Moat: Semiconductor Volume And Integration

ams OSRAM manufactures spectral sensors on semiconductor processes at volumes that give genuine unit cost advantage, and integrates emitter and detector in packages competitors assemble from separate parts. That combination reaches consumer and industrial customers who need small size and low cost together. Replicating it requires both optical filter capability and semiconductor scale, which very few organisations hold at once.
AMS OSRAM

Risk: Component Price Erosion Exposure

A business weighted toward module shipment competes on a price near USD 12 that keeps falling, and Chinese entrants bring the pricing behaviour familiar from every adjacent component category. Calibration depth defends against that and requires an applications organisation rather than a fabrication one. Semiconductor scale is exactly the wrong advantage when the value migrates into models.
HAMAMATSU PHOTONICS

Moat: Detector Physics And Precision

Hamamatsu holds detector technology developed across decades, particularly in short wave infrared where material quality and process control decide sensitivity in ways no design shortcut addresses. Scientific and industrial customers specify these parts by name because substitution genuinely changes results. That knowledge accumulates through manufacturing experience rather than through research spending, which makes it very slow to acquire.
HAMAMATSU PHOTONICS

Risk: Limited Consumer Volume Access

A position built on precision detectors for scientific and industrial customers serves a market where unit volumes stay modest by design. The high growth applications are agricultural and sorting deployments needing adequate performance at low cost rather than excellence at any price. Optimising for precision is the wrong optimisation when position rather than accuracy decides commercial outcomes.

Players Tracked

Prominent Players

ams OSRAM
Hamamatsu Photonics
Teledyne Technologies
Viavi Solutions
Sony Semiconductor Solutions

Other Key Players

trinamiX
Si-Ware Systems
Spectricity
Ocean Insight
Avantes
Ibsen Photonics
Headwall Photonics
Specim
Imec
Analog Devices
Broadcom
Vishay Intertechnology
Excelitas Technologies
Nireco
Innospectra

Recent Developments

MARCH 2025

ams OSRAM Expands Miniature Spectral Sensor Range For Industry

ams OSRAM extended its miniaturised spectral sensor range toward industrial and agricultural integration, an organic product development rather than an acquisition. Deployment position rather than measurement precision determines commercial value in these applications, and modules integrated into machinery answer questions while the operating decision is still open.
Signal: Component suppliers are now chasing the applications where being present matters considerably more than being precise.
SEPTEMBER 2024

trinamiX Extends Calibration Libraries For Material Identification

trinamiX expanded its calibration model libraries covering additional material classes for near-infrared identification, an organic development of existing chemometric capability rather than any transaction. A sensor without a model produces a curve nobody can use, and building each library requires roughly 1,800 laboratory reference measurements before deployment.
Signal: The model rather than the module is what customers are genuinely paying for in this category.
JUNE 2025

Viavi Expands Optical Filter Capacity For Spectral Sensing Demand

Viavi Solutions expanded optical filter manufacturing capacity serving spectral sensing customers, an organic capacity expansion rather than a partnership or merger. Filter deposition tolerance determines how far a calibration model transfers between sensor units, which is the largest hidden cost in every deployment across this whole category.
Signal: Optical manufacturing tolerance decides calibration portability, which decides whether any of this actually scales like components.

What A Spectral Module Costs

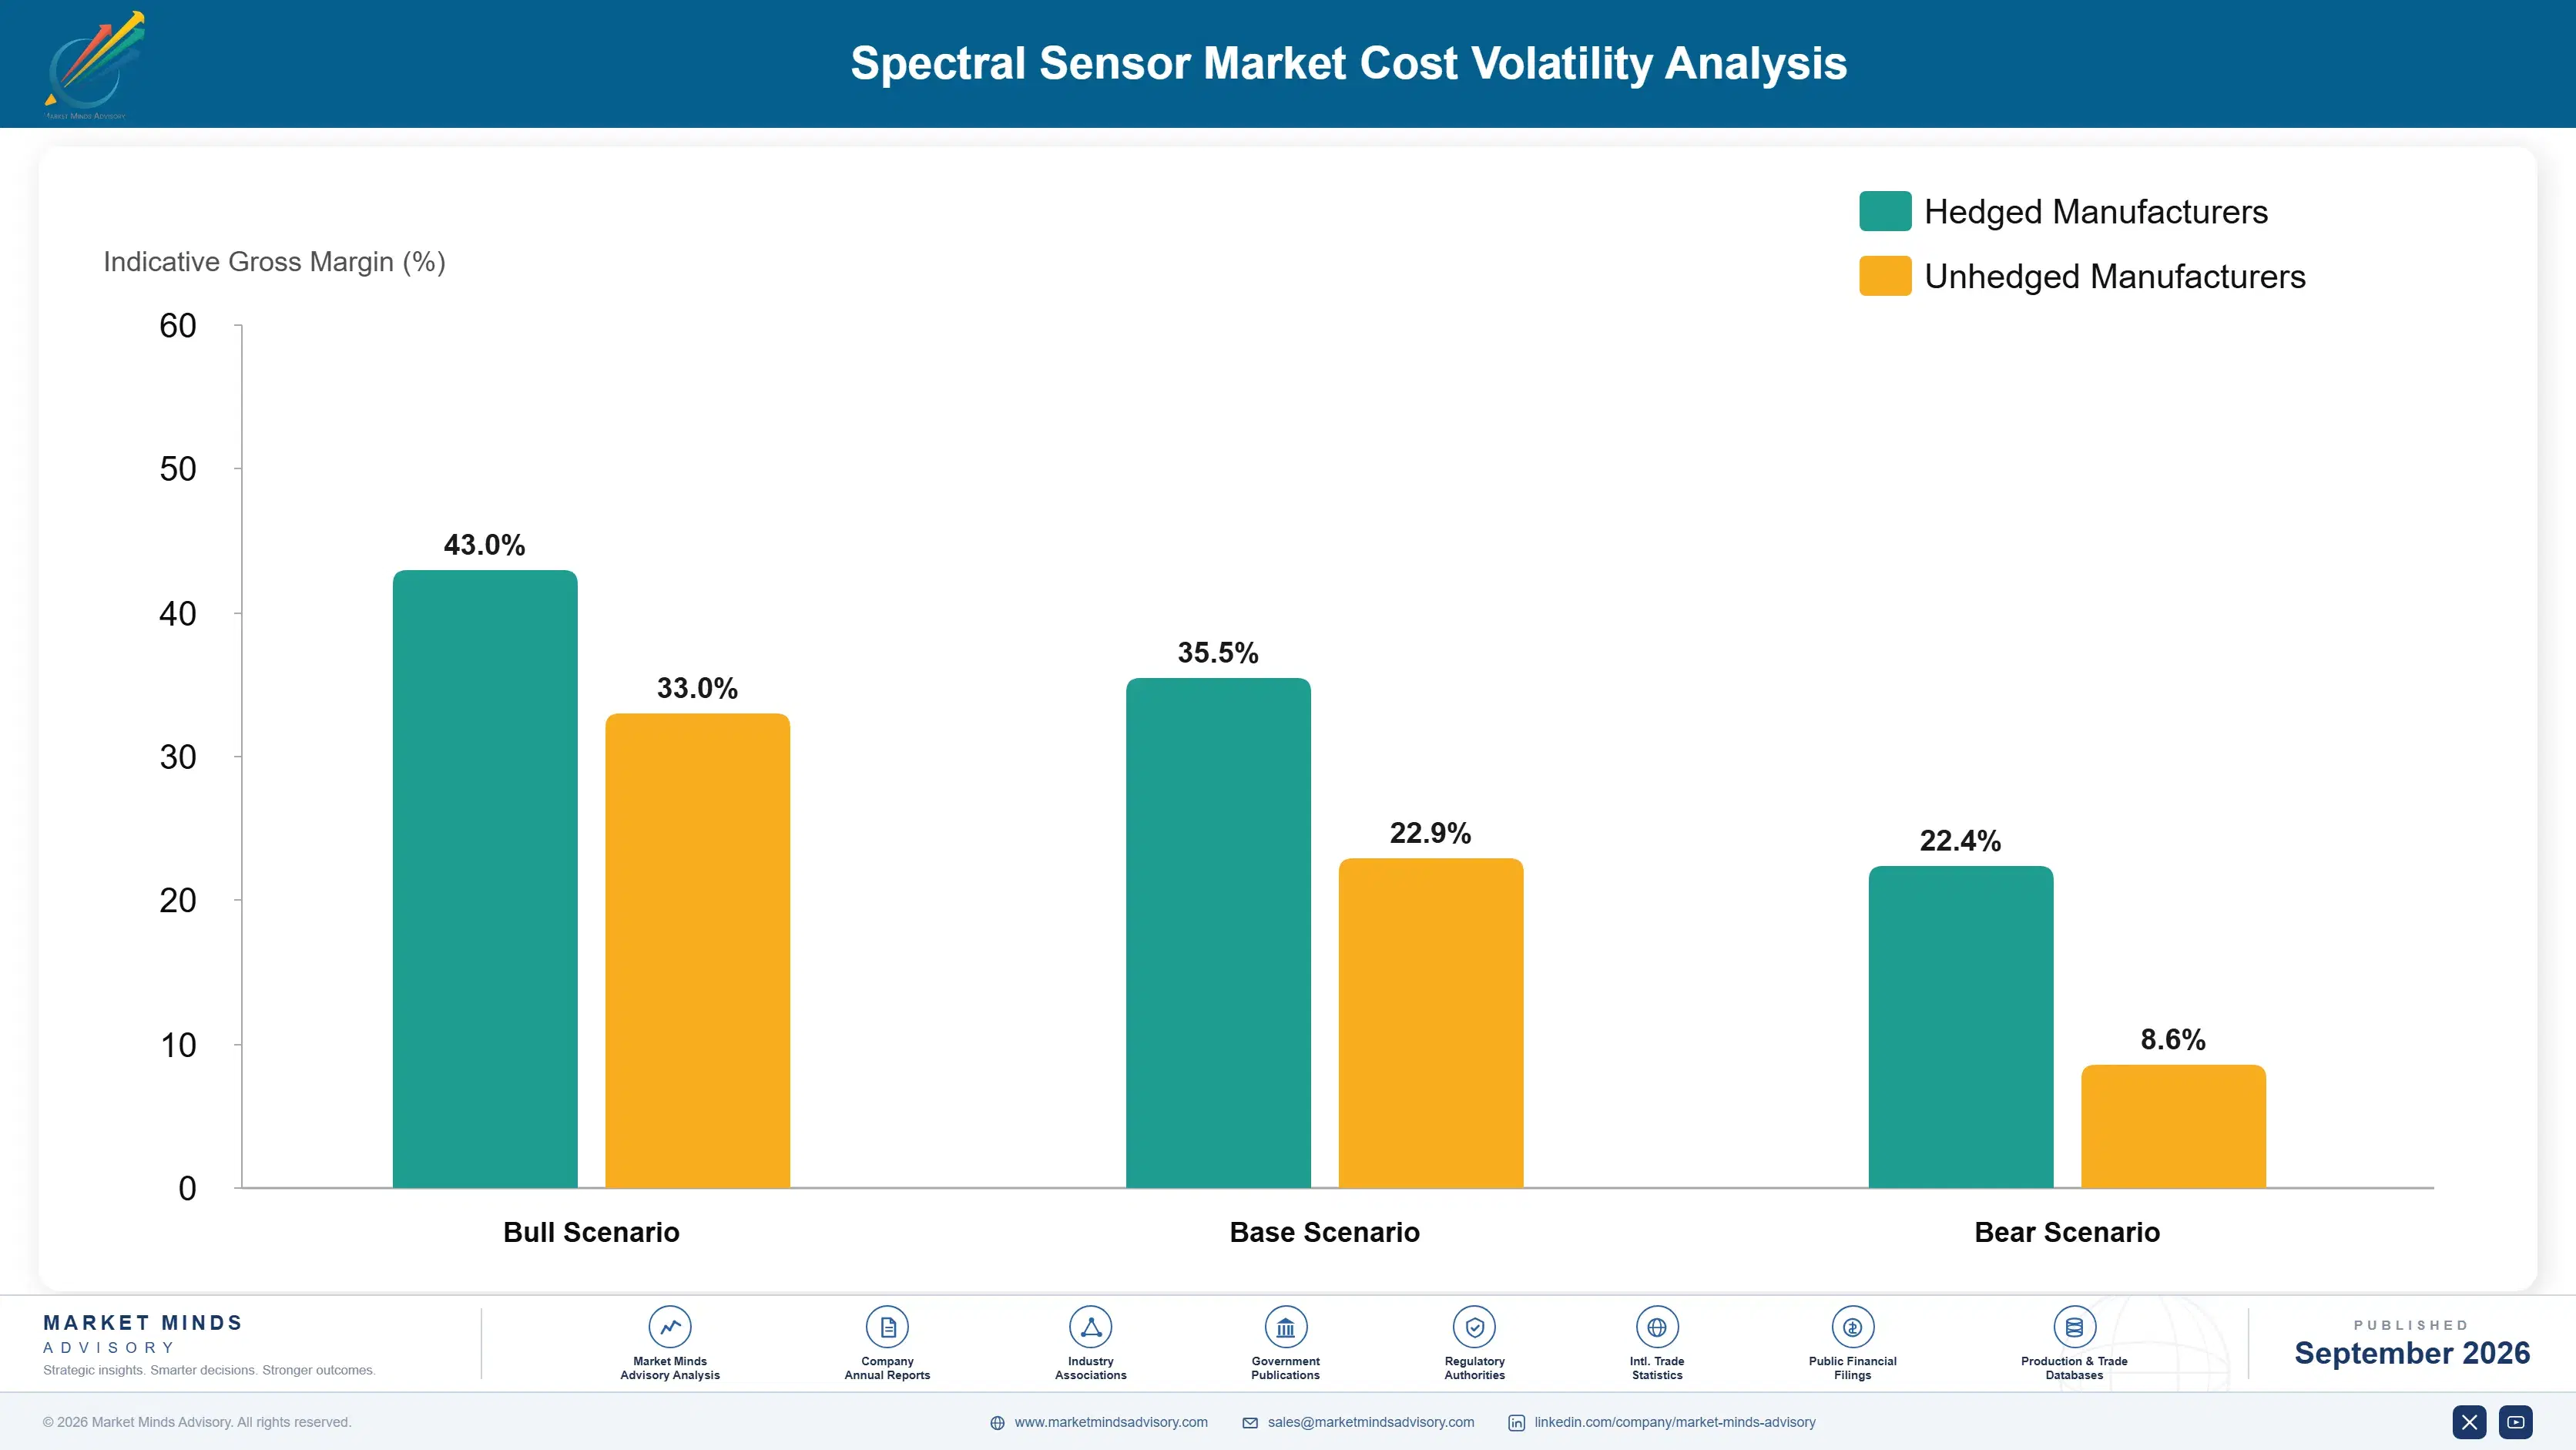
Optical filter deposition accounts for roughly 34% of module cost, and the tolerance required is far tighter than anything semiconductor processing normally demands. Detector die carries around 22%, rising sharply for short wave infrared where indium gallium arsenide replaces silicon entirely. Packaging and optical alignment absorb about 18%, and calibration development takes most of the remaining balance on any application-specific product.
Indium and gallium pricing moved sharply following Chinese export controls introduced in 2023, and short wave infrared detectors depend on both metals directly. Hamamatsu Photonics Annual Report 2024 and Viavi Solutions Annual Report 2024 both record raw material availability and optical coating capacity as operating variables. Suppliers with fixed price customer agreements absorbed the increase, since a module priced at around USD 12 has very little room to pass anything through at all.

The competitive disadvantage mechanism is optical process control rather than any material cost. A supplier holding tight filter deposition tolerance ships modules whose calibration models transfer between units, while one with looser control forces recalibration on every deployment and carries that expense invisibly. Exposure varies by architecture too, since filter arrays depend on deposition uniformity and dispersive modules on mechanical alignment.
spectral-sensor-market-cost-volatility-analysis-1789988930130

Tighten Filter Deposition Tolerance Before Cutting Cost

Optical filter deposition runs around 34% of module cost and its tolerance determines whether calibration models transfer between units at all. Loosening tolerance to save a few cents per module creates recalibration expense on every deployment that dwarfs the saving many times over. Most cost reduction programmes examine the bill of materials and never what looser optics costs downstream.

Qualify Indium And Gallium Supply Outside China

Short wave infrared detectors depend on indium gallium arsenide and both metals are refined overwhelmingly in China, which introduced export controls in 2023 with immediate effect on availability. Recovery from zinc and aluminium processing residues exists at small scale in Japan, Korea and Europe. Qualifying those sources costs more per kilogram and removes an exposure no supply contract actually covers.

Build Calibration Libraries As Reusable Assets

Calibration development is treated as project cost at most suppliers, so a model built for one customer is rebuilt from scratch for the next one facing an identical material. Structuring reference measurements as a reusable library amortises around 1,800 samples across many deployments instead of one. The discipline is data management rather than chemometrics, and few applications teams own it.

Portfolio Architecture for Margin Defence

Margin architecture separates on whether the supplier ships a component or an answer. Colour and ambient light sensors earn least, since they are commodity parts in consumer devices sold on price against many alternatives. Fourier transform infrared and hyperspectral imagers sit in the middle on specialist volume. Near-infrared modules, filter array sensors and Raman modules earn most, because each is sold with application calibration the customer cannot easily build.
The volume versus premium tension is about where a supplier places its applications engineers. Consumer volume requires unit cost above everything, which means a fabrication organisation and a thin applications team. Industrial and agricultural deployment requires calibration depth, which means chemometricians and reference laboratories that consumer margins cannot support. Suppliers who try to serve both from one organisation generally do the second one badly and lose the design wins.

High-value pools concentrate in calibrated application modules and in regulated sorting, and neither is reached by improving the sensor. Calibrated applications require reference libraries built on thousands of laboratory measurements over months. Regulated sorting requires tracking rulemaking that decides where volume appears years ahead. Both are organisational capabilities that a component business rarely has any reason to develop.

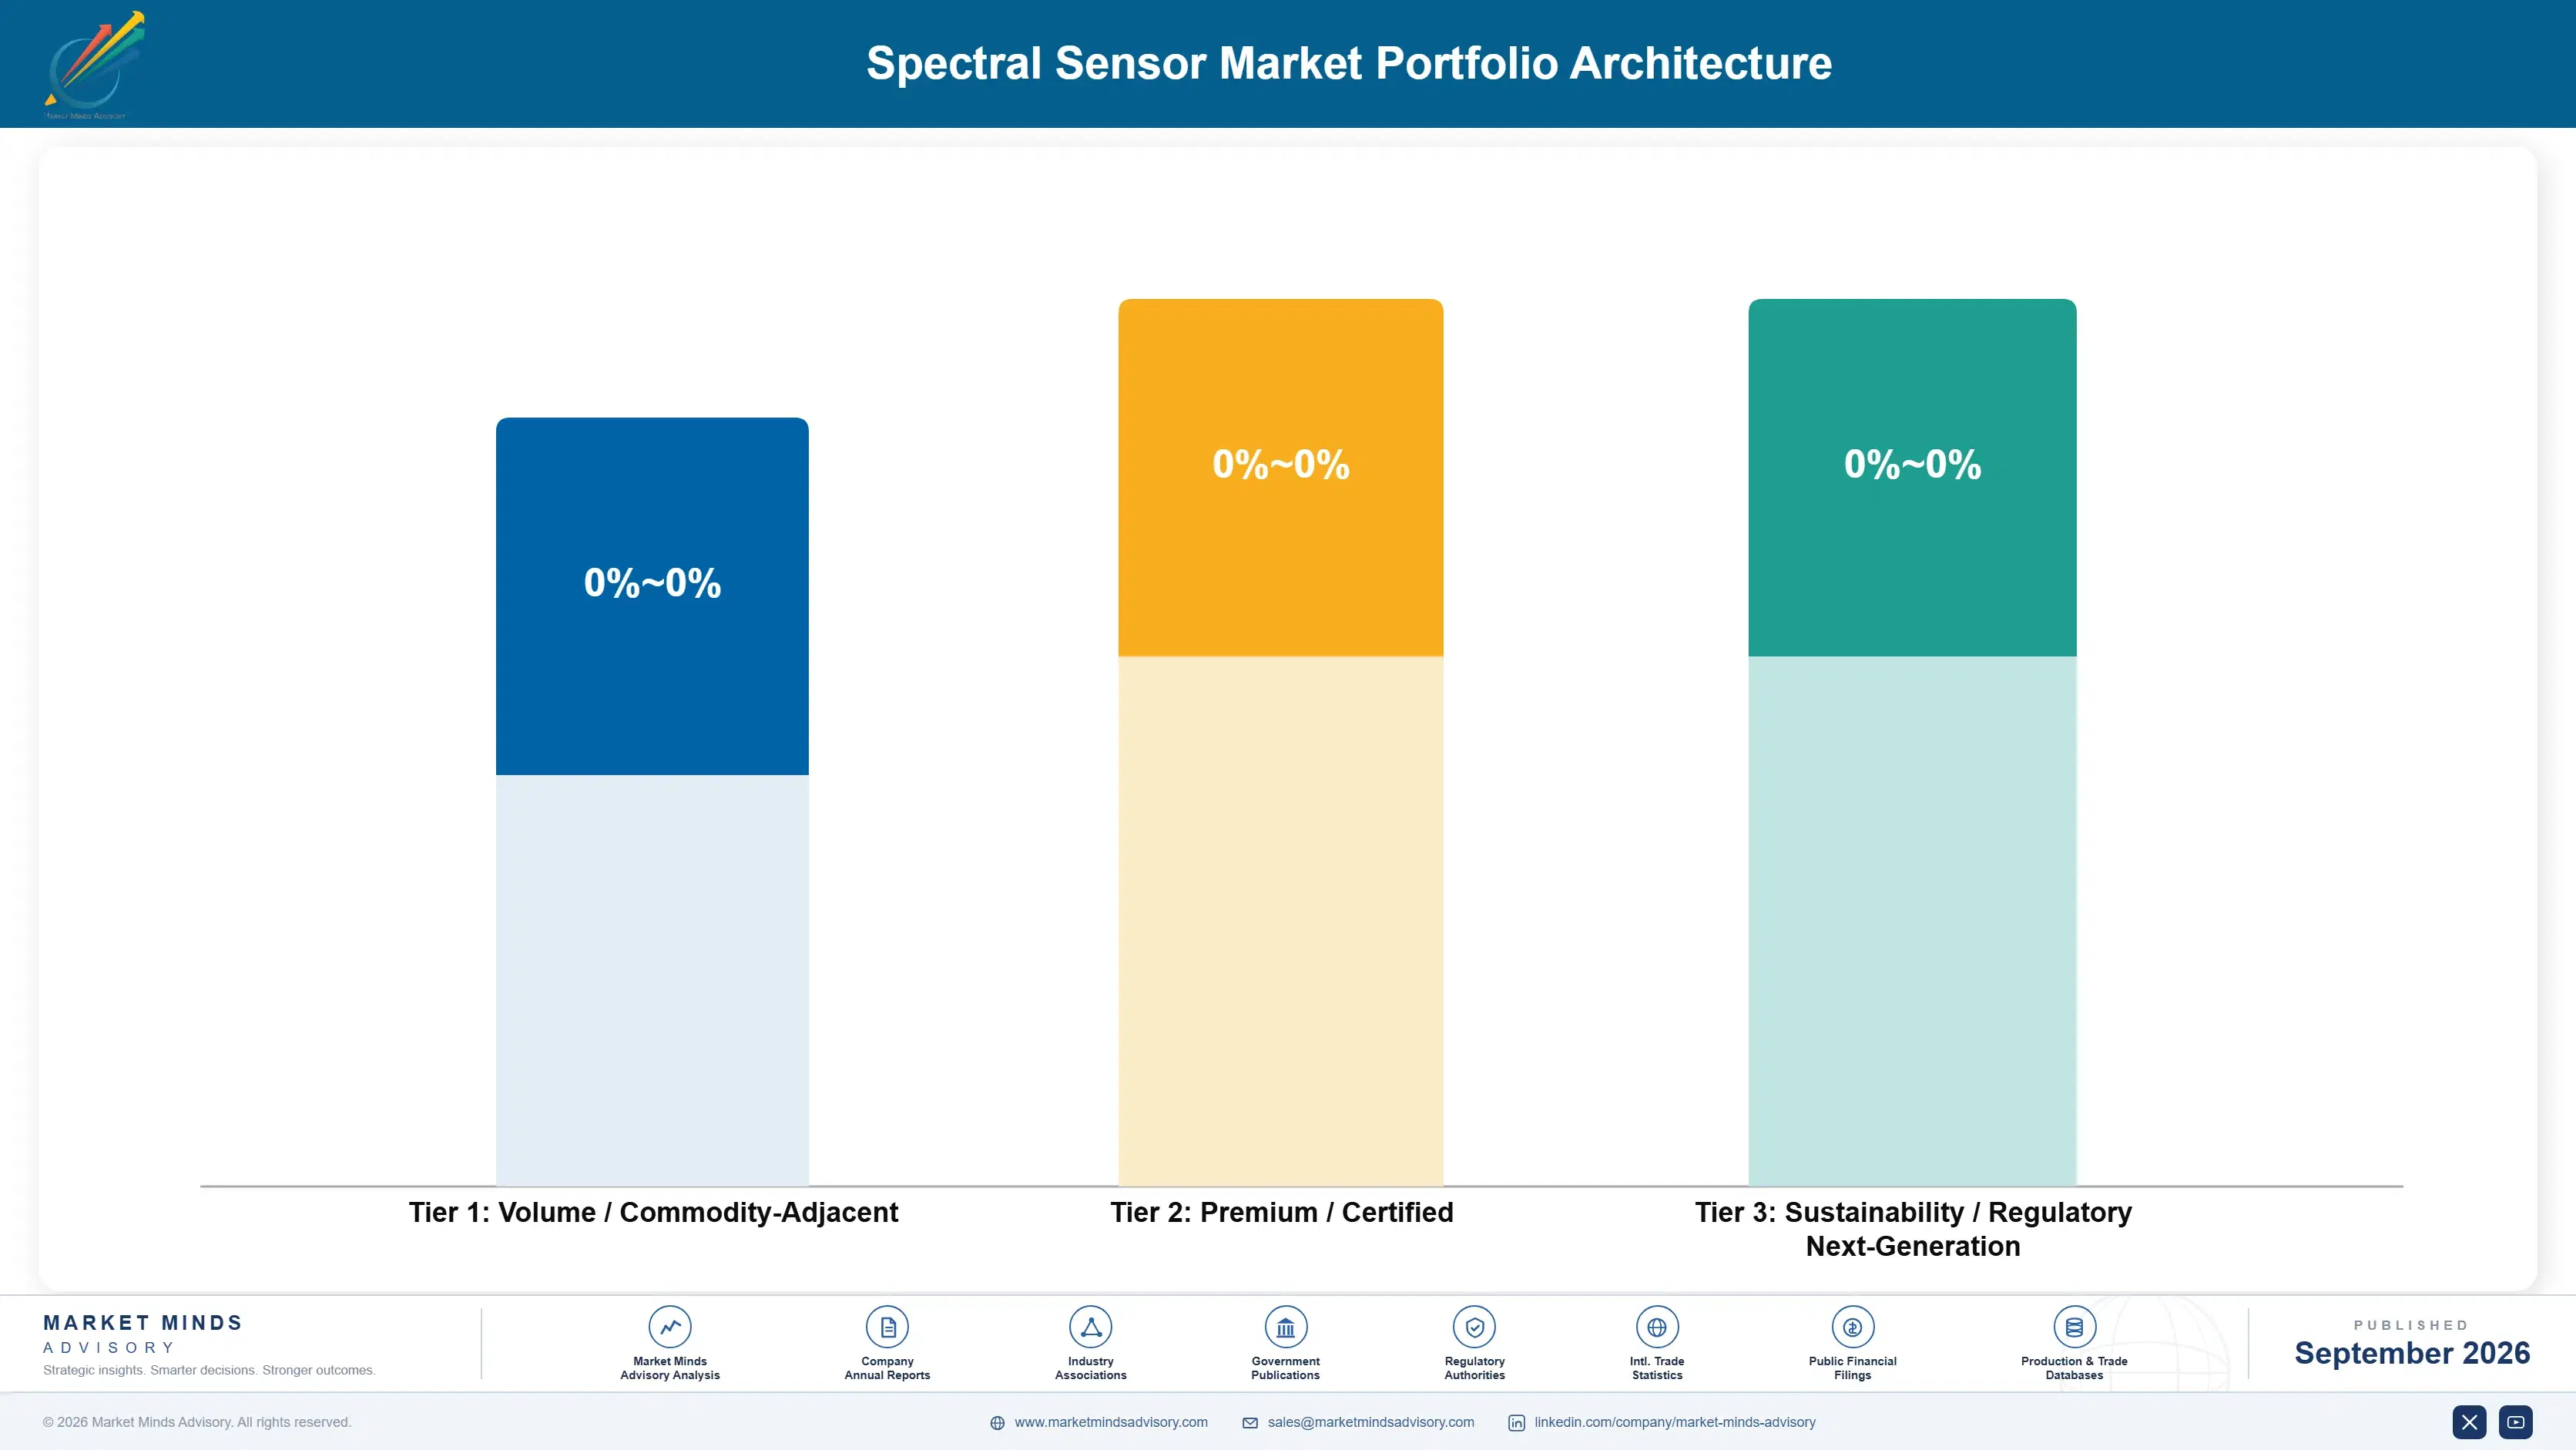
Volume / Commodity-Adjacent

Colour and ambient light sensors shipped into consumer devices as commodity components with many substitutable alternatives available. The eight point spread separates suppliers with semiconductor scale and amortised process capability from those buying wafers and assembling modules at higher cost.
Gross Margin: 22% to 30%

Premium / Certified

Fourier transform infrared modules and hyperspectral line-scan imagers sold into specialist industrial and scientific applications at modest volume. The twelve point spread tracks how much of a supplier's book sits in designed-in positions rather than in catalogue sales renegotiated on price each year.
Gross Margin: 38% to 50%

Sustainability / Regulatory / Next-Generation

Near-infrared modules, multispectral filter arrays and Raman modules sold with application calibration the customer cannot build alone. The fourteen point spread reflects reference library depth, which determines whether the supplier prices a component or prices the answer it produces.
Gross Margin: 56% to 70%
spectral-sensor-market-portfolio-architecture-1789988930628

High-value Sub-segments and Strategic Watch-out

Miniaturised Near-Infrared Spectrometer Modules

Grows at 18.6% on deployment position rather than measurement quality, since a module on the harvester beats a laboratory four days away. The fourteen point spread reflects calibration depth. Each application still needs around 1,800 laboratory reference samples before anything works. Calibration is the barrier, not physics.
Gross Margin: 56% to 70%

Multispectral Filter Array Sensors

Grows at 15.7% on European recycled content rules requiring documented polymer composition rather than asserted composition. The fourteen point spread reflects library breadth. Demand is regulatory rather than economic, which makes it considerably more predictable than payback driven adoption. Black plastics remain genuinely unsolved. Nobody has solved that yet.
Gross Margin: 56% to 70%

Raman Spectroscopy Modules

Grows at 13.9% on pharmaceutical process analytical requirements and materials identification where near-infrared cannot distinguish similar compounds. The fourteen point spread reflects laser and optics quality. Regulated pharmaceutical validation makes these positions unusually durable once they are established. Validated methods filed to a regulator rarely change afterwards.
Gross Margin: 56% to 70%

Colour And Ambient Light Sensors

Grows at 5.4%, slowest of the six architectures, as a commodity consumer component with many substitutable alternatives competing hard on unit price. The eight point spread separates semiconductor scale from module assembly. Volume is enormous and the margin available is genuinely thin. Enormous volume, very thin margin.
Gross Margin: 22% to 30%

How These Positions Actually Last

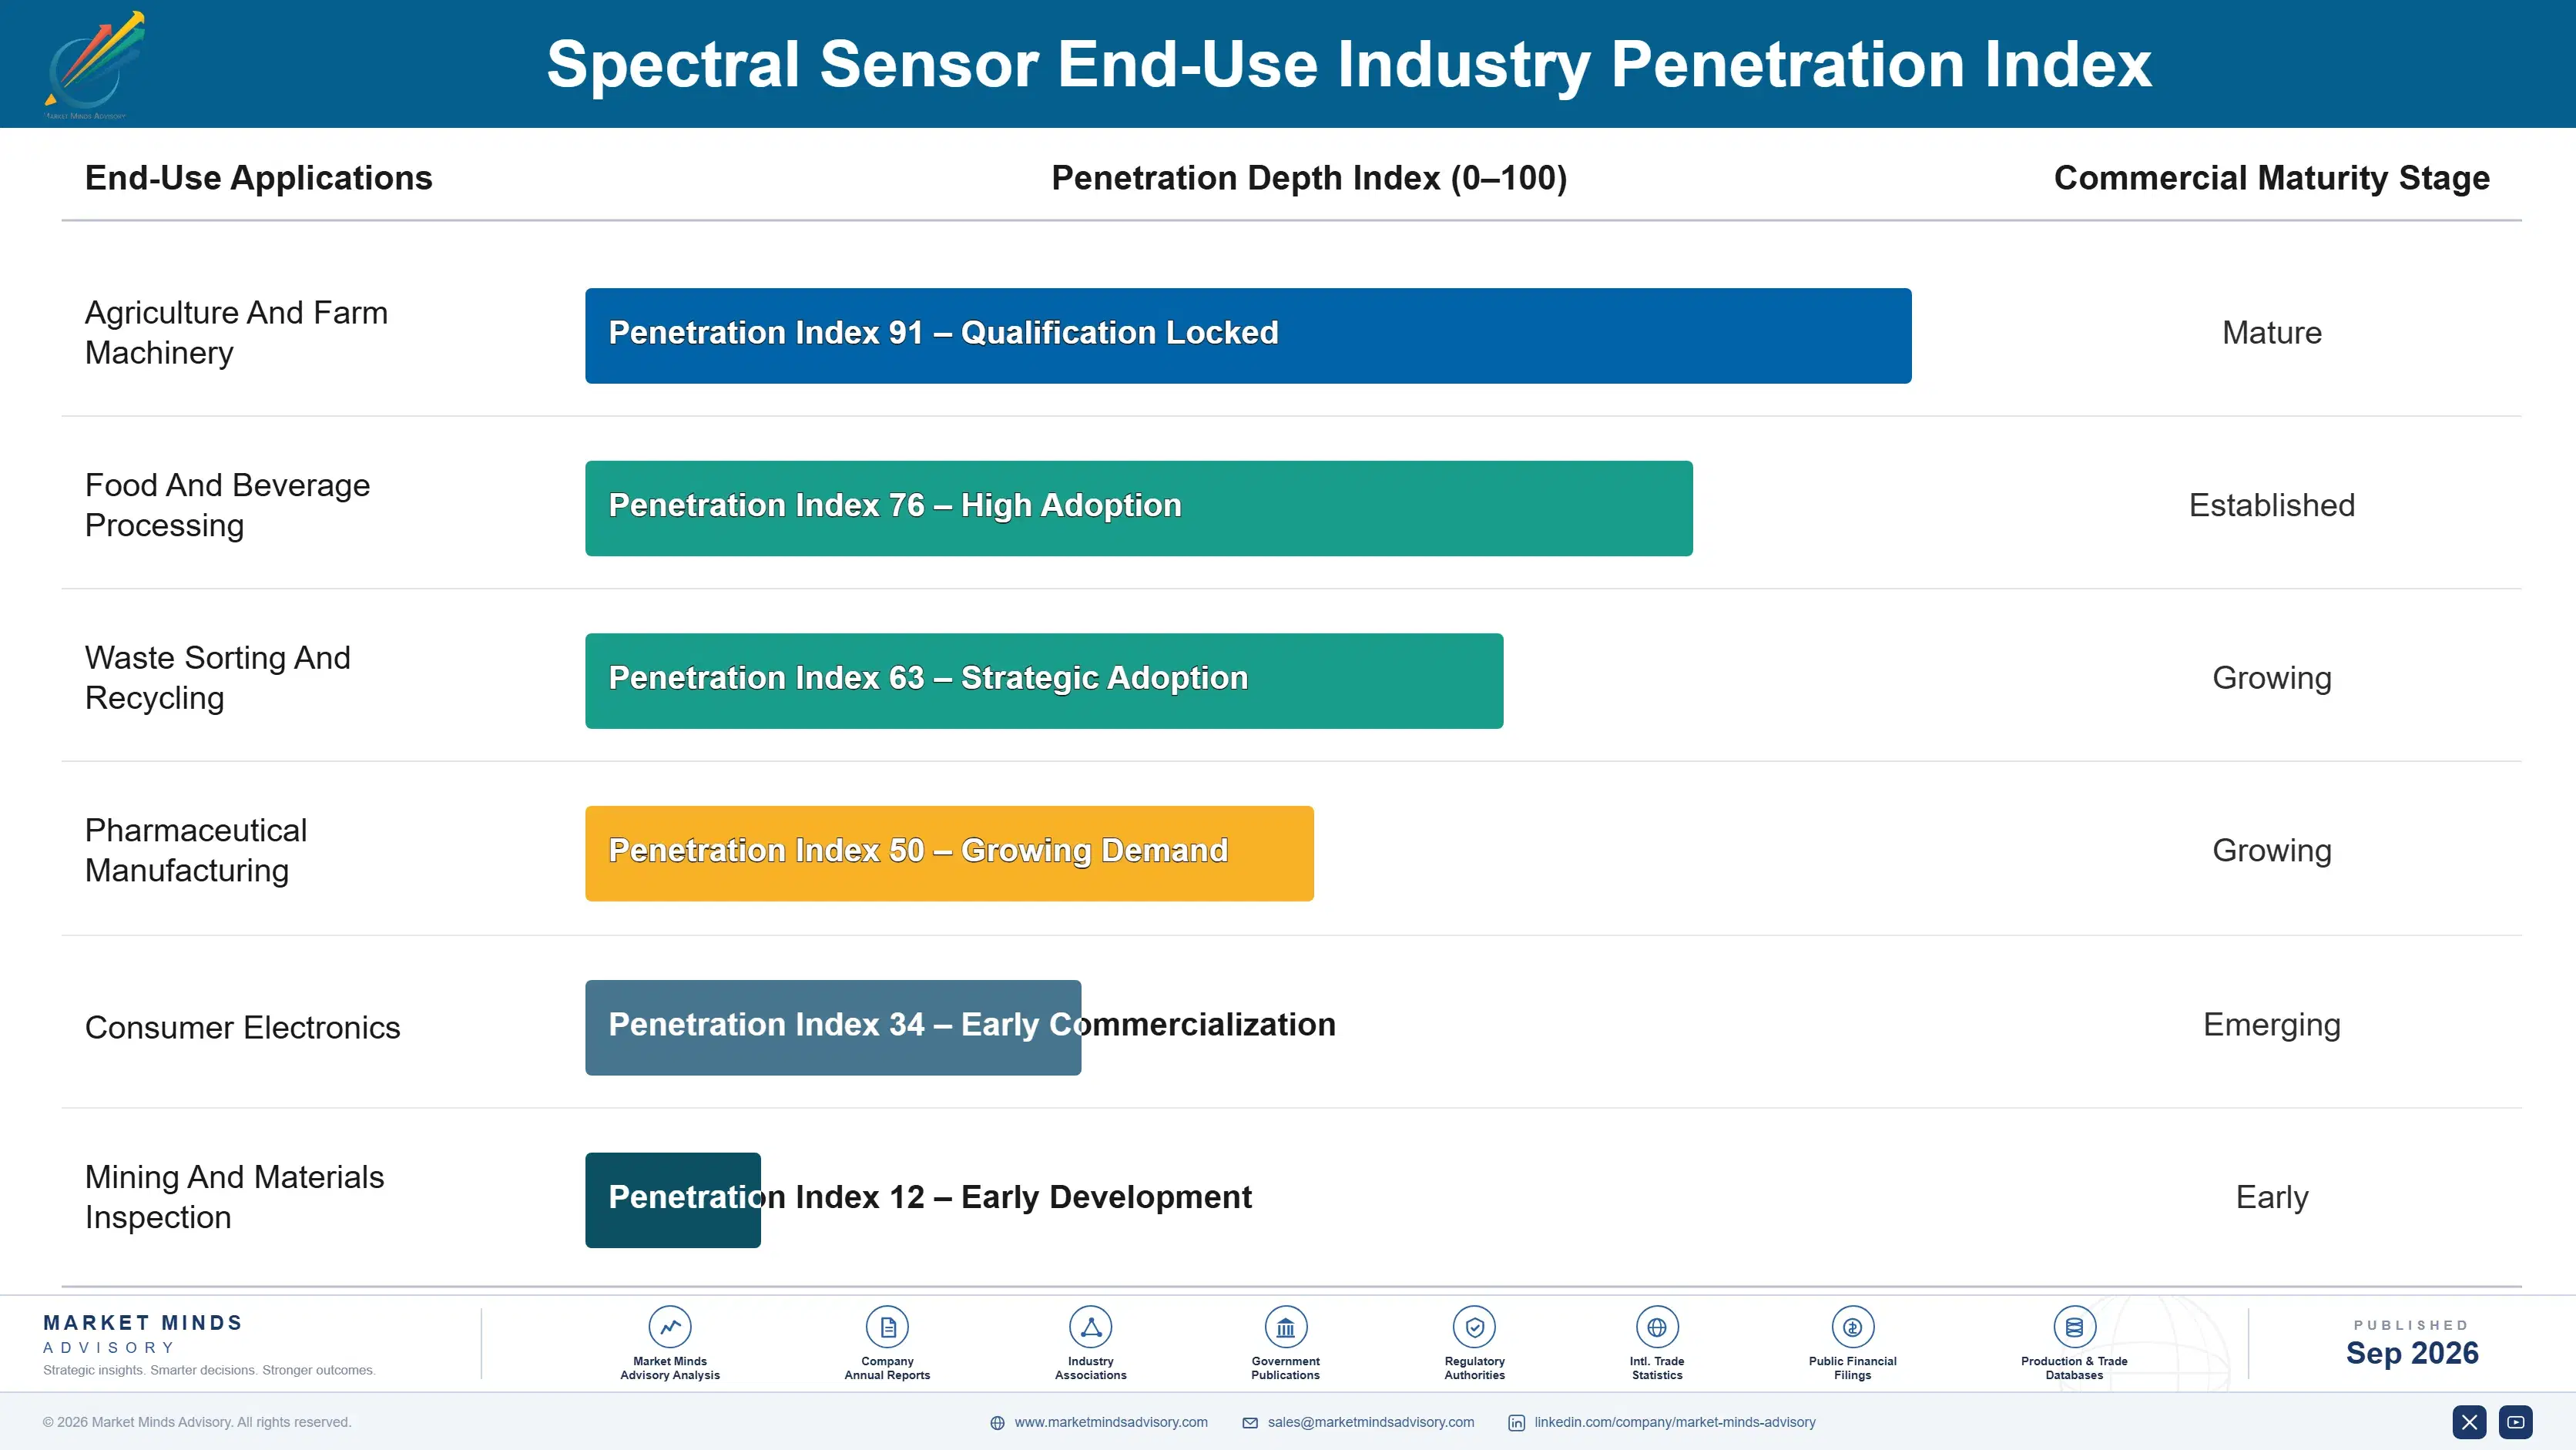
The annuity is the calibration model rather than the component supply agreement. Once a customer has validated a chemometric model built on around 1,800 reference samples against a specific sensor, changing supplier means rebuilding that library from the beginning and revalidating everything downstream of it. In regulated applications that revalidation requires documentation nobody wants to repeat. The switching cost sits in the data rather than the hardware, which makes it durable.
Depth varies enormously by application. A pharmaceutical process analytical deployment with validated methods filed to a regulator is effectively permanent for the product's life. An agricultural machinery design win holds for a full machine generation, which runs years. A consumer colour sensor is a commodity part replaced at the next board revision for a few cents, and the supplier finds out when the purchase order stops arriving.

The buyer moved from an instrumentation specialist to a product engineer who has never operated a spectrometer. An instrumentation buyer compared resolution, wavelength range and signal to noise. A product engineer wants a part that outputs moisture percentage and works in a machine. Suppliers leading with spectral specifications answer questions this buyer cannot evaluate.
spectral-sensor-market-end-use-penetration-index-1789988931125

Where Sensing Value Actually Sits

These are among the four positions where our research anticipates prominent divergence between winners and laggards over the coming forecast period. Each is grounded in the demand model, the regulatory perimeter, and the announced capacity pipeline.
01 / CALIBRATION ASSET BUILDING

Own The Model, Not The Component

A spectral sensor outputs a reflectance curve that no customer can act on, and converting it into fat content, moisture percentage or polymer type requires a chemometric model trained on roughly 1,800 laboratory reference samples. Building that library takes months and considerable expense, which is precisely why it retains value while silicon does not. Suppliers shipping components compete on a module price near USD 12 that keeps falling, while suppliers shipping validated application models price against the value of the answer instead.
02 / MACHINERY DESIGN INTEGRATION

Get Inside The Machine, Not The Laboratory

A module measuring grain protein on a harvester changes what the operator does within the next minute, while the identical measurement performed in a laboratory four days later changes nothing at all for anybody. Design win cycles at agricultural and industrial equipment manufacturers run around 22 months and the resulting positions hold for a full machine generation afterwards. That is slow, defensible revenue rather than component sales renegotiated annually on price against a field of interchangeable alternatives that all look the same on paper.
03 / REGULATORY DEMAND TRACKING

Follow The Rulebook Into Compulsory Volume

European Union recycled content rules oblige packaging producers to document polymer composition rather than assert it, and near-infrared identification at conveyor speed is the only practical method anybody has for doing that. Multispectral filter array sensors compound at 15.7% on demand that is regulatory rather than economic, which makes it considerably more predictable than adoption driven by payback calculations. Suppliers tracking rulemaking know where volume will appear years in advance, and remarkably few of them actually bother to do it.
04 / OPTICAL TOLERANCE DISCIPLINE

Hold The Tolerance, Save The Recalibration

Filter deposition runs around 34% of module cost and its tolerance determines whether a calibration model transfers between units at all, which is the largest hidden expense in every single deployment. Loosening tolerance to save a few cents per module creates recalibration work on every single installation, and that work exceeds the saving many times over. Most cost reduction programmes examine the bill of materials carefully and never examine at all what looser optics ends up costing downstream in the field afterwards.

Engagement Snapshot From the Field

A live engagement with an industry participant carrying material or product regulatory and market exposure ahead of a defining policy shift, showing how our research translates into a defensible multi-year portfolio strategy.
MARKET MINDS ADVISORY · CLIENT ENGAGEMENT SUMMARY
Spectral Sensor Producer Strategic Portfolio Review and Transition Roadmap 2026·Investment Scenario on Spectral Sensor Exposure Evaluation 2025-26
CLIENT PROFILE
A global food ingredient processor operating eleven plants across three continents, testing incoming raw material composition through central laboratories with results returning two to three days after sampling. Blending decisions were being taken on estimates and corrected afterwards at considerable cost. An inline spectral programme had been trialled twice and abandoned twice, both times on accuracy grounds nobody had documented properly.
STRATEGIC CHALLENGE
Quality leadership held that inline modules could not match laboratory accuracy and were therefore unsuitable, which was technically correct and commercially irrelevant. Operations wanted measurement at the point of blending regardless of precision. Neither had quantified what the two to three day delay actually cost in reblending, giveaway and off-specification production, and a capital decision was scheduled without that number.
MMA APPROACH
MMA quantified the cost of delayed measurement across eighteen months of blending records, separating reblending, giveaway and rejected batches. We tested three module architectures against the actual materials and assessed calibration transfer between units, which the earlier trials had not examined at all. The work drew on 47 expert interviews conducted in Q4 2025 with suppliers, chemometricians and comparable processors.
KEY FINDINGS
  1. Delayed measurement was costing roughly 4 times the annual capital cost of inline modules across all eleven plants (client-reported, unverified by MMA).
  2. Inline accuracy was about 3 times worse than laboratory results and still sufficient to make the blending decision correctly in 94% of cases.
  3. Both abandoned trials had failed on calibration transfer between sensor units rather than on sensor accuracy, which nobody had diagnosed at the time.
  4. The supplier with tightest filter deposition tolerance required around 1,800 reference samples once, while a cheaper alternative required recalibration at each of the eleven plants.
CLIENT PROFILE
A global food ingredient processor operating eleven plants across three continents, testing incoming raw material composition through central laboratories with results returning two to three days after sampling. Blending decisions were being taken on estimates and corrected afterwards at considerable cost. An inline spectral programme had been trialled twice and abandoned twice, both times on accuracy grounds nobody had documented properly.
STRATEGIC CHALLENGE
Quality leadership held that inline modules could not match laboratory accuracy and were therefore unsuitable, which was technically correct and commercially irrelevant. Operations wanted measurement at the point of blending regardless of precision. Neither had quantified what the two to three day delay actually cost in reblending, giveaway and off-specification production, and a capital decision was scheduled without that number.
MMA APPROACH
MMA quantified the cost of delayed measurement across eighteen months of blending records, separating reblending, giveaway and rejected batches. We tested three module architectures against the actual materials and assessed calibration transfer between units, which the earlier trials had not examined at all. The work drew on 47 expert interviews conducted in Q4 2025 with suppliers, chemometricians and comparable processors.
KEY FINDINGS
  1. Delayed measurement was costing roughly 4 times the annual capital cost of inline modules across all eleven plants (client-reported, unverified by MMA).
  2. Inline accuracy was about 3 times worse than laboratory results and still sufficient to make the blending decision correctly in 94% of cases.
  3. Both abandoned trials had failed on calibration transfer between sensor units rather than on sensor accuracy, which nobody had diagnosed at the time.
  4. The supplier with tightest filter deposition tolerance required around 1,800 reference samples once, while a cheaper alternative required recalibration at each of the eleven plants.
RECOMMENDED STRATEGY
Phase 1: Phase one: deploy inline modules from the supplier with tightest optical tolerance, accepting worse accuracy in exchange for measurement at the decision point. Phase 2: Phase two: build one calibration library centrally and validate its transfer across plants, rather than recalibrating separately at each site. Phase 3: Phase three: retain laboratory testing for dispute resolution and regulatory submission only, rather than for routine blending decisions taken daily.
OUTCOME
The processor deployed inline measurement across all eleven plants using a single central calibration library (client-reported, unverified by MMA). Reblending and giveaway fell substantially within two quarters and laboratory volume dropped by more than half. Supplier selection is now assessed on calibration transfer rather than on quoted accuracy, which is the change that outlasted the engagement.

Frequently Asked Questions

Foundational context covering the market sizes, CAGR, scope, country, region and competition that inform every finding below. This section is provided to cover basics and most often pre-purchase conversations, answered from the MMA Primary Research Dataset.

What is the current size of the Spectral Sensor Market?

Global value reaches USD 2.14 billion in 2026, measured as component and module shipment revenue across all six sensing architectures. The 2025 base is USD 1.9 billion.

How large will the Spectral Sensor Market be by 2036?

Component and module shipment revenue reaches USD 6.88 billion by 2036, an increase of USD 4.74 billion over the forecast period. That represents 3.21 times expansion from the 2026 base.

What is the CAGR for the Spectral Sensor Market 2026 to 2036?

The base case runs at 12.4% annually, with a bull case at 13.7% if calibration models become transferable between units and a bear case at 11.1% if module price erosion outruns volume growth.

Which segment is growing fastest?

Miniaturised near-infrared spectrometer modules grow at 18.6%, half again the market rate of 12.4%. A module on the harvester answers the question while the decision is open, which a laboratory four days away cannot.

Who are the major companies in the Spectral Sensor Market?

ams OSRAM, Hamamatsu Photonics, Teledyne Technologies, Viavi Solutions and Sony Semiconductor Solutions lead on module shipment revenue, together holding 49%. trinamiX, Spectricity and Ocean Insight hold smaller positions.

Which country is growing fastest?

China leads at 17.2%, on food inspection requirements, agricultural adoption and consumer device integration arriving together at considerable scale. India and Brazil follow on agricultural applications.

Report Segmentation Architecture

The full report scope spans multiple orthogonal segmentation dimensions, with cross-tabulated demand data provided for each dimension pair. Coverage extends further to regional breakdowns, trend trajectories, and the competitive detail needed to support segment-level decision-making.

By Sensing Architecture

  • Miniaturised Near-Infrared Spectrometer Modules
  • Multispectral Filter Array Sensors
  • Raman Spectroscopy Modules
  • Hyperspectral Line-Scan Imagers
  • Fourier Transform Infrared Modules
  • Colour And Ambient Light Sensors

By End-Use Industry

  • Agriculture And Farm Machinery
  • Food And Beverage Processing
  • Waste Sorting And Recycling
  • Pharmaceutical Manufacturing
  • Consumer Electronics
  • Mining And Materials Inspection

By Commercial Dimension

  • Design Win Component Supply
  • Calibrated Application Module Sales
  • Distributor And Catalogue Channel
  • Original Equipment Manufacturer Integration
  • Calibration Service Subscription
  • Research And Development Sales

By Region

  • North America
  • Western Europe
  • East Asia
  • South Asia and Pacific
  • Latin America
  • Middle East and Africa
  • Eastern Europe

Scope, Methodology, and Coverage

Every figure in this report is reproducible from documented input assumptions. The scope below maps the historical period, the forecast horizon, the segmentation dimensions, and the countries covered, alongside the underlying primary and qualitative methodology.
Historical Period
2020 to 2025
Forecast Period
2026 to 2036
Base Year
2025 (USD billions; MMA Primary Research Dataset, September 2026)
Market Definition
This report covers spectral sensing components and modules that measure light across multiple wavelength bands: miniaturised near-infrared spectrometer modules, multispectral filter array sensors, hyperspectral line-scan imagers, Raman spectroscopy modules, colour and ambient light sensors, and Fourier transform infrared modules. It excludes benchtop laboratory instruments, satellite and airborne imaging payloads, medical diagnostic analysers, machine vision cameras without spectral capability, and standalone illumination sources.
Quantitative Units
USD millions, component and module shipment revenue basis; shipped module units; spectral resolution in nanometres; wavelength range in nanometres; reference samples per calibration model.
Segmentation Dimensions
Sensing architecture; application industry; commercial supply channel; geography across seven regions.
Regions Covered
North America, Western Europe, East Asia, South Asia and Pacific, Latin America, Middle East and Africa, Eastern Europe
Countries Covered
China, Japan, South Korea, Taiwan, India, Australia, United States, Canada, Mexico, Brazil, Argentina, Colombia, Germany, Austria, Belgium, Netherlands, Poland, Hungary, Israel, South Africa.
Key Companies Profiled
ams OSRAM, Hamamatsu Photonics, Teledyne Technologies, Viavi Solutions, Sony Semiconductor Solutions, trinamiX, Si-Ware Systems, Spectricity, Ocean Insight, Avantes, Ibsen Photonics, Headwall Photonics, Imec, Excelitas Technologies, Innospectra.
Quantitative Methodology
Primary survey, n=3,800 respondents, Q4 2025, six countries; demand-side model with trade association cross-validation
Qualitative Methodology
47 expert interviews, Q4 2025; applied to validate demand model assumptions, identify emerging dynamics, and assess competitive positioning
Report Format
PDF and XLSX data workbook (Word format preview document)
Publisher
Market Minds Advisory
Report Code
MMA-2026-TEC-501
Published
September 2026
Contact
sales@marketmindsadvisory.com | www.marketmindsadvisory.com

Purchase the full Spectral Sensor Market Report (2026 to 2036).

This report sizes the global spectral sensor market from 2026 to 2036 across six sensing architectures, six application industries and seven regions. It explains why deployment position beats measurement precision in almost every commercial application, why a calibration model built on around 1,800 reference samples is the actual product, and why the consumer smartphone application everybody prepared for never arrived. Cost composition is sourced to company annual reports, with optical filter tolerance analysed as the constraint on scaling. Regional analysis explains why East Asia leads at 38% while China grows at 17.2%. Competitive assessment covers 20 named suppliers.
Six sensing architectures sized through to 2036
Calibration economics modelled as the decisive value layer
Optical filter cost composition from company annual filings
Twenty named suppliers assessed on module revenue
Four revenue levers with quantified commercial impact
Anonymised food processor inline measurement engagement included fully

Built For The People Who Decide

From boardroom strategy to bench-side execution, this report is read cover-to-cover by leaders shaping the next decade of their industry, turning demand scenarios, market dynamics and valuation benchmarks into decisions.
CXOs/ Presidents/ VPs/ Managers
M&A and Corporate Development
Strategy Teams and R&D Heads
Procurement and Product Directors
Regulatory and Compliance Leaders
Investor Relations and Equity Analysts