Market Minds Advisory
Spectacle Lens Market

Spectacle Lens Market: Myopia Management, Progressive Design Economics and the Contest for Prescription Laboratory Control

Myopia management designs are the one part of this category where price still holds, while single-vision volume drains toward Chinese finishing capacity and independents surrender margin to integrated chains owning both laboratory and storefront.

Lead Analyst

Alice Ballenger

Published

September 2026

Make Smarter Decisions with Customized Research Insights

Request a free sample report and evaluate market opportunities, growth trends, and competitive dynamics relevant to your business needs.

2025 MARKET VALUE$58.0BMarket Size 2025
2036 FORECAST VALUE$107.8BBase Case , 2026 to 2036
CAGR 2026 TO 20365.8 %Bull 7.1% / Bear 4.5%
INCREMENTAL OPPORTUNITY$46.5BNet 10- year value creation
EXPANSION MULTIPLE1.76x2036 value over 2026 base
Strategic Levers
M&A Pipeline
Regional Outlook
Country Rankings
Competitive Intelligence
Segmental Deep-dive
Call-Us : 91 93563 13602

Executive Snapshot and Market Trajectory

Two businesses now sit inside one category and they behave nothing alike. Single-vision lenses have become a commodity finished at scale in Chinese and Thai plants, while myopia-management and premium progressive designs still support prices that would look absurd applied to a plain plastic lens.
Myopia-management lenses compound at 8.7%, exactly 1.50 times the market, because a parent buying progression control is buying an outcome rather than a correction. East Asia holds 30% of global spend, more than any region, and finishes close to half the world's lens units. Progressive designs remain the profit engine of developed dispensing. Average wholesale price on a progressive pair sits near USD 118 before coatings.
Five manufacturers hold 55% of global finished lens shipments, an unusual concentration for a product made from commodity monomer. Their advantage sits in prescription laboratory networks, patented design files and optometrist relationships rather than in the casting itself. Roughly 44% of world output is finished or semi-finished in Chinese clusters, mostly on contract for brands that never touch the glass. Laboratory utilisation across those owned networks averages roughly 71%; the capacity argument is over.
Market Definition
Covers finished and semi-finished ophthalmic lenses supplied for mounting in spectacle frames, including single-vision, progressive, bifocal, myopia-management, occupational and prescription tinted designs, together with the coatings applied to them. Excludes contact lenses, intraocular lenses, frames, sunglasses sold without prescription, ophthalmic diagnostic equipment and optical retail services. Lens casting monomer and coating chemistry are treated as inputs, not as market scope.
Base Year Value
$58.0B in 2025 (MMA Primary Research Dataset, August 2026)
Forecast Period
2026 to 2036, eleven discrete annual values
CAGR
5.8% base case. Bull 7.1%. Bear 4.5%.
Fastest Growth Segment
Myopia-Management Lenses: 8.7% CAGR
Fastest Growth Country
India: 8.6% CAGR
Fastest Growth Region
South Asia and Pacific: 8.0% CAGR
Largest Region
East Asia: 30% of 2025 global value
Market Leaders
EssilorLuxottica, Hoya Corporation, Carl Zeiss Vision, Nikon-Essilor, Rodenstock. Source: MMA Analysis based on company annual reports.
Primary Survey
n=3,800 procurement and R&D decision-makers, Q4 2025, six countries
Methodology
Demand-side build-up, cross-validated against public data, 47 expert interviews

Spectacle Lens Market Forecast Scenarios

spectacle-lens-market-size-forecast-scenario-1787309290953
Growth of 4.6% across 2020 to 2025 was interrupted and then reshaped. Optical retail closure during 2020 removed roughly a quarter of a year of dispensing volume, and recovery brought a visible shift toward higher-value lenses as consumers who had deferred purchases upgraded when they finally returned. Myopia control lenses moved from clinical trial evidence into routine paediatric prescribing across East Asian markets during the same period.
The base case of 5.6% rests on three mechanisms. Myopia control prescribing is spreading from East Asia into European and North American paediatric optometry, at price points several times single vision equivalents. Progressive lens penetration keeps rising with population ageing in every developed market. And Indian and Southeast Asian first-time correction volumes are growing quickly as vision screening reaches populations that previously went uncorrected entirely, followed by regular replacement cycles.
The bull case of 6.8% assumes myopia control prescribing becomes standard paediatric practice in Western markets rather than a specialist option, which would convert a small premium segment into a substantial one. The bear case of 4.4% reflects two pressures: online retail compressing dispensing margins and pulling volume toward cheaper designs, and Chinese finishing capacity taking coating value Western manufacturers now capture.

Where Lens Value Actually Sits, and Who Controls It

A spectacle lens costs very little to make and a great deal to specify. Monomer, hard coat and anti-reflective stack account for roughly a third of delivered cost on a mid-range pair; the rest is surfacing labour, freight, laboratory overhead and the design licence. That structure explains how the category competes. Nobody wins on casting. They win on the design file, the laboratory turnaround and the chair-side conversation that sells the upgrade.
TOP FIVE CONCENTRATION55%Share of global finished lens shipments held by leaders
PROGRESSIVE LENS ASPUSD 118Wholesale price per pair before coating and tint options
CHINA OUTPUT SHARE44%World units finished or semi-finished in Chinese clusters
LABORATORY UTILISATION71%Average surfacing and coating line loading across owned laboratories
MONOMER COST SHARE22%Casting resin weight within delivered lens cost of goods
REPLACEMENT CYCLE2.7 yearsMedian interval between prescription pair purchases in developed markets
The commercial character is therefore closer to branded pharmaceuticals sold through a fragmented dispensing channel than to an optical component business. Manufacturers spend heavily on optometrist education because the prescriber decides the brand, and the patient rarely knows which lens went into the frame. Chains have begun to break that pattern by pushing private-label designs through owned laboratories, which is why the largest manufacturers keep buying laboratories themselves.
The next decade turns on two contests. One is whether myopia-management designs stay patent-protected long enough to build durable prescriber habit before generic equivalents arrive from Chinese and Korean finishers. The other is whether online retail can move beyond single-vision into progressives at scale, because that is where the margin lives and where remote measurement remains genuinely difficult.
"The interesting thing about myopia management is that it is the first lens category ever sold to someone who is not the wearer. Parents buy differently from patients: they ask about evidence, they accept a premium, and they come back annually without being reminded. That single change in buyer identity is worth more to this industry than any coating ever invented."
Director, Medical Devices and Vision Care Practice · MMA Medical Devices / Visio

Market Trends

Myopia management moves from specialist niche to general optometry

Designs using peripheral defocus, marketed as MiYOSMART, Stellest and MyoCare, were dispensed almost exclusively by specialist paediatric practices five years ago. They are now stocked by mainstream chains across China, Japan, Singapore and much of Western Europe. Published trial data showing progression reduction near 60% over two years gave general optometrists something defensible to say to parents, and that is what changed dispensing behaviour. WHO vision reporting keeps the epidemiological case in front of health ministries. Prescriber breadth, not clinical evidence, is now the constraint on volume. Stock breadth at chain level will decide the next two years.
Market Impact: Screens over 180 million children a

Free-form surfacing collapses the premium design cost barrier

Individualised progressive designs once required capital equipment that only large laboratories could justify. Free-form generators and digital coating lines have fallen enough in price that mid-sized regional finishers now quote the same optical specification. The consequence cuts both ways for the majors. It expands the premium tier they sell into, and it lets independent laboratory groups offer credible alternatives to branded designs at materially lower wholesale cost. Roughly 71% average utilisation across owned laboratories suggests the installed surfacing base already exceeds what current prescription volume requires. Branded design files now compete against credible unbranded optics for the first time.
Market Impact: Pulls 2 years off fitting age

Market Opportunities and Growth Drivers

School screening programmes convert prevalence into diagnosed demand

China's Ministry of Education myopia prevention programme requires annual vision screening across primary and secondary schools, with provincial targets for reducing progression. Screening does not treat anything. What it does is produce millions of documented refractive errors in children whose parents were previously unaware, and a documented diagnosis is what precedes a lens purchase. Similar screening mandates operate across Singapore, Taiwan and parts of India. The conversion rate from screening to dispensed correction runs near 55% within twelve months in urban Chinese districts. Screening therefore functions as demand generation that no manufacturer had to pay for.
Market Impact: Undercuts practice pricing by 50%

Presbyopic population growth lifts progressive volume mechanically

Presbyopia arrives on schedule and does not reverse. The global population above 45 is expanding faster than total population in every region MMA tracks, and each new presbyope represents a first progressive fitting followed by roughly one repurchase every two to three years for the rest of their life. Median replacement interval sits at 2.7 years in developed markets. Digital device use has pulled first fitting age down by close to two years since 2015, which adds a full purchase cycle per patient. Nothing about that arithmetic depends on marketing, prescribing fashion or economic conditions.
Market Impact: Depresses blank pricing near 15%

Market Restraints and Challenges

Online single-vision retail resets the reference price

Direct online lens retailers quote a coated single-vision pair at roughly half typical practice pricing, and they can do it because they hold no chair time, no dispensing labour and no local laboratory. The root cause is that a single-vision prescription is fully specified by four numbers, so nothing about the fitting genuinely requires a physical visit. Practices lose the entry-price sale that historically funded footfall. Mitigation is running along two lines: chains are launching their own online tiers, and manufacturers are steering premium designs into channels that require measurement.
Market Impact: Adds 8.7% segment compound growth

Chinese finishing overcapacity erodes semi-finished lens pricing

Danyang and Jiangsu finishing clusters expanded through the last decade in expectation of export growth that arrived slower than planned. Utilisation across independent Chinese finishers sits well below the 71% global average, and idle casting capacity has one predictable effect on semi-finished blank pricing. Brands that outsource benefit. Manufacturers running owned Western casting plants carry fixed cost against a falling reference price. Participants are responding by shifting owned plants toward high-index and myopia-management substrates where the design licence, not the blank, sets the price. Owned Western casting is the exposure that cannot be re-tendered away.
Market Impact: Cuts premium design entry cost 40%
4 additional market trends, 3 additional growth drivers, and 2 additional restraints and challenges are covered in the full report. Contact sales@marketmindsadvisory.com to access the complete intelligence.

Segment CAGR and Growth Architecture

Segmentation follows lens design and optical function, which is how prescriptions are written, how laboratories are tooled and how price is actually set. Coating, material index and channel are commercially important but cut across every design, so they belong in later discussion rather than in this hierarchy. Six designs cover the category without overlap.
spectacle-lens-market-market-share-analysis-1787309291486

Myopia-Management Lenses

Peripheral defocus designs for progressing childhood myopia are the fastest growing part of the category at 8.7%, exactly 1.50 times the market rate. Three things make the economics unusual. The buyer is a parent rather than the wearer, which changes price sensitivity entirely. The product is bought on published progression data, so evidence functions as a marketing asset. And the annual review cadence is clinically necessary rather than commercially encouraged, which produces genuine repeat purchase. East Asia accounts for the majority of current volume, though European dispensing has grown quickly since 2023. Patent position on the leading designs is the whole defence, and Korean and Chinese finishers are already working around it.
CAGR 8.7%

Occupational and Enhanced-Reading Lenses

Degressive designs optimised for intermediate and near working distance grow at 7.0%, ahead of general progressives, from a base perhaps a tenth the size. Screen work created the demand. A standard progressive compromises the intermediate zone that a desk worker spends most of the day in, and patients who notice that will pay for a second pair rather than accept it. Employers in Germany and the Netherlands part-fund workplace spectacles under occupational health rules, which gives the segment a funded channel that no other premium design enjoys. The commercial catch is that it is inherently a second-pair sale, so it depends on a practice willing to have a longer conversation.
CAGR 7.0%
Full segment breakdown across 6 segments available in the complete report.

Regional Architecture and Country Demand Map

East Asia leads on both consumption and manufacture, holding 30% of spend while finishing close to half the world's units. North America and Western Europe together take 46% on price rather than volume. South Asia and Pacific grows fastest, led by India at 8.6%. Manufacturing sits where consumption does.

North America

Twenty-four percent of global spend sits in North America, growing at 5.0%, and almost none of that position comes from unit volume. It comes from price. Vision benefit plans covering roughly 190 million Americans reimburse a frame-and-lens allowance that practices routinely convert into a premium design upsell, and the managed vision care contracts underpinning those plans are the single most important commercial relationship any manufacturer holds here. Optical retail is consolidated, with chains and optometrist buying groups controlling most dispensing volume. Myopia management remains largely private-pay, which has held prescribing well below East Asian levels despite comparable clinical awareness among practitioners. Canadian provincial coverage for children's eyewear supports steadier paediatric volume than the United States manages.
Share: 24% | CAGR: 5.0% (2026 to 2036)

Western Europe

Growth of 4.2% is the slowest of any region, and 22% of spend reflects a mature installed base rather than weak demand. Germany is the anchor: statutory insurance covers little lens cost, so the market has developed around private upgrade purchases and occupational spectacle funding under workplace health rules. France works differently again, with the reformed complementary health scheme setting reimbursement tiers that effectively dictate which lens specifications get dispensed. Independent optician density remains among the highest anywhere, which sustains premium mix but leaves the channel exposed as chains and online retailers take entry-price volume. Nordic and Dutch practices have adopted myopia management fastest, helped by paediatric optometry that operates closer to primary care.
Share: 22% | CAGR: 4.2% (2026 to 2036)
Regional intelligence for 5 additional markets available in the complete report: East Asia, South Asia and Pacific, Latin America, Middle East and Africa, Eastern Europe. Contact sales@marketmindsadvisory.com.
spectacle-lens-market-country-cagr-analysis-1787309292004

Four Places Margin Is Still Available

Casting a lens earns nothing anybody would defend. What earns is controlling the design file, the laboratory turnaround, the prescriber conversation and the second pair. Each lever below has been executed commercially by at least one participant, and each carries a quantified return that MMA has tested against disclosed segment economics rather than assumed.

Convert myopia management into an annual review contract

Progression control requires measurement at least yearly, which makes recall clinically justified rather than promotional. Practices that enrol paediatric patients into a subscription covering annual lenses, axial length measurement and progression reporting hold those families for an average of four years against 1.8 years for standard paediatric dispensing. Manufacturers supporting that model with practice software and parent-facing reporting capture the whole cycle. Lifetime value per enrolled child runs roughly 2.4 times a comparable single-vision paediatric patient, and churn falls sharply because leaving mid-programme means abandoning a documented clinical trajectory. The recall discipline is the product.
Market Impact: Lifts paediatric lifetime value abo

Own the laboratory that owns the turnaround

Independent practices choose suppliers on delivery reliability far more than on optical specification, and a laboratory that returns a surfaced progressive in 48 hours wins repeat orders from one that takes five days. Acquiring regional laboratories buys that reliability plus the private-label barrier it creates. Manufacturers running owned networks report attach rates on premium coatings roughly 18 points above wholesale-only channels, because the laboratory controls what gets quoted. The capital cost is real, and utilisation near 71% means most acquisitions should be about routing volume rather than adding capacity. Route volume first, then buy.
Market Impact: Raises premium coating attach rates

Sell the second pair, not the better first pair

Upgrading a single progressive purchase eventually hits patient price resistance. Adding an occupational or task-specific pair does not, because it answers a complaint the patient raised. Practices trained to present a desk-distance second pair after a progressive fitting convert roughly 22% of presbyopic patients, and the second pair carries gross margin comparable to the first with no additional chair time beyond the conversation. German and Dutch workplace spectacle funding pays for part of it outright. The constraint is dispensing behaviour rather than product, which makes this a training investment more than a development one.
Market Impact: Converts roughly 22% of all presbyo

Price high-index substrate on prescription strength, not material

High-index material is usually quoted as a material upgrade at a flat premium, which under-prices it for strong prescriptions where thickness reduction is the difference between an acceptable lens and an unwearable one. Quoting on prescription band instead captures willingness to pay that flat pricing leaves on the table. Manufacturers that moved to band pricing report average realised premium on prescriptions above six dioptres roughly 30% higher than under flat schedules. It requires laboratory quoting systems that read the prescription, which most now do, and prescriber comfort explaining why. Practices need the script.
Market Impact: Adds near 30% realised premium on s

Who Controls the Margin Pool

Five manufacturers hold 55% of global finished lens shipments, the basis on which MMA assesses every participant here, and the gap behind them is wide. EssilorLuxottica ships more than the next two combined and owns retail as well as laboratories. Hoya and Carl Zeiss Vision compete on design and prescriber relationships without comparable channel ownership.
Competitive activity runs along three lines. Laboratory acquisition continues in every developed market, because whoever surfaces the lens influences which design gets quoted. Myopia-management patent positions are being defended aggressively, since those designs carry the only genuinely differentiated pricing left. And private-label supply to optical chains has become a real business for Korean and Chinese finishers, who compete on shipment volume and delivery rather than on brand.

Pressure is building from two directions at once. Chinese finishers with idle capacity are moving from semi-finished blanks into finished private-label progressives, which attacks the mid-tier directly. Online retailers are working on remote progressive measurement, and success there would reach the profit pool rather than the entry tier. Rankings shift if either succeeds, and the manufacturers most exposed are those whose position rests on wholesale relationships rather than on owned laboratories or patented designs.
spectacle-lens-market-company-positioning-matrix-1787309292521

Competitive Moat and Risk Dimensions

ESSILORLUXOTTICA

Moat: Owns prescription channel outright

No competitor controls comparable ground between design and dispensing. Owned laboratories in most developed markets, retail chains including LensCrafters and Sunglass Hut, and frame brands that pull lens business alongside them mean the group participates in the majority of premium pairs sold whether or not its own brand appears on the lens.
ESSILORLUXOTTICA

Risk: Retail ownership invites channel conflict

Independent practices are the group's largest wholesale customer base and its most direct retail competitor, which is an uncomfortable position that competitors exploit in every pitch. Regulatory attention to vertical integration in optical retail has also grown in Europe, and any remedy touching the retail estate would reach the mechanism that makes the wholesale position defensible.
HOYA CORPORATION

Moat: MiYOSMART clinical evidence lead

The company reached market first with a peripheral defocus design supported by published two-year progression data, and that head start bought prescriber habit which is far stickier than patent protection. Paediatric optometrists who have explained the same evidence to hundreds of parents do not switch designs casually.
HOYA CORPORATION

Risk: Narrow channel outside Asia

Hoya's laboratory and prescriber network is strongest across Japan and Southeast Asia and considerably thinner in North America and parts of Europe, so its best product reaches those markets through partners rather than owned distribution. As myopia management moves into general optometry, breadth of dispensing relationships matters more than clinical priority.

Players Tracked

Prominent Players

EssilorLuxottica
Hoya Corporation
Carl Zeiss Vision
Nikon-Essilor
Rodenstock

Other Key Players

Shamir Optical Industry
Seiko Optical Products
Tokai Optical
Ito Lens
Wanxin Optical
Conant Optical
Mingyue Optical
Chemi Lens
Younger Optics
Indo Optical
Vision Rx Lab
GKB Ophthalmics
Norville Group
Optiswiss
Zhenjiang Sunshine Optics

Recent Developments

JUNE 2025

EssilorLuxottica expands Thailand lens finishing capacity organically

The group commissioned additional surfacing and coating lines at its Thai facility, adding capacity for regional premium progressive and myopia-management output. The investment was organic rather than acquisitive, and it positions finished-lens supply closer to Southeast Asian dispensing demand than shipment from European or Chinese plants allows.
Signal: Finishing capacity is now moving toward th
OCTOBER 2025

Hoya signs multi-year supply agreement with Chinese optical retail chain

The agreement covers myopia-management and progressive designs across several hundred outlets, with Hoya supplying finished lenses and prescriber training. It is a supply agreement rather than a joint venture or equity arrangement, and it gives the company mainland dispensing breadth it previously reached only through distributors.
Signal: Prescriber training bundled into the suppl
FEBRUARY 2026

Rodenstock acquires German prescription laboratory network

The acquisition brings a regional surfacing and coating group into Rodenstock's owned laboratory estate, consolidating turnaround control across southern Germany. Terms were not disclosed. The purchase follows the pattern set by larger competitors of buying delivery reliability and private-label defence rather than additional casting capacity.
Signal: Mid-sized manufacturers are now buying lab

Monomer, Coating Chemistry and Freight Exposure

Casting monomer accounts for roughly 22% of delivered cost of goods on a mid-range pair, with allyl diglycol carbonate and the higher-index thiourethane chemistries both derived from petrochemical feedstock supplied largely from Japanese, Korean and Gulf producers. Anti-reflective and hard-coat chemistry adds another 9%, concentrated among a handful of specialty suppliers. Coating consumables, packaging, freight and surfacing labour make up the remainder.
The 2022 energy shock demonstrated how quickly that structure transmits. IEA data recorded European industrial gas prices peaking at several times their prior average, and monomer producers passed through surcharges that raised blank cost across the year. Freight compounded it: container rates on Asia to Europe lanes moved enough that finished lens shipment economics briefly favoured regional finishing over centralised casting, and several manufacturers rerouted volume permanently as a result.

Exposure is not evenly distributed, and the mechanism is fixed cost against a falling reference price. Manufacturers running owned Western casting plants carry that overhead whatever monomer costs, while brands sourcing semi-finished blanks from Chinese finishers with spare capacity simply re-tender when input prices move. Vertically integrated groups with owned materials businesses sit strongest. Most exposed: mid-sized Western manufacturers with owned casting and no retail channel.
spectacle-lens-market-cost-volatility-analysis-1787309292716

Shift owned casting toward high-index and myopia substrates

Plain single-vision casting cannot outrun Chinese cost structure and should not try. Redirecting owned capacity toward high-index and myopia-management substrates, where the design licence rather than the blank sets price, restores pricing power against the same monomer bill. Several Western manufacturers have already made this move and reported margin recovery within two reporting years despite lower unit throughput.

Contract monomer on indexed multi-year terms

Spot monomer purchasing leaves the whole 22% cost block exposed to petrochemical cycles. Multi-year contracts indexed to a published feedstock benchmark do not remove the movement but make it predictable enough to price into wholesale schedules in advance. Manufacturers with contracted supply absorbed the 2022 surcharges two quarters later than spot buyers, which was enough to reset customer pricing first.

Finish regionally to cut freight and duty exposure

Shipping semi-finished blanks and surfacing near the dispensing market cuts both container exposure and finished-lens import duty, which is material across Latin America and parts of South Asia. It also shortens turnaround, which independent practices value more than price. The trade-off is lower utilisation across more sites, so it works where regional volume genuinely supports a laboratory.

Portfolio Architecture for Margin Defence

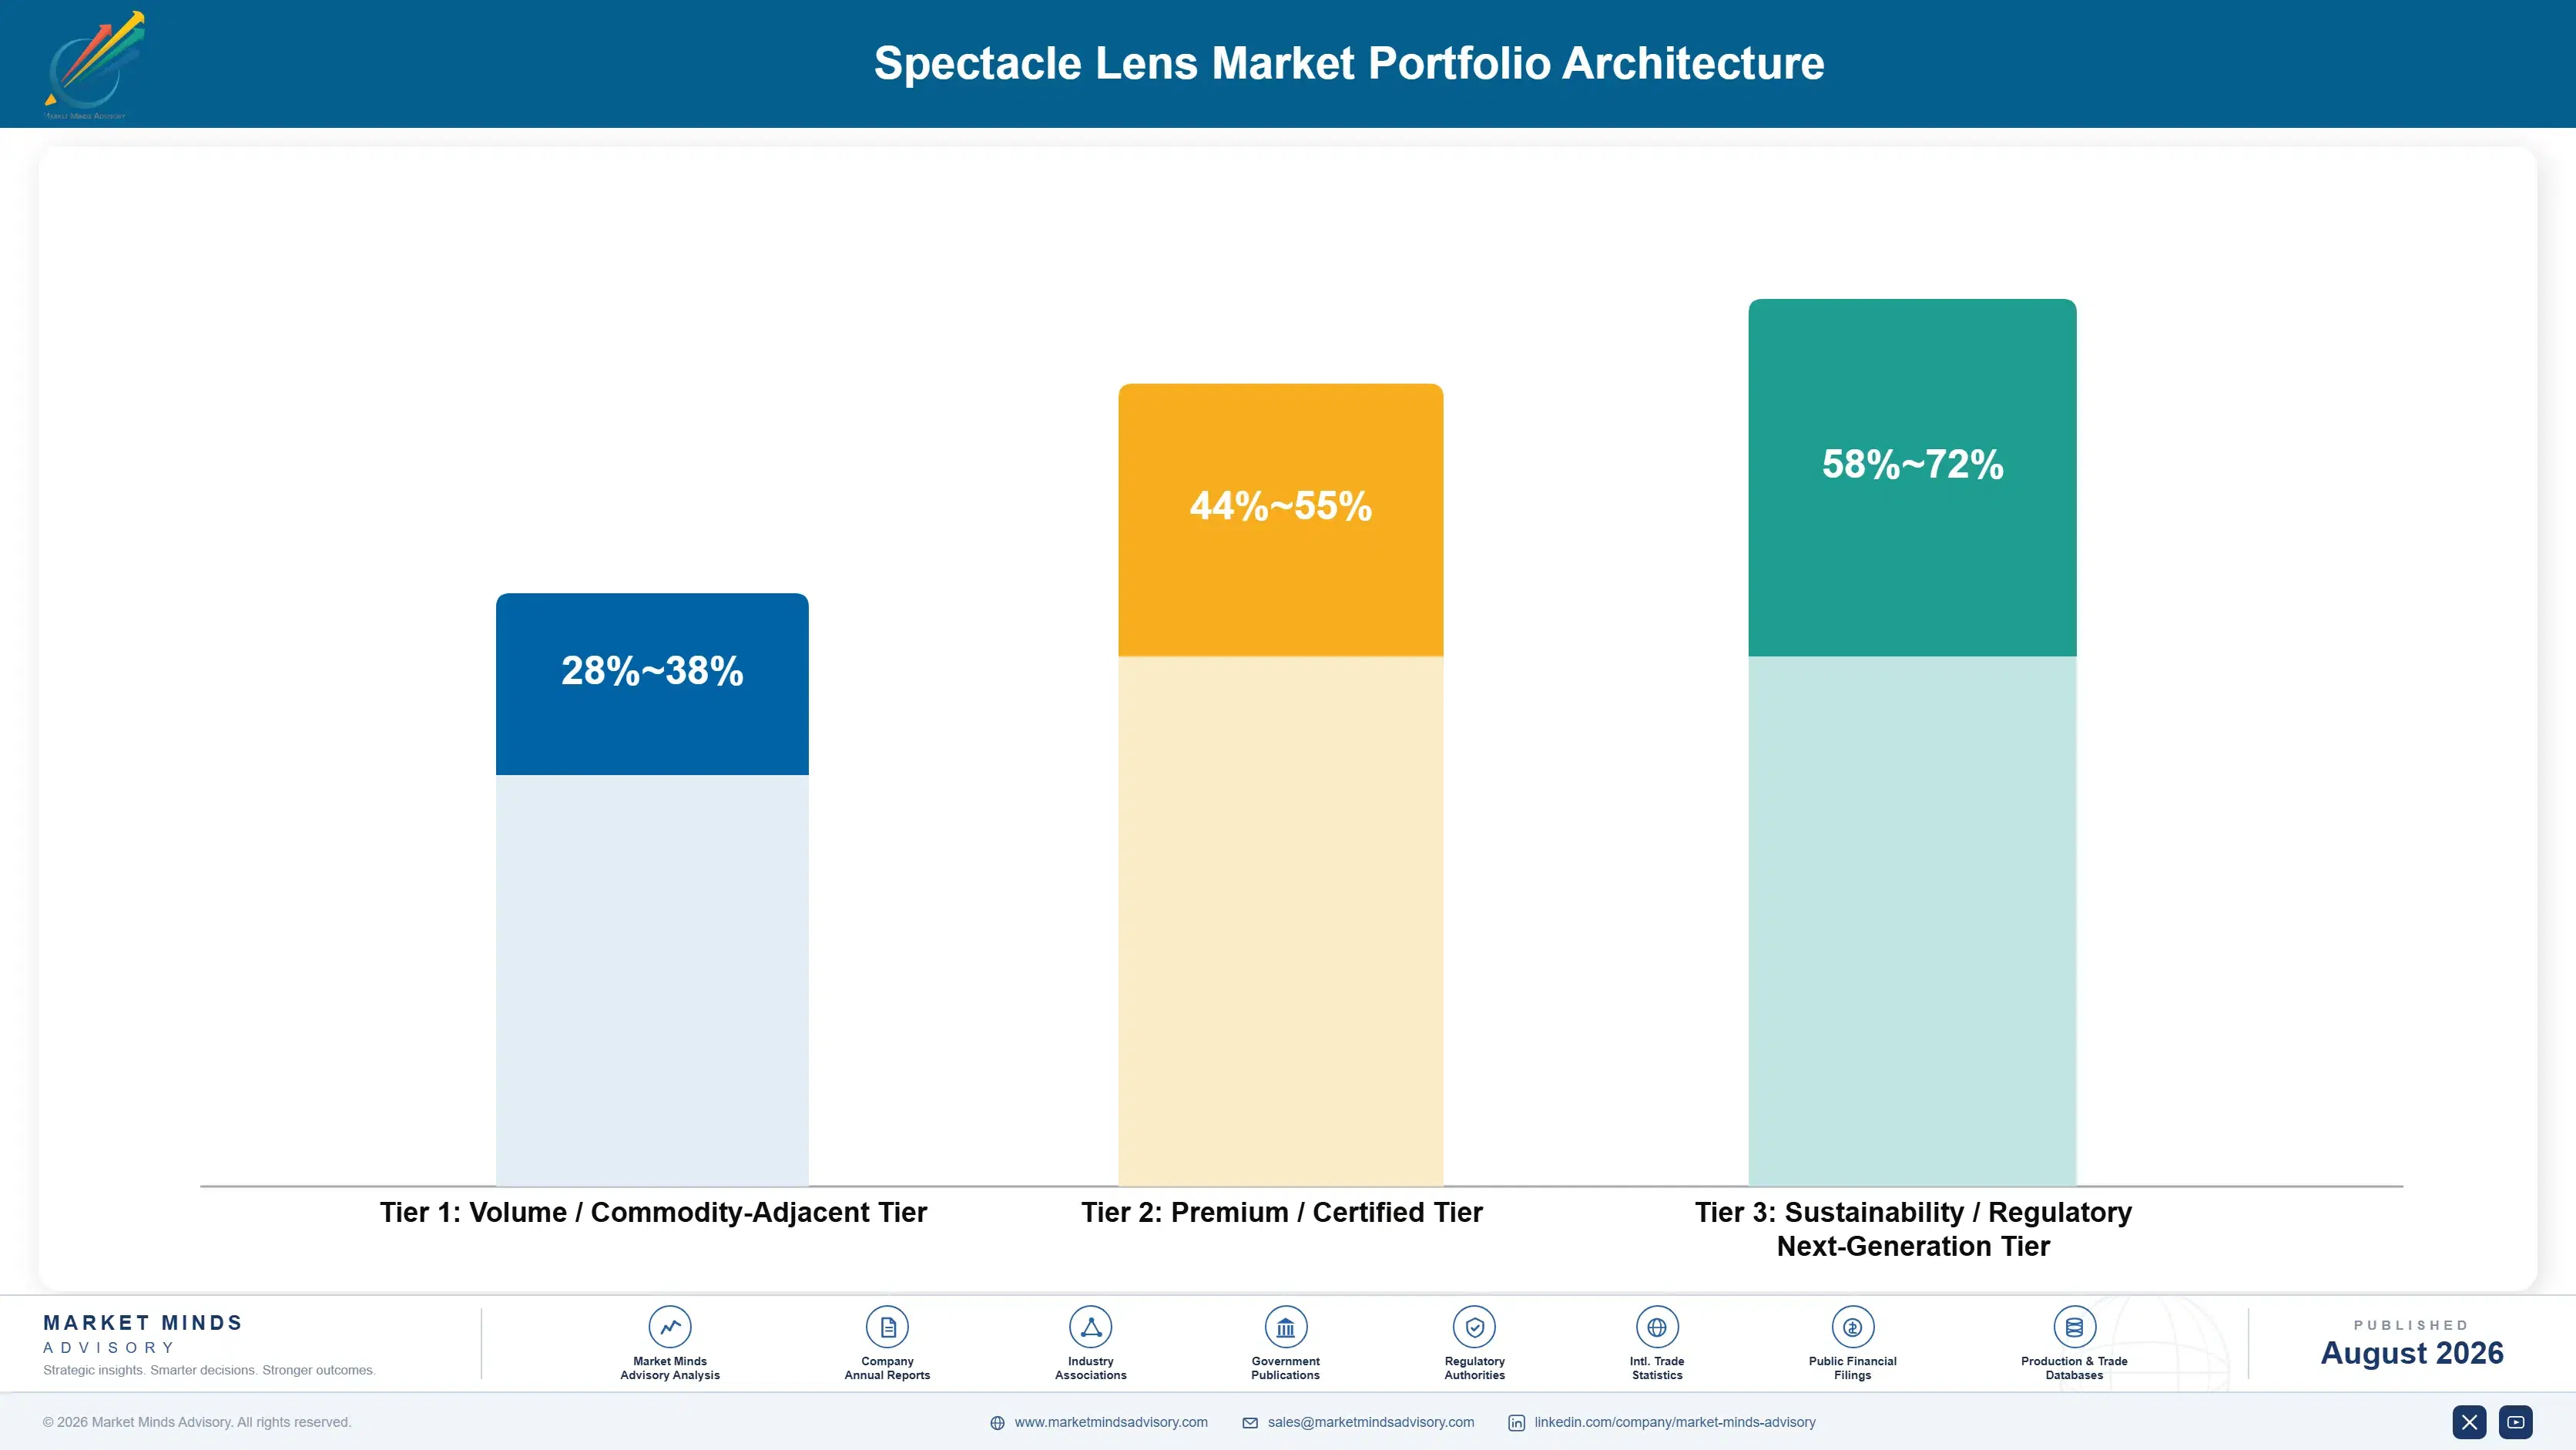
Portfolio economics in this category separate almost entirely on where pricing authority sits. Volume single-vision lenses are quoted against Chinese blank cost and earn gross margin in the low thirties at best. Premium progressive and certified coating tiers hold margins in the fifties because the design file and the coating stack are proprietary. Myopia-management and specialist designs sit higher again, and they will stay there only while patents and prescriber habit hold.
The tension is that volume pays for the laboratory and premium pays for the company. A surfacing and coating line needs throughput to justify itself, and single-vision work provides that throughput at margins nobody would choose. Abandoning volume raises unit cost on the premium work that follows through the same equipment. Manufacturers that have tried to exit the bottom tier cleanly generally found their premium cost base rose faster than the margin mix improved.

High-value pools concentrate in three places: paediatric myopia management across East Asia and Northern Europe, occupational designs in markets with employer funding, and strong-prescription high-index work anywhere with an ageing private-pay population. None is large in units, and all are defended by something other than manufacturing cost.

Volume / Commodity-Adjacent Tier

Standard single-vision and stock bifocal lenses in conventional index, quoted against Chinese semi-finished blank cost and increasingly against online retail reference pricing. Margin depends on laboratory utilisation rather than on any product attribute, and private-label supply to chains sits here too.
Gross Margin: 28-34%

Premium / Certified Tier

Branded progressive designs, free-form individualised surfacing, premium anti-reflective stacks and high-index substrates. Pricing authority comes from the design file and the prescriber relationship rather than from manufacturing cost, and the eight-point range reflects wide variation between owned-laboratory and wholesale-only channels.
Gross Margin: 48-56%

Sustainability / Regulatory / Next-Generation Tier

Myopia-management designs, occupational and task-specific lenses, and bio-based monomer products where European procurement rules increasingly ask about material origin. The eleven-point range reflects the difference between patented myopia designs and early bio-based substrates still carrying development cost.
Gross Margin: 58-69%
spectacle-lens-market-portfolio-architecture-1787309293217

High-value Sub-segments and Strategic Watch-out

Paediatric myopia-management designs

The only part of the category where a parent, not a patient, makes the purchase and accepts a genuine premium for a documented clinical outcome. Annual review is clinically required, so repeat purchase is real. Patent expiry is the whole risk, and it is not distant.
Gross Margin: 62-70%

Individualised free-form progressives

Still the profit engine of developed prescription dispensing, growing moderately as presbyopic populations expand and first fitting age falls. Margin holds because measurement and fitting genuinely require a practice. Remote measurement technology is the thing to watch, since it would reach this pool directly. Nothing else earns this reliably.
Gross Margin: 50-58%

Standard single-vision volume

Still the largest segment by units and by revenue, growing at roughly 4.3% and losing price steadily to online retail and Chinese finishing capacity. It funds laboratory utilisation and very little else. Exiting it raises unit cost on everything else running through the same lines.
Gross Margin: 28-34%

Chain private-label programmes

Optical chains routing own-brand designs through owned or contracted laboratories, supplied increasingly by Korean and Chinese finishers. It looks like incremental volume to whoever wins the contract and it erodes branded pricing across the mid-tier for everybody, including the winner. Winning one is rarely the victory it appears internally.
Gross Margin: 24-30%

How Lens Demand Actually Repeats

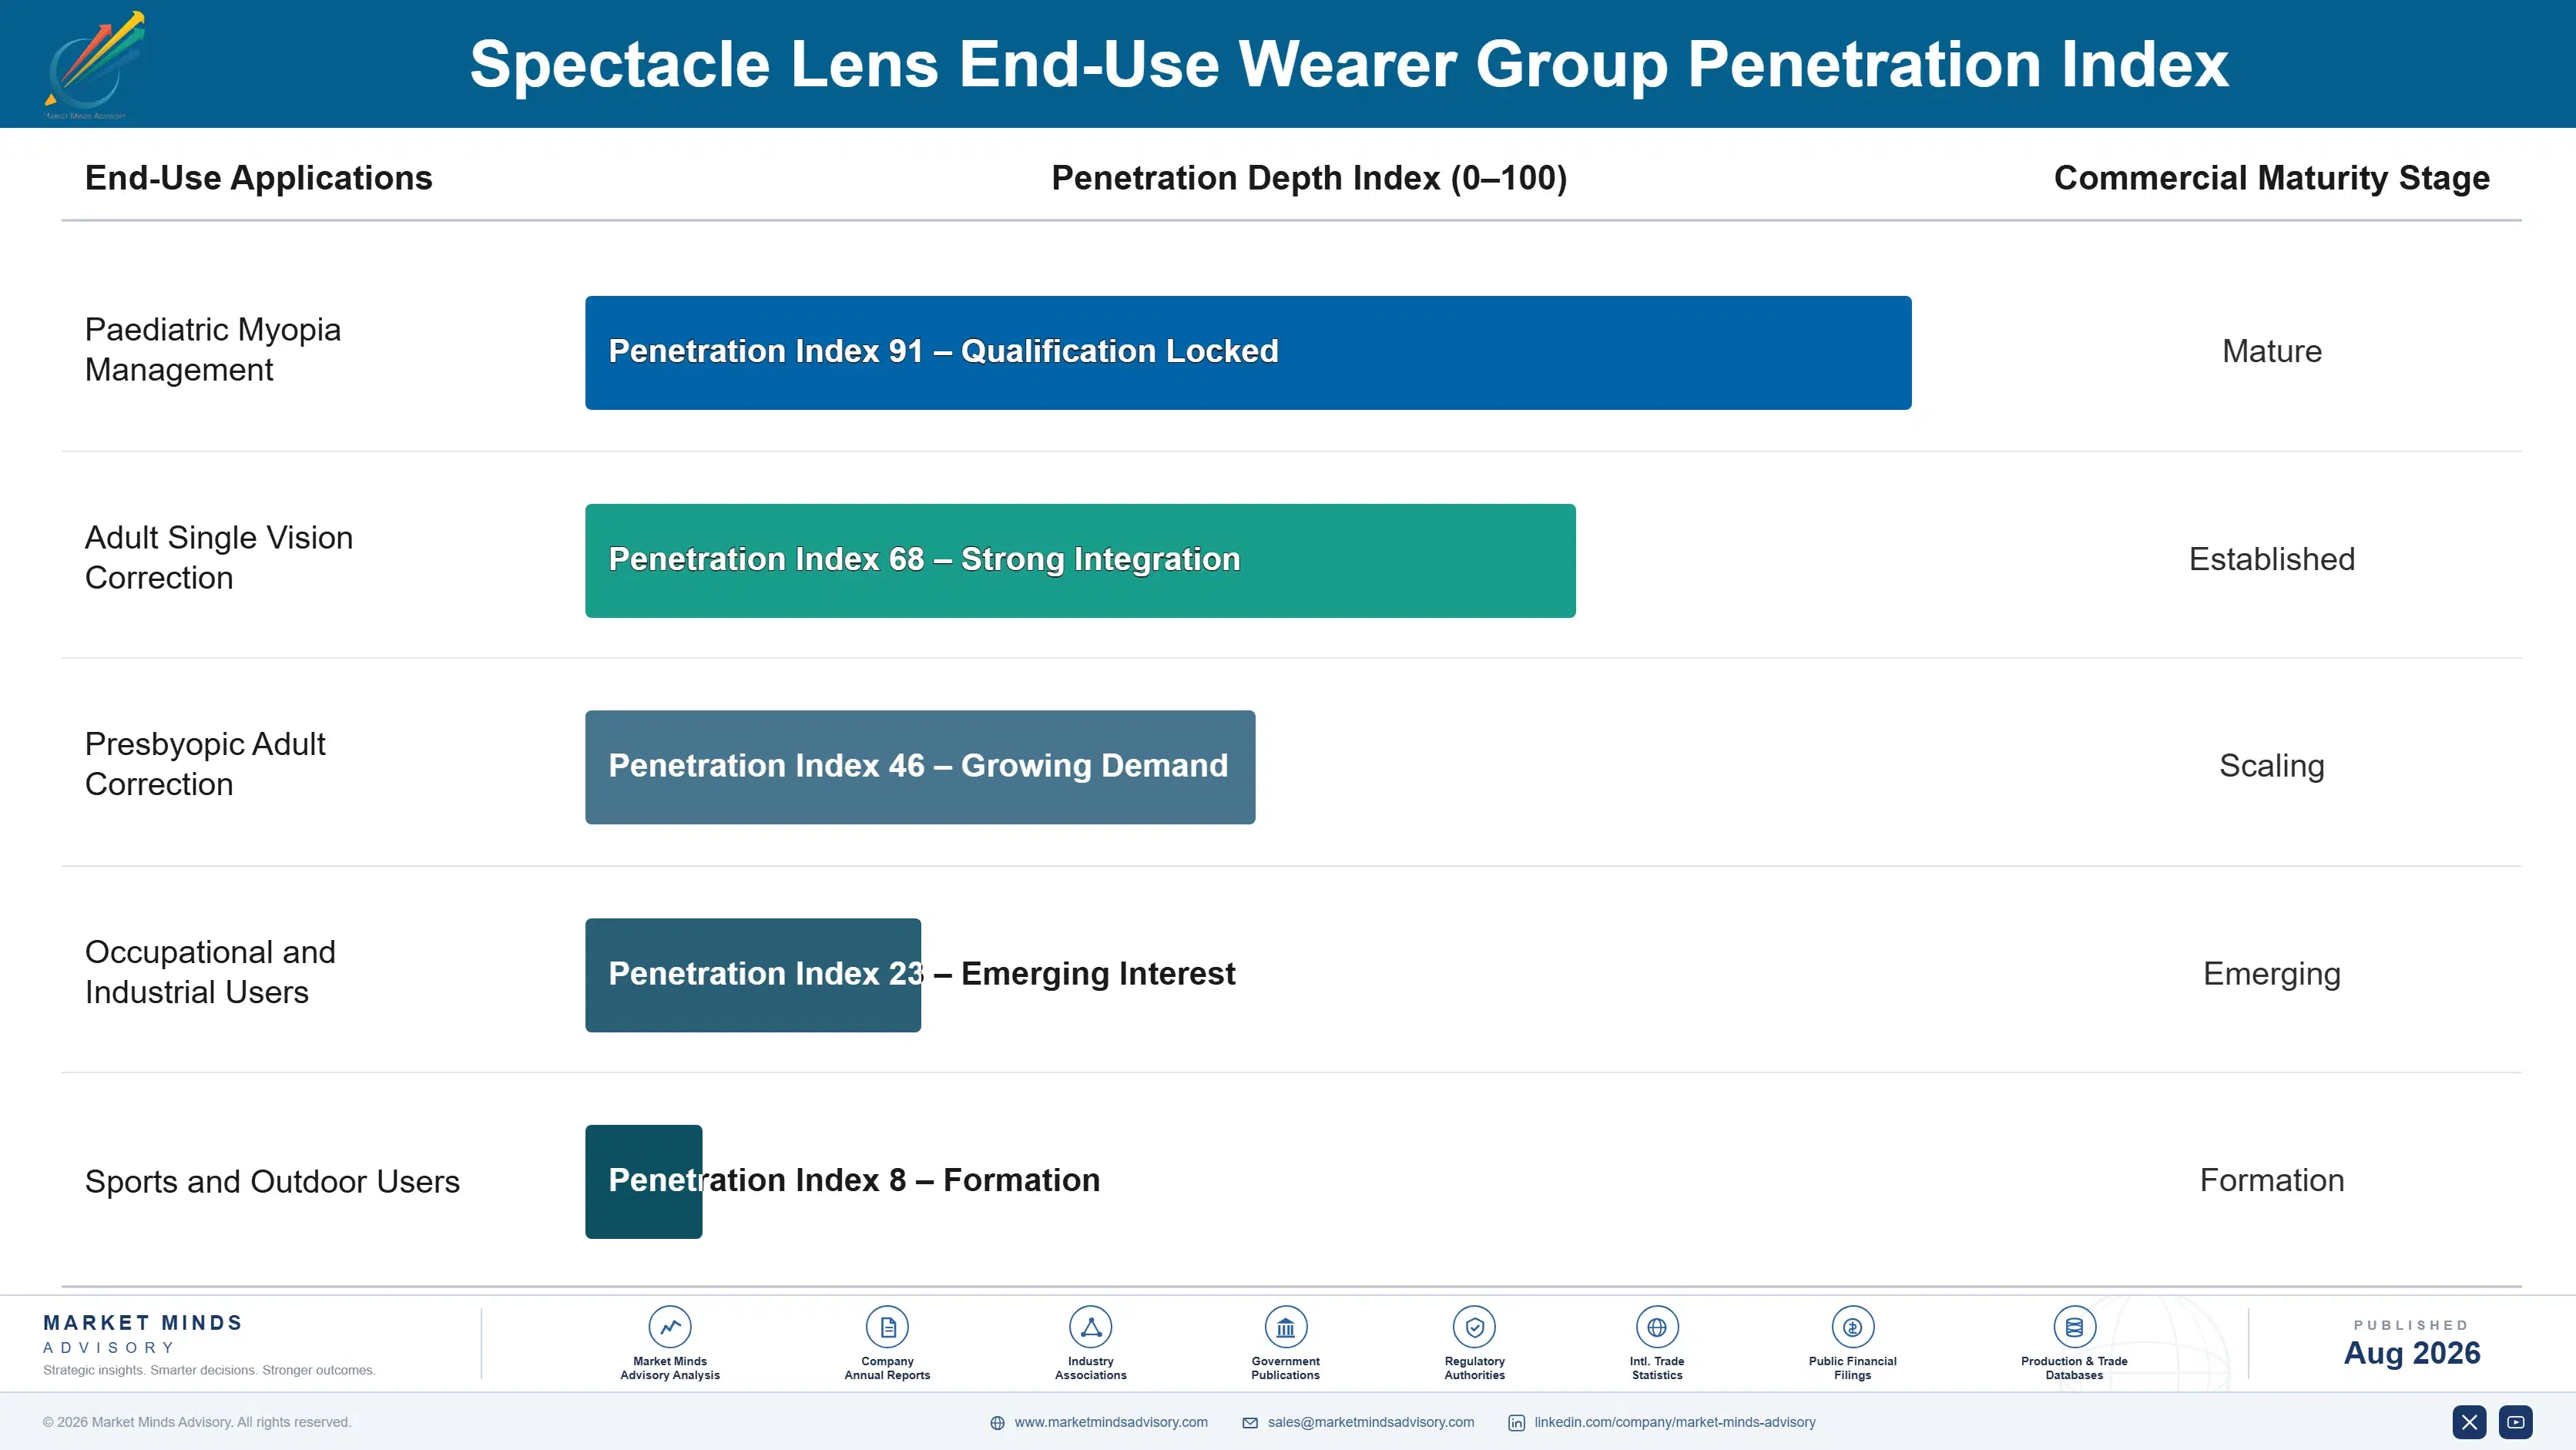
This is an annuity business that rarely describes itself as one. A corrected adult repurchases roughly every 2.7 years, a presbyope more often as the prescription moves, and a child under myopia management annually by necessity. None requires marketing to trigger. What varies is not whether the repeat purchase happens but whether it happens at the same practice, with the same design, at the same price point.
Adoption depth varies sharply by end-use setting. Paediatric optometry has taken myopia management deepest: the clinical case is unambiguous and the review cadence already exists. Employer-funded dispensing in Germany and the Netherlands runs deep for the same reason: someone other than the wearer pays. General adult optometry adopts premium designs shallowly, since everything depends on individual dispensing conversations. Programme-supplied channels across Africa and South Asia adopt almost nothing beyond ready-made correction.

Buyer profiles are shifting generationally in a way that cuts against the practice channel. Patients under 35 arrive having priced lenses online before the appointment and treat the practice as a measurement service. Older cohorts still buy on the optometrist's recommendation. Parents buying myopia management behave like neither group: they research evidence, and they return annually without prompting.
spectacle-lens-market-end-use-penetration-index-1787309293704

What We Would Do Here

These are among the four positions where our research anticipates prominent divergence between winners and laggards over the coming forecast period. Each is grounded in the demand model, the regulatory perimeter, and the announced capacity pipeline.
01 / PAEDIATRIC CHANNEL CAPTURE

Build the paediatric myopia franchise before patents lapse

Myopia management compounds at 8.7%, exactly 1.50 times the market, and it is the only segment where buyers accept premium pricing for a documented outcome. The defensible asset being built is not the patent but prescriber habit, which survives generic entry in a way patent protection cannot. Manufacturers investing in paediatric optometrist training and parent-facing progression reporting now will hold those practices after Korean and Chinese equivalents arrive, and the ones treating it as a product launch simply will not.
02 / LABORATORY NETWORK CONTROL

Buy turnaround reliability, not additional casting capacity

Owned laboratories raise premium coating attach rates roughly 18 points above wholesale-only channels because whoever surfaces the lens influences what gets quoted to the patient. With utilisation averaging 71% across the installed base, the case for acquisition rests entirely on routing volume and blocking private label rather than on adding capacity. Manufacturers buying laboratories for throughput are solving a problem the industry does not have, and paying premium multiples to do it, when the asset genuinely being purchased is delivery reliability, which requires no additional casting line at all.
03 / VOLUME TIER DISCIPLINE

Defend single-vision throughput without defending its price

Standard single-vision work earns gross margin in the low thirties and loses price steadily to online retail, yet it provides the throughput that makes premium surfacing economically viable through the same lines. Exiting cleanly generally raises premium unit cost faster than mix improves, which several manufacturers have now demonstrated expensively. The correct posture is to hold volume at whatever price clears while refusing to invest another dollar of capital or marketing into defending it, a stance that is uncomfortable internally and the only one the arithmetic supports.
04 / PRESCRIPTION BAND PRICING

Quote high-index on dioptre band rather than material

Flat material-upgrade pricing under-charges strong prescriptions where thickness reduction is the difference between a wearable lens and an unwearable one. Band pricing tied to prescription strength has delivered realised premiums roughly 30% above flat schedules for participants that implemented it. Laboratory quoting systems already read the prescription, so the barrier is commercial nerve and prescriber explanation rather than technology, and that is a considerably cheaper thing to fix than a product gap, and most manufacturers already hold every system the change requires.

Engagement Snapshot From the Field

A live engagement with an industry participant carrying material or product regulatory and market exposure ahead of a defining policy shift, showing how our research translates into a defensible multi-year portfolio strategy.
MARKET MINDS ADVISORY · CLIENT ENGAGEMENT SUMMARY
Spectacle Lens Producer Strategic Portfolio Review and Transition Roadmap 2026·Investment Scenario on Spectacle Lens Exposure Evaluation 2025-26
CLIENT PROFILE
A Western European ophthalmic lens manufacturer with owned casting and surfacing operations across two countries, annual revenue near EUR 340 million (client-reported, unverified by MMA), and a wholesale-only route to market serving independent opticians and two regional chains. The company held a respected progressive design portfolio, no myopia-management product, and casting utilisation that had fallen below 60% over three years as chain private-label volume moved to Asian finishers.
STRATEGIC CHALLENGE
Management had approved capital for a third casting line on the assumption that scale would restore competitiveness against imported blanks. The board wanted an independent view before committing, because single-vision wholesale prices had fallen for six consecutive quarters and nobody could explain how additional capacity would reverse that. Retaining chain volume had become the stated priority almost by default rather than by analysis.
MMA APPROACH
MMA rebuilt the client's cost position against benchmarked Chinese semi-finished blank pricing, then modelled contribution by design tier with fixed casting overhead properly allocated rather than spread across units. Forty-seven expert interviews across independent opticians and chain buyers established what actually drove supplier selection in each channel. Dormant design assets and coating capability were catalogued and assessed for premium repositioning potential.
KEY FINDINGS
  1. Single-vision wholesale contribution was marginally negative once idle casting overhead was allocated properly, meaning the volume being defended was consuming cash rather than funding the premium portfolio as management believed.
  2. Independent opticians ranked delivery turnaround well ahead of optical specification and price in supplier selection, and the client's five-day average against a 48-hour benchmark explained most recent account losses.
  3. No European competitor had yet built prescriber depth in myopia management outside the three global brands, leaving an addressable paediatric channel the client could reach through existing optician relationships.
  4. Chain private-label tenders were being won at prices the client could not match with owned Western casting, and no achievable scale improvement closed that gap on plain single-vision work.
CLIENT PROFILE
A Western European ophthalmic lens manufacturer with owned casting and surfacing operations across two countries, annual revenue near EUR 340 million (client-reported, unverified by MMA), and a wholesale-only route to market serving independent opticians and two regional chains. The company held a respected progressive design portfolio, no myopia-management product, and casting utilisation that had fallen below 60% over three years as chain private-label volume moved to Asian finishers.
STRATEGIC CHALLENGE
Management had approved capital for a third casting line on the assumption that scale would restore competitiveness against imported blanks. The board wanted an independent view before committing, because single-vision wholesale prices had fallen for six consecutive quarters and nobody could explain how additional capacity would reverse that. Retaining chain volume had become the stated priority almost by default rather than by analysis.
MMA APPROACH
MMA rebuilt the client's cost position against benchmarked Chinese semi-finished blank pricing, then modelled contribution by design tier with fixed casting overhead properly allocated rather than spread across units. Forty-seven expert interviews across independent opticians and chain buyers established what actually drove supplier selection in each channel. Dormant design assets and coating capability were catalogued and assessed for premium repositioning potential.
KEY FINDINGS
  1. Single-vision wholesale contribution was marginally negative once idle casting overhead was allocated properly, meaning the volume being defended was consuming cash rather than funding the premium portfolio as management believed.
  2. Independent opticians ranked delivery turnaround well ahead of optical specification and price in supplier selection, and the client's five-day average against a 48-hour benchmark explained most recent account losses.
  3. No European competitor had yet built prescriber depth in myopia management outside the three global brands, leaving an addressable paediatric channel the client could reach through existing optician relationships.
  4. Chain private-label tenders were being won at prices the client could not match with owned Western casting, and no achievable scale improvement closed that gap on plain single-vision work.
RECOMMENDED STRATEGY
Phase 1: Phase 1 (0 to 6 months): Cancel the third casting line, redirect that capital into surfacing turnaround and regional finishing, and reprice single-vision to clear rather than to win. Phase 2: Phase 2 (6 to 18 months): License or co-develop a peripheral defocus paediatric design, and build optometrist training capability across the existing independent optician base. Phase 3: Phase 3 (18 to 36 months): Shift owned casting toward high-index and myopia substrates, and exit chain private-label tenders that price below allocated cost.
OUTCOME
The casting investment was cancelled and redirected. Average surfacing turnaround fell to 60 hours within four quarters, and the client reported recovering eleven independent accounts lost in the prior two years (client-reported, unverified by MMA). A paediatric myopia design entered dispensing in three markets. Group gross margin improved by roughly two points on lower unit volume.

Frequently Asked Questions

Foundational context covering the market sizes, CAGR, scope, country, region and competition that inform every finding below. This section is provided to cover basics and most often pre-purchase conversations, answered from the MMA Primary Research Dataset.

What is the current size of the Spectacle Lens Market?

MMA sizes the global spectacle lens market at USD 58.0 billion in 2025, rising to USD 61.4 billion in 2026. That covers finished and semi-finished ophthalmic lenses with their coatings, excluding frames and contact lenses.

How large will the Spectacle Lens Market be by 2036?

MMA forecasts USD 107.83 billion by 2036, an expansion multiple of 1.76 times the 2026 base. That represents roughly USD 46.47 billion of incremental value over the forecast period.

What is the CAGR for the Spectacle Lens Market 2026 to 2036?

The base case compounds at 5.8% annually, with a bull case of 7.1% and a bear case of 4.5%. Mix improvement rather than unit growth accounts for most of the base case.

Which segment is growing fastest?

Myopia-management lenses compound at 8.7%, exactly 1.50 times the market rate. Parents buy progression control as a clinical outcome, which supports pricing that plain correction never could.

Who are the major companies in the Spectacle Lens Market?

EssilorLuxottica, Hoya Corporation, Carl Zeiss Vision, Nikon-Essilor and Rodenstock together account for 55% of global finished lens shipments. Fifteen further participants including Shamir, Seiko, Chemi Lens and Conant Optical are profiled.

Which country is growing fastest?

India compounds at 8.6%, ahead of every other national market MMA tracks. Correction of previously uncorrected refractive error drives the volume, almost all of it entering at the cheapest single-vision price point.

Report Segmentation Architecture

The full report scope spans multiple orthogonal segmentation dimensions, with cross-tabulated demand data provided for each dimension pair. Coverage extends further to regional breakdowns, trend trajectories, and the competitive detail needed to support segment-level decision-making.

By Lens Design and Optical Function

  • Single-Vision Lenses
  • Progressive Lenses
  • Bifocal and Trifocal Lenses
  • Myopia-Management Lenses
  • Occupational and Enhanced-Reading Lenses
  • Prescription Sunwear and Tinted Lenses

By End-Use Setting

  • Independent Optometry and Optician Practices
  • Optical Retail Chains
  • Hospital and Clinical Ophthalmology
  • Public Health and Screening Programmes
  • Occupational and Employer-Funded Dispensing

By Commercial Channel

  • Branded Wholesale to Practice
  • Owned Prescription Laboratory Supply
  • Chain Private-Label Programmes
  • Direct Online Prescription Retail

By Region

  • North America
  • Western Europe
  • East Asia
  • South Asia and Pacific
  • Latin America
  • Middle East and Africa
  • Eastern Europe

Scope, Methodology, and Coverage

Every figure in this report is reproducible from documented input assumptions. The scope below maps the historical period, the forecast horizon, the segmentation dimensions, and the countries covered, alongside the underlying primary and qualitative methodology.
Historical Period
2020 to 2025
Forecast Period
2026 to 2036
Base Year
2025 (USD billions; MMA Primary Research Dataset, August 2026)
Market Definition
The market comprises finished and semi-finished ophthalmic lenses supplied for mounting in spectacle frames, spanning single-vision, progressive, bifocal and trifocal, myopia-management, occupational and prescription tinted designs, together with the hard-coat, anti-reflective and tint treatments applied during finishing. Sizing is at manufacturer wholesale value and excludes optical retail margin, frames, contact lenses, intraocular lenses, low-vision aids and ophthalmic diagnostic equipment. Casting monomer, coating chemistry and surfacing equipment are treated as inputs to the market rather than as market scope.
Quantitative Units
USD billions (current prices); million lens pairs shipped; USD per pair wholesale where applicable
Segmentation Dimensions
By Lens Design and Optical Function; By End-Use Setting; By Commercial Channel; By Region
Regions Covered
North America, Western Europe, East Asia, South Asia and Pacific, Latin America, Middle East and Africa, Eastern Europe
Countries Covered
USA, China, Germany, France, UK, Japan, South Korea, India, Australia, Canada, Brazil, Mexico, Indonesia, Vietnam, Thailand, Malaysia, UAE, Saudi Arabia, South Africa, Nigeria, Turkey, Poland, Netherlands, Italy, Spain, Sweden, Switzerland, Argentina, Colombia, Singapore, and additional markets relevant to this sector
Key Companies Profiled
EssilorLuxottica, Hoya Corporation, Carl Zeiss Vision, Nikon-Essilor, Rodenstock, Shamir Optical Industry, Seiko Optical Products, Tokai Optical, Ito Lens, Wanxin Optical, Conant Optical, Mingyue Optical, Chemi Lens, Younger Optics, Indo Optical, Vision Rx Lab, GKB Ophthalmics, Norville Group, Optiswiss, Zhenjiang Sunshine Optics.
Quantitative Methodology
Primary survey, n=3,800 respondents, Q4 2025, six countries; demand-side model with trade association cross-validation
Qualitative Methodology
47 expert interviews, Q4 2025; applied to validate demand model assumptions, identify emerging dynamics, and assess competitive positioning
Report Format
PDF and XLSX data workbook (Word format preview document)
Publisher
Market Minds Advisory
Report Code
MMA-2026-MED-018
Published
August 2026
Contact
sales@marketmindsadvisory.com | www.marketmindsadvisory.com

Purchase the full Spectacle Lens Market Report (2026 to 2036).

The full report sizes the spectacle lens market across six lens designs, five end-use settings, four commercial channels and seven regions, with annual forecasts to 2036 at wholesale value and pairs shipped. It quantifies myopia-management adoption by prescriber type and country, and models the contribution economics of each design tier with casting and surfacing overhead properly allocated rather than averaged. Twenty manufacturers are assessed on a consistent finished lens shipment basis, with laboratory network footprint mapped market by market. Chinese and Korean finishing cost positions are benchmarked against Western owned casting to show where private-label tenders can and cannot be matched.
Six lens designs sized and forecast annually
Myopia-management adoption modelled by prescriber type
Contribution economics with overhead properly allocated
Twenty manufacturers on consistent shipment basis
Chinese finishing cost benchmarked against Western casting
Laboratory network footprint mapped by market

Built For The People Who Decide

From boardroom strategy to bench-side execution, this report is read cover-to-cover by leaders shaping the next decade of their industry, turning demand scenarios, market dynamics and valuation benchmarks into decisions.
CXOs/ Presidents/ VPs/ Managers
M&A and Corporate Development
Strategy Teams and R&D Heads
Procurement and Product Directors
Regulatory and Compliance Leaders
Investor Relations and Equity Analysts