Market Minds Advisory
Spacecraft Market

Spacecraft Market: Two Industries Sharing One Name, Serial Production Against Bespoke Qualification

One half of this industry builds a few dozen vehicles a year and qualifies each one formally; the other builds thousands on a line and accepts failures statistically, and only one half is growing.

Lead Analyst

Published

September 2026

Make Smarter Decisions with Customized Research Insights

Request a free sample report and evaluate market opportunities, growth trends, and competitive dynamics relevant to your business needs.

2025 MARKET VALUE$24.5BMarket Size 2025
2036 FORECAST VALUE$67.2BBase Case , 2026 to 2036
CAGR 2026 TO 20369.6 %Bull 10.8% / Bear 8.4%
INCREMENTAL OPPORTUNITY$40.3BNet 10- year value creation
EXPANSION MULTIPLE2.50x2036 value over 2026 base
Strategic Levers
M&A Pipeline
Regional Outlook
Country Rankings
Competitive Intelligence
Segmental Deep-dive
Call-Us : 91 93563 13602

Executive Snapshot and Market Trajectory

Two entirely different manufacturing businesses are counted here as one market. One builds bespoke vehicles at very high unit cost with fifteen year design lives and formal qualification behind every part. The other runs a production line and simply replaces any failures statistically instead.
The second model now dominates the volume and most of the growth. Roughly 3,150 spacecraft are now delivered annually, the overwhelming majority of them near-identical low orbit communications satellites built at unit costs closer to 380,000 dollars than to the hundreds of millions a bespoke vehicle commands. Serial production of that kind grows at 14.4%, and it rewards a cost structure almost none of the traditional primes actually possess anywhere else in this industry.
Vertical integration is the mechanism separating the two. Around 64% of vehicle value in serial production is built inside the manufacturer, against a traditional prime that subcontracts most subsystems and adds qualification oversight on top. That difference sets both the unit cost and the achievable rate. North America leads on volume because the largest serial producer sits there and builds more satellites there than everybody else in the world combined.
Market Definition
Revenue from the manufacture and integration of spacecraft intended for operation beyond the atmosphere, spanning communications, earth observation, navigation and scientific satellites, crewed and cargo vehicles, landers and deep space probes. Vehicles built by operators for their own use are included at manufacturing cost. Excludes launch vehicles and launch services, ground segment equipment, satellite operating and data service revenue, and in-orbit servicing operations.
Base Year Value
$24.5B in 2025 (MMA Primary Research Dataset, August 2026)
Forecast Period
2026 to 2036, eleven discrete annual values
CAGR
9.6% base case. Bull 10.8%. Bear 8.4%.
Fastest Growth Segment
Mass-Produced LEO Communications Satellites: 14.4% CAGR
Fastest Growth Country
India: 11.6% CAGR
Fastest Growth Region
South Asia and Pacific: 11.6% CAGR
Largest Region
North America: 32% of 2025 global value
Market Leaders
SpaceX, Airbus Defence and Space, Lockheed Martin Space, Northrop Grumman Space Systems and China Academy of Space Technology lead on manufacturing revenue. Source: company annual reports and MMA Primary Research Dataset, July 2026.
Primary Survey
n=3,800 procurement and R&D decision-makers, Q4 2025, six countries
Methodology
Demand-side build-up, cross-validated against public data, 47 expert interviews

Spacecraft Market Forecast Scenarios

spacecraft-market-size-forecast-scenario-1787982912331
The 2020 to 2025 period reversed a decade of assumptions. Geostationary communications orders collapsed as operators questioned whether large bespoke satellites still made commercial sense, while low orbit constellation build rates rose faster than any manufacturing forecast had contemplated. Revenue compounded near 8.4% across the period, and the composition beneath that number changed almost completely between one end of it and the other.
Three mechanisms carry the base case. Constellation deployment continues across commercial, European and Chinese programmes, each requiring thousands of vehicles on fixed schedules. Defence proliferated architectures keep buying small satellites in tranches rather than exquisite platforms individually. And lunar programmes move from development into recurring production, converting cost-plus engineering into deliveries that repeat rather than happening once and stopping. Four separate national programmes are funding that work at the same time, which has not happened before.
The bull catalyst is a second commercial constellation reaching full deployment on schedule, which would demonstrate that serial production economics work for somebody other than the incumbent. The bear risk is orbital congestion and regulatory response: deployment deadlines slipping or debris rules tightening would remove the volume assumption underneath every serial production line anybody is currently building anywhere at all.

Production Lines Against Cleanroom Qualification

The traditional spacecraft is a one-off. It carries a fifteen year design life because replacing it is expensive and slow, every component is formally qualified because a failure ends the mission, and roughly 31% of programme cost goes into testing and documentation rather than into hardware. That model produced every geostationary communications satellite, every deep space probe and most defence platforms flown before this decade began.
MARKET CONCENTRATION CR558%Share of manufacturing revenue held by leading builders
ANNUAL VEHICLE DELIVERIES3,150Spacecraft completed and delivered for launch each year
MASS PRODUCTION UNIT COSTUSD 380,000Typical build cost for a serially produced communications satellite
DESIGN LIFE SPREAD5 to 15 yearsOperational life designed into serial versus bespoke vehicles
VERTICAL INTEGRATION RATE64%Share of vehicle value built inside the prime manufacturer
QUALIFICATION COST SHARE31%Programme cost absorbed by testing and formal qualification
Serial production inverts every one of those assumptions. A five year design life is acceptable when replacement costs 380,000 dollars and launches on a rideshare, component qualification gives way to lot testing and statistical acceptance, and a failure rate of a few per cent is a budget line rather than a catastrophe. The economics only work at rate, which is why the model belongs to organisations building thousands rather than dozens.
Vertical integration is what makes the second model possible. Around 64% of vehicle value in serial production is manufactured inside the builder, because a supply chain organised around qualified subcontractors cannot deliver components at the price or the cadence a production line requires. Traditional primes built exactly that supply chain over forty years, and it is now the reason they cannot follow.
"The primes keep describing serial production as a different market segment. It is a different industry that happens to put things in orbit, and their supply chains were built specifically to make it impossible."
Director, Space Systems and Launch Practice · MMA Aerospace and Defence Manufacturing Practice · August 2026

Market Trends

Constellation Deadlines Convert Schedules Into Manufacturing Rates

Spectrum authorisations carry deployment milestones, and missing one can cost an operator the licence rather than merely delaying a service. That converts a commercial ambition into a fixed manufacturing rate with a regulatory deadline attached, which is an unusual position for any aerospace programme to occupy. Operators facing those milestones have built their own production capability rather than trusting a supply chain, because a prime contractor delay and a lost spectrum authorisation are not comparable consequences. The deadline shapes the industrial structure more than the technology does. Nobody bets a licence on a subcontractor.
Market Impact: Buys 126 satellites per tranche
Primes Acquire Small Satellite Builders Rather Than Building Them

Established manufacturers have concluded that serial production capability is easier to buy than to develop internally, and two substantial acquisitions completed during 2024 demonstrated the reasoning clearly. The difficulty is that the acquired culture rarely survives the acquiring one. Qualification standards, supplier approval processes and programme review structures designed for bespoke vehicles get applied to a production line and remove exactly the cost advantage that justified the purchase. Very few of these transactions have yet produced the unit economics that were used to price them. Buying the line is easy and keeping its economics is not.
Market Impact: Commits EUR 10.6 billion programme

Market Opportunities and Growth Drivers

Defence Architectures Move From Exquisite To Proliferated

Military space procurement has shifted from small numbers of highly capable platforms toward large numbers of modest ones, on the reasoning that a proliferated architecture is harder to disable than a concentrated one. American transport and tracking layer programmes buy satellites in tranches of dozens rather than singly. That changes what a defence customer values: schedule and unit cost begin to matter as much as capability, which favours manufacturers organised for rate over those organised for qualification depth alone. Capability alone stopped being sufficient to win these competitions some years ago.
Market Impact: Requires 64% internal manufacture

Sovereign Constellation Programmes Fund Regional Capacity

European connectivity infrastructure, Chinese national constellations and comparable regional programmes are being funded on sovereignty grounds rather than on commercial return, which means the manufacturing capacity gets built regardless of whether the business case would support it independently. Those programmes are deliberately distributed across national supplier bases, so capacity appears in places a purely commercial calculation would never place it. That is inefficient industrially and entirely rational politically, and it will produce durable manufacturing positions. Capacity built on sovereignty grounds tends to outlast the programme that funded it, which changes the competitive landscape permanently.
Market Impact: Cut orders below 10 yearly

Market Restraints and Challenges

Traditional Supply Chains Cannot Reach Production Cadence

A qualified subcontractor delivering flight hardware on a bespoke programme works to lead times measured in many months and to lot sizes measured in single figures. The root cause is a qualification regime built around missions that cannot be repeated if something fails. Asking that supply base to deliver thousands of units at production prices does not work, and it cannot be fixed by contract terms. Manufacturers mitigate by bringing subsystems in house, by qualifying automotive and industrial components against mission life, and by accepting lot acceptance instead of individual qualification.
Market Impact: Requires 1,618 satellites by 2026

Geostationary Order Rates Fell And Have Not Recovered

Annual orders for large geostationary communications satellites have fallen to a fraction of historic levels, leaving substantial specialised capacity underutilised across several manufacturers. The root cause is operators questioning whether a fifteen year asset makes sense when capacity pricing keeps falling and low orbit alternatives keep improving. Facilities and skills sized for the old rate now carry fixed cost against far fewer programmes. Mitigation runs through repurposing cleanrooms toward defence and scientific work, software-defined payload offerings, and reducing the specialised footprint permanently. Nobody in this industry expects the old order rate to return.
Market Impact: Completed 2 acquisitions in 2024
3 additional market trends, 4 additional growth drivers, and 2 additional restraints and challenges are covered in the full report. Contact sales@marketmindsadvisory.com to access the complete intelligence.

Segment CAGR and Growth Architecture

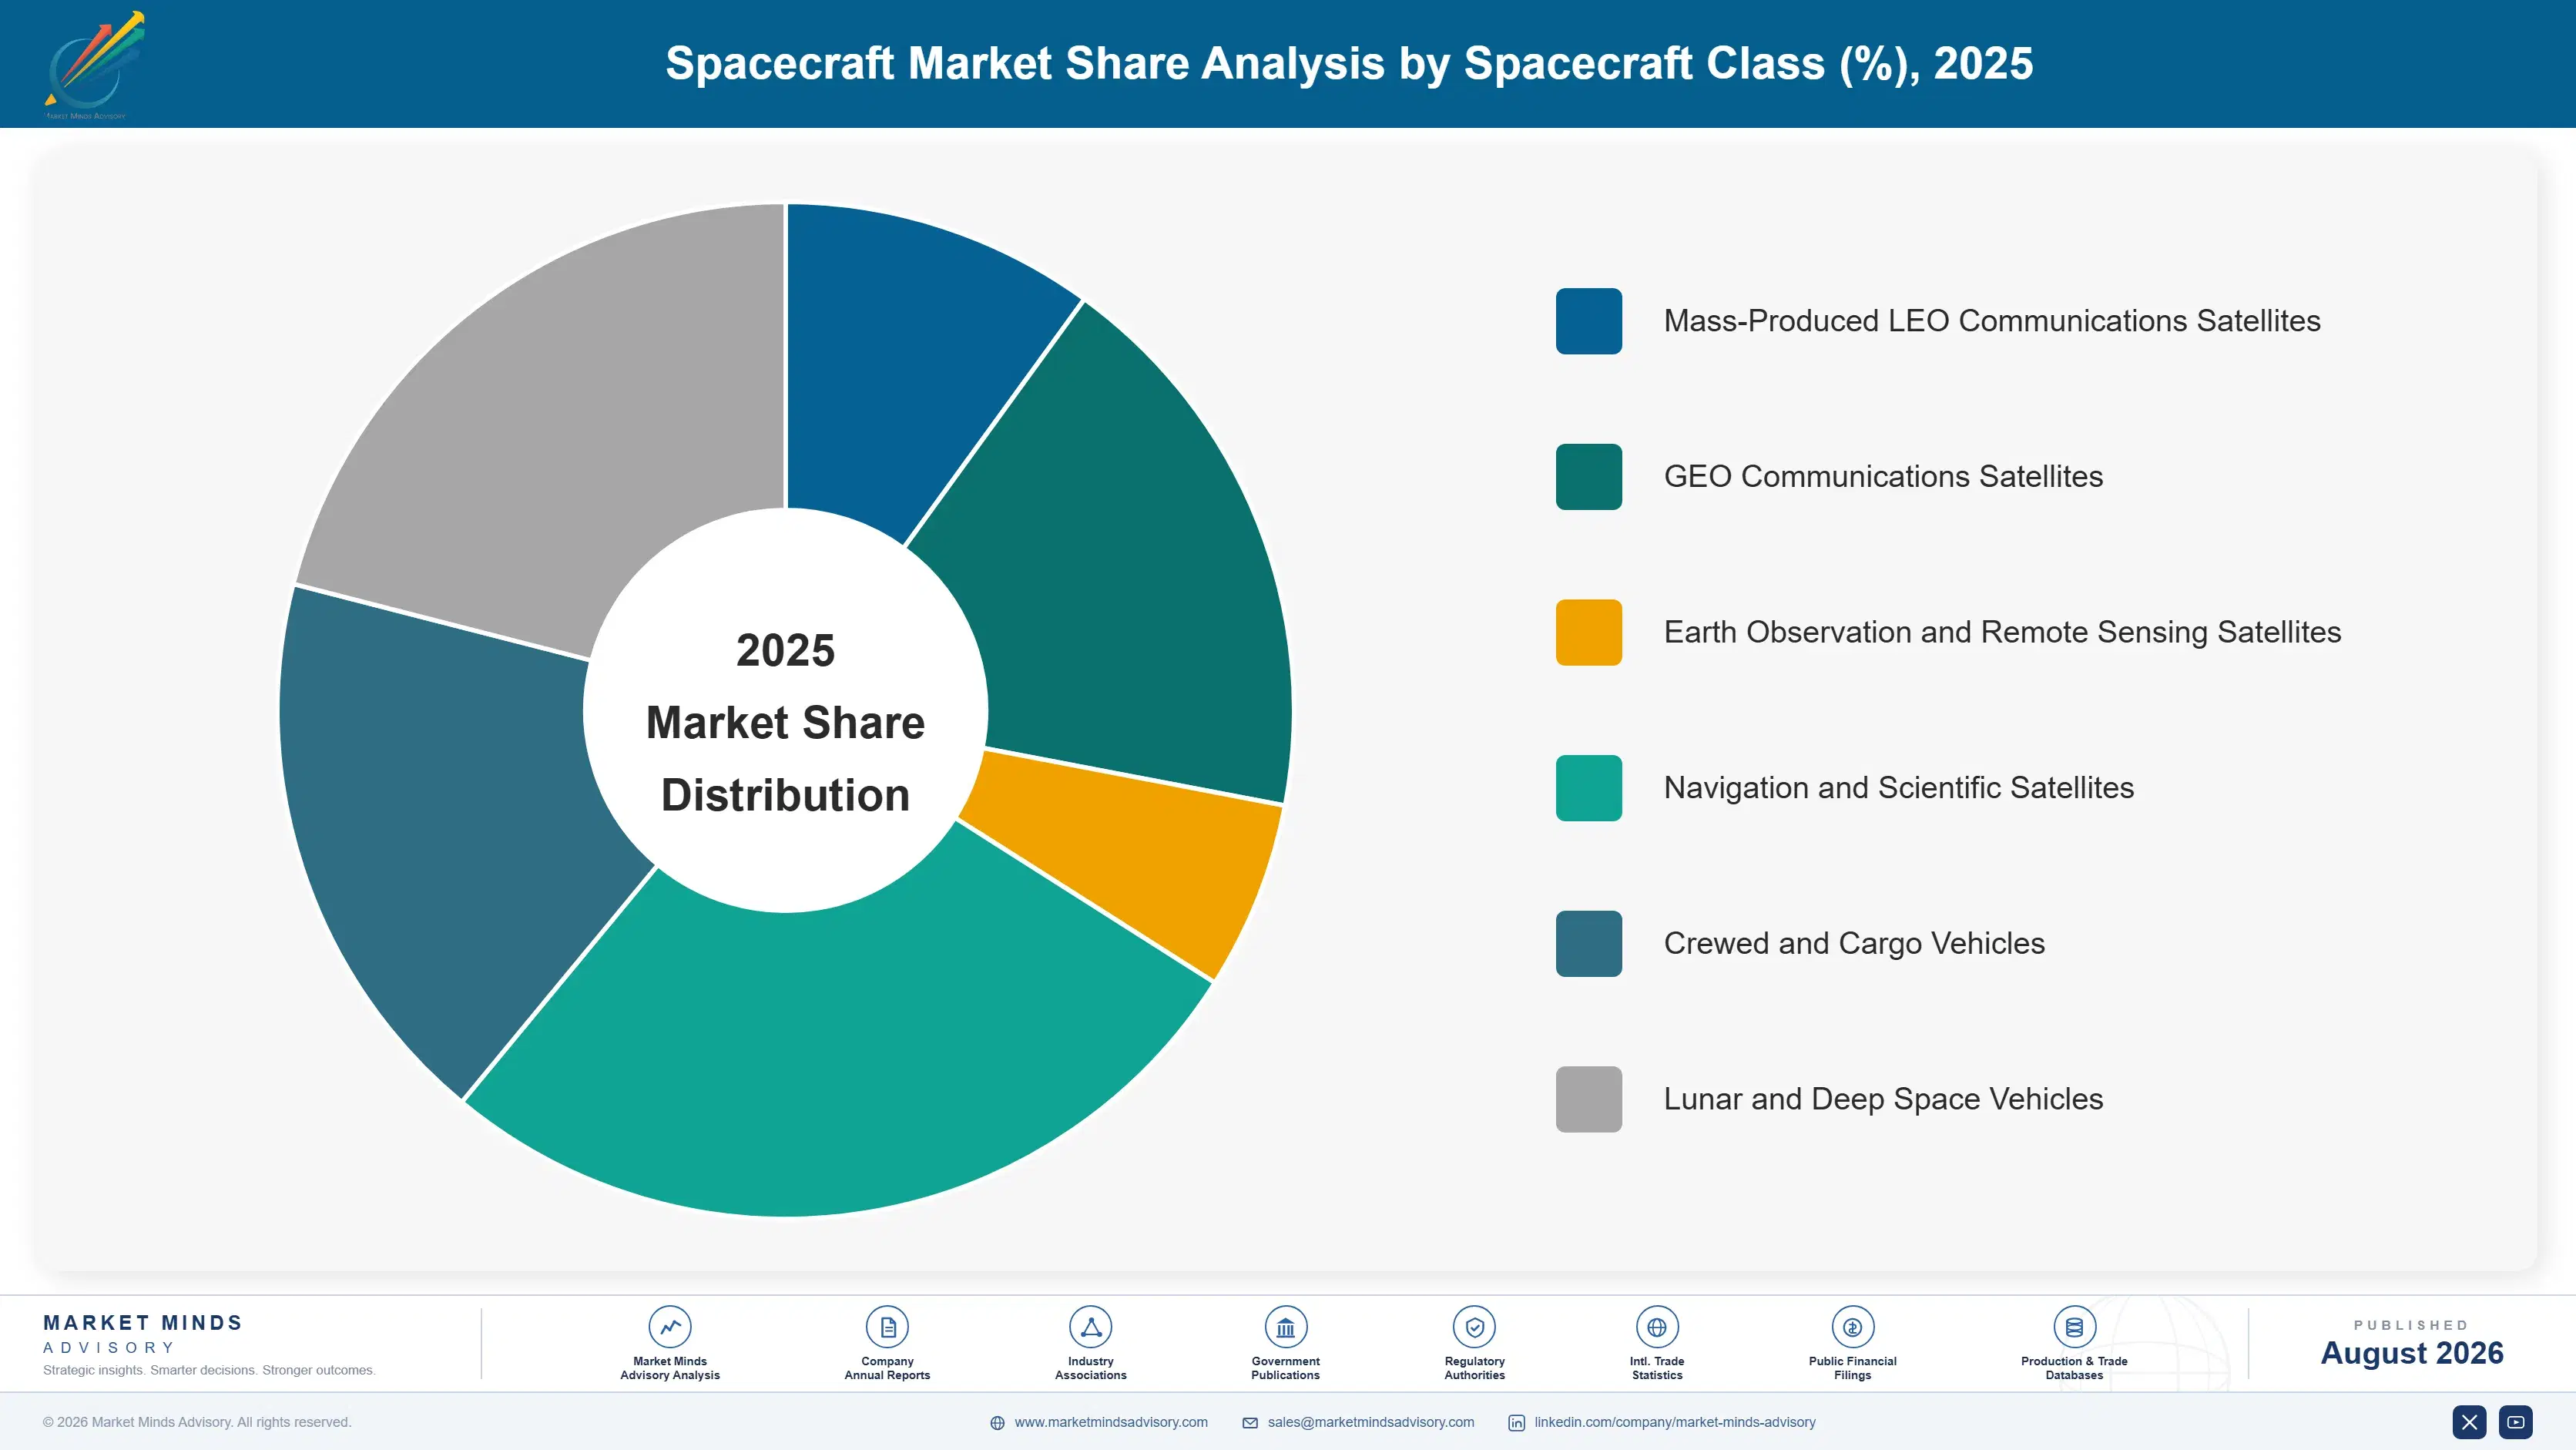
Segmentation follows spacecraft class, because that determines the manufacturing model, the qualification regime and the unit economics far more completely than any customer or application distinction would. Six classes describe the market entirely, from serially produced communications satellites at one extreme to lunar and deep space vehicles built individually one at a time at the other end.
spacecraft-market-market-share-analysis-1787982912898

Mass-Produced LEO Communications Satellites

The fastest class grows at 14.4%, half again the market rate of 9.6%, and it accounts for the overwhelming majority of vehicles delivered each year while representing a far smaller share of revenue than that suggests. Unit costs near 380,000 dollars, five year design lives and statistical acceptance of failure describe a manufacturing philosophy with almost nothing in common with the rest of this market. Vertical integration near 64% is not a preference but a requirement, because no qualified aerospace supply chain delivers at that price or cadence. The commercial risk sits entirely in deployment: a production line sized for a constellation has no alternative customer if the constellation stops.
CAGR 14.4%

Lunar and Deep Space Vehicles

Lunar and deep space vehicles grow at 12.2% as programmes move from single demonstration missions toward recurring deliveries. Landers, transfer stages, crewed elements and scientific probes are all built individually, qualified formally and priced on cost-plus development terms that reward capability over efficiency. Margins are modest and predictable rather than attractive. What makes the class commercially valuable is duration: these programmes run for decades, they change contractor almost never, and the engineering capability they sustain underpins bids for everything else a manufacturer wants to win. Indian, Chinese, European and American programmes are all funding this work concurrently, which has not happened before. Duration is the commercial asset here, not the margin on any single delivery.
CAGR 12.2%
Full segment breakdown across 6 segments available in the complete report.

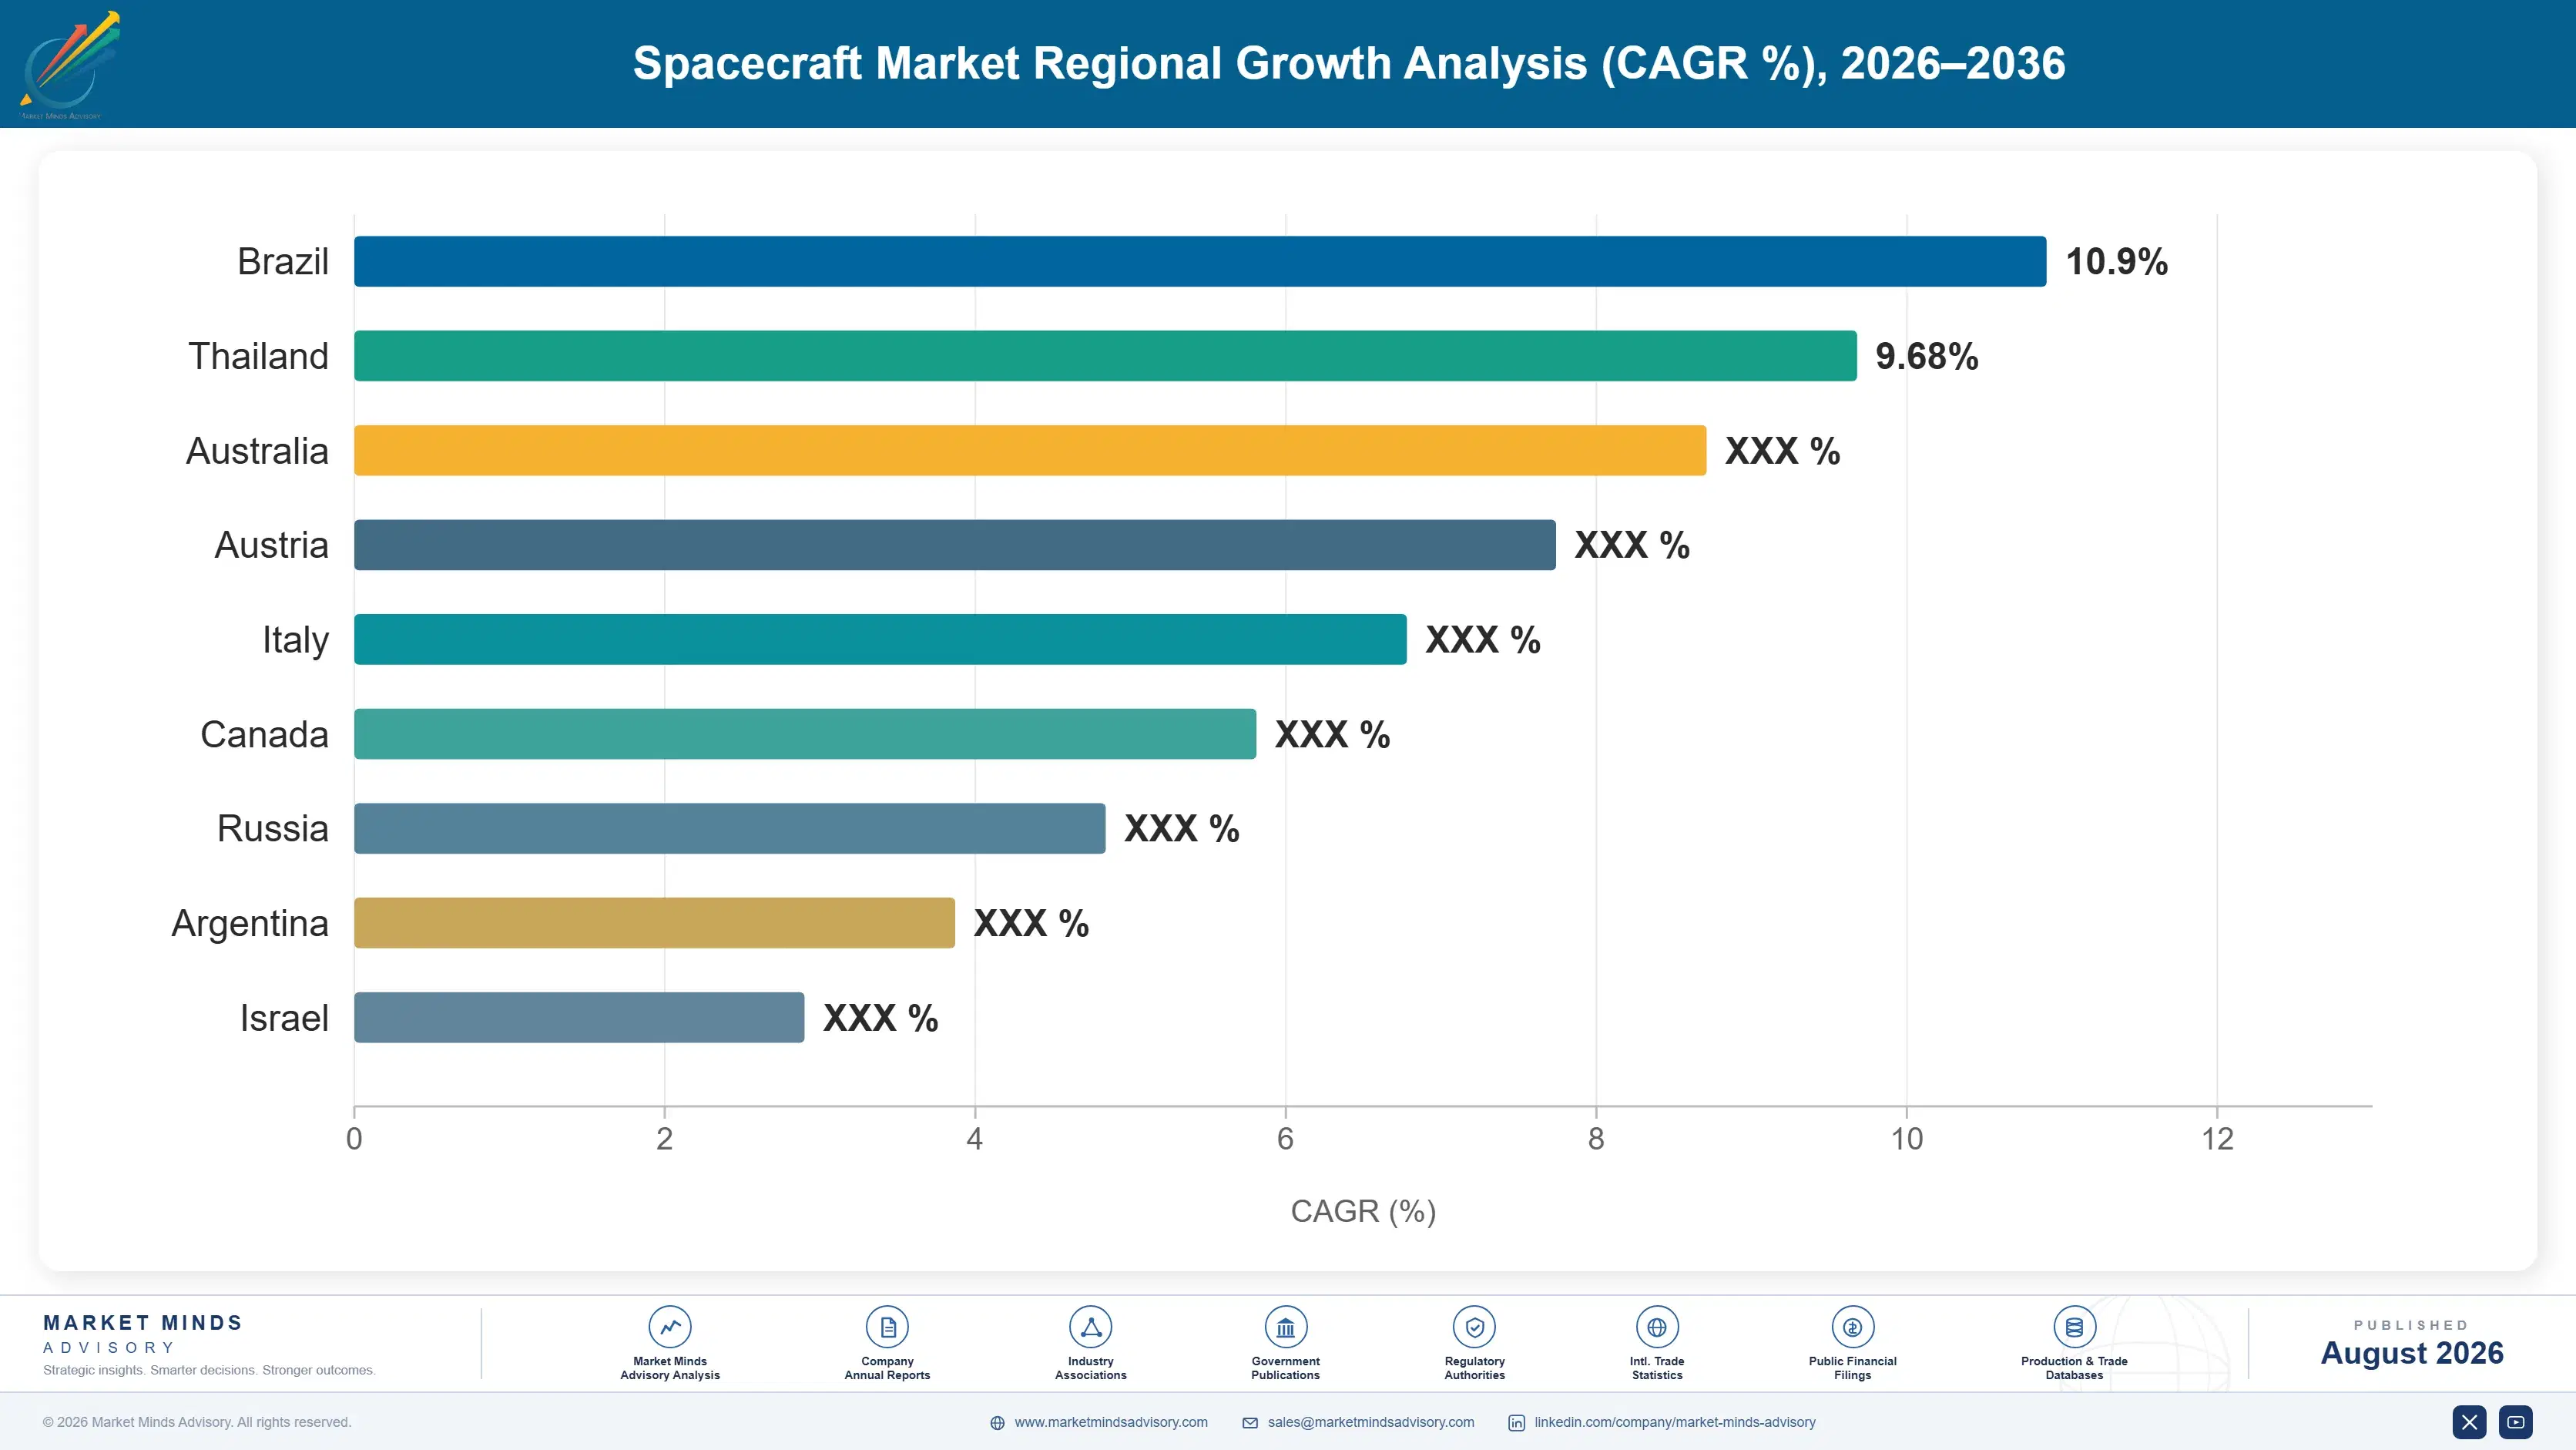
Regional Architecture and Country Demand Map

Spacecraft manufacture is genuinely distributed but not evenly so. North America holds the largest share because the world's highest-rate serial producer operates there alongside the deepest defence procurement, with East Asia second on national constellation programmes and Western Europe third on institutional and sovereign work.

North America

The largest share sits here at 32%, and honesty requires saying why rather than dressing it up: one vertically integrated manufacturer produces more spacecraft annually than the rest of the world combined, and American defence procurement funds proliferated architectures nobody else buys at comparable scale. Traditional primes hold substantial positions in crewed vehicles, deep space probes and intelligence platforms. Two significant acquisitions of small satellite builders completed during 2024, reflecting a judgement that serial capability is faster to buy than to develop from nothing internally. Whether those acquisitions preserve the cost economics that justified them is the open question, and the early evidence across this region is not especially encouraging for anybody involved.
Share: 32% | CAGR: 9.8% (2026 to 2036)

Western Europe

Institutional and sovereign programmes anchor this region rather than commercial volume. Airbus, Thales Alenia Space and OHB build across communications, earth observation, navigation and science, largely for European agencies and export customers on terms that reward capability over unit cost. A large multi-orbit connectivity programme committed under concession during December 2024 will fund manufacturing capacity across several national supplier bases deliberately. That distribution is industrially inefficient and politically necessary, and it produces durable positions that no purely commercial calculation would ever have created. European manufacturers therefore compete on qualification depth and national presence rather than on unit cost, which works while institutional funding holds and works far less well once a serial producer bids for the same contract.
Share: 21% | CAGR: 8.0% (2026 to 2036)
Regional intelligence for 5 additional markets available in the complete report: East Asia, South Asia and Pacific, Latin America, Middle East and Africa, Eastern Europe. Contact sales@marketmindsadvisory.com.
spacecraft-market-country-cagr-analysis-1787982913415

Where Spacecraft Margin Actually Comes From

Four levers work on manufacturing model, qualification cost and programme duration rather than on technical capability, which almost every serious participant here already possesses. Vertical integration depth, qualification reform, sovereign programme positioning and long-duration programme capture each address something a manufacturer controls before any contract exists at all. Technical capability rarely decides these outcomes.

Bring Subsystems Inside Before Rate Production Starts

A supply chain organised around qualified subcontractors delivers in months and in single-figure lot sizes, which is incompatible with any production rate above a few units weekly. Manufacturers bringing avionics, structures, propulsion and harnessing in house cut unit cost by 45% to 60% against equivalent subcontracted builds and gain schedule control that no contract term supplies. The investment is substantial and must precede the programme rather than follow it. Every high-rate producer in this market made that commitment before it had orders justifying it. The orders arrived afterwards, not before.
Market Impact: Cuts the unit cost by around 50% typically

Replace Individual Qualification With Lot Acceptance

Formal qualification absorbs roughly 31% of programme cost and exists because a bespoke mission cannot be repeated if a part fails. Serial production changes that calculation entirely: lot testing, statistical acceptance and designed-in redundancy achieve comparable constellation availability at a fraction of the cost. Manufacturers making the transition report qualification cost falling toward 12% of programme value. The obstacle is institutional rather than technical, since quality organisations built around individual qualification treat the change as a reduction in rigour rather than a change in method. That is a management problem, not an engineering one.
Market Impact: Cuts qualification cost toward 12% of programme value

Position For Sovereign Programmes Ahead Of Award

Sovereign constellation and connectivity programmes are funded on national capability grounds and deliberately distributed across domestic supplier bases, so the industrial footprint decision is made well before any competitive tender appears. A single European connectivity concession committed roughly 10.6 billion euros in December 2024 with workshare distribution embedded in the structure. Manufacturers holding qualifying national presence capture that work; those without it cannot bid meaningfully at any price. Establishing presence takes years and cannot be arranged once a programme is announced publicly. The decision was taken before anybody outside the process knew about it.
Market Impact: Accesses a share of EUR 10.6 billion programmes

Win Programmes Measured In Decades Not Deliveries

Lunar, deep space and crewed programmes carry modest margins near 8% to 12% and change contractor almost never, which makes them the steadiest revenue in this industry by a wide distance. They also sustain engineering capability that underpins bids for everything else, so their value considerably exceeds their direct contribution. Manufacturers treating them as low-margin distractions consistently lose the capability that wins higher-margin work later. Four separate national programmes are funding this class concurrently, which has not previously happened in the history of the industry. That concurrency will not last indefinitely.
Market Impact: Sustains 8% to 12% margins across whole decades

Who Controls the Margin Pool

Concentration is moderate at around 58% across the five largest builders, and that group changed more in five years than in the preceding thirty. One vertically integrated operator now builds more spacecraft annually than everybody else combined, though at unit values keeping its revenue share below its volume share. Traditional primes lead in crewed vehicles, deep space probes and intelligence platforms where qualification depth still decides.
Competition runs on three dimensions and very few participants lead on more than one. Manufacturing rate is the first, and it is genuinely binary: an organisation either has a production line or it does not. Qualification depth is second, still decisive for crewed and deep space work. National presence is the third, because sovereign programmes distribute workshare deliberately rather than competitively.

Pressure arrives from the volume end, not from new capability. Serial producers are moving into earth observation and defence work primes considered protected, carrying cost positions a subcontracted supply base cannot match. Acquisitions brought serial capability inside traditional companies without its economics. Rankings shift against manufacturers holding neither a production line nor a defensible sovereign position, the only two things now mattering.
spacecraft-market-company-positioning-matrix-1787982913939

Competitive Moat and Risk Dimensions

SPACEX

Moat: Vertical integration at production rate

SpaceX manufactures the overwhelming majority of its spacecraft value internally and operates the only genuine high-rate satellite production line anywhere, which produces unit costs no subcontracted supply chain can approach. Controlling launch as well removes the scheduling constraint every other manufacturer negotiates around. Replicating it means building a production line and a launch capability before having orders.
SPACEX

Risk: Single constellation demand concentration

Production capacity is sized against one constellation programme, so the line has no alternative customer at anything approaching that volume if deployment slows or the market for the service disappoints. Regulatory action on orbital congestion would affect the same programme directly. Manufacturing efficiency achieved through dedication to a single product is efficiency that does not transfer easily elsewhere.
AIRBUS DEFENCE AND SPACE

Moat: European institutional programme position

Airbus holds established positions across European institutional communications, earth observation, navigation and science programmes, which are funded on sovereignty grounds and distributed by workshare rather than won purely on price. That produces revenue visibility measured in decades. Building comparable national presence and agency relationships from outside is effectively impossible, since the qualifying criteria are industrial and political rather than commercial.
AIRBUS DEFENCE AND SPACE

Risk: Cost base against serial competitors

A supply chain and qualification regime built for bespoke institutional vehicles cannot reach the unit costs serial producers achieve, and those producers are now bidding for earth observation and connectivity work Airbus once held comfortably. Restructuring toward rate manufacture would mean dismantling supplier relationships that European workshare arrangements actively require it to maintain.

Players Tracked

Prominent Players

SpaceX
Airbus Defence and Space
Lockheed Martin Space
Northrop Grumman Space Systems
China Academy of Space Technology

Other Key Players

Thales Alenia Space
Boeing Defense Space and Security
L3Harris Technologies
Maxar Space Systems
Sierra Space
Rocket Lab
BAE Systems Space and Mission Systems
OHB SE
Mitsubishi Electric
Indian Space Research Organisation
Shanghai Academy of Spaceflight Technology
Blue Origin
Redwire
York Space Systems
Astranis

Recent Developments

FEBRUARY 2024

BAE Systems completed its acquisition of Ball Aerospace

BAE Systems completed the purchase of Ball Aerospace, bringing established spacecraft manufacturing and instrument capability inside a defence group that had previously held a limited space position. This was an acquisition rather than a merger or joint venture, and it reflected a judgement that capability was faster to buy.
Signal: Established defence groups are buying spacecraft capability outright rather than developing it internally from nothing at all.
OCTOBER 2024

Lockheed Martin completed its acquisition of Terran Orbital

Lockheed Martin completed the acquisition of small satellite manufacturer Terran Orbital, having previously been both a customer and an investor in the business. This was an acquisition rather than a merger, joint venture or supply agreement, and it brought serial production capability directly inside a traditional prime contractor.
Signal: Buying a production line is straightforward, and preserving its cost economics inside a prime is not.
DECEMBER 2024

European connectivity constellation concession contract signed

A concession contract for a multi-orbit European connectivity constellation was signed with an industrial consortium, committing funding of roughly 10.6 billion euros with manufacturing workshare deliberately distributed across national supplier bases within the union. This was a public concession award rather than any merger, acquisition or private commercial arrangement.
Signal: Sovereign programmes distribute manufacturing by workshare, so industrial presence matters far more than any competitive pricing.

What Building A Spacecraft Costs

Programme cost divides into four components whose proportions differ completely between the two manufacturing models. Testing, qualification and documentation absorb roughly 31% on a bespoke vehicle and closer to 12% on a serially produced one. Flight hardware and materials run near 34%, engineering and integration labour near 24%, and facilities with tooling account for the remaining 11% across a typical programme.
The 2021 to 2023 semiconductor and materials disruption showed how differently the two models absorb a supply shock. Bespoke programmes carrying qualified single-source components had no substitution path and simply waited, extending schedules by quarters. Serial producers using industrially qualified parts substituted within weeks. Airbus and Lockheed Martin both discussed supply chain and schedule pressures across that period in their annual reporting, while high-rate production continued largely uninterrupted.

Exposure varies by manufacturing model rather than by geography, which is unusual for aerospace. Manufacturers building 64% of vehicle value internally control cost and schedule directly. Those relying on qualified subcontractors carry lead times and prices they negotiate but cannot compress. Cost-plus programmes pass much of the exposure to the customer, which is why crewed and deep space work carries modest but genuinely predictable margins.
spacecraft-market-cost-volatility-analysis-1787982914135

Industrial component qualification against mission life

Qualifying automotive and industrial grade components against actual mission life, rather than specifying space grade parts by default, cuts hardware cost substantially and removes single-source lead times entirely. The approach works where design life is five years rather than fifteen. Manufacturers applying it to bespoke long-life vehicles have generally regretted it, and the distinction matters more than the saving does.

Lot acceptance testing replacing individual qualification

Testing a sample from each production lot rather than qualifying every unit individually reduces the 31% qualification component toward 12% while maintaining constellation availability through designed redundancy. Quality organisations built around individual qualification resist it consistently. The barrier is institutional rather than technical, and it has defeated more serial production programmes than any engineering problem has.

Facility repurposing away from geostationary capacity

Cleanrooms and test facilities sized for a geostationary order rate that no longer exists carry fixed cost against far fewer programmes than they were built for. Repurposing toward defence, scientific and earth observation work recovers utilisation without new capital. Manufacturers that delayed the decision have carried the cost for several years while the order rate showed no sign of recovering.

Portfolio Architecture for Margin Defence

The portfolio separates by manufacturing model rather than by mission, and the two barely overlap. Serially produced communications satellites deliver enormous unit volume at low unit value, and margins depend entirely on whether a manufacturer achieved the vertical integration and qualification reform that the model requires. Those that did earn respectably; those that applied bespoke processes to a production line earn nothing and frequently lose money outright.
Institutional and scientific work provides the baseload that keeps engineering organisations intact between programmes. Navigation, science and earth observation satellites for national agencies carry moderate margins on long timescales, and they change contractor rarely because the qualifying relationships are industrial and political rather than commercial. They will never grow quickly and they will also never disappear, which is worth considerably more than it sounds.

The most valuable position is duration rather than margin. Lunar, deep space and crewed programmes earn perhaps 8% to 12% and run for decades, sustaining engineering capability that underpins bids for everything else. Manufacturers treating them as low-margin distractions lose the people who would win the higher-margin work later on. That loss is not recoverable quickly.

Volume / Commodity-Adjacent

Serially produced low orbit communications satellites built on production lines. Range spans eight points because vertical integration depth and qualification method decide unit economics far more than any technical difference between the vehicles themselves.
Gross Margin: 10-18%

Premium / Certified

Earth observation, navigation and scientific satellites for institutional customers. Range spans eight points because fixed price commercial work and cost-plus agency programmes produce entirely different outcomes on otherwise comparable vehicles.
Gross Margin: 14-22%

Sustainability / Regulatory / Next-Generation

Crewed vehicles, landers and deep space probes on long development programmes. Range spans twelve points because early development phases earn modest cost-plus fees while recurring production deliveries earn considerably better once established.
Gross Margin: 8-20%
spacecraft-market-portfolio-architecture-1787982914637

High-value Sub-segments and Strategic Watch-out

Mass-Produced LEO Communications

High value and high growth at 14.4%, carrying most of the unit volume in this market and a far smaller share of revenue. The eight point range separates vertically integrated producers from those attempting rate manufacture on a subcontracted supply base. Nothing else explains the gap.
Gross Margin: 12-20%

Lunar and Deep Space Vehicles

High value with moderate growth at 12.2%, funded concurrently by four separate national programmes for the first time. The twelve point range reflects the gap between cost-plus development phases and recurring production deliveries once a design settles. Duration is the real asset here, not the margin.
Gross Margin: 8-20%

Navigation and Scientific Satellites

The institutional baseload keeping engineering organisations intact between commercial programmes. Growth is slow and the work changes contractor rarely, because qualifying relationships are industrial and political rather than won on any competitive price. That predictability is worth considerably more than it appears to be on paper.
Gross Margin: 14-22%

GEO Communications Satellites

The strategic watch-out rather than a growth pool. Annual orders fell below ten and have not recovered, leaving specialised cleanroom and test capacity carrying fixed cost against a programme rate that nobody expects to return. Nobody in this industry expects that rate to come back.
Gross Margin: Variable

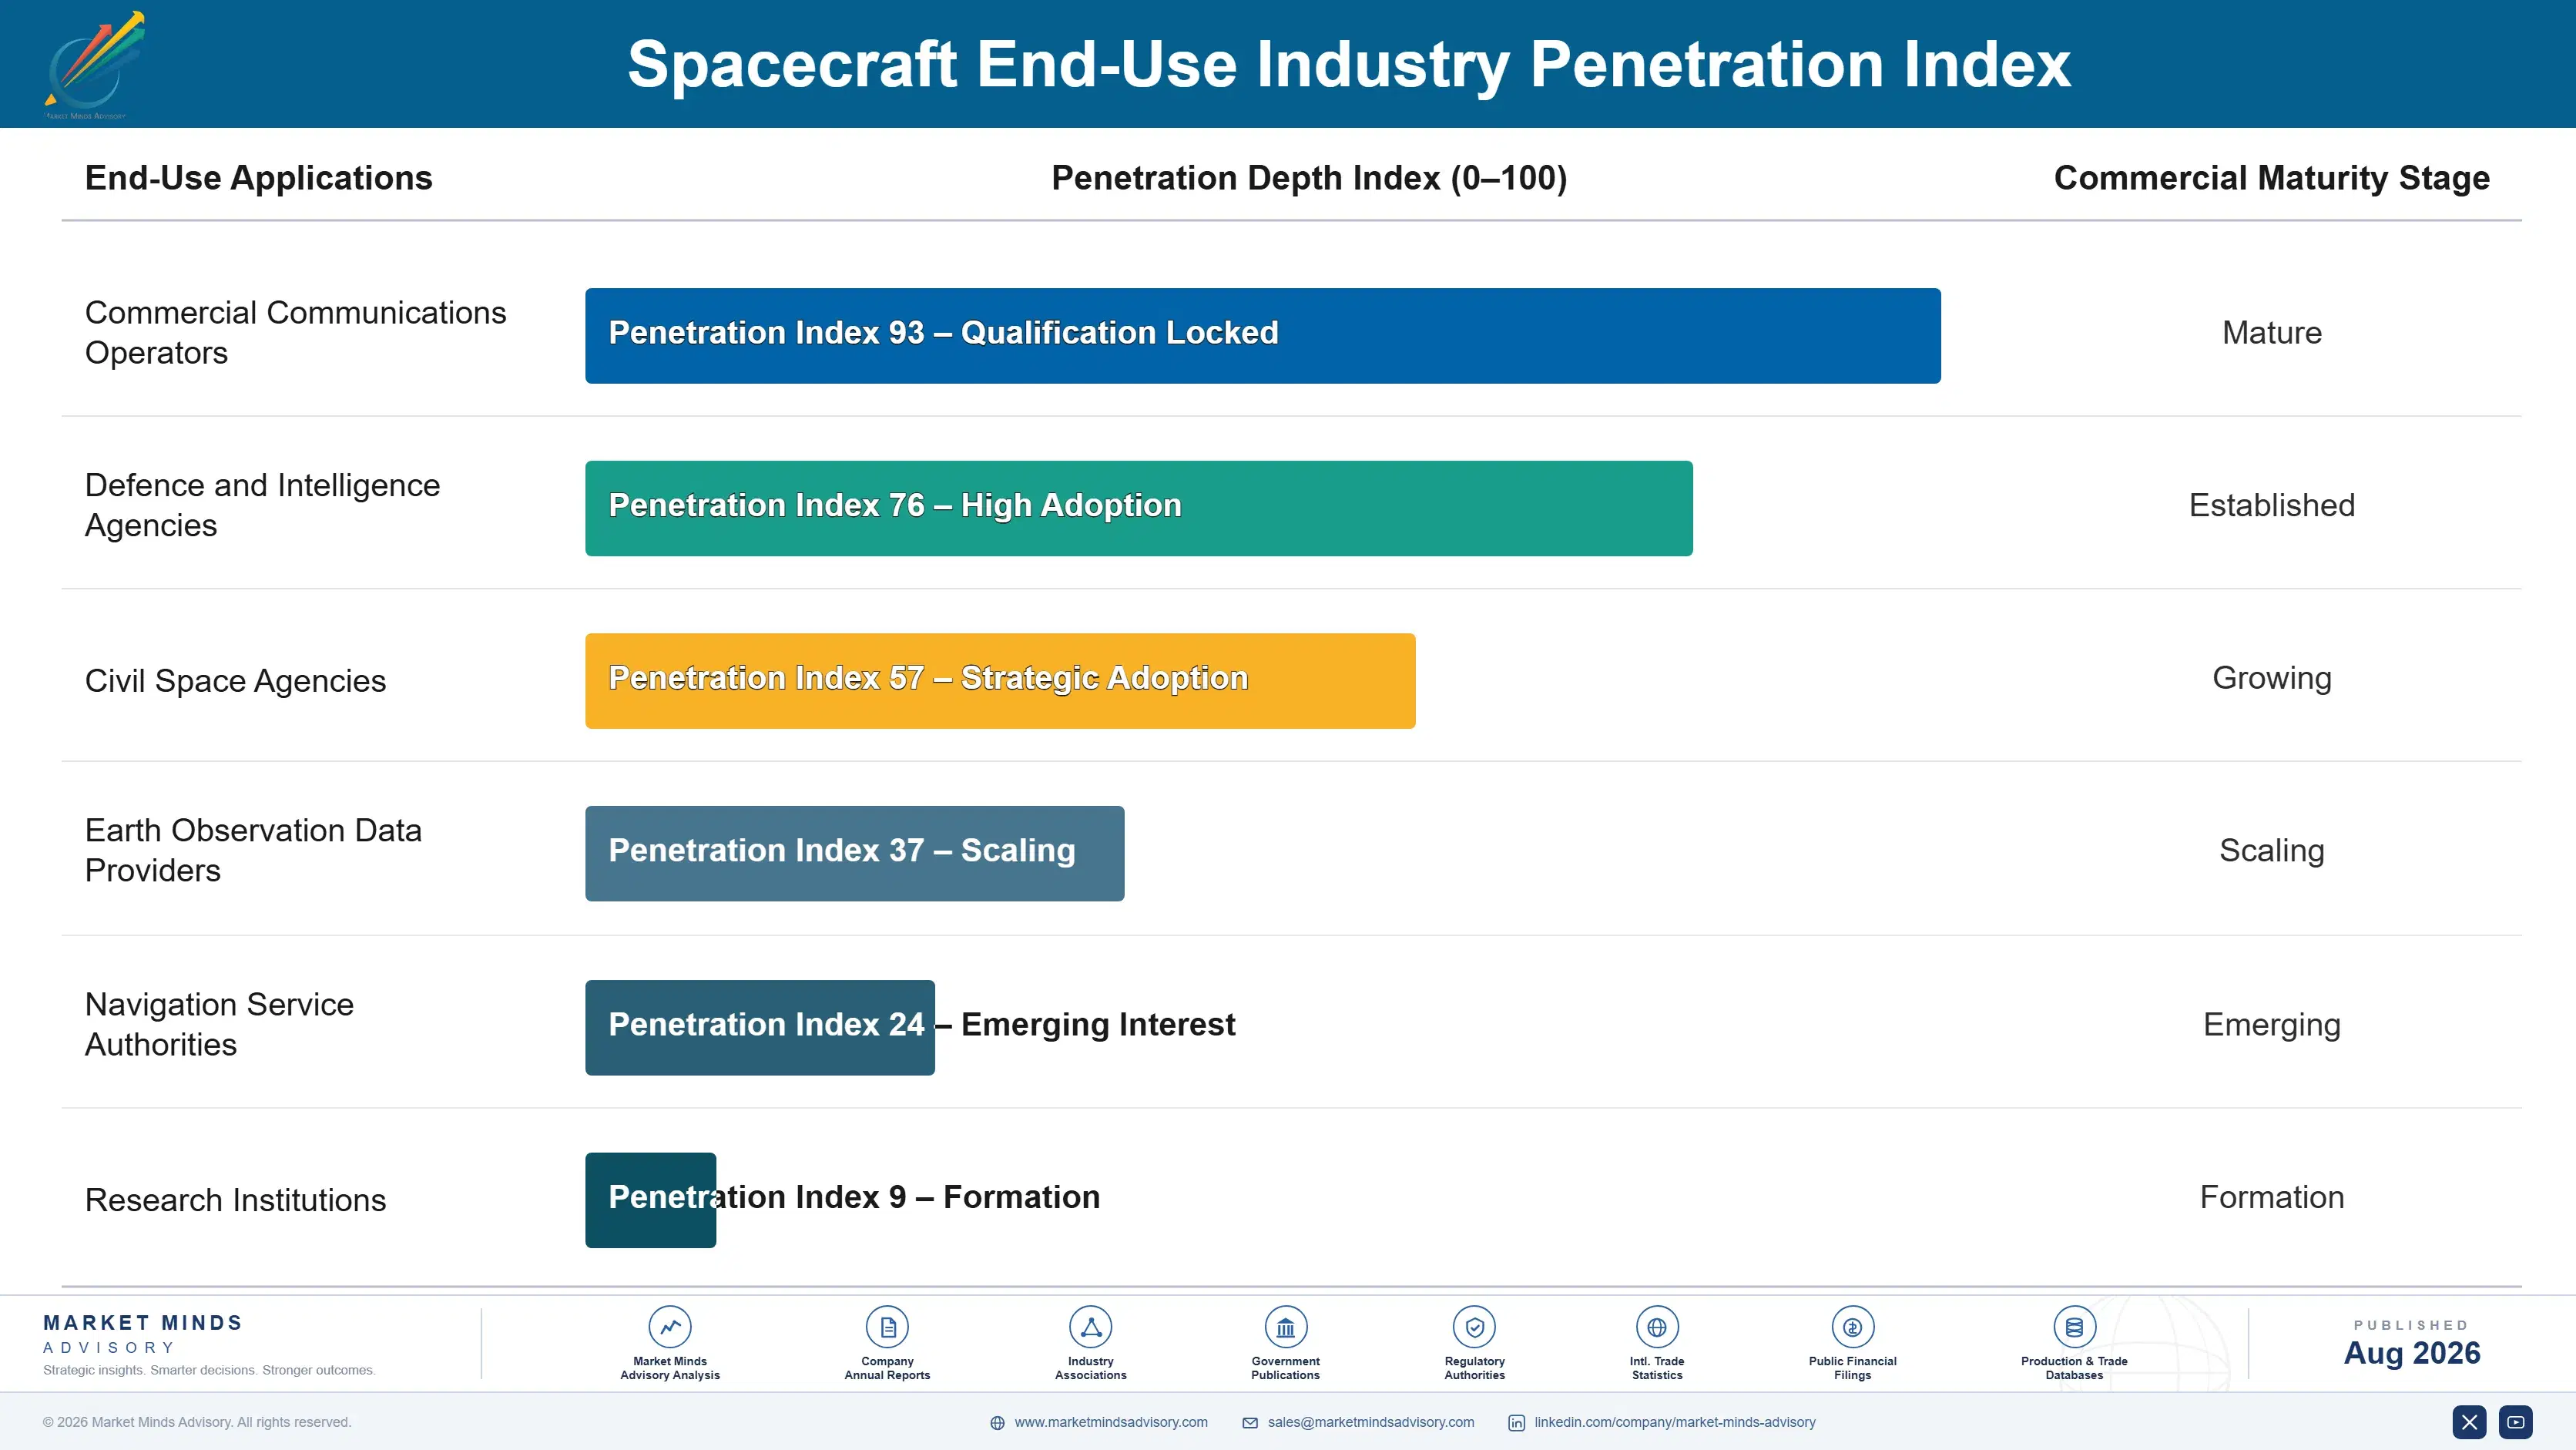
Why Programmes Run For Decades

Institutional spacecraft programmes produce annuity economics through duration rather than through recurring transactions. A navigation or science programme awarded after a multi-year competition runs for fifteen years or longer, changes contractor almost never, and generates follow-on production, spares and sustainment throughout. Replacing the incumbent means requalifying a design and rebuilding an engineering relationship, which agencies undertake rarely and almost never for price alone.
Stickiness varies enormously by customer type. Civil space agencies and defence customers are the most attached, since qualification history and security clearances both take years to establish and neither transfers. Commercial constellation operators building their own vehicles are not customers at all in the conventional sense. Export customers buying complete satellites are the least attached, moving on price and on political relationships that shift faster than any technical consideration.

Customer profiles are changing in a way that disadvantages incumbents. Operators increasingly manufacture their own spacecraft rather than buying them, which removes the largest growth pool from the merchant market entirely. Sovereign programmes meanwhile distribute work by national presence rather than by competitive selection. Neither trend rewards the capability that traditional primes spent decades building, and neither is going to reverse.
spacecraft-market-end-use-penetration-index-1787982915128

Where Spacecraft Builders Should Commit

These are among the four positions where our research anticipates prominent divergence between winners and laggards over the coming forecast period. Each is grounded in the demand model, the regulatory perimeter, and the announced capacity pipeline.
01 / VERTICAL INTEGRATION DEPTH

Bring subsystems inside before the rate demands it

A supply chain organised around qualified subcontractors delivers in months and in single-figure lots, which is fundamentally incompatible with any production rate above a few units each week. Manufacturers bringing avionics, structures, propulsion and harnessing in house cut unit cost by 45% to 60% against equivalent subcontracted builds and gain schedule control no contract term can supply. The investment must precede the orders, and every high-rate producer in this market made exactly that commitment long before anything at all justified it.
02 / QUALIFICATION METHOD REFORM

Lot acceptance is a different method, not less rigour

Formal individual qualification absorbs roughly 31% of total programme cost, and it exists because a bespoke mission cannot be repeated when a part fails unexpectedly. Serial production changes that whole calculation completely, since lot testing, statistical acceptance and designed redundancy together deliver comparable constellation availability at a small fraction of the cost. Manufacturers completing that transition report qualification cost falling toward 12% of programme value, and the barrier that defeats most of them is institutional rather than anything remotely technical.
03 / SOVEREIGN PROGRAMME POSITIONING

National presence decides workshare before any tender

Sovereign constellation and connectivity programmes are funded on national capability grounds, and they distribute manufacturing across domestic supplier bases quite deliberately, so the industrial footprint decision happens well before any competitive tender ever appears at all. One single European concession committed roughly 10.6 billion euros in December 2024 with the workshare embedded directly into its structure. Manufacturers already holding qualifying national presence capture that work, and those without it cannot bid meaningfully at any price they might care to offer.
04 / LONG DURATION CAPABILITY

Deep space work funds the engineers who win everything else

Lunar, deep space and crewed programmes earn perhaps 8% to 12% and they change contractor almost never, which makes them easily the steadiest revenue anywhere in this industry by quite a considerable distance. They also sustain the engineering capability that underpins credible bids for the higher-margin work elsewhere, so their real value exceeds their direct contribution quite substantially. Manufacturers treating them as low-margin distractions consistently end up losing the people who would otherwise have won the next competition for them.

Engagement Snapshot From the Field

A live engagement with an industry participant carrying material or product regulatory and market exposure ahead of a defining policy shift, showing how our research translates into a defensible multi-year portfolio strategy.
MARKET MINDS ADVISORY · CLIENT ENGAGEMENT SUMMARY
Spacecraft Producer Strategic Portfolio Review and Transition Roadmap 2026·Investment Scenario on Spacecraft Exposure Evaluation 2025-26
CLIENT PROFILE
An established spacecraft prime contractor building institutional communications, earth observation and scientific satellites for national agencies and export customers, with a qualified supply base developed across three decades. The business had acquired a small satellite manufacturer two years earlier and found that the acquired unit's cost advantage had largely disappeared once group processes were applied to it.
STRATEGIC CHALLENGE
The board needed to understand why acquired serial production economics had not survived integration, and whether they could be recovered without compromising the qualification standards its institutional customers required. It also faced declining geostationary order rates leaving specialised cleanroom capacity underutilised, with no agreed view on whether to repurpose those facilities or reduce them.
MMA APPROACH
MMA rebuilt unit economics for the acquired production line before and after integration, attributing cost increases to specific process, supplier approval and review requirements imposed by the parent organisation. Expert interviews with agency customers, quality authorities and serial producers elsewhere established which qualification methods institutional customers would genuinely accept and which were assumed rather than required.
KEY FINDINGS
  1. Applying group supplier approval processes to the acquired line raised component cost by 38% while delivering no measurable improvement in demonstrated on-orbit reliability.
  2. Individual unit qualification had replaced lot acceptance after integration, adding 19 percentage points to programme cost on vehicles designed for five year lives.
  3. Two of the three agency customers had never required individual qualification for short-life vehicles, so the standard was being applied through internal assumption rather than any customer demand.
  4. Geostationary cleanroom capacity ran at 31% utilisation against a facility sized for an order rate the market had not produced in seven years.
CLIENT PROFILE
An established spacecraft prime contractor building institutional communications, earth observation and scientific satellites for national agencies and export customers, with a qualified supply base developed across three decades. The business had acquired a small satellite manufacturer two years earlier and found that the acquired unit's cost advantage had largely disappeared once group processes were applied to it.
STRATEGIC CHALLENGE
The board needed to understand why acquired serial production economics had not survived integration, and whether they could be recovered without compromising the qualification standards its institutional customers required. It also faced declining geostationary order rates leaving specialised cleanroom capacity underutilised, with no agreed view on whether to repurpose those facilities or reduce them.
MMA APPROACH
MMA rebuilt unit economics for the acquired production line before and after integration, attributing cost increases to specific process, supplier approval and review requirements imposed by the parent organisation. Expert interviews with agency customers, quality authorities and serial producers elsewhere established which qualification methods institutional customers would genuinely accept and which were assumed rather than required.
KEY FINDINGS
  1. Applying group supplier approval processes to the acquired line raised component cost by 38% while delivering no measurable improvement in demonstrated on-orbit reliability.
  2. Individual unit qualification had replaced lot acceptance after integration, adding 19 percentage points to programme cost on vehicles designed for five year lives.
  3. Two of the three agency customers had never required individual qualification for short-life vehicles, so the standard was being applied through internal assumption rather than any customer demand.
  4. Geostationary cleanroom capacity ran at 31% utilisation against a facility sized for an order rate the market had not produced in seven years.
RECOMMENDED STRATEGY
Phase 1: Phase one: restore lot acceptance and the original supplier approval process on the acquired production line, ring-fenced from group bespoke programme requirements. Phase 2: Phase two: confirm qualification expectations directly with each agency customer rather than applying the most conservative internal standard by default. Phase 3: Phase three: repurpose two of the three geostationary cleanrooms toward defence and earth observation work rather than continuing to hold them idle.
OUTCOME
The client reported serial line unit cost falling 29% within five quarters (client-reported, unverified by MMA), recovering most of the advantage lost during integration. Cleanroom utilisation rose from 31% to 58% after repurposing. No customer objected to the restored qualification method, which management had identified as the principal risk in the entire programme.

Frequently Asked Questions

Foundational context covering the market sizes, CAGR, scope, country, region and competition that inform every finding below. This section is provided to cover basics and most often pre-purchase conversations, answered from the MMA Primary Research Dataset.

What is the current size of the Spacecraft Market?

The market is valued at USD 24.5 billion in 2025, measured as revenue from the manufacture and integration of spacecraft across all classes, including vehicles built by operators for their own use.

How large will the Spacecraft Market be by 2036?

MMA forecasts USD 67.15 billion by 2036, up from USD 26.85 billion in 2026. That represents incremental revenue of USD 40.30 billion and an expansion multiple of 2.50 times.

What is the CAGR for the Spacecraft Market 2026 to 2036?

The base case CAGR is 9.6%, with a bull case of 10.8% and a bear case of 8.4%. Constellation deployment and proliferated defence architectures supply most of that growth.

Which segment is growing fastest?

Mass-produced low orbit communications satellites grow at 14.4%, half again the market rate of 9.6%. They account for most units delivered and a far smaller share of revenue.

Who are the major companies in the Spacecraft Market?

SpaceX, Airbus Defence and Space, Lockheed Martin Space, Northrop Grumman Space Systems and the China Academy of Space Technology lead, holding around 58% of manufacturing revenue between them.

Which country is growing fastest?

India grows fastest at 11.6%, driven by programme expansion and a developing commercial manufacturing base. North America holds the largest regional share by a clear margin.

Report Segmentation Architecture

The full report scope spans multiple orthogonal segmentation dimensions, with cross-tabulated demand data provided for each dimension pair. Coverage extends further to regional breakdowns, trend trajectories, and the competitive detail needed to support segment-level decision-making.

By Spacecraft Class

  • Mass-Produced LEO Communications Satellites
  • GEO Communications Satellites
  • Earth Observation and Remote Sensing Satellites
  • Navigation and Scientific Satellites
  • Crewed and Cargo Vehicles
  • Lunar and Deep Space Vehicles

By End-Use Industry

  • Commercial Communications Operators
  • Defence and Intelligence Agencies
  • Civil Space Agencies
  • Earth Observation Data Providers
  • Navigation Service Authorities
  • Research Institutions

By Commercial Dimension

  • Prime Contractor Manufacture
  • Vertically Integrated Operator Build
  • Bus Supply to Integrators
  • Subsystem and Payload Supply
  • Cost-Plus Development Contracts
  • Fixed Price Serial Production

By Region

  • North America
  • Western Europe
  • East Asia
  • South Asia and Pacific
  • Latin America
  • Middle East and Africa
  • Eastern Europe

Scope, Methodology, and Coverage

Every figure in this report is reproducible from documented input assumptions. The scope below maps the historical period, the forecast horizon, the segmentation dimensions, and the countries covered, alongside the underlying primary and qualitative methodology.
Historical Period
2020 to 2025
Forecast Period
2026 to 2036
Base Year
2025 (USD billions; MMA Primary Research Dataset, August 2026)
Market Definition
Revenue from the manufacture and integration of spacecraft intended for operation beyond the atmosphere, spanning mass-produced and geostationary communications satellites, earth observation and remote sensing platforms, navigation and scientific satellites, crewed and cargo vehicles, landers and deep space probes. Vehicles built by operators for their own use are included at manufacturing cost. Launch vehicles and launch services, ground segment equipment, satellite operating and data service revenue, and in-orbit servicing operations are excluded from scope.
Quantitative Units
USD billions, spacecraft manufacturing revenue
Segmentation Dimensions
Spacecraft class, end-use customer industry, commercial manufacturing dimension, region
Regions Covered
North America, Western Europe, East Asia, South Asia and Pacific, Latin America, Middle East and Africa, Eastern Europe
Countries Covered
United States, France, Germany, Italy, United Kingdom, China, Japan, South Korea, India, Brazil, United Arab Emirates, Poland
Key Companies Profiled
SpaceX, Airbus Defence and Space, Lockheed Martin Space, Northrop Grumman Space Systems, China Academy of Space Technology, Thales Alenia Space, Boeing Defense Space and Security, Maxar Space Systems, OHB SE, Rocket Lab
Quantitative Methodology
Primary survey, n=3,800 respondents, Q4 2025, six countries; demand-side model with trade association cross-validation
Qualitative Methodology
47 expert interviews, Q4 2025; applied to validate demand model assumptions, identify emerging dynamics, and assess competitive positioning
Report Format
PDF and XLSX data workbook (Word format preview document)
Publisher
Market Minds Advisory
Report Code
MMA-2026-CON-191
Published
August 2026
Contact
sales@marketmindsadvisory.com | www.marketmindsadvisory.com

Purchase the full Spacecraft Market Report (2026 to 2036).

The full report treats spacecraft manufacture as two separate industries sharing a name, and shows why the economics of one cannot be applied to the other. It decomposes programme cost across bespoke and serial models, quantifies the qualification burden each carries, and models what vertical integration actually delivers in unit cost and schedule control. Segment analysis covers all six spacecraft classes, with particular attention to why acquired serial production capability so rarely survives integration into a traditional prime. Competitive assessment ranks twenty manufacturers on manufacturing revenue and delivered vehicle mass across every producing region.
Six spacecraft class segmentation with growth rates
Programme cost decomposed across bespoke and serial models
Twenty manufacturer assessment on manufacturing revenue
Vertical integration impact on unit cost quantified
Qualification method comparison against demonstrated reliability
Sovereign programme workshare distribution by national base

Built For The People Who Decide

From boardroom strategy to bench-side execution, this report is read cover-to-cover by leaders shaping the next decade of their industry, turning demand scenarios, market dynamics and valuation benchmarks into decisions.
CXOs/ Presidents/ VPs/ Managers
M&A and Corporate Development
Strategy Teams and R&D Heads
Procurement and Product Directors
Regulatory and Compliance Leaders
Investor Relations and Equity Analysts