

Market Minds Advisory
Space Situational Awareness Market

Space Situational Awareness Market: Space Situational Awareness Market: Conjunction Volume, Custody Economics and Who Pays For Watching 2026 to 2036

Operators receive thousands of collision warnings a year and act on almost none of them. The commercial problem is not detecting objects, it is producing warnings anybody can actually use.

Lead Analyst

Published

September 2026

Make Smarter Decisions with Customized Research Insights

Request a free sample report and evaluate market opportunities, growth trends, and competitive dynamics relevant to your business needs.

2025 MARKET VALUE$2.1BMarket Size 2025
2036 FORECAST VALUE$8.5BBase Case , 2026 to 2036
CAGR 2026 TO 203613.4 %Bull 14.7% / Bear 12.1%
INCREMENTAL OPPORTUNITY$6.1BNet 10- year value creation
EXPANSION MULTIPLE3.54x2036 value over 2026 base
Strategic Levers
M&A Pipeline
Regional Outlook
Country Rankings
Competitive Intelligence
Segmental Deep-dive
Call-Us : 91 93563 13602

Executive Snapshot and Market Trajectory.

A large constellation operator now receives several thousand collision warnings a year and manoeuvres in response to a tiny fraction of them. The commercial problem in this category is not detecting objects at all. It is producing warnings that somebody can actually act on.
The market reaches USD 2.4 billion in 2026 and USD 8.5 billion by 2036, a 3.54 times expansion at 13.4% annually. Conjunction assessment and collision avoidance services grow at 20.1%, half again the market rate of 13.4%, because warning volume rises far faster than any operator can evaluate it. North America holds 38% of global spending, above the usual band ceiling, and India compounds fastest of any market at 21.8% on sovereign national programmes.
Five suppliers hold 47% of tracking, data and service revenue between them, and government sensor networks provide the underlying observations that most commercial providers actually build upon rather than collecting themselves. LeoLabs, ExoAnalytic Solutions, COMSPOC, Slingshot Aerospace and Kayhan Space lead the commercial field between them. Whoever holds custody of an object across successive observations, rather than merely detecting it once, is the one selling something genuinely useful.
Market Definition
This report covers space situational awareness capability by service class: conjunction assessment and collision avoidance services, ground-based radar and optical tracking networks, space-based observation and inspection systems, catalogue maintenance and orbit determination software, space weather monitoring and forecasting, and regulatory compliance and licensing support tools. It excludes launch services, satellite manufacturing, satellite communications and payload operations, active debris removal hardware, and general astronomical observation not directed at tracking objects.
Base Year Value
$2.1B in 2025 (MMA Primary Research Dataset, September 2026)
Forecast Period
2026 to 2036, eleven discrete annual values
CAGR
13.4% base case. Bull 14.7%. Bear 12.1%.
Fastest Growth Segment
Conjunction Assessment And Collision Avoidance Services: 20.1% CAGR
Fastest Growth Country
India: 21.8% CAGR
Fastest Growth Region
South Asia and Pacific: 15.6% CAGR
Largest Region
North America: 38% of 2025 global value
Market Leaders
LeoLabs, ExoAnalytic Solutions, COMSPOC, Slingshot Aerospace and Kayhan Space lead on space situational awareness tracking, data and service revenue. Source: MMA Analysis.
Primary Survey
n=3,800 procurement and R&D decision-makers, Q4 2025, six countries
Methodology
Demand-side build-up, cross-validated against public data, 47 expert interviews

Space Situational Awareness Market Forecast Scenarios

space-situational-awareness-market-size-forecast-scenario-1789996557275
Between 2020 and 2025 the category compounded at 12.1%, driven almost entirely by the number of objects in low earth orbit rather than by any change in what operators wanted. Constellation deployment multiplied the tracked population, which multiplied conjunction events geometrically rather than proportionally. Government networks that had monitored a few thousand objects found themselves cataloguing tens of thousands, and commercial providers appeared to fill the gaps.
The base case holds 13.4% on three mechanisms. Object population keeps rising as constellation deployment continues and as fragmentation events add debris nobody planned for. Regulatory obligations around collision avoidance and disposal are tightening across licensing regimes, which converts a prudent practice into a condition of operating. And national programmes across India, the Gulf and Southeast Asia keep funding sovereign tracking capability rather than depending on other countries for it.
The bull case at 14.7% assumes a significant fragmentation event occurs, which would raise both the tracked population and political urgency simultaneously. The bear case at 12.1% is government provision: military and civil agencies supply conjunction warnings without charge, and every expansion of that free service removes a commercial customer who was paying for something they can now obtain at no cost.

Warnings Nobody Can Act On

The signal to noise problem defines this whole category. A large constellation operator receives roughly 4,200 conjunction warnings a year and manoeuvres in response to about 2% of them, which means the overwhelming majority of alerts are correct in a technical sense and useless in an operational one. Detecting objects is largely solved. Producing warnings precise enough to act on is not, and that gap is where commercial value sits.
TOP FIVE CONCENTRATION47%Held among commercial providers building on government sensor observations
ANNUAL WARNINGS RECEIVED4,200 alertsConjunction notices reaching a large constellation operator each year
MANOEUVRE ACTION RATE2%Warnings that actually result in an avoidance manoeuvre being executed
TRACKED OBJECT THRESHOLD10 centimetresSmallest size reliably catalogued by most operational tracking networks
CUSTODY GAP DURATION31 hoursTypical interval before a newly detected object is observed again
GOVERNMENT DATA SHARE64%Observations originating from publicly funded sensor networks worldwide
Custody matters more than detection and gets discussed considerably less. Spotting an object once is comparatively easy; knowing it is the same object thirty-one hours later, after it has moved through an uncertain orbit, is the difficult part and the reason catalogues degrade. Providers who can maintain custody across observation gaps produce usable predictions. Those who cannot are supplying detections that somebody else has to turn into information.
The commercial structure is unusual, because roughly 64% of observations come from publicly funded sensor networks that also supply warnings free of charge. Commercial providers therefore compete against a free alternative funded by the same governments regulating their customers. That constrains pricing permanently, and it explains why growth sits in precision, timeliness and custody rather than in raw detection anybody can obtain.
"Operators tell you they get thousands of warnings and act on almost none. Then somebody sells them a service that produces more warnings. The useful product is fewer alerts that are actually right, and almost nobody is measured on that because a missed conjunction ends careers and a false alarm does not."
Director, Space Systems and Orbital Operations Practice · MMA Technology Practice · September 2026

Market Trends

Warning Volume Outruns Operator Evaluation Capacity

A large constellation operator now receives roughly 4,200 conjunction warnings a year and manoeuvres in response to around 2% of them, which means that almost every single alert consumes analysis time and then produces no action whatsoever. Warning volume rises geometrically with the tracked object population rather than proportionally, so the problem worsens considerably faster than the fleets themselves grow. Conjunction assessment and collision avoidance services grow at 20.1% against 13.4% for the market, because operators are now buying precision to reduce alert volume rather than buying any additional detection capability.
Market Impact: Screening covers 4,200 events yearly

Custody Rather Than Detection Determines Data Value

Detecting an object once is comparatively straightforward, while knowing that it is the same object roughly 31 hours later, after it has moved through an uncertain orbit, is genuinely difficult and is exactly where catalogues begin to degrade. Providers who maintain custody across observation gaps produce predictions precise enough for an operator to act on with real confidence. Those who cannot are selling detections that somebody else must then convert into usable information, which is a considerably weaker commercial position than most of them appear to realise at all. Geography rather than sensitivity determines who can do it.
Market Impact: India compounds at 21.8% yearly

Market Opportunities and Growth Drivers

Licensing Regimes Convert Prudence Into Obligation

Regulatory authorities across several jurisdictions now attach collision avoidance and disposal conditions directly to operating licences, which turns what was previously a prudent voluntary practice into a firm condition of being allowed to fly anything at all. Operators must now demonstrate conjunction screening and manoeuvre capability rather than merely claiming to perform it somewhere internally. That moves the purchase out of an engineering budget and into a compliance one, and compliance functions evaluate on demonstrable evidence rather than on any technical elegance in the underlying approach that has been taken.
Market Impact: Some 64% comes from governments

Sovereign Programmes Fund Independent Tracking Capability

India compounds at 21.8% annually, faster than any other market measured anywhere, on national space situational awareness programmes funded precisely because depending on another country's catalogue for safety-critical warnings is politically uncomfortable. Gulf states and several Southeast Asian governments are now building broadly comparable capability for very much the same underlying political reason. Geographic position matters considerably here. Those buyers procure sensor networks, catalogue software and analysis capability all together as sovereign capability, rather than purchasing warnings as any kind of ongoing service from a commercial provider. Sovereign procurement runs on entirely different terms.
Market Impact: Action rates stay near 2%

Market Restraints and Challenges

Government Networks Supply Warnings Without Any Charge

Roughly 64% of all observations originate from publicly funded sensor networks, and military and civil agencies then supply conjunction warnings to operators free of charge as a straightforward public good. The root cause is that orbital safety is treated as shared infrastructure rather than as any kind of market. Commercially this caps pricing permanently and removes customers whenever free provision expands further. Mitigation runs through precision beyond what free services offer, through custody maintained across observation gaps, and through the regulatory evidence that government agencies simply do not package for licensing purposes.
Market Impact: Only 2% produce a manoeuvre

False Alarm Costs Fall Entirely On The Operator

A missed conjunction ends careers while a false alarm merely wastes some analysis time and a little propellant, so every incentive in the whole system pushes providers toward issuing more warnings rather than fewer and better ones. The root cause is asymmetric consequence rather than any technical limitation anybody faces. Commercially this rewards exactly the wrong behaviour and keeps the action rate stuck near 2%. Mitigation runs through providers genuinely willing to be measured on precision, and through operators willing to contract for reduced alert volume rather than for any increase in coverage.
Market Impact: Gaps typically run 31 hours
4 additional market trends, 3 additional growth drivers, and 2 additional restraints and challenges are covered in the full report. Contact sales@marketmindsadvisory.com to access the complete intelligence.

Segment CAGR and Growth Architecture

Segmentation follows service class, since each carries different economics, different exposure to free government provision and a different buyer inside the operator or agency. Six classes cover the market, spanning conjunction services, ground sensor networks, space-based observation, catalogue software, space weather monitoring and regulatory compliance tooling. Customer type and procurement route are separate dimensions handled elsewhere.
space-situational-awareness-market-market-share-analysis-1789996557882

Conjunction Assessment And Collision Avoidance Services

Conjunction assessment and collision avoidance services grow at 20.1%, half again the market rate of 13.4%, because warning volume is rising far faster than any operator's capacity to evaluate it properly. A large constellation operator receives roughly 4,200 warnings each year and manoeuvres in response to around 2% of them, so almost every single alert consumes analysis time and then produces nothing at all. What operators actually want to buy is fewer alerts that are more often right, which requires custody across observation gaps rather than additional detection capability. That is a genuinely harder product to build, and a considerably easier one to price properly against the free government alternative.
CAGR 20.1%

Regulatory Compliance And Licensing Support Tools

Regulatory compliance and licensing support tools compound at 16.4% as authorities across several different jurisdictions attach collision avoidance and disposal conditions directly to operating licences. Operators must now demonstrate screening and manoeuvre capability rather than merely asserting that they perform it, and government warning services are not packaged to produce the evidence a licensing authority requires. That gap is precisely where commercial providers can charge, because the free alternative does not solve the compliance problem at all, even though it addresses the underlying safety one perfectly adequately for most operational purposes. Licensing evidence has quietly become its own distinct product requirement in this category. Authorities specify evidence formats differently by jurisdiction.
CAGR 16.4%
Full segment breakdown across 6 segments available in the complete report.

Regional Architecture and Country Demand Map

North America holds 38% of category spending, above the usual band ceiling, because the largest constellation operators, the most extensive sensor networks and much the most demanding licensing regime all sit there together. Western Europe follows at 21% on agency programmes and continuing regulatory development.

North America

North America takes 38% of category spending, above the 32% band ceiling, because the largest constellation operators, the most extensive sensor networks and much the most demanding licensing regime all sit within the same single jurisdiction. Government agencies supply warnings free of charge while simultaneously regulating the operators receiving them, which constrains commercial pricing while creating the compliance demand that commercial providers actually serve. LeoLabs, ExoAnalytic Solutions, COMSPOC, Slingshot Aerospace and Kayhan Space all operate from here. Growth at 13.8% sits above the global rate on constellation deployment and on tightening licence conditions together. Free provision and paid compliance demand coexist rather awkwardly across this market. Constellation deployment from here continues at pace regardless of the pricing pressure.
Share: 38% | CAGR: 13.8% (2026 to 2036)

Western Europe

Western Europe accounts for 21% of category spending, where agency programmes and an actively developing regulatory framework together drive most of the demand right across the region. European space agencies operate sensor networks and fund catalogue capability, partly to reduce dependence on observations supplied by another jurisdiction entirely. National licensing regimes are tightening collision avoidance conditions on operators at different speeds across member states. Commercial operators headquartered here face compliance obligations that vary by country. Growth at 11.8% is comfortably the slowest of any region measured, on established agency capability and comparatively fewer new constellations being deployed from the region. Commercial constellation activity from the region remains comparatively modest by comparison.
Share: 21% | CAGR: 11.8% (2026 to 2036)
Regional intelligence for 5 additional markets available in the complete report: East Asia, South Asia and Pacific, Latin America, Middle East and Africa, Eastern Europe. Contact sales@marketmindsadvisory.com.
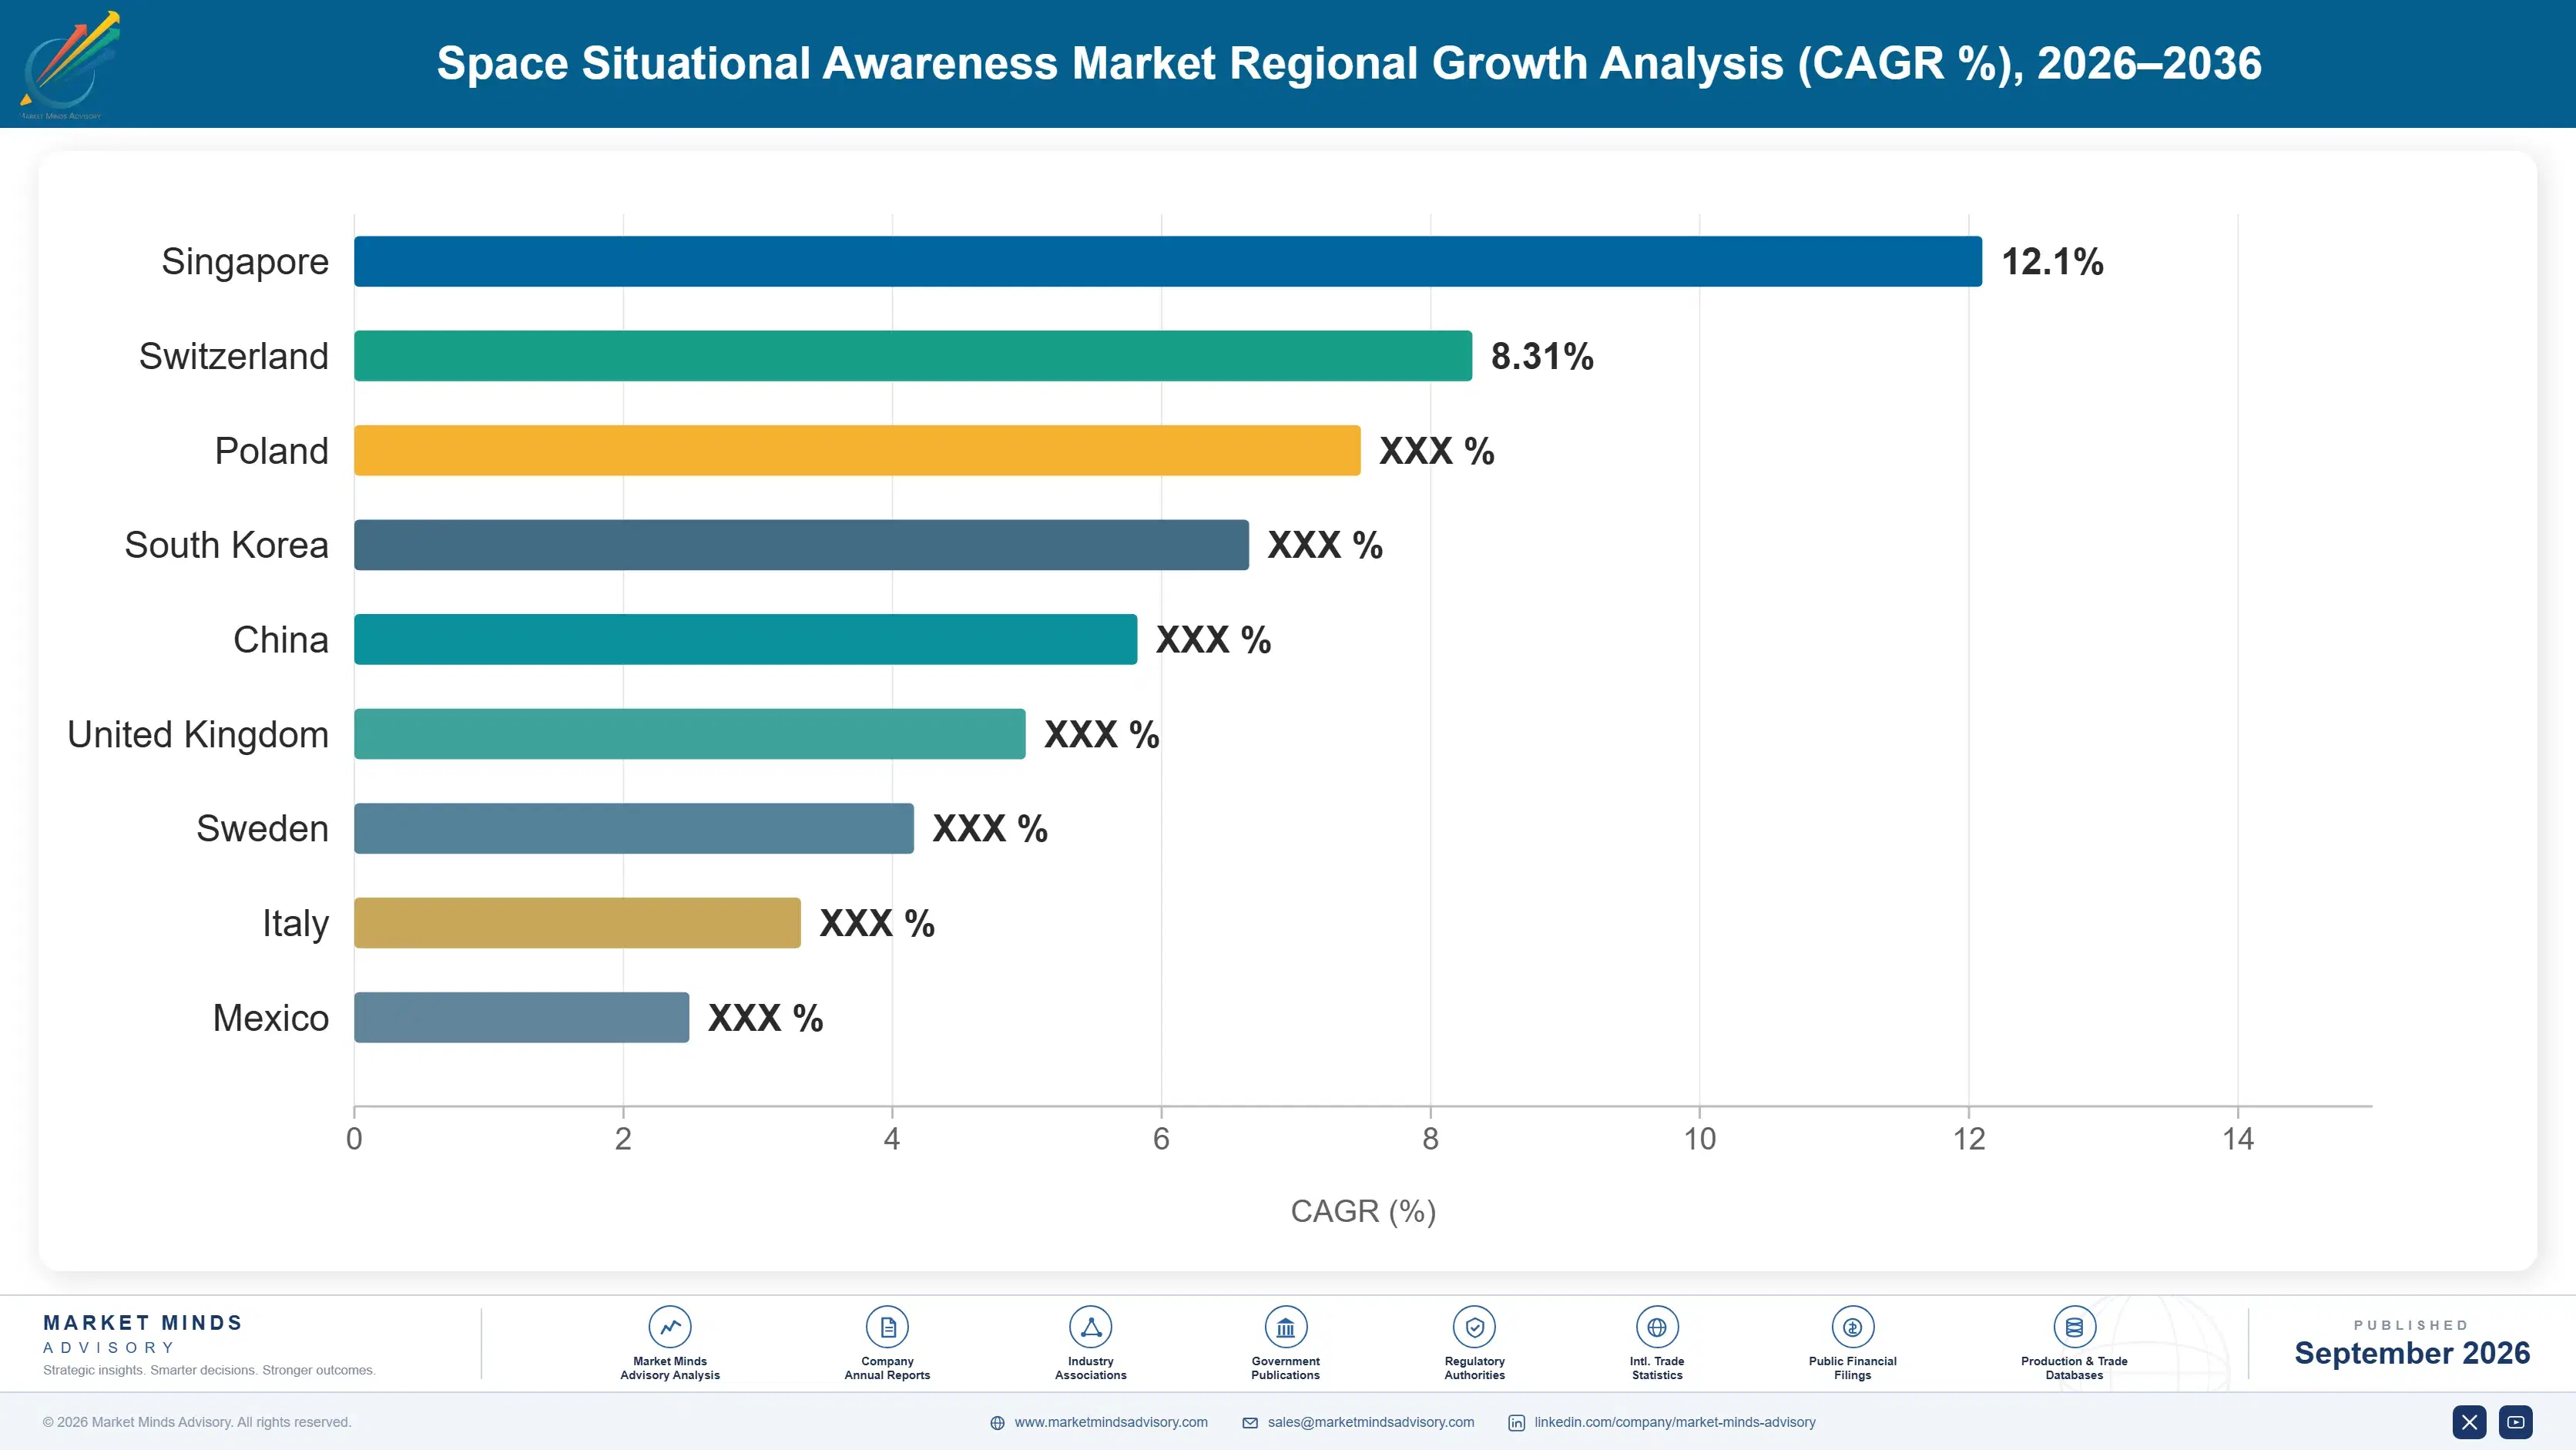
space-situational-awareness-market-country-cagr-analysis-1789996558416

Where This Capability Gets Paid For

Governments supply conjunction warnings entirely free of charge while simultaneously regulating the very operators who receive them, almost every single alert produces no action at all, and sovereign buyers now want capability they own outright rather than any subscription service. The four levers below follow those conditions rather than any argument about sensor sensitivity.

Sell Fewer Alerts Rather Than More Coverage

A large operator receives roughly 4,200 warnings a year and manoeuvres on around 2% of them, so each additional alert consumes analysis time and then delivers absolutely nothing whatsoever. What those operators actually want is fewer warnings that turn out to be right more often, which requires custody across observation gaps rather than any additional detection capability anybody can buy. Providers selling wider coverage are simply adding to a problem the customer already has. Those selling genuine precision instead are solving it, and they are able to charge properly for doing so.
Market Impact: Only 2% of warnings drive any actual manoeuvre

Package Evidence Government Services Do Not Provide

Roughly 64% of all observations come from publicly funded networks that also supply conjunction warnings without any charge, which caps commercial pricing on anything those services already deliver adequately well. Licensing authorities now require demonstrable screening evidence that government warning services are simply not packaged to produce for anybody at all, however good the underlying data is. That gap is where commercial providers can charge properly, because the free alternative addresses the safety question while leaving the compliance question entirely unanswered for an operator who must satisfy a regulator. That is a durable position.
Market Impact: Government supplies fully 64% of all the observations

Sell Capability To Sovereign Programmes Directly

India compounds at 21.8% annually and Gulf programmes are funding tracking capability as sovereign infrastructure rather than purchasing warnings as any kind of ongoing service. Those buyers procure sensors, catalogue software and analysis capability all together, and they specify against national capability targets rather than any commercial payback calculation whatsoever. Providers who can only offer a subscription service end up as subcontractors in those procurements rather than as principals in them, which is a materially weaker position and one that gets steadily harder to change. Sovereign procurements are also considerably larger than any subscription contract.
Market Impact: India alone compounds at fully 21.8% each year

Hold Geographic Positions Northern Networks Lack

Southern hemisphere and equatorial observation sites cover orbital arcs that European and North American networks handle rather poorly, and custody across a 31 hour gap depends entirely on having somewhere suitable to observe from. Australian, Chilean and South African sites therefore carry commercial value considerably exceeding their own regional demand. Providers holding those geographic positions can maintain custody in exactly the places where their competitors lose it entirely. Building comparable coverage means negotiating hosting arrangements across several jurisdictions, which takes years to establish properly. Hosting negotiations frequently take longer than building the sensors themselves.
Market Impact: Custody gaps typically run a full 31 hours

Who Controls the Margin Pool

Five suppliers hold 47% of tracking, data and service revenue, and government sensor networks supply roughly 64% of the underlying observations that most commercial providers build upon. LeoLabs, ExoAnalytic Solutions, COMSPOC, Slingshot Aerospace and Kayhan Space lead. All participants here are assessed consistently on space situational awareness tracking, data and service revenue rather than on any broader space systems business that they also operate.
Competition runs on custody and precision rather than on raw detection capability, since observations are widely available and government services already supply perfectly adequate warnings free of charge to anybody. The second dimension is geographic sensor coverage, because maintaining custody across a 31 hour observation gap depends entirely on having somewhere suitable to observe from, and southern hemisphere positions are genuinely scarce commercially.

Pressure comes from government agencies steadily expanding their free warning provision, which removes paying customers altogether rather than merely competing for them on price. Rankings shift wherever sovereign programmes are funding capability directly rather than where commercial operators simply buy services, particularly across India, the Gulf and Southeast Asia at present. Sovereign capability procurement is now the largest single contract type in this category.
space-situational-awareness-market-company-positioning-matrix-1789996558943

Competitive Moat and Risk Dimensions

LEOLABS

Moat: Independent Radar Network Coverage

LeoLabs operates its own radar sites across geographies chosen specifically for orbital coverage rather than for convenience, which lets it maintain custody across gaps where providers depending on government observations lose track of objects entirely. Building comparable coverage means siting and operating radars across several jurisdictions, which takes years and considerable capital before producing any revenue at all.
LEOLABS

Risk: Free Provision Price Ceiling

Government agencies supply conjunction warnings without charge and roughly 64% of observations come from publicly funded networks, which caps what any commercial provider can charge for something similar. Network capital costs are substantial and permanent regardless of pricing pressure. Independence from government data helps considerably less when the government product is free.
SLINGSHOT AEROSPACE

Moat: Operator Workflow Integration

Slingshot Aerospace built around how operators actually work with warnings rather than around observation collection, which addresses the part of the problem operators complain about rather than the part providers find technically interesting. Integration into operational decision-making reaches a buyer that pure data providers never speak to properly, and switching costs accumulate through workflow rather than through data.
SLINGSHOT AEROSPACE

Risk: Observation Source Dependency

Workflow capability depends on observations from sources the company does not control, including government networks supplying roughly 64% of everything available. Custody across a 31 hour gap ultimately requires sensors rather than software. Excellent interpretation of data somebody else collected remains vulnerable to changes in what that data contains or costs.

Players Tracked

Prominent Players

LeoLabs
ExoAnalytic Solutions
COMSPOC
Slingshot Aerospace
Kayhan Space

Other Key Players

Northrop Grumman
L3Harris Technologies
Lockheed Martin
Thales Alenia Space
Airbus Defence and Space
GMV Innovating Solutions
Deimos Space
Vaisala
Spire Global
NuView
Neuraspace
OKAPI Orbits
Digantara
SpaceNav
Numerica Corporation

Recent Developments

MARCH 2025

Licensing Authorities Tighten Collision Avoidance Conditions

Regulatory authorities across several jurisdictions attached firmer collision avoidance and disposal conditions to satellite operating licences, a regulatory development rather than any corporate transaction. Operators must demonstrate screening and manoeuvre capability rather than merely asserting it, and government warning services are not packaged to produce what a licensing authority needs.
Signal: Free warnings answer the safety question while leaving the compliance question entirely unanswered for the operator.
SEPTEMBER 2024

Indian Programmes Fund Sovereign Tracking Capability

Indian national programmes funded sovereign space situational awareness sensors and catalogue capability, a capability development rather than any commercial transaction. Depending on another country's catalogue for safety-critical warnings is politically uncomfortable, which is why these buyers procure sensors, software and analysis together rather than purchasing any service.
Signal: Sovereign buyers want capability that they own outright rather than warnings which somebody else supplies them.
JULY 2025

Southern Hemisphere Sensor Coverage Expands Under Hosting Deals

Commercial tracking providers expanded southern hemisphere sensor coverage through hosting arrangements in Australia, Chile and South Africa, capacity development rather than any acquisition. Custody across a roughly 31 hour observation gap depends entirely on having somewhere to observe from, and northern networks cover several orbital arcs rather poorly.
Signal: Custody depends entirely on geography, and southern hemisphere observation positions remain genuinely scarce commercially even today.

What Watching Orbit Costs

Sensor hardware and site construction absorb roughly 38% of provider cost for organisations operating their own networks, with radar considerably more expensive than optical. Site operations, power and staffing take around 21% and recur permanently. Orbit determination and catalogue software development absorbs about 22%, and data processing infrastructure takes most of the remaining balance across continuous observation volumes.
Radar component and construction costs rose materially through 2023 and 2024 as defence demand competed for the same specialist suppliers and skilled installation labour. Northrop Grumman Annual Report 2024 and L3Harris Technologies Annual Report 2024 both record component and labour cost pressure across space and sensor programmes. Providers with existing site infrastructure avoided that exposure entirely, while those expanding networks absorbed it directly against pricing already agreed.

The competitive disadvantage mechanism is geographic siting rather than hardware price. A provider needing coverage over a southern hemisphere arc must negotiate hosting, permits and operations in a jurisdiction where it has no presence, which takes years regardless of available capital. Exposure concentrates among providers expanding coverage rather than operating established networks, and it is why geographic position rather than sensor sensitivity determines competitive standing.
space-situational-awareness-market-cost-volatility-analysis-1789996559141

Negotiate Hosting Arrangements Ahead Of Requirement

Sensor siting absorbs roughly 38% of cost and geographic position rather than sensitivity determines custody capability across a 31 hour gap. Hosting arrangements in southern hemisphere jurisdictions take years to negotiate through permits and local partnerships. Providers beginning that process only when coverage gaps become commercially painful find the timeline runs far longer than any customer will wait for them.

Blend Government Observations Into Owned Coverage

Government networks supply roughly 64% of available observations without charge, and refusing to use them on independence grounds discards free data that improves catalogue quality. Blending owned sensor data with public observations reduces how much coverage a provider must fund itself. The discipline is knowing which observations to trust for which purpose rather than treating all sources as equivalent.

Amortise Catalogue Software Across Service Lines

Orbit determination and catalogue software absorbs around 22% of cost and must be developed regardless of how many customers use it. Applying the same core across conjunction services, compliance tooling and sovereign capability sales spreads that expense considerably further. Providers building separate software for each service line carry engineering cost that never improves as revenue grows.

Portfolio Architecture for Margin Defence

Margin architecture separates on whether government provision already covers the function adequately. Space weather monitoring earns least, since agencies supply comprehensive forecasting freely and commercial differentiation is genuinely hard. Ground sensor network operation sits above on capital intensity. Conjunction services, compliance tooling and sovereign capability sales earn most, because each addresses something free government provision leaves unanswered for the customer.
The volume versus premium tension runs between service subscriptions and sovereign capability sales. Subscriptions are priced against a free alternative and constrained accordingly. Sovereign programmes buy sensors, software and analysis together against national capability targets with no payback calculation applied. Providers organised entirely around subscription services cannot participate in those procurements as principals, which is where the largest contracts increasingly sit.

High-value pools concentrate in compliance evidence and in sovereign capability supply, and neither is reached through observation quality alone. Compliance tooling requires understanding what licensing authorities actually accept as evidence. Sovereign supply requires being able to deliver sensors, software and training together. Both are deliberate commercial positions rather than any natural extension of a tracking service, which is precisely why relatively few providers hold either of them.

Volume / Commodity-Adjacent

Space weather monitoring and basic catalogue data supply, where government agencies already provide comprehensive equivalents without charge and commercial differentiation is genuinely difficult. The twelve point spread separates providers with existing infrastructure from those still funding network construction against constrained pricing.
Gross Margin: 22% to 34%

Premium / Certified

Ground sensor network operation and orbit determination software, where geographic coverage and catalogue accuracy determine selection alongside price. The fourteen point spread tracks how much owned coverage each provider holds against how much it depends on freely available government observations.
Gross Margin: 38% to 52%

Sustainability / Regulatory / Next-Generation

Conjunction assessment services, regulatory compliance tooling and sovereign capability supply, each addressing something free government provision leaves entirely unanswered for the customer. The eighteen point spread reflects custody capability and compliance understanding, both of which take years to build.
Gross Margin: 56% to 74%
space-situational-awareness-market-portfolio-architecture-1789996559634

High-value Sub-segments and Strategic Watch-out

Conjunction Assessment And Collision Avoidance Services

Grows at 20.1% because warning volume keeps rising far faster than any operator's capacity to evaluate what actually arrives. The eighteen point spread here reflects underlying custody capability. Operators receive roughly 4,200 alerts each year and manoeuvre on around 2% of them. Precision now sells better than coverage.
Gross Margin: 56% to 74%

Regulatory Compliance And Licensing Support Tools

Grows at 16.4% as licensing authorities now require demonstrable screening evidence rather than accepting simple assertions from the operators. The eighteen point spread here reflects compliance understanding depth. Government warning services are not packaged to produce what regulators actually want to see. Evidence formats vary by jurisdiction.
Gross Margin: 56% to 74%

Ground-Based Radar And Optical Tracking Networks

Grows at 12.6% as providers extend their coverage into geographic positions that northern hemisphere networks handle rather poorly indeed. The fourteen point spread here reflects owned sensor coverage share. Custody across a 31 hour gap depends entirely on having somewhere suitable to observe from. Southern sites remain scarce.
Gross Margin: 38% to 52%

Space Weather Monitoring And Forecasting

Grows at only 7.9%, slowest of the six service classes, because agencies already supply comprehensive forecasting without any charge to anybody who asks for it. The twelve point spread here reflects existing sensor infrastructure. Commercial differentiation here is genuinely difficult and few providers have managed it.
Gross Margin: 22% to 34%

Why Providers Stay Selected

The annuity here is operational integration rather than any contract term. A conjunction service feeds directly into how an operator decides whether to manoeuvre, and changing provider means revalidating that decision process against a different data source with different uncertainty characteristics. Operators making safety-critical decisions do not undertake that lightly. Selections consequently persist across years, and providers underestimate how much that protects them.
Depth varies sharply by service class. A conjunction service embedded in manoeuvre decision workflow is deeply fixed, since the operator has calibrated its thresholds against that provider's uncertainty estimates. Compliance tooling holding licensing evidence history is similarly locked. Raw catalogue data is entirely substitutable, particularly against a free government alternative that most operators can access anyway without paying anybody.

The buyer has moved from engineering toward regulatory affairs and, for sovereign programmes, toward national capability offices. A flight dynamics engineer evaluated data accuracy. A regulatory function evaluates whether evidence satisfies a licensing authority. A national programme office evaluates whether capability can be owned rather than rented. Providers selling accuracy to engineers are addressing one of three buyers who now decide these things.
space-situational-awareness-market-end-use-penetration-index-1789996560143

What Decides Provider Selection

These are among the four positions where our research anticipates prominent divergence between winners and laggards over the coming forecast period. Each is grounded in the demand model, the regulatory perimeter, and the announced capacity pipeline.
01 / ALERT PRECISION POSITIONING

Sell Fewer Warnings, Not Wider Coverage

A large constellation operator receives roughly 4,200 conjunction warnings each year and manoeuvres in response to around 2% of them, so every additional alert consumes analysis time while delivering essentially nothing useful. What those operators genuinely want to buy is fewer warnings that turn out to be right more often, which requires custody across observation gaps rather than additional detection capability. Providers selling wider coverage instead are simply adding to a problem that the customer already has far too much of.
02 / COMPLIANCE EVIDENCE SUPPLY

Charge For What Free Services Cannot Produce

Roughly 64% of all observations come from publicly funded networks that also supply conjunction warnings without any charge at all, which caps commercial pricing on anything those services already deliver adequately well. Licensing authorities now require demonstrable screening evidence that government warning services are simply not packaged to produce for anybody at all. That gap is precisely where commercial providers are able to charge properly, because the free alternative answers only the safety question and leaves the compliance one entirely unaddressed.
03 / SOVEREIGN CAPABILITY SUPPLY

Sell Ownership To National Programmes

India compounds at 21.8% annually and Gulf programmes are funding tracking capability as sovereign infrastructure rather than purchasing warnings as any kind of subscription service from anybody. Those buyers procure sensors, catalogue software and analysis capability all together, specifying against national capability targets rather than against any kind of commercial payback calculation. Providers who can only offer a subscription service end up as subcontractors in those procurements rather than as principals, which is a materially weaker commercial position to hold.
04 / GEOGRAPHIC COVERAGE POSITION

Own The Arcs Northern Networks Miss

Southern hemisphere and equatorial observation sites cover the orbital arcs that European and North American networks handle rather poorly, and custody across a roughly 31 hour observation gap depends entirely on having somewhere suitable to observe from. Australian, Chilean and South African sites therefore carry commercial value considerably exceeding anything their own regional demand would justify. Building comparable coverage means negotiating hosting arrangements across several different jurisdictions, which takes years to establish properly regardless of how much capital is available.

Engagement Snapshot From the Field

A live engagement with an industry participant carrying material or product regulatory and market exposure ahead of a defining policy shift, showing how our research translates into a defensible multi-year portfolio strategy.
MARKET MINDS ADVISORY · CLIENT ENGAGEMENT SUMMARY
Space Situational Awareness Producer Strategic Portfolio Review and Transition Roadmap 2026·Investment Scenario on Space Situational Awareness Exposure Evaluation 2025-26
CLIENT PROFILE
A constellation operator running several hundred satellites in low earth orbit, receiving conjunction warnings from a government service and from two separate commercial providers simultaneously. Flight dynamics staff were spending steadily increasing time assessing alerts, and a licence renewal had raised questions about screening evidence that the operator could not answer satisfactorily from its existing arrangements.
STRATEGIC CHALLENGE
Engineering wanted a third data source on the reasonable view that more observations improve accuracy. Operations objected that alert volume was already unmanageable. Nobody had measured how many warnings each source generated, how many led to manoeuvres, or whether any of the sources produced the evidence the licensing authority had actually asked for.
MMA APPROACH
MMA measured alert volume, false alarm rate and manoeuvre outcomes by data source across twelve months of operations. We assessed whether each provider's output satisfied the licensing evidence requirement, and modelled what custody coverage each source contributed across the southern hemisphere gap. Work drew on 47 expert interviews conducted in Q4 2025 with operators, providers and regulatory specialists.
KEY FINDINGS
  1. The three existing sources produced heavily overlapping warnings, and adding a fourth would have increased alert volume by roughly 3 in 10 without improving decisions.
  2. Manoeuvre-relevant warnings came disproportionately from the single provider holding southern hemisphere sensor coverage, which nobody inside the operator had previously identified at all.
  3. Neither commercial provider packaged output in a form the licensing authority accepted as screening evidence without substantial manual work (client-reported, unverified by MMA).
  4. Flight dynamics staff time spent assessing alerts had roughly doubled across two years, while actual manoeuvre counts had barely moved at all.
CLIENT PROFILE
A constellation operator running several hundred satellites in low earth orbit, receiving conjunction warnings from a government service and from two separate commercial providers simultaneously. Flight dynamics staff were spending steadily increasing time assessing alerts, and a licence renewal had raised questions about screening evidence that the operator could not answer satisfactorily from its existing arrangements.
STRATEGIC CHALLENGE
Engineering wanted a third data source on the reasonable view that more observations improve accuracy. Operations objected that alert volume was already unmanageable. Nobody had measured how many warnings each source generated, how many led to manoeuvres, or whether any of the sources produced the evidence the licensing authority had actually asked for.
MMA APPROACH
MMA measured alert volume, false alarm rate and manoeuvre outcomes by data source across twelve months of operations. We assessed whether each provider's output satisfied the licensing evidence requirement, and modelled what custody coverage each source contributed across the southern hemisphere gap. Work drew on 47 expert interviews conducted in Q4 2025 with operators, providers and regulatory specialists.
KEY FINDINGS
  1. The three existing sources produced heavily overlapping warnings, and adding a fourth would have increased alert volume by roughly 3 in 10 without improving decisions.
  2. Manoeuvre-relevant warnings came disproportionately from the single provider holding southern hemisphere sensor coverage, which nobody inside the operator had previously identified at all.
  3. Neither commercial provider packaged output in a form the licensing authority accepted as screening evidence without substantial manual work (client-reported, unverified by MMA).
  4. Flight dynamics staff time spent assessing alerts had roughly doubled across two years, while actual manoeuvre counts had barely moved at all.
RECOMMENDED STRATEGY
Phase 1: Phase one: drop one overlapping commercial source rather than adding a fourth, since the additional alerts improved no decisions at all. Phase 2: Phase two: contract specifically for the southern hemisphere custody coverage that produced disproportionately more manoeuvre-relevant warnings than any other source. Phase 3: Phase three: require compliance evidence packaging within the contract renewal, rather than reconstructing it manually at every single licence review.
OUTCOME
The operator reduced from three sources to two and contracted specifically for southern hemisphere custody coverage (client-reported, unverified by MMA). Alert volume fell substantially while manoeuvre-relevant warnings held steady. Compliance evidence is now supplied as part of the service rather than assembled manually, which is the change that outlasted the engagement.

Frequently Asked Questions

Foundational context covering the market sizes, CAGR, scope, country, region and competition that inform every finding below. This section is provided to cover basics and most often pre-purchase conversations, answered from the MMA Primary Research Dataset.

What is the current size of the Space Situational Awareness Market?

Global value reaches USD 2.4 billion in 2026, measured as tracking, data and service revenue across six service classes. The 2025 base is USD 2.1 billion.

How large will the Space Situational Awareness Market be by 2036?

The market reaches USD 8.5 billion by 2036, an increase of USD 6.1 billion across the forecast period. That represents 3.54 times expansion from the 2026 base.

What is the CAGR for the Space Situational Awareness Market 2026 to 2036?

The base case runs at 13.4% annually, with a bull case at 14.7% if a significant fragmentation event occurs and a bear case at 12.1% if government agencies expand free warning provision further.

Which segment is growing fastest?

Conjunction assessment and collision avoidance services grow at 20.1%, half again the market rate of 13.4%. Warning volume rises far faster than any operator's capacity to evaluate it.

Who are the major companies in the Space Situational Awareness Market?

LeoLabs, ExoAnalytic Solutions, COMSPOC, Slingshot Aerospace and Kayhan Space lead on tracking and service revenue, holding 47%. Northrop Grumman, GMV and Neuraspace hold smaller positions.

Which country is growing fastest?

India leads at 21.8%, on sovereign tracking capability funded because depending on another country's catalogue for safety-critical warnings is politically uncomfortable. Saudi Arabia and Japan follow.

Report Segmentation Architecture

The full report scope spans multiple orthogonal segmentation dimensions, with cross-tabulated demand data provided for each dimension pair. Coverage extends further to regional breakdowns, trend trajectories, and the competitive detail needed to support segment-level decision-making.

By Service Class

  • Conjunction Assessment And Collision Avoidance Services
  • Regulatory Compliance And Licensing Support Tools
  • Ground-Based Radar And Optical Tracking Networks
  • Catalogue Maintenance And Orbit Determination Software
  • Space-Based Observation And Inspection Systems
  • Space Weather Monitoring And Forecasting

By End-Use Industry

  • Commercial Constellation Operators
  • Defence And Military Space Commands
  • Civil Space Agencies
  • Satellite Insurance And Underwriting
  • Launch Providers And Range Operations
  • Academic And Research Institutions

By Commercial Dimension

  • Subscription Service Contracts
  • Sovereign Capability Procurement
  • Defence Programme Supply
  • Government Data Sharing Arrangements
  • Sensor Hosting And Partnership Agreements
  • Insurance And Risk Assessment Services

By Region

  • North America
  • Western Europe
  • East Asia
  • South Asia and Pacific
  • Latin America
  • Middle East and Africa
  • Eastern Europe

Scope, Methodology, and Coverage

Every figure in this report is reproducible from documented input assumptions. The scope below maps the historical period, the forecast horizon, the segmentation dimensions, and the countries covered, alongside the underlying primary and qualitative methodology.
Historical Period
2020 to 2025
Forecast Period
2026 to 2036
Base Year
2025 (USD billions; MMA Primary Research Dataset, September 2026)
Market Definition
This report covers space situational awareness capability by service class: conjunction assessment and collision avoidance services, ground-based radar and optical tracking networks, space-based observation and inspection systems, catalogue maintenance and orbit determination software, space weather monitoring and forecasting, and regulatory compliance and licensing support tools. It excludes launch services, satellite manufacturing, satellite communications, active debris removal hardware, and general astronomical observation.
Quantitative Units
USD millions, tracking, data and service revenue basis; catalogued objects; conjunction warnings issued annually; manoeuvre action rate as a percentage; tracked object size threshold in centimetres; custody gap duration in hours.
Segmentation Dimensions
Service class; end-use customer type; commercial procurement route; geography across seven regions.
Regions Covered
North America, Western Europe, East Asia, South Asia and Pacific, Latin America, Middle East and Africa, Eastern Europe
Countries Covered
United States, Canada, United Kingdom, Germany, France, Italy, Spain, Poland, Romania, China, Japan, South Korea, India, Australia, New Zealand, Brazil, Chile, Saudi Arabia, United Arab Emirates, South Africa.
Key Companies Profiled
LeoLabs, ExoAnalytic Solutions, COMSPOC, Slingshot Aerospace, Kayhan Space, Northrop Grumman, L3Harris Technologies, Lockheed Martin, Thales Alenia Space, Airbus Defence and Space, GMV Innovating Solutions, Spire Global, Neuraspace, OKAPI Orbits, Digantara.
Quantitative Methodology
Primary survey, n=3,800 respondents, Q4 2025, six countries; demand-side model with trade association cross-validation
Qualitative Methodology
47 expert interviews, Q4 2025; applied to validate demand model assumptions, identify emerging dynamics, and assess competitive positioning
Report Format
PDF and XLSX data workbook (Word format preview document)
Publisher
Market Minds Advisory
Report Code
MMA-2026-TEC-831
Published
September 2026
Contact
sales@marketmindsadvisory.com | www.marketmindsadvisory.com

Purchase the full Space Situational Awareness Market Report (2026 to 2036).

This report sizes the global space situational awareness market from 2026 to 2036 across six service classes, six customer types and seven regions. It explains why operators receiving roughly 4,200 conjunction warnings a year manoeuvre on only around 2% of them, and why that signal to noise problem rather than detection capability defines the commercial opportunity. Free government provision supplying 64% of observations is analysed as the permanent constraint on pricing, alongside compliance evidence as the gap it leaves. Custody across a 31 hour observation gap is examined as the real competitive variable. Regional analysis explains why North America holds 38% of spending.
Six service classes sized through to 2036
Warning volume quantified against actual manoeuvre rates
Free government provision assessed as a pricing constraint
Twenty named providers assessed on tracking revenue
Four revenue levers with quantified commercial impact
Anonymised constellation operator conjunction engagement documented in full

Built For The People Who Decide

From boardroom strategy to bench-side execution, this report is read cover-to-cover by leaders shaping the next decade of their industry, turning demand scenarios, market dynamics and valuation benchmarks into decisions.
CXOs/ Presidents/ VPs/ Managers
M&A and Corporate Development
Strategy Teams and R&D Heads
Procurement and Product Directors
Regulatory and Compliance Leaders
Investor Relations and Equity Analysts