Market Minds Advisory
Space Debris Reusable Orbital Vehicles Market

Space Debris Reusable Orbital Vehicles Market: Space Debris Reusable Orbital Vehicles Market. Reusable Spacecraft for Active Debris Removal and Life Extension

Orbital congestion forces satellite operators toward reusable debris removal spacecraft as collision avoidance maneuvers become routine rather than exceptional events across increasingly crowded low earth orbit altitude shells today worldwide

Lead Analyst

Published

September 2026

Make Smarter Decisions with Customized Research Insights

Request a free sample report and evaluate market opportunities, growth trends, and competitive dynamics relevant to your business needs.

2025 MARKET VALUE$0.7BMarket Size 2025
2036 FORECAST VALUE$3.9BBase Case , 2026 to 2036
CAGR 2026 TO 203616.5 %Bull 17.8% / Bear 15.2%
INCREMENTAL OPPORTUNITY$3.0BNet 10- year value creation
EXPANSION MULTIPLE4.61x2036 value over 2026 base
Strategic Levers
M&A Pipeline
Regional Outlook
Country Rankings
Competitive Intelligence
Segmental Deep-dive
Call-Us : 91 93563 13602

Executive Snapshot and Market Trajectory.

Reusable orbital debris removal vehicles are shifting from experimental demonstration missions to commercially contracted services, as satellite operators face mounting collision risk in increasingly congested low earth orbit shells across most commercial constellations this year. Buyers now specify reusability before mission award. Vendor selection now weighs prior mission history.
Active debris removal and satellite life extension servicing are converging fastest, as operators seek vehicles capable of multiple missions rather than single-use disposal spacecraft. North America commands the largest regional share, reflecting concentrated defense contracting and dense commercial space company presence supporting orbital servicing vehicle development domestically. Facility operators increasingly qualify multiple servicing vendors simultaneously to reduce single-source supply risk during this rapid capacity buildout phase. Certification depth separates platforms competing for government contracts.
Competitive intensity is rising as defense contractors expand into commercial servicing while venture-backed startups build proprietary capture and docking technology. Insurance underwriters are creating a parallel demand channel, as they increasingly require documented debris mitigation planning from satellite operators before extending orbital liability coverage. Rankings could shift meaningfully as certification requirements tighten across major national space agency procurement programs over the coming years. Buyers notice quickly.
Market Definition
This report covers reusable spacecraft designed for active debris removal, satellite life extension, and orbital servicing missions capable of multiple operational cycles. It excludes single-use disposal vehicles, ground-based debris tracking systems, and launch vehicles not designed for on-orbit servicing operations.
Base Year Value
$0.7B in 2025 (MMA Primary Research Dataset, September 2026)
Forecast Period
2026 to 2036, eleven discrete annual values
CAGR
16.5% base case. Bull 17.8%. Bear 15.2%.
Fastest Growth Segment
Active Debris Removal Robotic Capture Systems: 22.0% CAGR
Fastest Growth Country
India: 19.0% CAGR
Fastest Growth Region
South Asia and Pacific: 18.5% CAGR
Largest Region
North America: 32% of 2025 global value
Market Leaders
Astroscale, ClearSpace, Northrop Grumman, Redwire, and Starfish Space lead the market. Source: MMA Analysis, July 2026.
Primary Survey
n=3,800 procurement and R&D decision-makers, Q4 2025, six countries
Methodology
Demand-side build-up, cross-validated against public data, 47 expert interviews

Space Debris Reusable Orbital Vehicles Market Forecast Scenarios

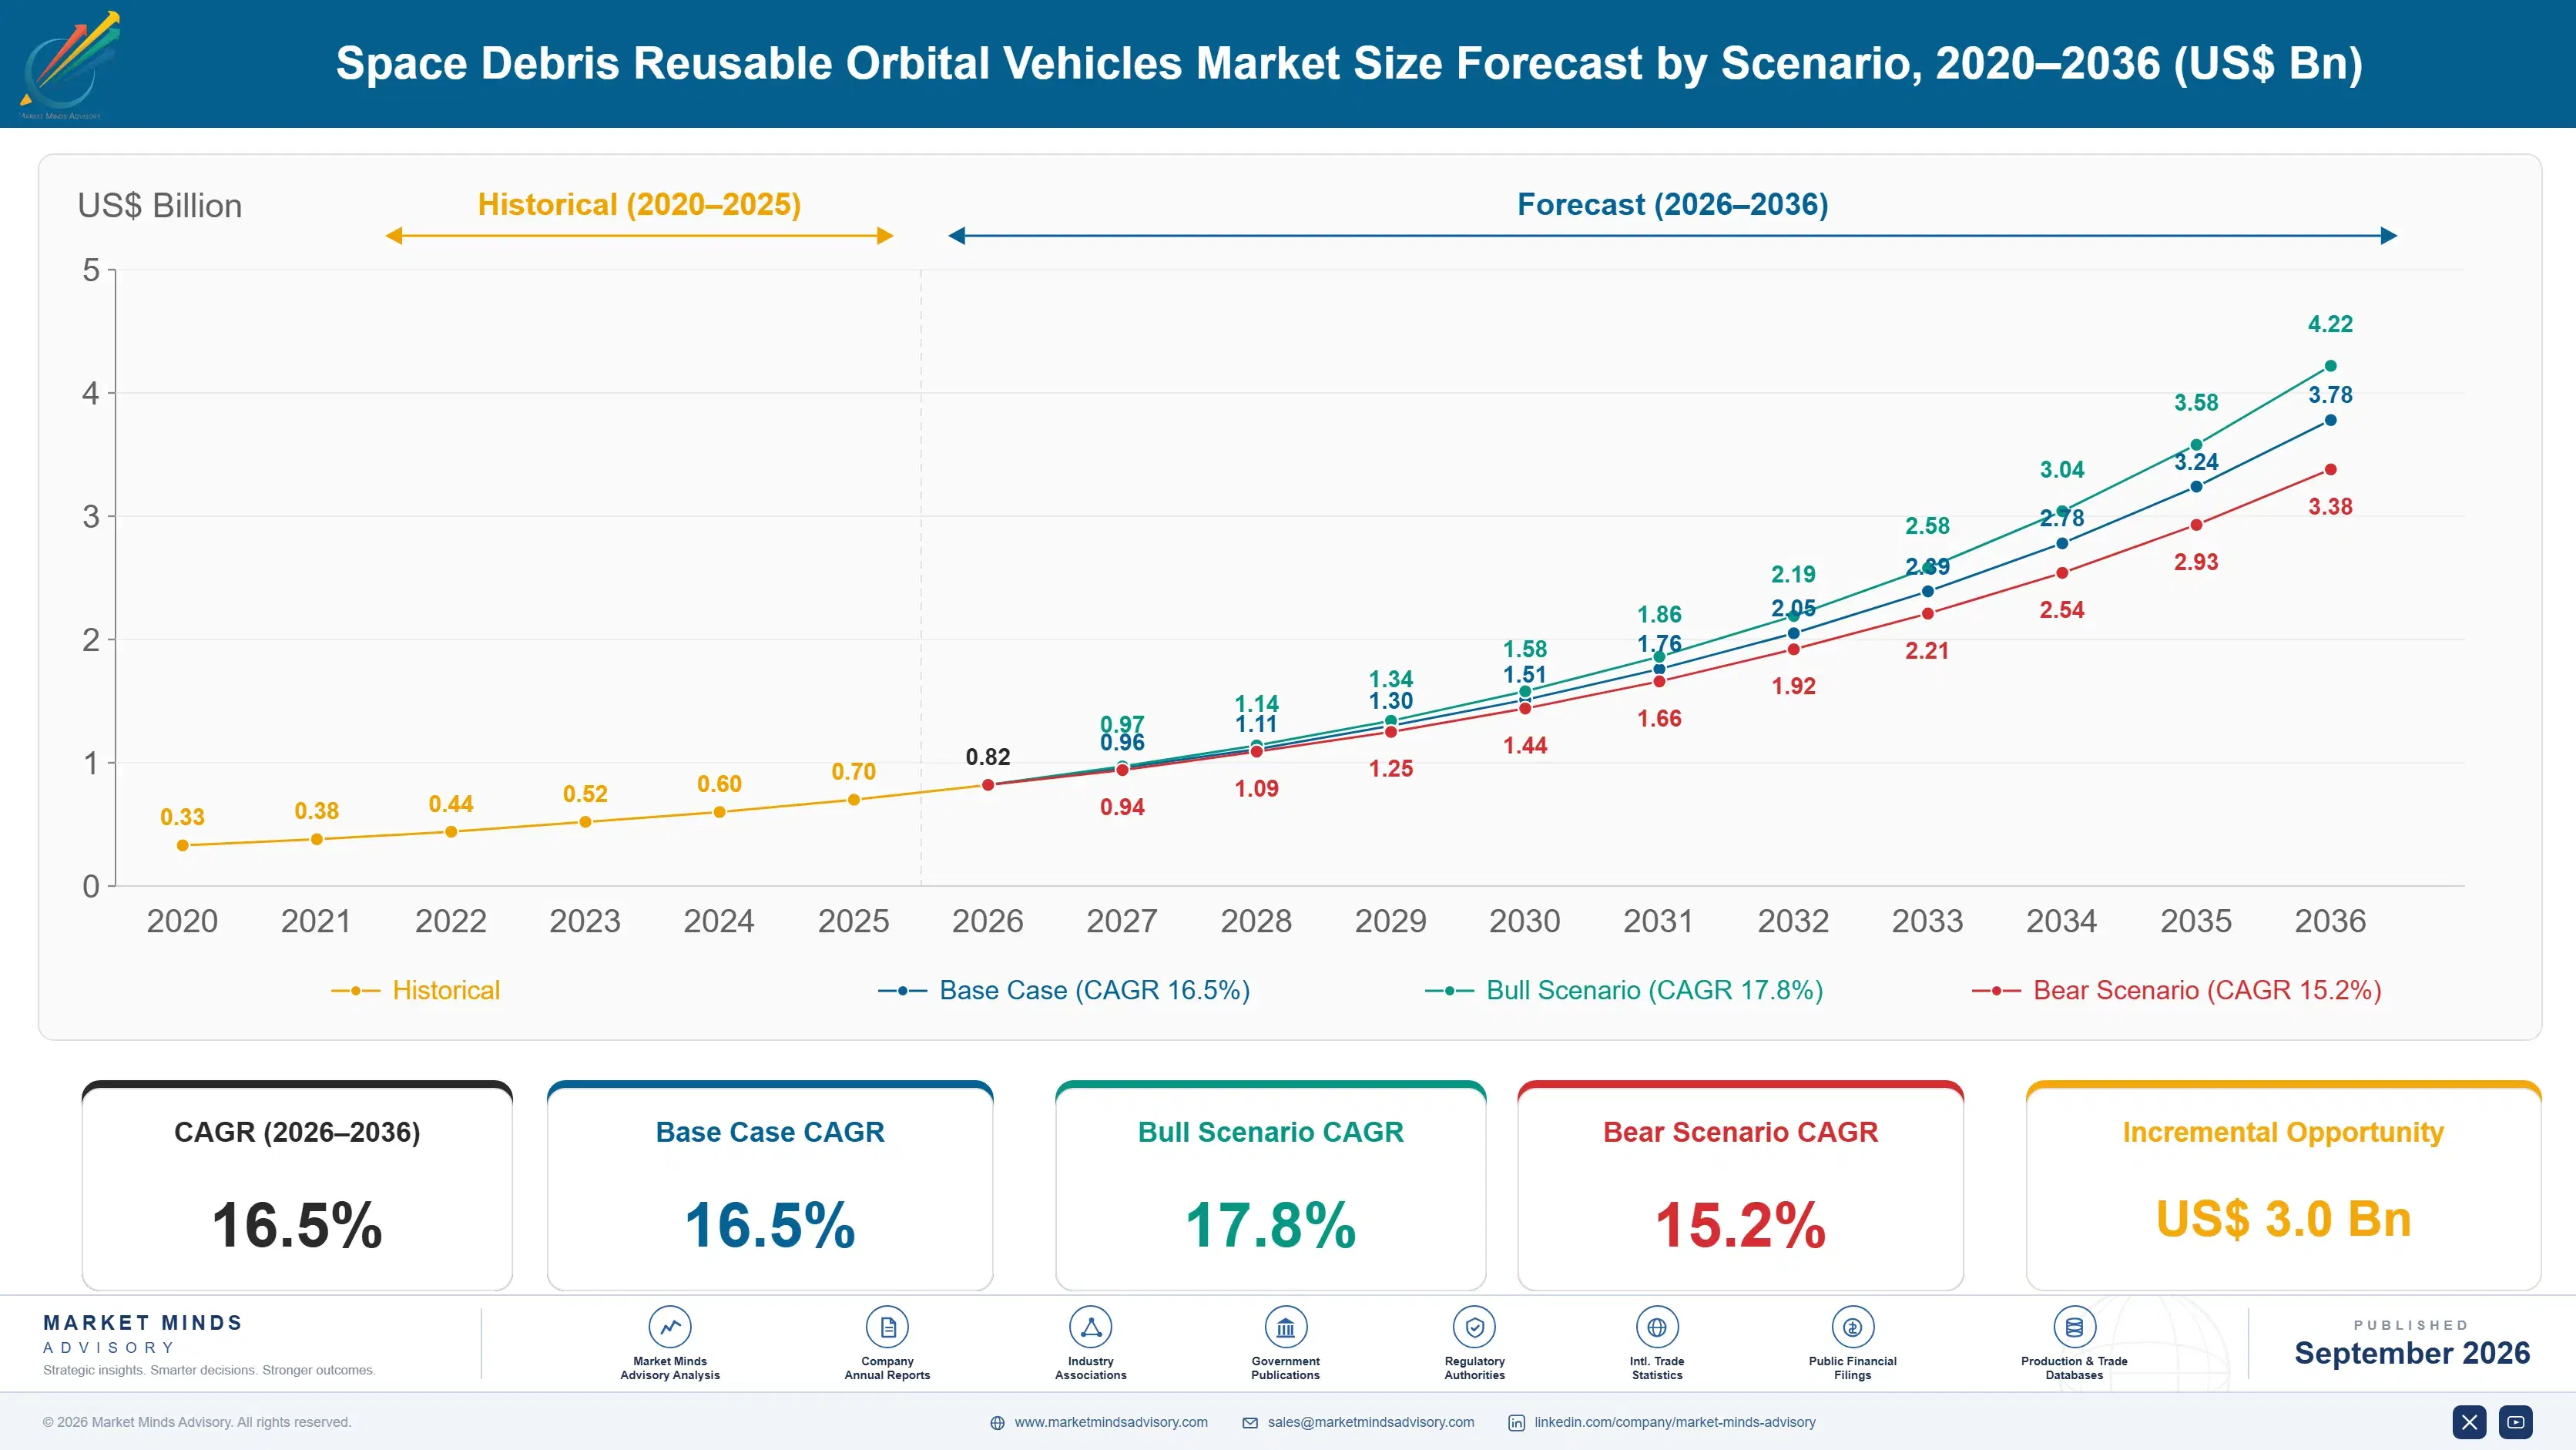
space-debris-reusable-orbital-vehicles-market-size-forecast-scenario-1788428056085
Between 2020 and 2025 the market grew at a historical rate of roughly 15.0 percent annually, accelerating sharply as demonstration missions proved capture and docking technology viable ahead of commercial contract awards. Early growth concentrated among government-funded demonstration programs before broadening into commercially contracted removal service agreements nationwide. Investor and government agency confidence built steadily throughout this transition period.
The base case assumes continued government agency debris removal contract awards, expanding commercial satellite operator life extension demand, and steady vehicle reusability engineering maturity across multiple mission cycles. Three commercial mechanisms sustain the base forecast: national space agency debris mitigation policy mandates, expanding insurance requirements for documented removal planning, and rising satellite constellation density driving collision risk urgency. These three mechanisms together anchor confidence in the base scenario across the ten-year forecast window ahead.
The bull case rests on accelerated national space agency contract awards as orbital congestion reaches critical density thresholds requiring urgent remediation. The bear case centers on satellite manufacturers building end-of-life deorbit capability directly into spacecraft design, compressing the addressable third-party removal service opportunity for independent vehicle operators. Rankings could shift meaningfully if either scenario dominates the market's trajectory over the coming several years.

Reusability Becomes Contract Award Requirement

Purchase decisions increasingly hinge on documented mission success rate rather than theoretical capability claims alone, as space agencies and operators weigh the cost of failed capture against contract price during vendor evaluation processes. This calculation increasingly appears explicitly within enterprise vendor selection scorecards used by procurement and mission engineering teams together. Documented mission history now weighs as heavily as theoretical capability in most contract evaluations across the sector.
MARKET CONCENTRATIONCR5 58%Top vendors hold a highly concentrated combined market position
AVERAGE VEHICLE COST$45MReflects blended pricing across standard reusable servicing vehicle configurations
DEMONSTRATED MISSION SUCCESS RATE71%Share of active removal missions achieving documented successful capture
MULTI-MISSION REUSE RATE34%Share of vehicles completing more than one servicing mission cycle
DEVELOPMENT COST SHARE42%Engineering and testing share of total vehicle program cost structure
CONTRACT RENEWAL RATE63%Share of servicing contracts renewed following initial mission completion
Vendors offering standardized docking interfaces compatible across multiple satellite manufacturers are pressuring proprietary capture designs to open interoperability, since operators increasingly favor vehicles that avoid platform lock-in during multi-vendor fleet servicing. Operators report faster fleet integration timelines when using standardized docking hardware rather than proprietary interfaces requiring dedicated adapter development. This compatibility advantage matters most for operators facing tight constellation replenishment deadlines.
Vehicle development and testing costs remain a meaningful share of total program cost, particularly for vendors pursuing novel capture mechanisms. Vendors with proven demonstrated flight heritage increasingly outcompete smaller specialists facing longer qualification timelines. This dynamic increasingly separates vendors with proven flight heritage from smaller specialists still refining their qualification methodology across new mission types. Flight heritage increasingly determines vendor shortlist inclusion at larger agency accounts.
"A single-use debris removal spacecraft is a contradiction buyers no longer accept. If the vehicle can't fly a second mission, the whole economic case for the service collapses immediately."
Practice Lead, Space Systems and Orbital Infrastructure Research · MMA Orbital Debris Removal and Satellite Servicing Spacecraft Practice · September 2026

Market Trends

Standardized Docking Interfaces Reduce Vendor Lock-In

Industry bodies and satellite manufacturers are formalizing standardized docking plate and grappling interface specifications, reducing the vendor lock-in that historically discouraged operators from qualifying multiple servicing vehicle suppliers for the same constellation fleet. This standardization is opening competitive bidding to smaller specialists previously excluded by proprietary capture mechanism requirements tied to single incumbent vendors. Facilities adopting standardized docking interfaces report qualifying roughly 38 percent more vendor options than facilities still locked into proprietary designs from a single supplier. Vendors moving early into standardized interfaces are securing multi-manufacturer qualification competitors will struggle to replicate quickly across constellation programs.
Market Impact: 41 percent faster contracting under mandate

Insurance Underwriters Formalize Debris Mitigation Requirements

Orbital liability insurers are incorporating documented debris mitigation planning and removal contract evidence directly into coverage terms, creating a demand channel that pressures satellite operators to adopt removal service contracts regardless of their own internal regulatory urgency assessment. This insurer-driven pressure is proving more immediate for many operators than direct regulatory enforcement timelines alone, since losing coverage carries faster commercial consequences than a regulatory audit finding. Operators lacking documented mitigation plans report facing premium increases of roughly 26 percent on relevant orbital liability coverage lines. Vendors ignoring this shift risk missing a meaningfully profitable segment of near-term insurer-driven contract demand.
Market Impact: 33 percent lower total fleet cost

Market Opportunities and Growth Drivers

National Space Agency Mandates Drive Contract Awards

National space agencies across major spacefaring nations are formalizing active debris removal requirements covering their own defunct satellites and rocket bodies, creating a hard compliance mandate that forces contract awards regardless of internal budget prioritization cycles that might otherwise delay procurement decisions. This regulatory mandate gives servicing vendors more predictable demand visibility than contracts tied to discretionary orbital cleanup initiatives lacking clear funding urgency. Agencies citing mandated removal requirements as their primary contract driver report awarding servicing contracts roughly 41 percent faster than agencies contracting voluntarily. Larger agencies are locking in multi-year servicing contracts to secure current vehicle pricing.
Market Impact: 24 percent achieve multiple successful captures

Constellation Density Sustains Life Extension Demand

Rapid growth in large satellite constellations continues driving demand for life extension servicing that delays costly replacement launches, sustaining steady demand for reusable orbital vehicles independent of broader government debris removal budget cycles that historically constrained the market. This constellation-driven demand gives vendors more predictable order visibility than contracts tied purely to government agency procurement calendars and appropriation timing. Operators citing life extension economics as their primary driver report roughly 33 percent lower total fleet replacement cost than operators relying solely on new launches. Vendors serving this segment increasingly bundle refueling capability alongside core servicing functionality.
Market Impact: 19 percent of startups secure funding

Market Restraints and Challenges

Capture Mechanism Reliability Limits Mission Confidence

Debris capture and docking mechanisms still face genuine technical reliability challenges when engaging tumbling or uncooperative target objects, a root cause tied to the fundamental complexity of robotic manipulation in microgravity conditions that ground-based testing cannot fully replicate. The commercial impact shows up as insurance underwriters and mission planners applying conservative risk premiums to unproven capture technologies regardless of vendor marketing claims. Some vendors are addressing this through incremental demonstration missions building documented flight heritage, though only roughly 24 percent of vendors have achieved multiple successful capture missions meaningfully. Speed matters here.
Market Impact: 38 percent more vendor options qualified

High Development Cost Limits Smaller Vendor Entry

Reusable orbital servicing vehicle development requires substantial upfront capital investment spanning propulsion, capture mechanism, and life support systems engineering, a friction point rooted in the genuinely high fixed cost of aerospace-grade hardware development that smaller vendors struggle to finance without government backing. The commercial impact shows up as market concentration among well-capitalized defense contractors and venture-backed startups able to absorb multi-year development timelines. Some smaller vendors are addressing this through government development grants, though only roughly 19 percent of eligible startups have secured meaningful funding. This gap is expected to narrow gradually as funding programs expand over time.
Market Impact: 26 percent premium increase for non-compliance
3 additional market trends, 4 additional growth drivers, and 3 additional restraints and challenges are covered in the full report. Contact sales@marketmindsadvisory.com to access the complete intelligence.

Segment CAGR and Growth Architecture

Six product categories serve orbital servicing needs, spanning active debris removal robotic systems, satellite life extension vehicles, refueling and repair spacecraft, standardized docking interfaces, ground-based mission control services, and salvage and recycling vehicles, each addressing distinct mission types. North America and East Asia lead uptake, while smaller operators globally trail on adoption pace given capital cost constraints.
Section default visual

Active Debris Removal Robotic Capture Systems

Active debris removal capture systems are growing fastest as national space agencies mandate defunct satellite and rocket body removal covering their own orbital assets ahead of accumulating collision risk in increasingly congested altitude shells. These vehicles require sophisticated robotic manipulation and tumble-matching capability distinct from cooperative servicing missions where target satellites assist their own capture. Vendors with proven successful capture mission history command meaningfully higher pricing than generalist spacecraft manufacturers lacking comparable specialized robotic capture certification. Leading vendors are extending capture capability into new debris size categories as competitors race to capture agency relationships early. Pricing power favors early movers who established mission credibility before competitors caught up to comparable standards.
CAGR 22.0%

Satellite Life Extension Servicing Vehicles

Life extension servicing vehicles address the replacement cost problem that historically forced operators toward premature satellite disposal once propellant depleted despite otherwise functional spacecraft systems remaining operational. Adoption is accelerating fastest among large constellation operators prioritizing fleet economics over marginal servicing vehicle cost, since extending satellite operational life delays far more expensive replacement launch expenditure. Vendors offering proven docking and refueling capability command premium pricing over unproven designs given the genuine economic value these systems deliver. Operators lacking dedicated fleet planning staff increasingly favor these systems to reduce the complexity of replacement launch scheduling entirely. Vendors ignoring this shift risk losing accounts to faster-moving competitors entirely across major constellation procurement programs.
CAGR 18.5%
Full segment breakdown across 6 segments available in the complete report.

Regional Architecture and Country Demand Map

Regional demand tracks national space agency budgets and commercial launch cadence closely, with North America leading given concentrated defense contracting while East Asia follows through expanding national space programs. Insurance requirements and constellation density compound regional demand differently depending on local space agency budgets and program maturity.

North America

United States space agencies and commercial operators concentrate the bulk of regional demand, driven by both defense contracting for national security debris removal and commercial constellation life extension servicing across major aerospace hubs nationwide. Canada contributes modestly through space agency partnerships aligned with United States mission requirements. Facility operators here favor demonstrated flight heritage over unproven designs, reflecting genuine mission risk priorities following capture missions that accelerated procurement timelines across major agencies this cycle. Insurance and liability incentives compound this trend further. Retrofit spending is expected to remain elevated through the middle years of the forecast window. Insurance underwriting incentives compound this trend further across most facility investment decisions. Momentum builds.
Share: 32% | CAGR: 17.0% (2026 to 2036)

East Asia

Japan's space agency and expanding commercial servicing sector drive meaningful regional demand, with domestic vehicle manufacturers increasingly competing directly against established global vendors on both capability and pricing across major aerospace hubs nationwide. China and South Korea contribute through expanding national space programs where debris removal tolerances run tighter than typical satellite deployment applications elsewhere. Regional vendors are scaling development capacity aggressively to meet both domestic and export demand from agencies based across the broader region. Export-oriented vehicle manufacturing capacity continues expanding to serve global agency demand. Domestic certification bodies are streamlining approval processes to match program scale demands. Talent pipelines here remain deep given decades of aerospace manufacturing experience.
Share: 25% | CAGR: 17.5% (2026 to 2036)
Regional intelligence for 5 additional markets available in the complete report: Western Europe, South Asia and Pacific, Latin America, Middle East and Africa, Eastern Europe. Contact sales@marketmindsadvisory.com.
space-debris-reusable-orbital-vehicles-market-market-share-analysis-1788428056625

Capturing Margin Beyond Standard Vehicle Sales

Vendors face compressing standard vehicle pricing as competition intensifies, but multi-mission servicing contracts, insurance advisory services, and standardized interface licensing offer genuine margin expansion paths worth pursuing deliberately across the forecast period ahead. Vendors that treat these as core product lines rather than bolt-on services will capture disproportionate share of category profit pools ahead.

Expand Multi-Mission Servicing Contract Portfolios Broadly

Vendors offering multi-mission servicing contracts capture recurring revenue over single-mission engagements while addressing the fleet economics problem that increasingly drives operator purchasing decisions across expanding constellation programs. This positions vendors to compete directly for operators prioritizing lifetime fleet cost over marginal single-mission pricing. Early movers building dedicated multi-mission fleet management capability report attach rates of roughly 41 percent among new contracts, meaningfully above vendors lacking comparable service offerings. Larger enterprise accounts increasingly demand this multi-mission capability explicitly during vendor selection processes. Speed to market matters here. Adoption grows. Now. Truly.
Market Impact: Captures the 41 percent multi-mission opportunity right now

Build Insurance Advisory Service Capability Now

As orbital liability insurers formalize debris mitigation requirements within coverage terms, vendors offering documentation and compliance advisory services capture a service revenue stream distinct from vehicle sales, positioning themselves as trusted risk management advisors during coverage renewal cycles. This lever directly addresses a genuinely urgent commercial pressure, where operators lacking documented mitigation plans face premium increases of roughly 26 percent on relevant coverage. Vendors moving early on advisory development win disproportionate share of this urgent demand. Advisory services also generate qualified sales leads directly from regional insurer referral networks. Trust compounds.
Market Impact: Addresses the 26 percent premium increase risk now

Develop Standardized Docking Interface Licensing Now

Vendors licensing standardized docking interface technology to satellite manufacturers address the interoperability gap that currently limits multi-vendor fleet servicing across diverse constellation operators. Given that facilities adopting standardized interfaces report qualifying roughly 38 percent more vendor options, vendors building this licensing capability early capture a genuinely underserved segment before competitors close the standardization gap entirely. Licensing revenue also strengthens customer retention across multi-year platform support relationships renewed annually. Connector depth increasingly determines shortlist inclusion at larger enterprise accounts evaluating vendors. Growth continues broadly across accounts. Now indeed. Truly. Now. Truly.
Market Impact: Captures the 38 percent interoperability opportunity right now

Pursue Refueling And Life Extension Bundling

Vendors bundling refueling capability with core life extension servicing address the fleet replacement cost problem that increasingly drives constellation operator purchasing decisions across cost-conscious commercial satellite fleets. Roughly 33 percent lower total fleet replacement cost results from life extension adoption, and vendors moving early into refueling bundling secure durable relationships before larger competitors recognize the opportunity. Bundled offerings also generate qualified sales leads directly from constellation operator fleet planning teams. Bundled depth increasingly determines shortlist inclusion at larger enterprise accounts evaluating vendors. Growth continues broadly across accounts. Now truly. Now.
Market Impact: Captures the 33 percent fleet cost savings now

Who Controls the Margin Pool

The top five vendors hold roughly 58 percent combined share on a contracted mission basis, reflecting significant concentration even as Astroscale and ClearSpace maintain a clear lead over mid-tier competitors given established demonstration mission flight heritage. The gap between leader and nearest challenger has narrowed as defense contractors expand into commercial servicing through acquired capture technology. Certification depth and demonstrated flight heritage remains the primary axis separating leaders from mid-tier challengers today.
Current competitive activity centers on multi-mission capability expansion, insurance advisory development, and standardized docking licensing as vendors chase demand beyond single-vehicle sales. Vendors are also racing to build refueling capability as constellation operators increasingly prioritize fleet economics over new satellite launches. Pricing pressure on standard vehicle sales is accelerating this diversification trend across the supplier base broadly.

Satellite manufacturers integrating end-of-life deorbit capability directly into spacecraft design represent the clearest emerging pressure on independent servicing specialists, threatening to compress the standalone removal service opportunity meaningfully. Rankings could shift substantially if a major aerospace prime acquires a leading servicing specialist outright, consolidating engineering talent that currently spans multiple independent vendors. Smaller specialists lacking demonstrated flight heritage face the greatest exposure to this consolidation risk.
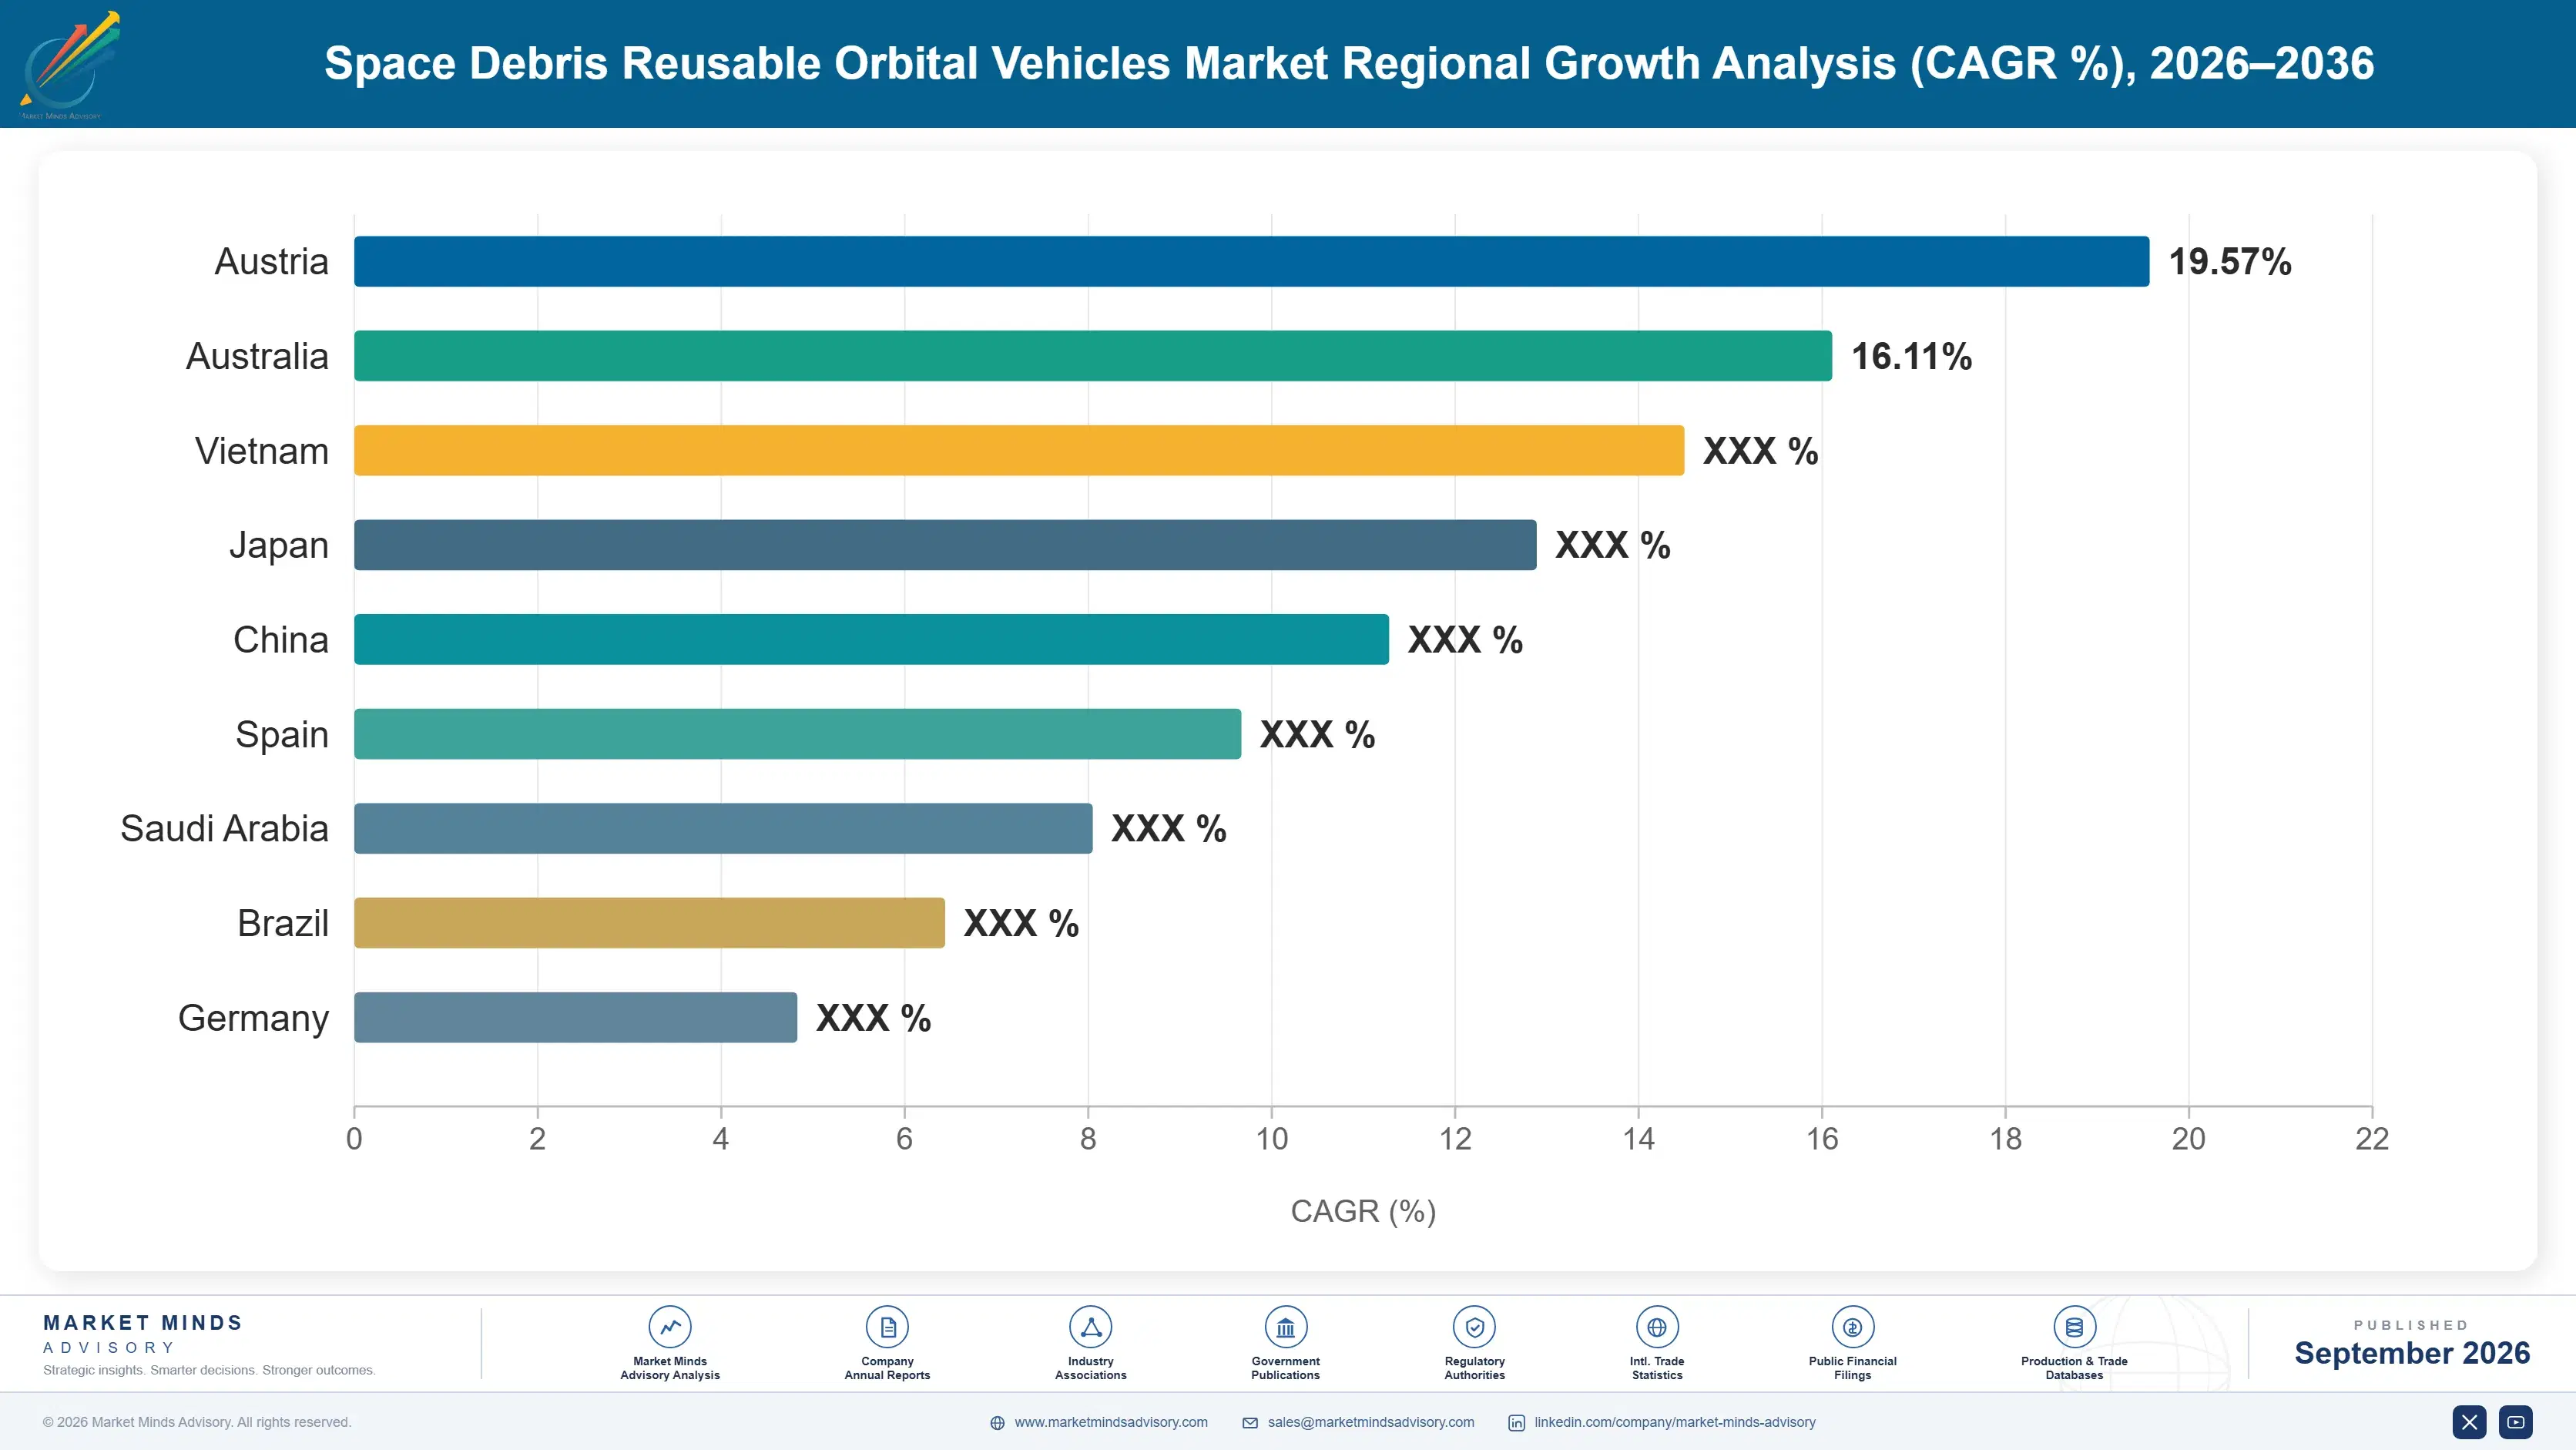
space-debris-reusable-orbital-vehicles-market-country-cagr-analysis-1788428057152

Competitive Moat and Risk Dimensions

ASTROSCALE

Moat: Deep Demonstration Mission History

Astroscale's multiple successful demonstration missions across debris removal and life extension give it flight heritage and reliability data competitors struggle to match, particularly for mission-critical government contracts requiring proven capture technology performance. This track record translates into lower mission insurance premiums that government procurement teams increasingly reference during contract qualification.
ASTROSCALE

Risk: Premium Pricing Limits Smaller Accounts

Astroscale's premium positioning and engineering-intensive qualification process limit its penetration among smaller commercial operators seeking lower-cost servicing options, ceding volume share to leaner competitors willing to compete more aggressively on price. Competitors moving faster on cost efficiency risk eroding Astroscale's positioning among price-sensitive commercial accounts.
CLEARSPACE

Moat: Strong European Space Agency Ties

ClearSpace's foundational relationship with the European Space Agency gives it institutional credibility and funding access competitors lacking comparable agency partnerships struggle to match, particularly for European debris removal mission awards requiring established relationships. This credibility translates into faster contract award timelines that competitors lacking equivalent agency track records struggle to replicate.
CLEARSPACE

Risk: Limited Commercial Market Penetration

ClearSpace's agency-focused origins limit its penetration among commercial constellation operators seeking servicing solutions, ceding this fast-growing segment to competitors with stronger commercial business development focus and sales infrastructure. Commercially focused rivals moving faster on business development could erode ClearSpace's positioning in the fastest-growing segment. Speed matters.

Players Tracked

Prominent Players

Astroscale
ClearSpace
Northrop Grumman
Redwire
Starfish Space

Other Key Players

Momentus
D-Orbit
Nanoracks
Orbit Fab
Turion Space
Privateer
OrbitGuardians
Space Machines Company
Kall Morris Inc
Exotrail
GITAI
Sierra Space
Effective Space Solutions
SENER Aeroespacial
Infinite Orbits

Recent Developments

MAY 2026

Astroscale Launches Multi-Mission Servicing Vehicle

Astroscale launched a new multi-mission servicing vehicle capable of completing multiple debris removal and life extension missions sequentially, targeting operators seeking fleet economics without sacrificing the mission reliability its platform already provides customers. The launch positions Astroscale to compete directly against single-mission entrants gaining traction on unit cost alone.
Signal: Signals Astroscale's strategic pivot toward multi-mission economics ahead of intensifying single-mission competition ahead of intensifying multi-mission competitive positioning pressure
JANUARY 2026

ClearSpace Acquires Docking Interface Startup

ClearSpace acquired a privately held docking interface startup to accelerate its own standardization roadmap, gaining proprietary interface technology and an engineering team with several years of dedicated docking mechanism development experience already built. Terms of the transaction were not disclosed publicly. Integration should complete by mid-2026.
Signal: Confirms acquisition as ClearSpace's preferred route into standardization rather than internal development rather than slower internal development timelines
SEPTEMBER 2025

Northrop Grumman Signs Contract With Satellite Operator

Northrop Grumman signed a multi-year life extension servicing contract with a major commercial satellite operator to provide fleet refueling and repositioning across multiple constellation assets launching across several regional coverage areas beginning early next year. Financial terms were not made publicly available. Northrop expects service to begin within coming quarters.
Signal: Reflects growing commercial demand for life extension servicing over new satellite replacement launches across multiple constellation coverage regions

Propulsion and Avionics Component Exposure

Propulsion systems and avionics hardware together represent roughly 34 to 40 percent of total vehicle cost of goods sold, sourced primarily from specialized aerospace component manufacturers concentrated in the United States, France, and increasingly Japan. Testing, qualification, and mission engineering labor form a secondary but meaningful cost category for reusable servicing vehicle programs specifically today.
Aerospace-grade component pricing rose meaningfully during 2024 as broader satellite manufacturing demand competed directly with servicing vehicle procurement for available specialized component manufacturing capacity, an effect documented in several major aerospace component producers' annual reports citing tight supply pressuring pricing upward. Vendors without long-term component supply agreements faced extended lead times during this period. Lead times for aerospace-grade component orders stretched several months beyond pre-2024 norms across most affected vendors.

Smaller servicing vehicle vendors lacking long-term component supply agreements face a genuine competitive disadvantage relative to larger incumbents able to secure priority allocation through volume purchasing commitments with major aerospace suppliers. This exposure varies meaningfully by geography, with vendors holding direct aerospace supplier relationships facing less disruption than smaller vendors dependent on distributor intermediaries. This gap is widening as broader satellite manufacturing demand continues absorbing available specialized component capacity.
space-debris-reusable-orbital-vehicles-market-company-positioning-matrix-1788428057348

Secure Long-Term Aerospace Component Agreements

Vendors committing to multi-year component supply agreements with aerospace manufacturer partners secure priority allocation and more predictable pricing, insulating margin from spot market volatility that disproportionately affects vendors relying on transactional purchasing relationships year to year. This approach also strengthens supplier relationships that pay dividends during future capacity crunches across the broader industry. Margin holds.

Diversify Component Sourcing Across Suppliers

Vendors qualifying multiple aerospace component suppliers across different geographies reduce single-source dependency risk, maintaining production continuity during regional capacity disruptions that would otherwise halt output for vendors reliant on a single supplier relationship. Geographic diversification also hedges against currency fluctuation and regional trade policy shifts affecting component costs directly. Hedging benefits accrue steadily over time.

Portfolio Architecture for Margin Defence

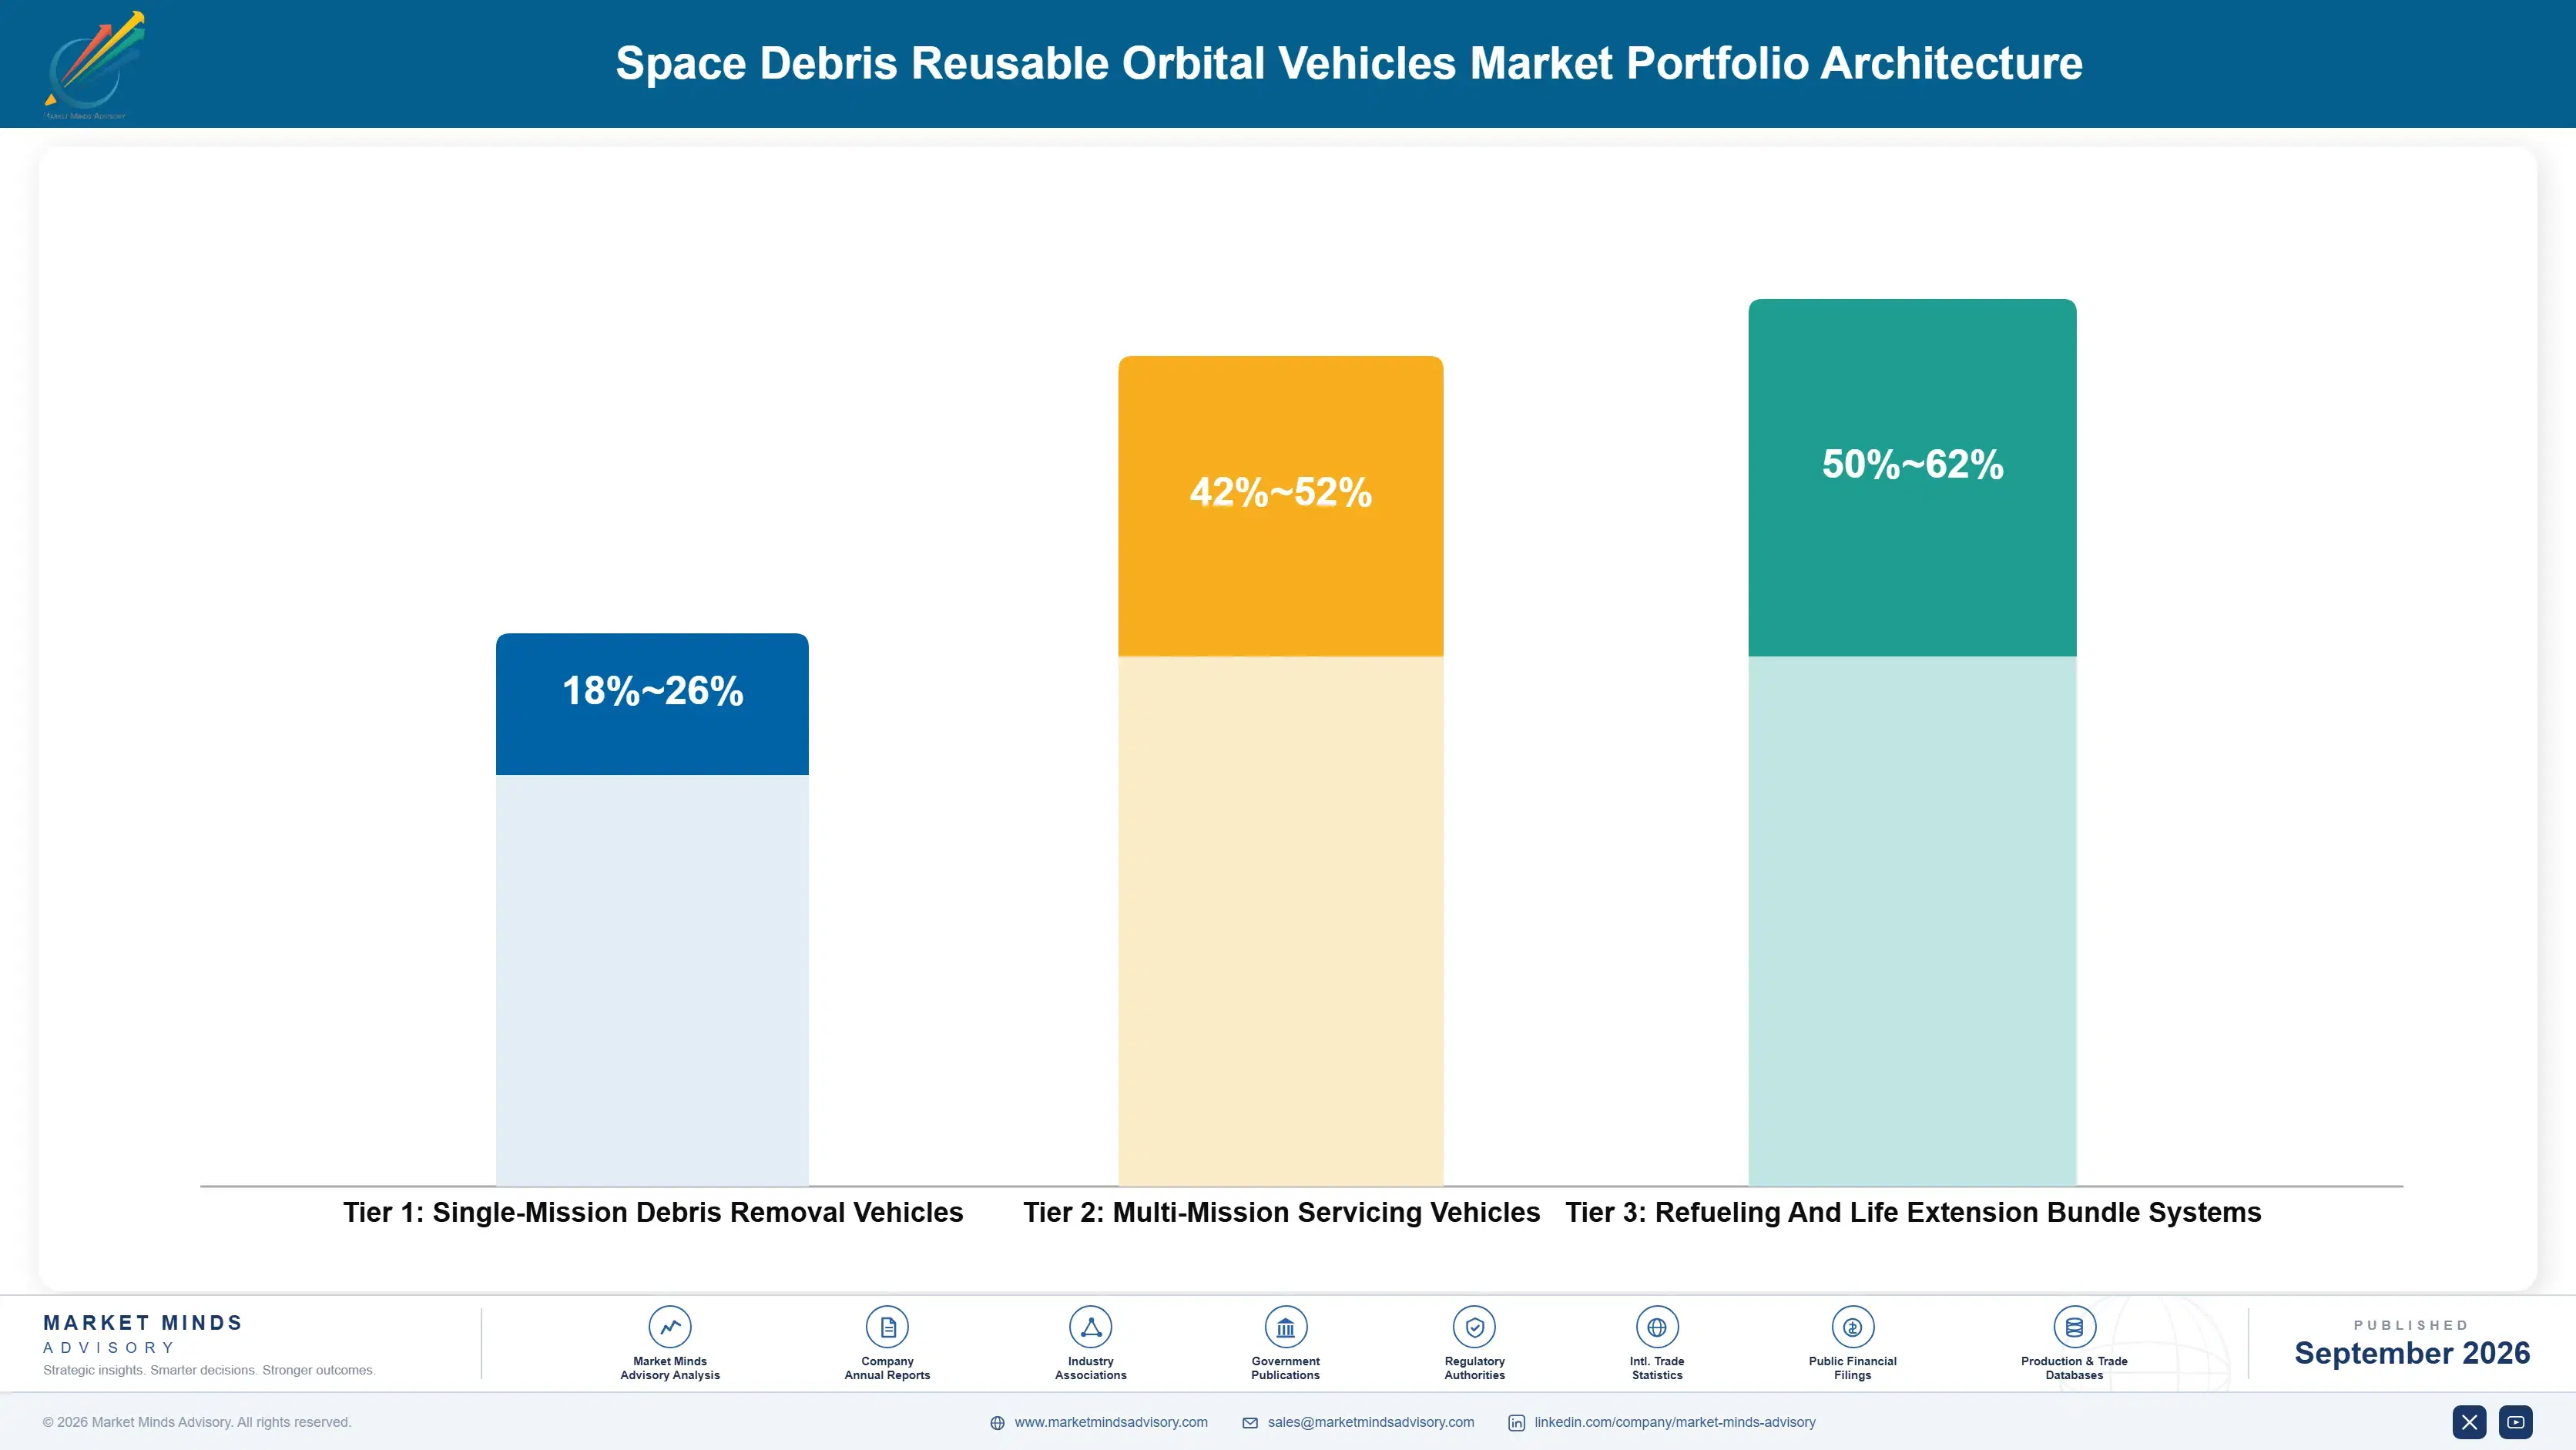
Servicing vehicle vendors operate across three margin tiers, from single-mission vehicles carrying thin economics through multi-mission platforms commanding stronger margin, up to certified life extension and refueling bundles capturing the richest gross margins. Volume tiers monetize through per-mission contract scale, while premium tiers monetize through demonstrated flight heritage and multi-mission capability bundling. Vendors misjudging tier boundaries risk cannibalizing their own premium accounts over time.
Tension persists between volume growth, which favors standardized low-cost vehicles sold at scale to price-sensitive government agencies, and premium positioning, which favors demonstrated flight heritage and refueling capability commanding materially higher willingness to pay among enterprise accounts. Vendors chasing both simultaneously risk diluting brand positioning across a fragmented buyer base with sharply different purchasing criteria. This dynamic increasingly separates category leaders from smaller, undercapitalized challengers.

High-value margin pools concentrate in multi-mission platforms and insurance advisory services, both commanding meaningfully higher gross margin than single-mission vehicles sold without additional capability bundling. Vendors building durable flight heritage and advisory relationships capture disproportionate margin relative to their vehicle count across the broader competitive landscape. Vendors ignoring this shift risk ceding the most profitable accounts to faster-moving competitors. Enterprise accounts increasingly demand this bundling explicitly during vendor evaluation.

Single-Mission Debris Removal Vehicles

Standardized single-mission removal vehicles sold at scale to government agencies prioritizing baseline compliance capability over advanced reusability, carrying thin unit economics but broad market reach across cost-sensitive procurement programs. Replacement of this tier by multi-mission platforms is accelerating across most new agency procurement deployments.
Gross Margin: 18-26%

Multi-Mission Servicing Vehicles

Certified multi-mission vehicles bundling demonstrated flight heritage and reusability, commanding stronger recurring service revenue and materially higher gross margin than single-mission vehicles sold without proven certification depth. Facility operators increasingly request this depth explicitly during vendor evaluation and procurement processes.
Gross Margin: 42-52%

Refueling And Life Extension Bundle Systems

Refueling-capable life extension platforms bundled with advisory services, carrying the richest margin profile in the category given genuine fleet economic value and expanding operator demand for integrated solutions. Adoption here is accelerating fastest among enterprise accounts operating large constellation fleets.
Gross Margin: 50-62%
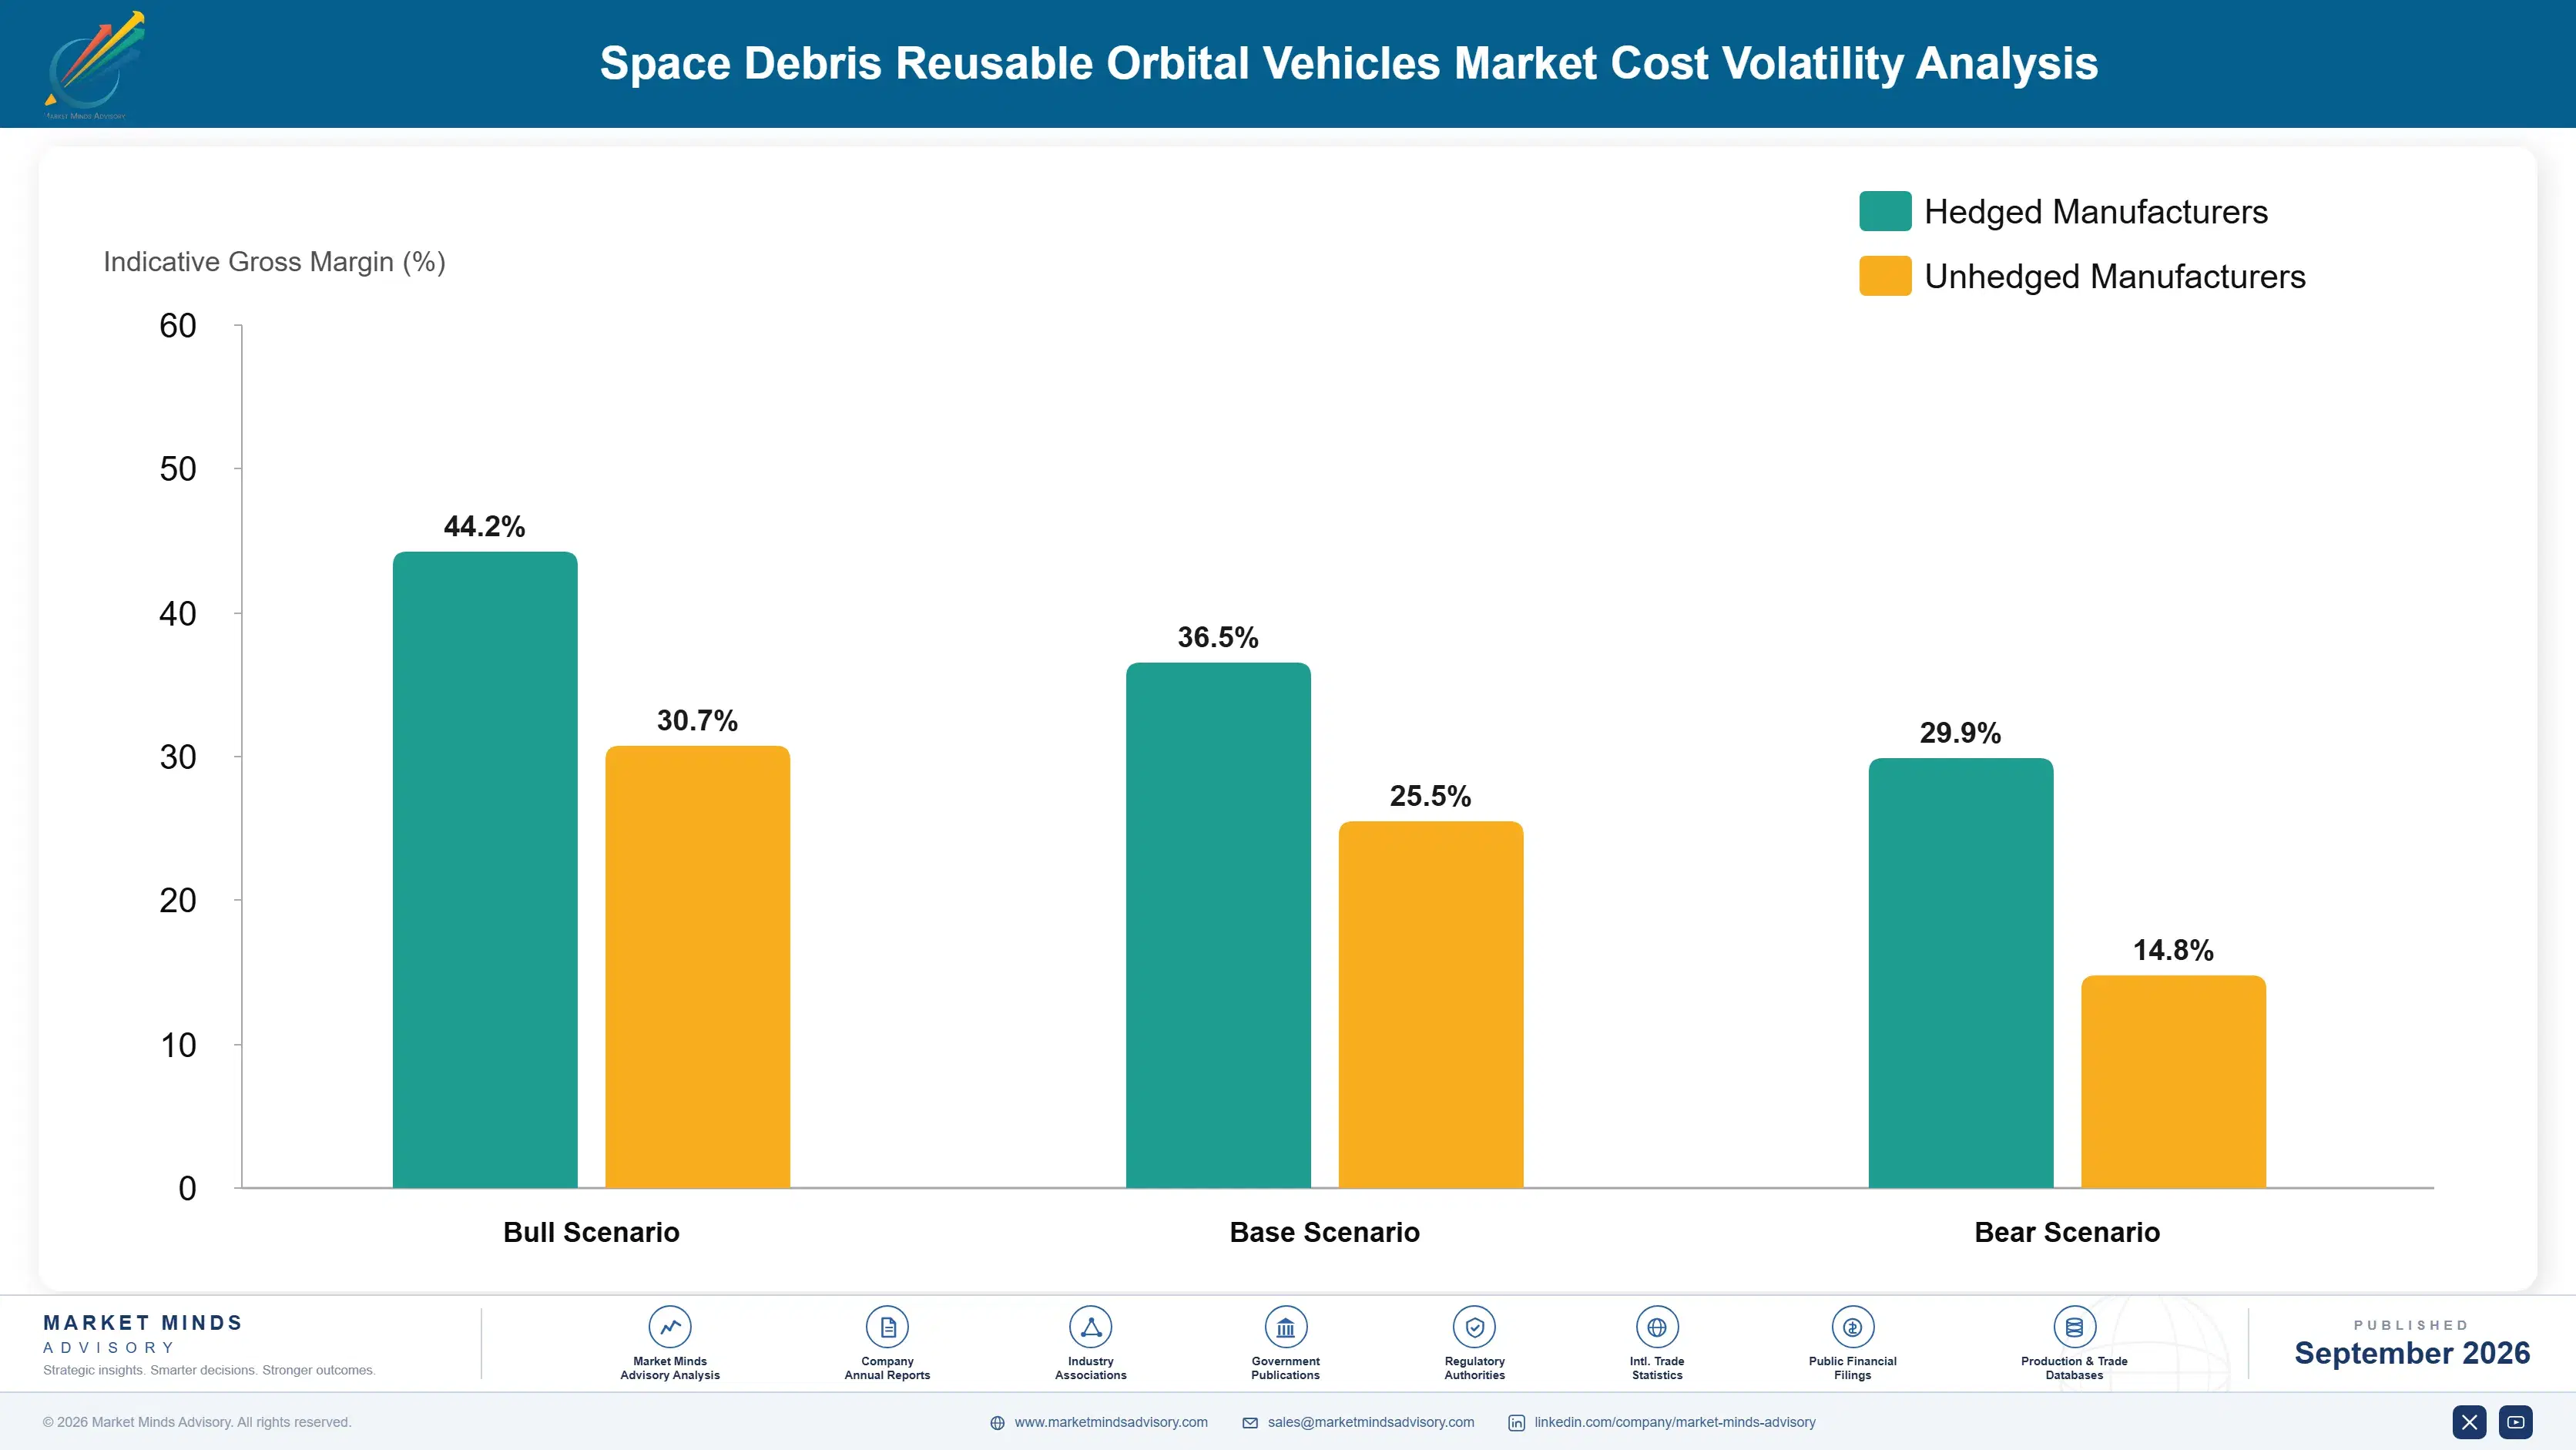
space-debris-reusable-orbital-vehicles-market-cost-volatility-analysis-1788428057848

High-value Sub-segments and Strategic Watch-out

Active Debris Removal Robotic Capture Systems

Fastest-growing and highest-value segment, combining strong pricing power with accelerating adoption as national space agencies mandate defunct satellite removal across increasingly congested altitude shells worldwide, particularly in high-density orbital lanes. Vendors moving early capture outsized long-term qualification relationships across this segment. Vendors here shape category standards.

Satellite Life Extension Servicing Vehicles

High-value segment with moderate growth, anchored by rising operator preference for fleet economics over new launches, though smaller operator budgets constrain broader adoption pace relative to large constellation accounts. Long-term account value here rewards vendors investing in refueling engineering depth. Providers expanding here gain volume steadily.

Ground-Based Mission Control Services

Volume core of the market, delivering steady mission counts and established margin, serving as the primary entry point into multi-mission upgrades and eventual refueling bundle adoption over time. Retention in this segment anchors long-term vendor revenue predictability across cycles. Renewal rates here anchor vendor cash flow.

Legacy Single-Use Disposal Vehicles

Strategic watch-out segment facing intensifying multi-mission competition, pressuring single-use pricing and requiring vendors to differentiate through reusability engineering and total lifecycle cost advantages. Differentiation now determines which suppliers survive the coming consolidation wave ahead. Act early or lose share permanently now. Speed matters most. Truly.

Contract Cycles Anchor Vendor Relationships

Servicing vehicle purchasing behaves less like a discretionary capital spend and more like an annuity tied to national space agency budget cycles, with agencies and operators committing to multi-year servicing contracts once a vendor passes rigorous mission qualification rather than re-qualifying suppliers for every new mission. Vendors offering bundled multi-mission service see meaningfully higher renewal rates than component-only competitors.
Adoption stickiness varies considerably by end-use vertical. National space agencies show the deepest stickiness given lengthy qualification processes tied to specific mission certification requirements, while commercial constellation operators see comparatively higher vendor switching as fleet operators reconfigure servicing relationships more frequently between budget cycles. Insurance-driven operators occupy a middle position, balancing qualification continuity against periodic coverage-driven vendor reevaluation. This spread shapes how vendors prioritize mission engineering staffing across account tiers.

Younger space program leadership increasingly favors integrated multi-mission platforms purchased as complete systems rather than assembling point solutions from multiple vendors, shifting negotiating leverage toward suppliers offering complete servicing stacks. Veteran mission planners still favor incremental single-mission upgrades from established suppliers with long reliability track records, creating a generational split vendors must navigate carefully across account types.
Section default visual

Where Servicing Vendors Should Focus Next

These are among the four positions where our research anticipates prominent divergence between winners and laggards over the coming forecast period. Each is grounded in the demand model, the regulatory perimeter, and the announced capacity pipeline.
01 / MULTI-MISSION FLEET ECONOMICS

Accelerate multi-mission capability ahead of rivals

Operators increasingly prioritize fleet economics over single-mission pricing, and vendors slow to build deeper multi-mission capability risk ceding the fastest-growing segment of the market to faster-moving competitors already shipping reusable vehicles at scale. Engineering investment here carries real near-term cost, but the segment's growth rate justifies front-loading development spend now rather than waiting for competitive pressure to force the issue later across major agency accounts. Vendors delaying this investment will find catch-up increasingly expensive as multi-mission capability becomes the default buyer expectation.
02 / INSURANCE ADVISORY BUILD

Establish debris mitigation advisory services now

Orbital liability insurers increasingly determine coverage terms independent of direct regulatory enforcement timing, and vendors offering documentation and compliance advisory services capture a genuinely urgent commercial channel before competitors close the gap. This capability requires dedicated risk management engineering investment distinct from standard vehicle sales, but the addressable insurer-driven demand remains substantial and largely untapped by generalist manufacturers. Vendors moving early on advisory development will hold a durable advantage as insurer scrutiny intensifies further across the forecast period ahead, where documentation quality increasingly determines coverage terms.
03 / INTERFACE STANDARDIZATION PUSH

License standardized docking interfaces to manufacturers

Interoperability standardization is opening competitive bidding to smaller specialists previously excluded by proprietary capture requirements, and vendors licensing standardized interface technology capture a service revenue stream distinct from vehicle sales that positions them as trusted industry standard-setters. Facilities navigating this expanding vendor landscape increasingly value interoperability as much as raw capability during vendor evaluation and selection processes. Vendors building this capability early establish standard-setting relationships competitors entering later will struggle to replicate across comparable engagements, where interoperability increasingly determines fleet-wide procurement outcomes.
04 / REFUELING BUNDLE DEVELOPMENT

Build refueling capability into servicing offerings

Fleet replacement cost increasingly drives constellation operator purchasing decisions, and vendors bundling refueling capability with life extension servicing capture a genuinely underserved segment before larger competitors recognize the opportunity and adjust their own product roadmaps accordingly. This capability requires meaningful upfront propulsion engineering investment distinct from standard servicing product lines, but the addressable segment continues expanding as constellation density grows. Waiting risks permanent exclusion from this segment as operator awareness of fleet economics continues increasing across the broader constellation industry.

Engagement Snapshot From the Field

A live engagement with an industry participant carrying material or product regulatory and market exposure ahead of a defining policy shift, showing how our research translates into a defensible multi-year portfolio strategy.
MARKET MINDS ADVISORY · CLIENT ENGAGEMENT SUMMARY
Space Debris Reusable Orbital Vehicles Producer Strategic Portfolio Review and Transition Roadmap 2026·Investment Scenario on Space Debris Reusable Orbital Vehicles Exposure Evaluation 2025-26
CLIENT PROFILE
A mid-size commercial satellite constellation operator running several dozen small satellites in low earth orbit approached MMA seeking guidance on selecting a life extension servicing vendor ahead of approaching propellant depletion across its earliest deployed satellites requiring intervention. The client's fleet engineering team had limited prior experience evaluating orbital servicing vendors relative to the launch-based fleet replacement it had historically pursued.
STRATEGIC CHALLENGE
The client faced replacement launch costs far exceeding servicing alternatives but lacked internal expertise evaluating orbital servicing vendors across a genuinely unfamiliar procurement category. Leadership needed a vendor selection framework balancing demonstrated flight heritage against per-satellite servicing cost across its constellation fleet. Delayed action risked losing valuable operational satellites to propellant depletion before servicing arrangements could be finalized.
MMA APPROACH
MMA conducted a vendor capability audit across leading servicing platforms alongside interviews with the client's fleet engineering team to define selection criteria weighted toward demonstrated mission success and docking compatibility. The engagement benchmarked candidate vendors on flight heritage, per-mission cost, and total deployment timeline across comparable engagements. Recommendations were validated against comparable servicing engagements completed by peer constellation operators facing similar fleet aging challenges.
KEY FINDINGS
  1. Vendors with proven multi-mission flight heritage reduced deployment risk considerably compared to newer entrants lacking comparable demonstrated capture and docking mission history.
  2. Life extension servicing reduced total fleet replacement cost meaningfully compared to the client's baseline assumption of launching new satellites for propellant-depleted assets.
  3. Standardized docking interface compatibility proved decisive among vendors, given the client's fleet used a common satellite bus design across most assets. This compatibility discovery simplified vendor negotiations considerably relative to bespoke docking mechanism development.
  4. Insurance premium reductions available to operators using certified servicing vendors offset a meaningful share of servicing cost within the contract term. This factor ultimately outweighed marginal pricing differences between otherwise comparable finalist vendors evaluated.
CLIENT PROFILE
A mid-size commercial satellite constellation operator running several dozen small satellites in low earth orbit approached MMA seeking guidance on selecting a life extension servicing vendor ahead of approaching propellant depletion across its earliest deployed satellites requiring intervention. The client's fleet engineering team had limited prior experience evaluating orbital servicing vendors relative to the launch-based fleet replacement it had historically pursued.
STRATEGIC CHALLENGE
The client faced replacement launch costs far exceeding servicing alternatives but lacked internal expertise evaluating orbital servicing vendors across a genuinely unfamiliar procurement category. Leadership needed a vendor selection framework balancing demonstrated flight heritage against per-satellite servicing cost across its constellation fleet. Delayed action risked losing valuable operational satellites to propellant depletion before servicing arrangements could be finalized.
MMA APPROACH
MMA conducted a vendor capability audit across leading servicing platforms alongside interviews with the client's fleet engineering team to define selection criteria weighted toward demonstrated mission success and docking compatibility. The engagement benchmarked candidate vendors on flight heritage, per-mission cost, and total deployment timeline across comparable engagements. Recommendations were validated against comparable servicing engagements completed by peer constellation operators facing similar fleet aging challenges.
KEY FINDINGS
  1. Vendors with proven multi-mission flight heritage reduced deployment risk considerably compared to newer entrants lacking comparable demonstrated capture and docking mission history.
  2. Life extension servicing reduced total fleet replacement cost meaningfully compared to the client's baseline assumption of launching new satellites for propellant-depleted assets.
  3. Standardized docking interface compatibility proved decisive among vendors, given the client's fleet used a common satellite bus design across most assets. This compatibility discovery simplified vendor negotiations considerably relative to bespoke docking mechanism development.
  4. Insurance premium reductions available to operators using certified servicing vendors offset a meaningful share of servicing cost within the contract term. This factor ultimately outweighed marginal pricing differences between otherwise comparable finalist vendors evaluated.
RECOMMENDED STRATEGY
Phase 1: Phase one selected a vendor with proven multi-mission flight heritage and confirmed docking compatibility for the client's earliest depleting satellites. Phase 2: Phase two conducted a documented servicing mission to validate vendor performance before committing to a broader fleet servicing agreement. Results confirmed the vendor met all required mission performance thresholds. Phase 3: Phase three established standardized servicing specifications for all future satellite bus designs to simplify future vendor qualification processes. Fleet engineering teams adopted the specification as standard design policy.
OUTCOME
Within three quarters, the client reported (client-reported, unverified by MMA) meaningful cost savings on fleet lifecycle management and successful satellite life extension, validating the vendor selection framework MMA recommended across its constellation. Leadership extended the servicing agreement to cover additional satellites planned for the following fiscal year.

Frequently Asked Questions

Foundational context covering the market sizes, CAGR, scope, country, region and competition that inform every finding below. This section is provided to cover basics and most often pre-purchase conversations, answered from the MMA Primary Research Dataset.

What is the current size of the Space Debris Reusable Orbital Vehicles Market?

The global market was valued at approximately 0.72 billion dollars in 2025, driven by national space agency mandates and constellation life extension demand across major markets.

How large will the Space Debris Reusable Orbital Vehicles Market be by 2036?

The market is projected to reach roughly 3.9 billion dollars by 2036, more than four times its 2026 base as reusability becomes standard vehicle design.

What is the CAGR for the Space Debris Reusable Orbital Vehicles Market 2026 to 2036?

The market is forecast to grow at a compound annual rate of approximately 16.5 percent between 2026 and 2036, supported by orbital congestion and insurance requirements.

Which segment is growing fastest?

Active Debris Removal Robotic Capture Systems lead segment growth at approximately 22.0 percent annually, outpacing the broader market as national agencies mandate defunct satellite removal.

Who are the major companies in the Space Debris Reusable Orbital Vehicles Market?

Astroscale, ClearSpace, Northrop Grumman, Redwire, and Starfish Space lead the competitive landscape, collectively holding the largest position on a contracted mission basis nationwide currently today.

Which country is growing fastest?

India leads country-level growth at approximately 19.0 percent annually, driven by an expanding national space program and growing indigenous debris removal capability development quite broadly.

Report Segmentation Architecture

The full report scope spans multiple orthogonal segmentation dimensions, with cross-tabulated demand data provided for each dimension pair. Coverage extends further to regional breakdowns, trend trajectories, and the competitive detail needed to support segment-level decision-making.

By Vehicle Type

    By End-Use Mission Category

      By Commercial Deployment Model

        By Region

        • North America
        • East Asia
        • Western Europe
        • South Asia and Pacific
        • Latin America
        • Middle East and Africa
        • Eastern Europe

        Scope, Methodology, and Coverage

        Every figure in this report is reproducible from documented input assumptions. The scope below maps the historical period, the forecast horizon, the segmentation dimensions, and the countries covered, alongside the underlying primary and qualitative methodology.
        Historical Period
        2020 to 2025
        Forecast Period
        2026 to 2036
        Base Year
        2025 (USD billions; MMA Primary Research Dataset, September 2026)
        Market Definition
        This report covers reusable spacecraft designed for active debris removal, satellite life extension, and orbital servicing missions capable of multiple operational cycles. It excludes single-use disposal vehicles, ground-based debris tracking systems, and launch vehicles not designed for on-orbit servicing operations.
        Quantitative Units
        USD billions, percent CAGR, percent share
        Segmentation Dimensions
        Vehicle type, end-use mission category, commercial deployment model
        Regions Covered
        North America, East Asia, Western Europe, South Asia and Pacific, Latin America, Middle East and Africa, Eastern Europe
        Countries Covered
        United States, Canada, Japan, China, South Korea, Germany, France, United Kingdom, India, Australia, Singapore, Brazil, Mexico, United Arab Emirates, Saudi Arabia, South Africa, Poland, Czech Republic, Hungary, Italy
        Key Companies Profiled
        Astroscale, ClearSpace, Northrop Grumman, Redwire, Starfish Space, Momentus, D-Orbit, Nanoracks, Orbit Fab, Turion Space, Privateer, OrbitGuardians, Space Machines Company, Kall Morris Inc, Exotrail, GITAI, Sierra Space, Effective Space Solutions, SENER Aeroespacial, Infinite Orbits
        Quantitative Methodology
        Primary survey, n=3,800 respondents, Q4 2025, six countries; demand-side model with trade association cross-validation
        Qualitative Methodology
        47 expert interviews, Q4 2025; applied to validate demand model assumptions, identify emerging dynamics, and assess competitive positioning
        Report Format
        PDF and XLSX data workbook (Word format preview document)
        Publisher
        Market Minds Advisory
        Report Code
        MMA-2026-TEC-388
        Published
        September 2026
        Contact
        sales@marketmindsadvisory.com | www.marketmindsadvisory.com

        Purchase the full Space Debris Reusable Orbital Vehicles Market Report (2026 to 2036).

        This report delivers a comprehensive assessment of the global space debris reusable orbital vehicles market, spanning market sizing, segmentation, competitive positioning, and regional demand dynamics through 2036. It profiles twenty leading vendors across removal, servicing, and refueling categories, benchmarking each on a consistent mission basis. Readers gain a detailed view of revenue levers, aerospace component cost exposure, and margin architecture across the category. The analysis draws on primary survey data, expert interviews, and company disclosures to support strategic planning across the full ten-year forecast period ahead.
        Ten-year market sizing and forecast model
        Six-segment MECE vehicle type framework overview
        Twenty-company competitive benchmarking dataset included fully
        Seven-region demand share and CAGR analysis
        Aerospace component cost exposure and mitigation playbook
        Anonymized client fleet servicing case study included

        Built For The People Who Decide

        From boardroom strategy to bench-side execution, this report is read cover-to-cover by leaders shaping the next decade of their industry, turning demand scenarios, market dynamics and valuation benchmarks into decisions.
        CXOs/ Presidents/ VPs/ Managers
        M&A and Corporate Development
        Strategy Teams and R&D Heads
        Procurement and Product Directors
        Regulatory and Compliance Leaders
        Investor Relations and Equity Analysts