Market Minds Advisory
Solid-State Lighting Market

Solid-State Lighting Market: Solid-State Lighting Market: Replacement Collapse, Service Life Economics and Where Value Moved 2026 to 2036

This industry replaced a product that failed every year with one that lasts fifteen. It won the technology argument completely and then discovered it had destroyed most of its own recurring revenue.

Lead Analyst

Published

September 2026

Make Smarter Decisions with Customized Research Insights

Request a free sample report and evaluate market opportunities, growth trends, and competitive dynamics relevant to your business needs.

2025 MARKET VALUE$74.5BMarket Size 2025
2036 FORECAST VALUE$122.1BBase Case , 2026 to 2036
CAGR 2026 TO 20364.6 %Bull 5.8% / Bear 3.4%
INCREMENTAL OPPORTUNITY$44.2BNet 10- year value creation
EXPANSION MULTIPLE1.57x2036 value over 2026 base
Strategic Levers
M&A Pipeline
Regional Outlook
Country Rankings
Competitive Intelligence
Segmental Deep-dive
Call-Us : 91 93563 13602

Executive Snapshot and Market Trajectory.

This industry replaced a product that failed every single year with one that lasts fifteen. It won that technology argument completely, converted essentially the entire installed base, and in the process destroyed the replacement revenue that had funded the whole business for a century.
The market reaches USD 77.9 billion in 2026 and USD 122.1 billion by 2036, a 1.57 times expansion at 4.6% annually. Horticultural and controlled environment lighting grows at 6.9%, half again the market rate of 4.6%, because those buyers purchase light as a production input rather than as a building fitting. East Asia holds 41% of global value, above the usual band ceiling, and India compounds fastest at 8.4% on electrification and construction together.
Five manufacturers hold just 38% of luminaire and module revenue, which is low for an industry this large, because the barrier to assembling a competent LED fixture collapsed alongside component prices. Signify, Acuity Brands, Zumtobel Group, Panasonic and Opple Lighting lead the field between them. Value has moved decisively away from the light source itself and toward controls, services and the applications where light does measurable work.
Market Definition
This report covers solid-state lighting products by application class: general indoor and architectural luminaires, outdoor and roadway lighting systems, horticultural and controlled environment lighting, industrial and high-bay lighting, automotive and transport lighting modules, and lighting controls with connected management systems. It excludes LED chips and packaged emitters sold as components, display backlighting, conventional lamp technologies of any kind, ultraviolet and infrared emitters for non-illumination use, and electrical installation or wiring work.
Base Year Value
$74.5B in 2025 (MMA Primary Research Dataset, September 2026)
Forecast Period
2026 to 2036, eleven discrete annual values
CAGR
4.6% base case. Bull 5.8%. Bear 3.4%.
Fastest Growth Segment
Horticultural And Controlled Environment Lighting: 6.9% CAGR
Fastest Growth Country
India: 8.4% CAGR
Fastest Growth Region
South Asia and Pacific: 6.6% CAGR
Largest Region
East Asia: 41% of 2025 global value
Market Leaders
Signify, Acuity Brands, Zumtobel Group, Panasonic and Opple Lighting lead on solid-state lighting luminaire and module revenue. Source: MMA Analysis.
Primary Survey
n=3,800 procurement and R&D decision-makers, Q4 2025, six countries
Methodology
Demand-side build-up, cross-validated against public data, 47 expert interviews

Solid-State Lighting Market Forecast Scenarios

solid-state-lighting-market-size-forecast-scenario-1789995040079
Between 2020 and 2025 the category compounded at 3.6%, which is a strange result for a technology that had just completed the fastest conversion in the history of lighting. The explanation is arithmetic rather than commercial: as conversion finished, the replacement cycle stretched from annual to well over a decade, and unit prices fell steadily throughout. Volume growth and price decline largely cancelled each other out across the period.
The base case holds 4.6% on three mechanisms. Construction across India, Southeast Asia and the Gulf keeps adding buildings that need lighting from new rather than converting anything. Horticultural and industrial applications buy light as a production input where its performance is measured against yield or output. And the first generation of converted installations is reaching end of life, which restarts a replacement cycle nobody has seen since conversion began.
The bull case at 5.8% assumes the first replacement wave arrives faster than fifteen year service life suggests, since early installations frequently used components that underperformed their ratings. The bear case at 3.4% is continued price erosion: luminaire assembly has few remaining barriers, capacity is abundant, and buyers treat most general lighting as an interchangeable commodity purchased on price alone.

The Replacement Cycle Vanished

The lighting industry solved its own problem too well. An incandescent lamp failed roughly every year, which meant a century of predictable replacement revenue arriving without any sales effort at all. A solid-state luminaire lasts around fifteen years. The conversion is essentially complete across developed markets, and the industry that won it faces a replacement cycle stretched fifteenfold with prices down 64% over a decade.
TOP FIVE CONCENTRATION38%Low, since assembling a competent fixture requires little now
TYPICAL SERVICE LIFE15 yearsBefore replacement against roughly one year for incandescent lamps
LUMINAIRE PRICE DECLINE64%Cumulative fall in comparable fixture pricing over a decade
CONTROLS ATTACHMENT RATE23%Share of commercial installations including connected management systems
LIGHTING ENERGY SHARE11%Lighting electricity within total commercial building operating cost
HORTICULTURAL YIELD UPLIFT18%Typical production gain from controlled spectrum in protected growing
That collapse explains why concentration sits at only 38%. Once the light source became a commodity component available to anybody, assembling a competent fixture stopped requiring much beyond thermal design and supply chain access. Chinese manufacturers built enormous capacity, pricing followed, and the established firms found themselves defending margin in a product category where their historical advantages had quietly stopped mattering.
Value has consequently moved to where light does measurable work rather than merely illuminating. A horticultural installation delivering 18% yield uplift is bought against crop economics. A connected controls system is bought against the 11% of building operating cost that lighting electricity represents. Controls attach to only 23% of commercial installations, which is either a disappointing number or the largest opportunity in the industry depending on who is describing it.
"Nobody in this industry wants to say it plainly, so I will. They built a product that does not break, sold it to everybody, and are now surprised that nobody needs another one. The growth is in applications where light is an input to something else, and almost nowhere else."
Director, Lighting Systems and Building Technologies Practice · MMA Industrial Equipment Practice · September 2026

Market Trends

Horticultural Buyers Purchase Light As Production Input

A protected growing operation buys its lighting against crop yield rather than against any building specification, which makes it a completely different sort of customer from anybody purchasing office fittings. Controlled spectrum delivers roughly 18% production uplift across typical installations, and that figure is measured directly against revenue rather than estimated against energy savings. Horticultural and controlled environment lighting grows at 6.9% against 4.6% for the market. The buyer evaluates spectrum, photon efficiency and heat load, and cares remarkably little about most of what a conventional lighting designer would consider important.
Market Impact: India compounds at 8.4% annually
Controls Attachment Lags Far Behind Industry Expectations

Connected lighting management attaches to only around 23% of commercial installations despite a full decade of industry promotion, because the savings argument now competes against lighting electricity that already represents just 11% of total building operating cost after conversion. The very efficiency gain that made solid-state lighting compelling also shrank the pool that controls are able to save from. Attachment runs considerably higher where controls serve occupancy analytics or space utilisation rather than energy management, which is an entirely different sale made to an entirely different buyer inside the same organisation.
Market Impact: Service life runs about 15 years

Market Opportunities and Growth Drivers

New Construction Adds Lighting Rather Than Replacing It

Buildings under construction across India, Southeast Asia and the Gulf all need lighting from new, which is an entirely different purchase from converting an existing installation and one unaffected by any replacement cycle arithmetic. India compounds at 8.4% annually, faster than any other market measured, on construction volume and rural electrification proceeding at the same time. Those installations all specify solid-state lighting from the outset, with no conversion decision to make at all, and specification happens through electrical contractors, consultants and project designers rather than through any facilities replacement budget that somebody manages.
Market Impact: Cycles stretched to 15 years

First Converted Installations Reach End Of Service Life

Early conversion projects installed a decade or more ago are now reaching replacement, and a great many of them used components that underperformed their published ratings quite badly. That restarts a replacement cycle the industry has not experienced at all since conversion began, though at fifteen year intervals rather than the annual ones it was built around. The commercial character differs from the original conversion: the customer already knows what they are buying, holds measured performance data from the first installation, and negotiates considerably harder than they did the first time around.
Market Impact: Prices fell 64% in a decade

Market Restraints and Challenges

Extended Service Life Destroyed Recurring Replacement Revenue

An incandescent lamp failed roughly annually and generated a century of replacement revenue arriving with no sales effort at all. A solid-state luminaire lasts around fifteen years, which stretched that cycle by a factor of fifteen across an installed base now essentially converted. The root cause is simply that the replacement product works a great deal better. Commercially this removed the entire revenue foundation that the industry had been built on. Mitigation runs through controls, through services, and through applications where light is a production input rather than merely a building fitting.
Market Impact: Yield uplift reaches 18% typically

Assembly Barriers Collapsed Alongside Component Pricing

Once packaged emitters became commodity components available to anybody, building a competent luminaire stopped requiring much beyond thermal design and supply chain access. Comparable fixture pricing has consequently fallen 64% across a single decade. The root cause is that the difficult engineering moved into the LED package itself, which established lighting firms mostly buy rather than make. Commercially this compressed margin very severely across the whole general lighting category. Mitigation runs through controls integration, application-specific performance and service models that the physical assembly itself simply does not provide to anybody.
Market Impact: Controls attach to just 23%
3 additional market trends, 4 additional growth drivers, and 2 additional restraints and challenges are covered in the full report. Contact sales@marketmindsadvisory.com to access the complete intelligence.

Segment CAGR and Growth Architecture

Segmentation follows application class, since each carries a different buyer, a different basis for evaluating the purchase and quite different exposure to price erosion. Six classes cover the market, spanning general indoor, outdoor and roadway, horticultural, industrial high-bay, automotive modules and connected controls. End-use sector and specification route are separate dimensions handled elsewhere in this report.
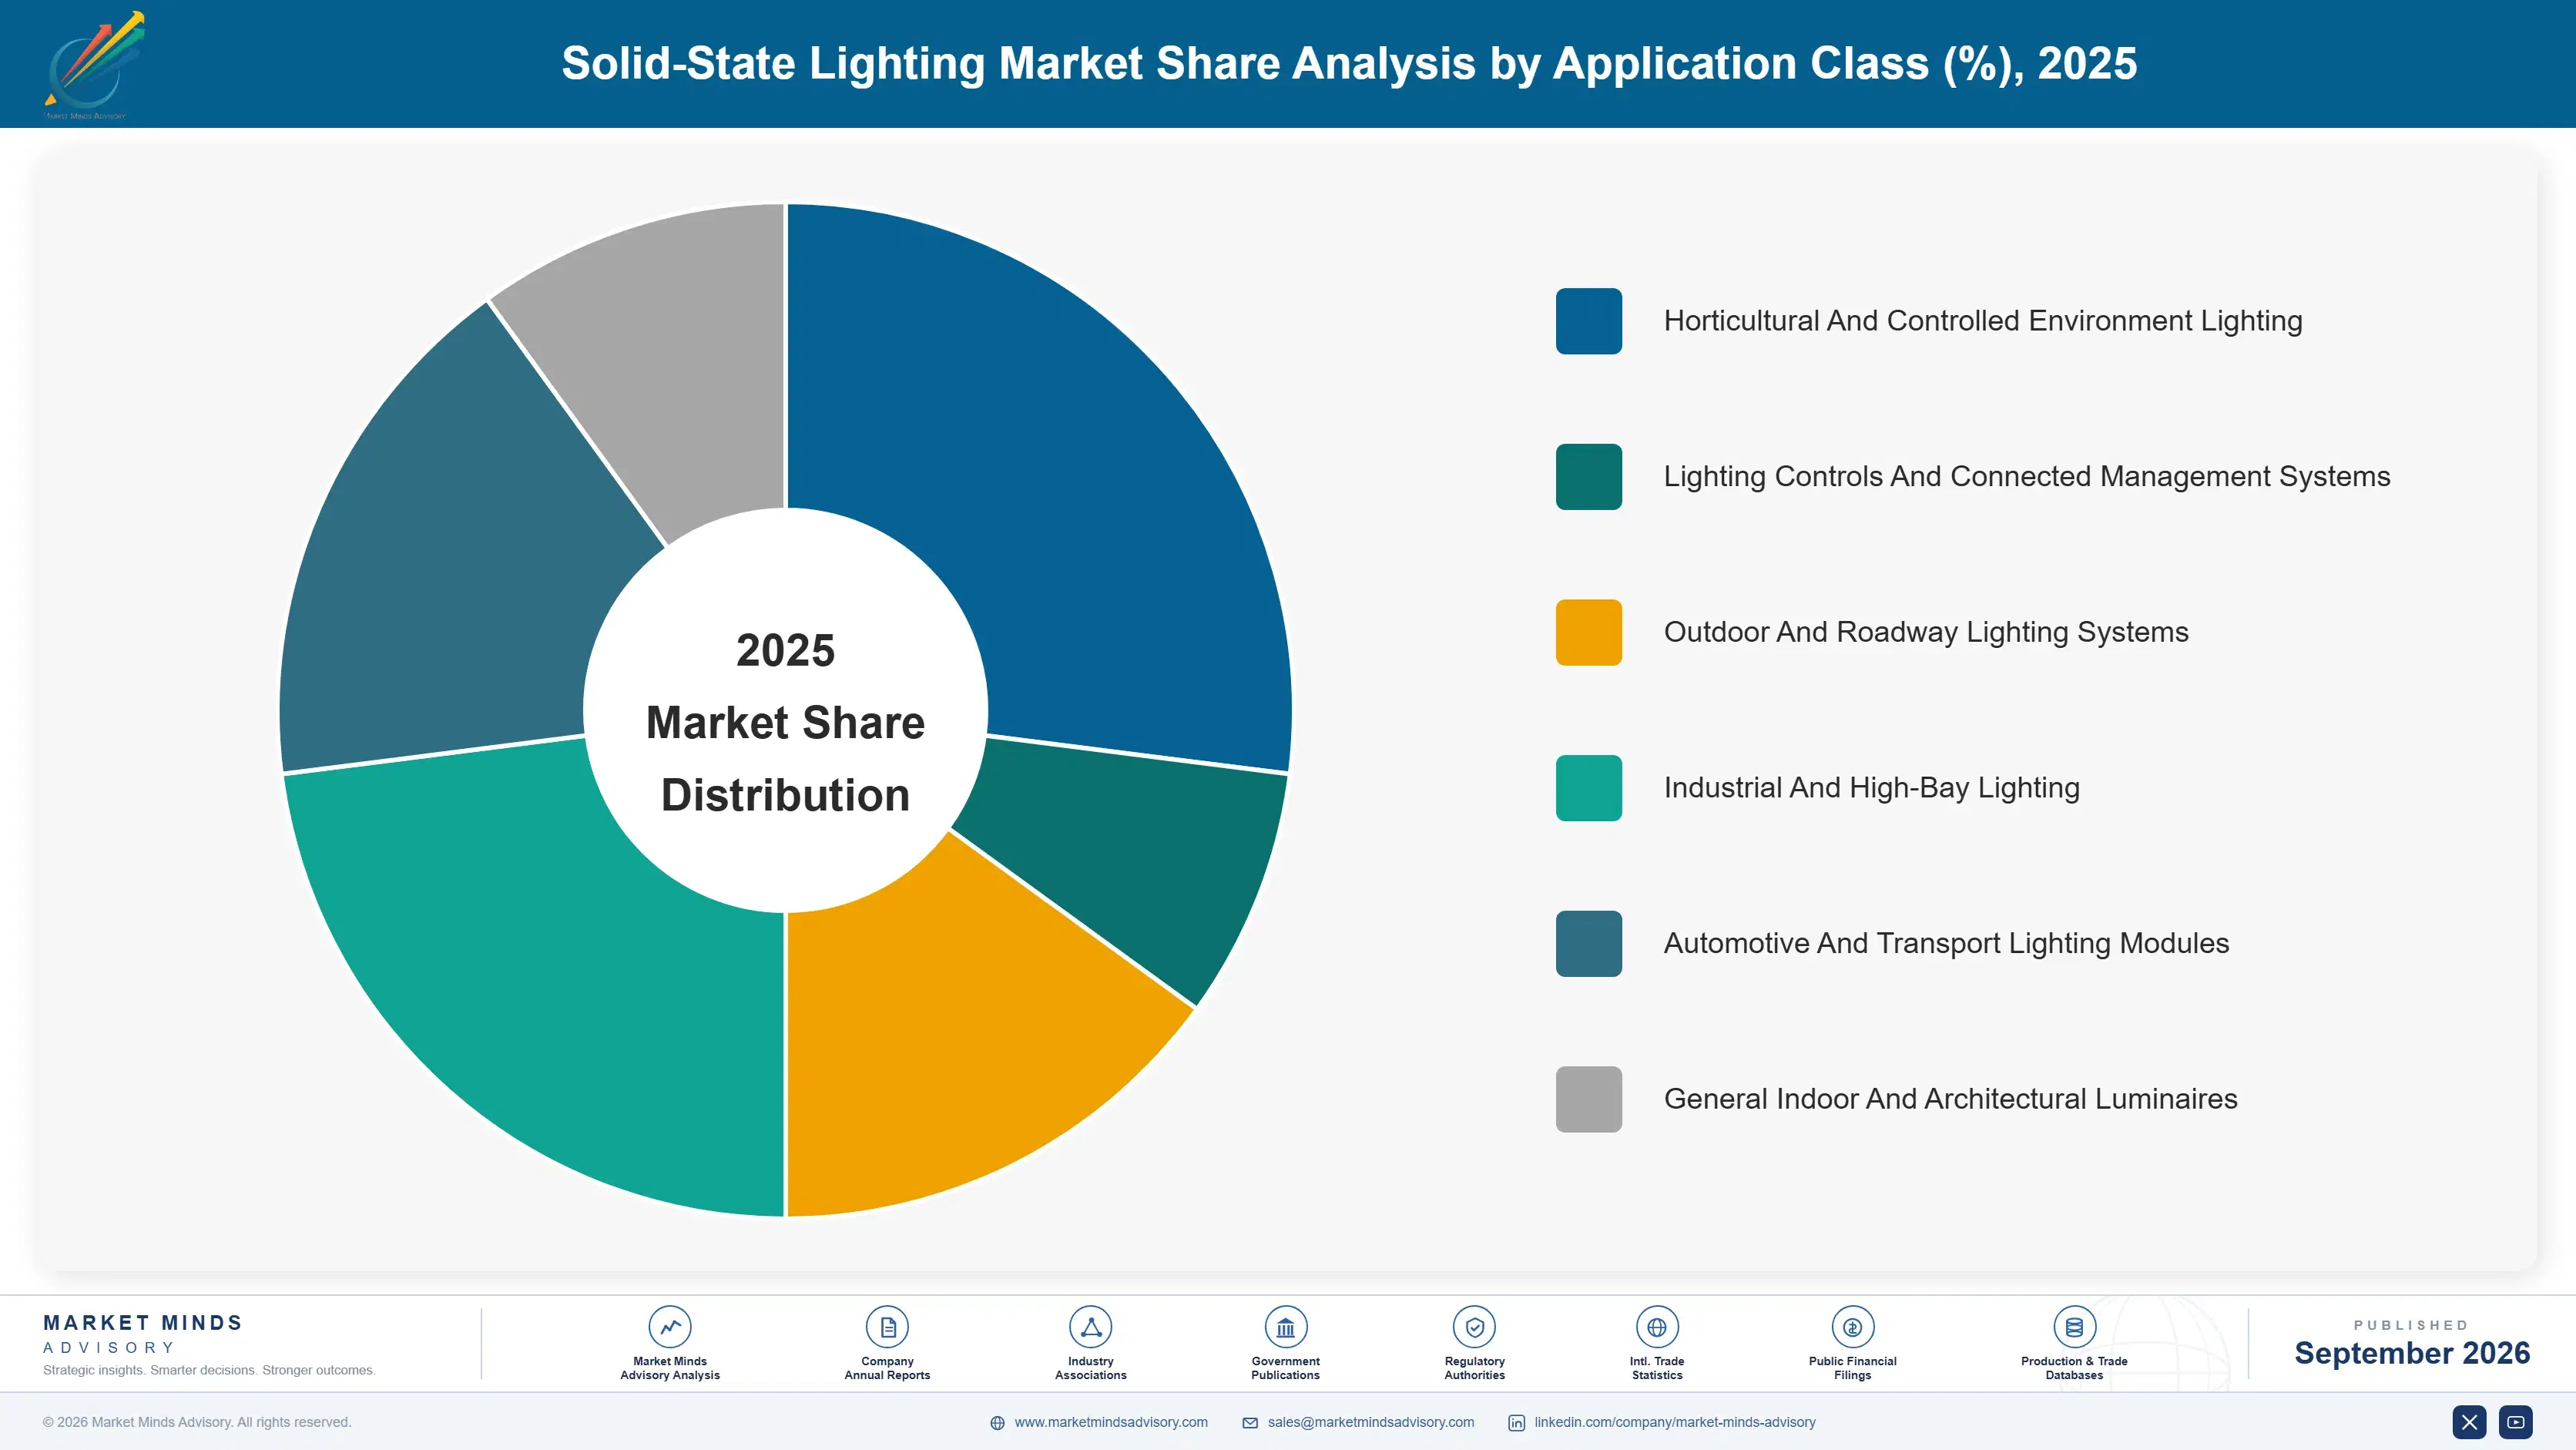
solid-state-lighting-market-market-share-analysis-1789995040649

Horticultural And Controlled Environment Lighting

Horticultural and controlled environment lighting grows at 6.9%, half again the market rate of 4.6%, because the buyer purchases light as a production input rather than as a building fitting. Controlled spectrum delivers roughly 18% yield uplift in typical protected growing installations, and that number is measured against crop revenue rather than estimated against energy savings on a spreadsheet. The evaluation criteria here are photon efficiency, spectrum control and heat load, none of which a general lighting manufacturer optimises for. Price erosion has been a great deal gentler here than across general lighting, because performance differences between products are genuinely measurable and matter directly to the outcome the grower achieves.
CAGR 6.9%

Lighting Controls And Connected Management Systems

Lighting controls and connected management systems compound at 6.1% on an attachment rate of only around 23% across commercial installations, which is a genuinely disappointing result set against a full decade of industry promotion. The difficulty is that solid-state conversion had already cut lighting electricity to roughly 11% of total building operating cost, so the savings pool that controls can address is far smaller than it once was. Growth is strongest wherever controls serve occupancy analytics, space utilisation or asset tracking rather than any form of energy management, since those buyers sit inside real estate and operations functions holding entirely different budgets and carrying considerably less scepticism about payback claims.
CAGR 6.1%
Full segment breakdown across 6 segments available in the complete report.

Regional Architecture and Country Demand Map

East Asia holds 41% of category value, well above the usual band ceiling, because luminaire manufacturing capacity and a very large share of global construction volume are both concentrated right across the region. North America follows at 19% on commercial building stock and roadway systems.

East Asia

East Asia takes 41% of category value, well above the 30% band ceiling, and both manufacture and consumption together explain it. Chinese manufacturers built the luminaire assembly capacity that drove global pricing down 64% across a decade, and Chinese construction volume consumes an enormous share of what they build. Japanese and South Korean demand runs through commercial refurbishment and automotive lighting modules, where quality requirements remain genuinely demanding and pricing holds up better. Opple Lighting and Panasonic both hold substantial regional positions across several application classes. Growth at 5.4% sits above the global rate, and manufacture and consumption sitting together in one region keeps pricing lower here than anywhere else measured worldwide.
Share: 41% | CAGR: 5.4% (2026 to 2036)

North America

Nineteen percent of category value reaches North America, sitting below the usual band floor, where the commercial building stock converted early and is now largely waiting on service life rather than actively buying. Roadway and municipal lighting programmes account for substantial further demand, frequently funded through energy performance contracts that pay for themselves out of the electricity saved. Acuity Brands holds a particularly strong regional position across both commercial and industrial applications. Horticultural lighting has grown quickly here on sustained controlled environment agriculture investment across several states. Growth at 4.0% sits below the global rate, on a fully converted installed base and on comparatively limited construction volume right across the region.
Share: 19% | CAGR: 4.0% (2026 to 2036)
Regional intelligence for 5 additional markets available in the complete report: Western Europe, South Asia and Pacific, Latin America, Middle East and Africa, Eastern Europe. Contact sales@marketmindsadvisory.com.
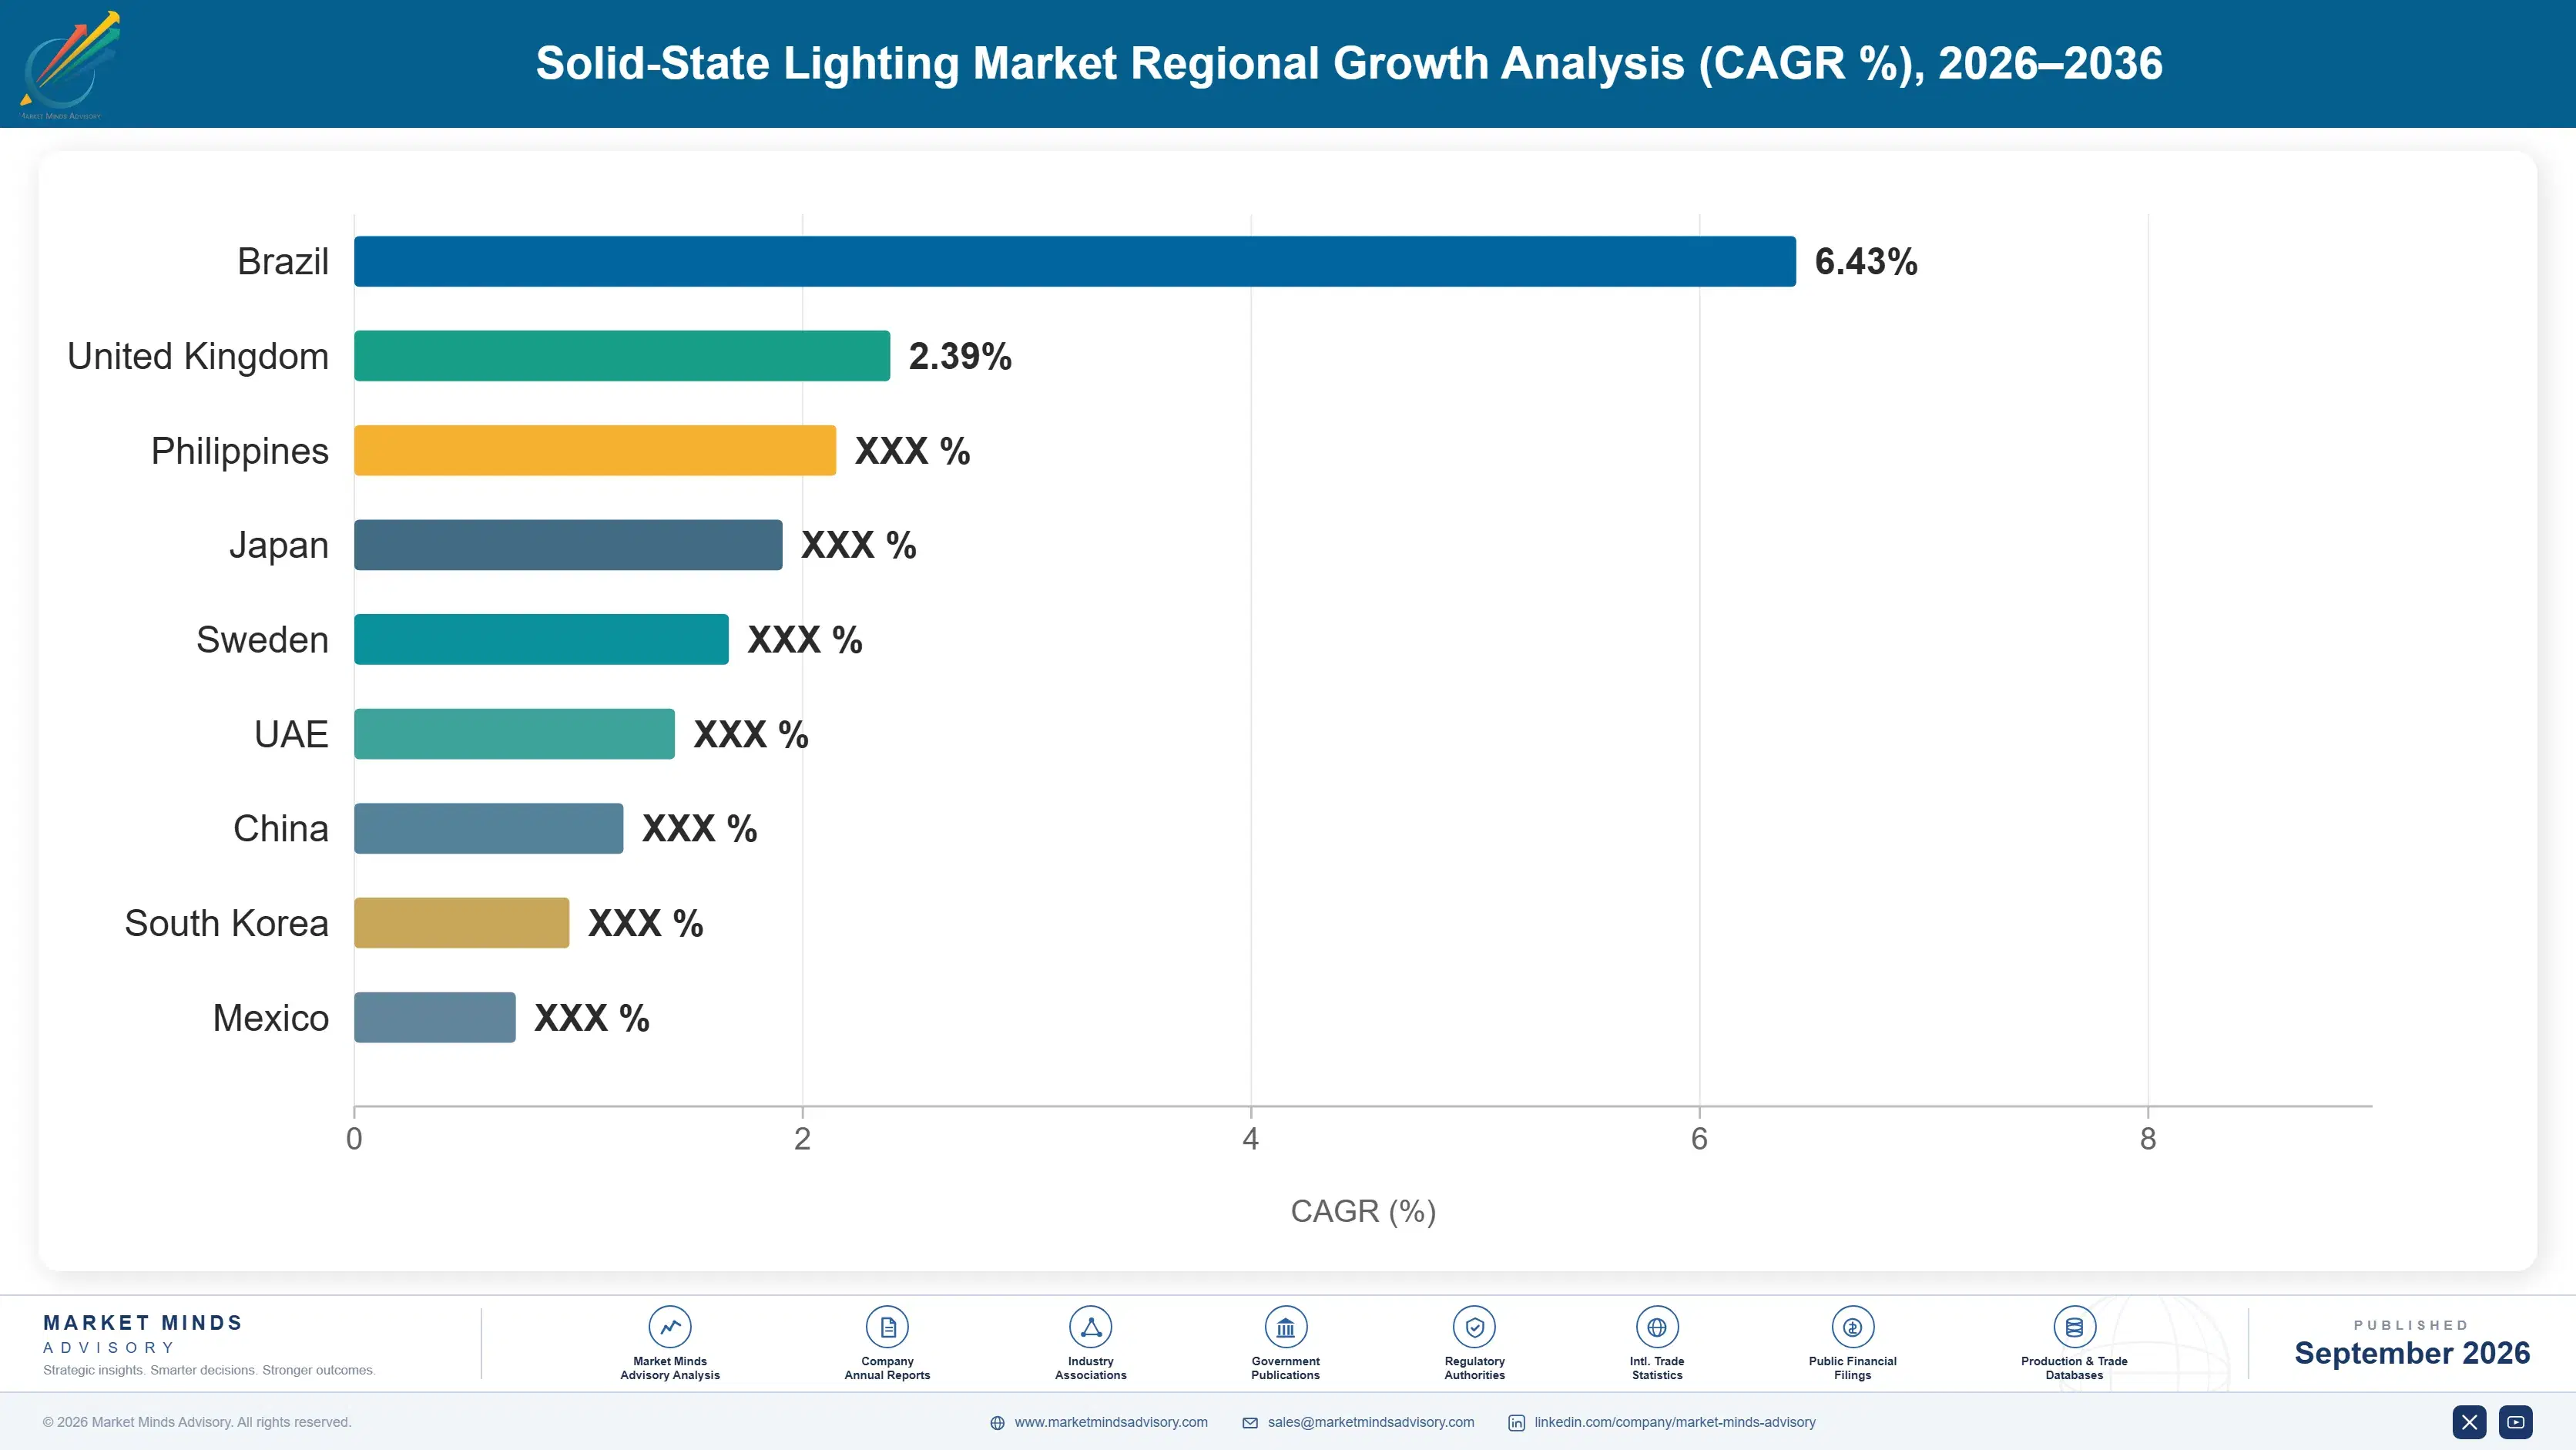
solid-state-lighting-market-country-cagr-analysis-1789995041171

Where Lighting Value Actually Moved

The replacement cycle that funded this industry for a full century has now stretched fifteenfold, the assembly barriers collapsed entirely alongside component pricing, and the energy savings argument shrank precisely because the conversion itself had already captured most of it. The four levers below follow those conditions rather than any argument about luminaire quality.

Sell Into Applications Where Light Produces Output

A horticultural buyer purchasing roughly 18% yield uplift evaluates the whole thing against crop revenue, and price erosion in that segment has been a great deal gentler than in general lighting, because performance differences genuinely matter to the outcome. The same pattern holds right across industrial inspection lighting and in the specialist medical or aquaculture applications too. Manufacturers selling general fittings compete against abundant Asian assembly capacity on delivered price alone. Those selling measurable production outcomes instead compete on results that the customer can verify directly against their own production numbers.
Market Impact: Yield uplift reaches fully 18% in typical installations

Move Controls Beyond The Energy Argument

Controls attach to only around 23% of commercial installations, because the conversion already cut lighting electricity to roughly 11% of total building operating cost and the remaining savings pool is small. Occupancy analytics, space utilisation and asset tracking all sell instead to real estate and operations functions holding different budgets and carrying far less scepticism about payback. Manufacturers still leading with energy savings arguments are arguing over a number that keeps shrinking. Those leading with building data are selling something that the energy conversation never once made available to anybody.
Market Impact: Controls attachment sits at only 23% at present

Follow Construction Rather Than Replacement Budgets

India compounds at 8.4% annually and Gulf construction keeps adding building stock that specifies its lighting from new, which is a purchase entirely unaffected by any of the service life arithmetic constraining developed markets. Specification happens through electrical contractors, consultants and project designers rather than through any facilities replacement budget anybody controls. Manufacturers organised around refurbishment selling reach entirely the wrong function in those markets, and frequently arrive long after the specification has already been written into the project documentation. That is a coverage problem rather than a product one.
Market Impact: India alone compounds at fully 8.4% every year

Prepare For The First Genuine Replacement Wave

Installations converted a decade or more ago are now reaching the end of service life at around 15 years, and a great many of them used components that underperformed their published ratings badly. That customer already knows exactly what they are buying, holds measured performance data from the first installation, and negotiates considerably harder than before. Manufacturers whose original products underdelivered will face that measured data directly across the table. Those who can demonstrate measured performance from the first installation cycle hold an advantage that no specification sheet has ever provided.
Market Impact: Service life now runs a full 15 years

Who Controls the Margin Pool

Five manufacturers hold just 38% of luminaire and module revenue, which is low for an industry of this size and reflects that assembly barriers collapsed once packaged emitters became commodity components. Signify, Acuity Brands, Zumtobel Group, Panasonic and Opple Lighting lead. All participants here are assessed consistently on solid-state lighting luminaire and module revenue rather than on any broader electrical or building products business they also operate.
Competition in general lighting runs almost entirely on delivered price against abundant Asian assembly capacity, which has driven comparable fixture pricing down 64% across a decade. Competition in horticultural, industrial and controls applications runs on measurable performance instead, where photon efficiency, spectrum or data capability differentiate genuinely. Those are effectively two different businesses sharing a supply chain and increasingly very little else besides it.

Pressure comes from Chinese manufacturers moving up from component supply into finished luminaires and connected controls, which attacks precisely the segments that established firms had retreated into for shelter. Rankings shift wherever construction is actually happening rather than where an installed base is slowly being replaced, particularly across India, Southeast Asia and the Gulf right now.
solid-state-lighting-market-company-positioning-matrix-1789995041695

Competitive Moat and Risk Dimensions

SIGNIFY

Moat: Application And Controls Breadth

Signify holds positions across general, horticultural, outdoor and connected lighting, which lets the company retreat from price-eroded general fittings toward applications where performance is measurable. That breadth was built over decades and gives options that a single-segment manufacturer simply does not have. Assembling comparable coverage requires horticultural spectrum expertise and controls capability that general lighting firms have rarely developed internally.
SIGNIFY

Risk: General Lighting Volume Exposure

A large volume base in general lighting carries continued exposure to pricing that has fallen 64% across a decade against abundant Asian assembly capacity. Breadth provides somewhere to move toward, though it does not stop the erosion in the largest existing volume. Defending that base consumes resources that the growing applications would use considerably more productively.
ACUITY BRANDS

Moat: Specification Channel Depth

Acuity Brands holds deep relationships with electrical contractors, distributors and specifying engineers across North America, which matters because lighting is specified into projects long before anybody compares products. That channel position determines what gets written into project documentation. Building comparable relationships requires years of contractor and consultant coverage that product capability alone does not substitute for at all.
ACUITY BRANDS

Risk: Converted Market Concentration

Revenue concentrates in a North American market where commercial building stock converted early and now largely waits on 15 year service life before buying again. Construction volume is limited relative to Asia and the Gulf. Channel depth is worth most where projects are being specified, and comparatively less where an installed base is simply ageing quietly toward replacement.

Players Tracked

Prominent Players

Signify
Acuity Brands
Zumtobel Group
Panasonic
Opple Lighting

Other Key Players

OSRAM
Cree Lighting
Hubbell Lighting
Eaton Lighting
LEDVANCE
Fagerhult Group
Trilux
Glamox
NVC Lighting Technology
Foshan Electrical and Lighting
Toshiba Lighting
Nichia Corporation
Havells India
Wipro Lighting
Heliospectra

Recent Developments

APRIL 2025

Controlled Environment Growers Expand Lighting Installations

Protected growing operations across several markets expanded controlled spectrum lighting installations, capacity development rather than any corporate transaction. Those buyers evaluate lighting against crop yield rather than against building specification, and typical installations deliver around 18% production uplift measured directly against revenue rather than against estimated energy savings.
Signal: A buyer measuring crop yield rather than energy savings evaluates lighting on entirely different grounds altogether.
OCTOBER 2024

Indian Manufacturers Expand Domestic Luminaire Production

Indian lighting manufacturers expanded domestic luminaire production capacity under production incentive programmes, organic capacity expansion rather than any merger. Indian construction and rural electrification both specify solid-state lighting from new rather than converting existing installations, which removes the replacement cycle arithmetic constraining developed markets entirely.
Signal: New construction has no replacement cycle to wait for, which is exactly why growth concentrates there.
JULY 2025

Controls Suppliers Reposition Toward Building Data Applications

Lighting controls suppliers repositioned product ranges toward occupancy analytics and space utilisation rather than energy management, a commercial repositioning rather than any acquisition. Conversion already cut lighting electricity to roughly 11% of building operating cost, which leaves a considerably smaller savings pool for controls to address than a decade ago.
Signal: Efficiency gains shrank the pool that controls can save from, so the argument had to change.

What A Luminaire Costs

Packaged LED emitters account for roughly 24% of luminaire cost, sourced from a concentrated group of specialist producers that most lighting manufacturers buy from rather than compete with. Driver electronics absorb around 19%. Housing, optics and thermal management take about 27% combined, and assembly labour with logistics absorbs most of the remaining balance across very high production volumes.
Aluminium and copper pricing moved sharply through 2022 and 2023, feeding directly into housing, heat sink and wiring costs across the industry, while emitter pricing continued its long decline in the opposite direction. Signify Annual Report 2023 and Acuity Brands Annual Report 2023 both record commodity input cost and pricing pressure as principal operating variables. Manufacturers with contracted metal supply managed the period considerably better than spot buyers.

The competitive disadvantage mechanism is scale in assembly rather than component access, since everybody buys emitters from the same producers at broadly similar prices. A manufacturer running high-volume automated assembly carries a labour and overhead cost per fixture that a lower-volume competitor cannot approach. Exposure concentrates among established Western manufacturers whose volumes fell as general lighting pricing eroded, leaving fixed costs spread across fewer units.
solid-state-lighting-market-cost-volatility-analysis-1789995041893

Contract Metal Supply Across Production Years

Housing, heat sink and wiring materials run around 27% of luminaire cost combined, and aluminium and copper pricing moves considerably more than product pricing allows manufacturers to recover. Contracting metal supply across the production year removes exposure on a category already competing against pricing that fell 64%. Spot buyers cannot hold quoted pricing through any material move.

Concentrate Assembly Volume Onto Fewer Platforms

Assembly labour and overhead per fixture fall sharply with volume on a single platform, and established manufacturers frequently spread declining volume across too many product variants. Consolidating onto fewer mechanical platforms with variant differentiation in optics and drivers restores some of the scale advantage. The discipline is product management rather than manufacturing, and it is rarely popular internally with anybody.

Design Drivers For Component Substitution Early

Driver electronics absorb roughly 19% of luminaire cost and depend on semiconductor components whose availability follows cycles the lighting industry cannot influence in any way. Designing alternative components into the specification before a shortage arrives costs engineering time and preserves production when supply tightens. Manufacturers discovering mid-shortage that nothing else is qualified lose the build slot entirely.

Portfolio Architecture for Margin Defence

Margin architecture separates on whether performance differences are measurable to the buyer. General indoor luminaires earn least, competing on delivered price against abundant assembly capacity where products are genuinely interchangeable. Outdoor and roadway systems sit above on durability requirements. Horticultural lighting, controls platforms and automotive modules earn most, because each carries performance the customer measures against something they actually care about.
The volume versus premium tension is unusually stark here. General lighting carries the volume that keeps assembly lines loaded and the pricing that destroys margin. Horticultural and controls carry the margin on volumes that cannot fill a factory. Manufacturers abandoning general lighting entirely find their remaining assembly lines badly underutilised, while those defending it consume resources that the growing segments would use a great deal more productively.

High-value pools concentrate in horticultural lighting and in controls sold as building data rather than energy savings. Neither is reached through luminaire manufacturing capability. Horticultural requires spectrum and plant science understanding. Controls sold as data requires software capability and a different buyer relationship entirely. Both demand investment that a fixture manufacturer does not automatically possess or find easy to acquire.

Volume / Commodity-Adjacent

General indoor and architectural luminaires at standard specifications, competing on delivered price against abundant assembly capacity where products are genuinely interchangeable. The ten point spread separates manufacturers running high-volume automated assembly from those spreading declining volume across many variants.
Gross Margin: 14% to 24%

Premium / Certified

Outdoor, roadway and industrial high-bay systems, where durability, ingress protection and certified photometric performance determine selection alongside price. The twelve point spread tracks how much of a manufacturer's volume sits under framework contracts rather than in competitive tender by tender bidding.
Gross Margin: 28% to 40%

Sustainability / Regulatory / Next-Generation

Horticultural lighting, connected controls platforms and automotive modules, where measurable performance against yield, building data or vehicle requirements determines value rather than fixture price. The sixteen point spread reflects how much is software and application science rather than assembly.
Gross Margin: 44% to 60%
solid-state-lighting-market-portfolio-architecture-1789995042404

High-value Sub-segments and Strategic Watch-out

Horticultural And Controlled Environment Lighting

Grows at 6.9% because the buyer purchases light as a production input measured against crop revenue rather than any building specification. The sixteen point spread here reflects spectrum and plant science depth. Yield uplift near 18% gets verified directly against the grower's own production numbers.
Gross Margin: 44% to 60%

Lighting Controls And Connected Management Systems

Grows at 6.1% on an attachment rate of only around 23% across commercial installations after a full decade of industry promotion. The sixteen point spread here reflects underlying software content. Conversion already cut lighting to 11% of building cost, which shrank the savings argument considerably.
Gross Margin: 44% to 60%

Outdoor And Roadway Lighting Systems

Grows at only 4.8% on municipal programmes and new construction, frequently funded through energy performance contracts across public procurement routes. The twelve point spread here reflects framework contract coverage. Initial cost dominates the great majority of public tenders regardless of any service life claims made.
Gross Margin: 28% to 40%

General Indoor And Architectural Luminaires

Grows at 3.1%, slowest of the six application classes, on a converted installed base waiting fifteen years and products that are genuinely interchangeable. The ten point spread here reflects assembly scale alone. Comparable fixture pricing has already fallen fully 64% across the past decade alone.
Gross Margin: 14% to 24%

What Holds Lighting Accounts

The annuity that funded this industry has gone and nothing has replaced it at comparable scale. An incandescent installation generated replacement revenue annually with no sales effort at all. A solid-state installation generates nothing for fifteen years. What remains is specification position: a manufacturer written into a contractor's standard product list keeps winning projects, which is a relationship annuity rather than a consumption one and behaves quite differently.
Stickiness varies enormously by application and by who evaluates. A horticultural installation tuned to a specific crop protocol is genuinely sticky, since changing spectrum means revalidating growing results. A controls platform holding years of occupancy data is similarly fixed. A general indoor luminaire is not sticky at all, and the next project goes to whoever quoted lowest on a compliant specification that any competent manufacturer can meet.

The buyer varies more than in most categories, which is why so many manufacturers serve one part badly. A facilities manager replaces fittings against a maintenance budget. A grower buys against crop yield. A project contractor installs whatever the consultant specified. A real estate function buys controls for building data. Manufacturers organised around one of these are effectively invisible to the other three.
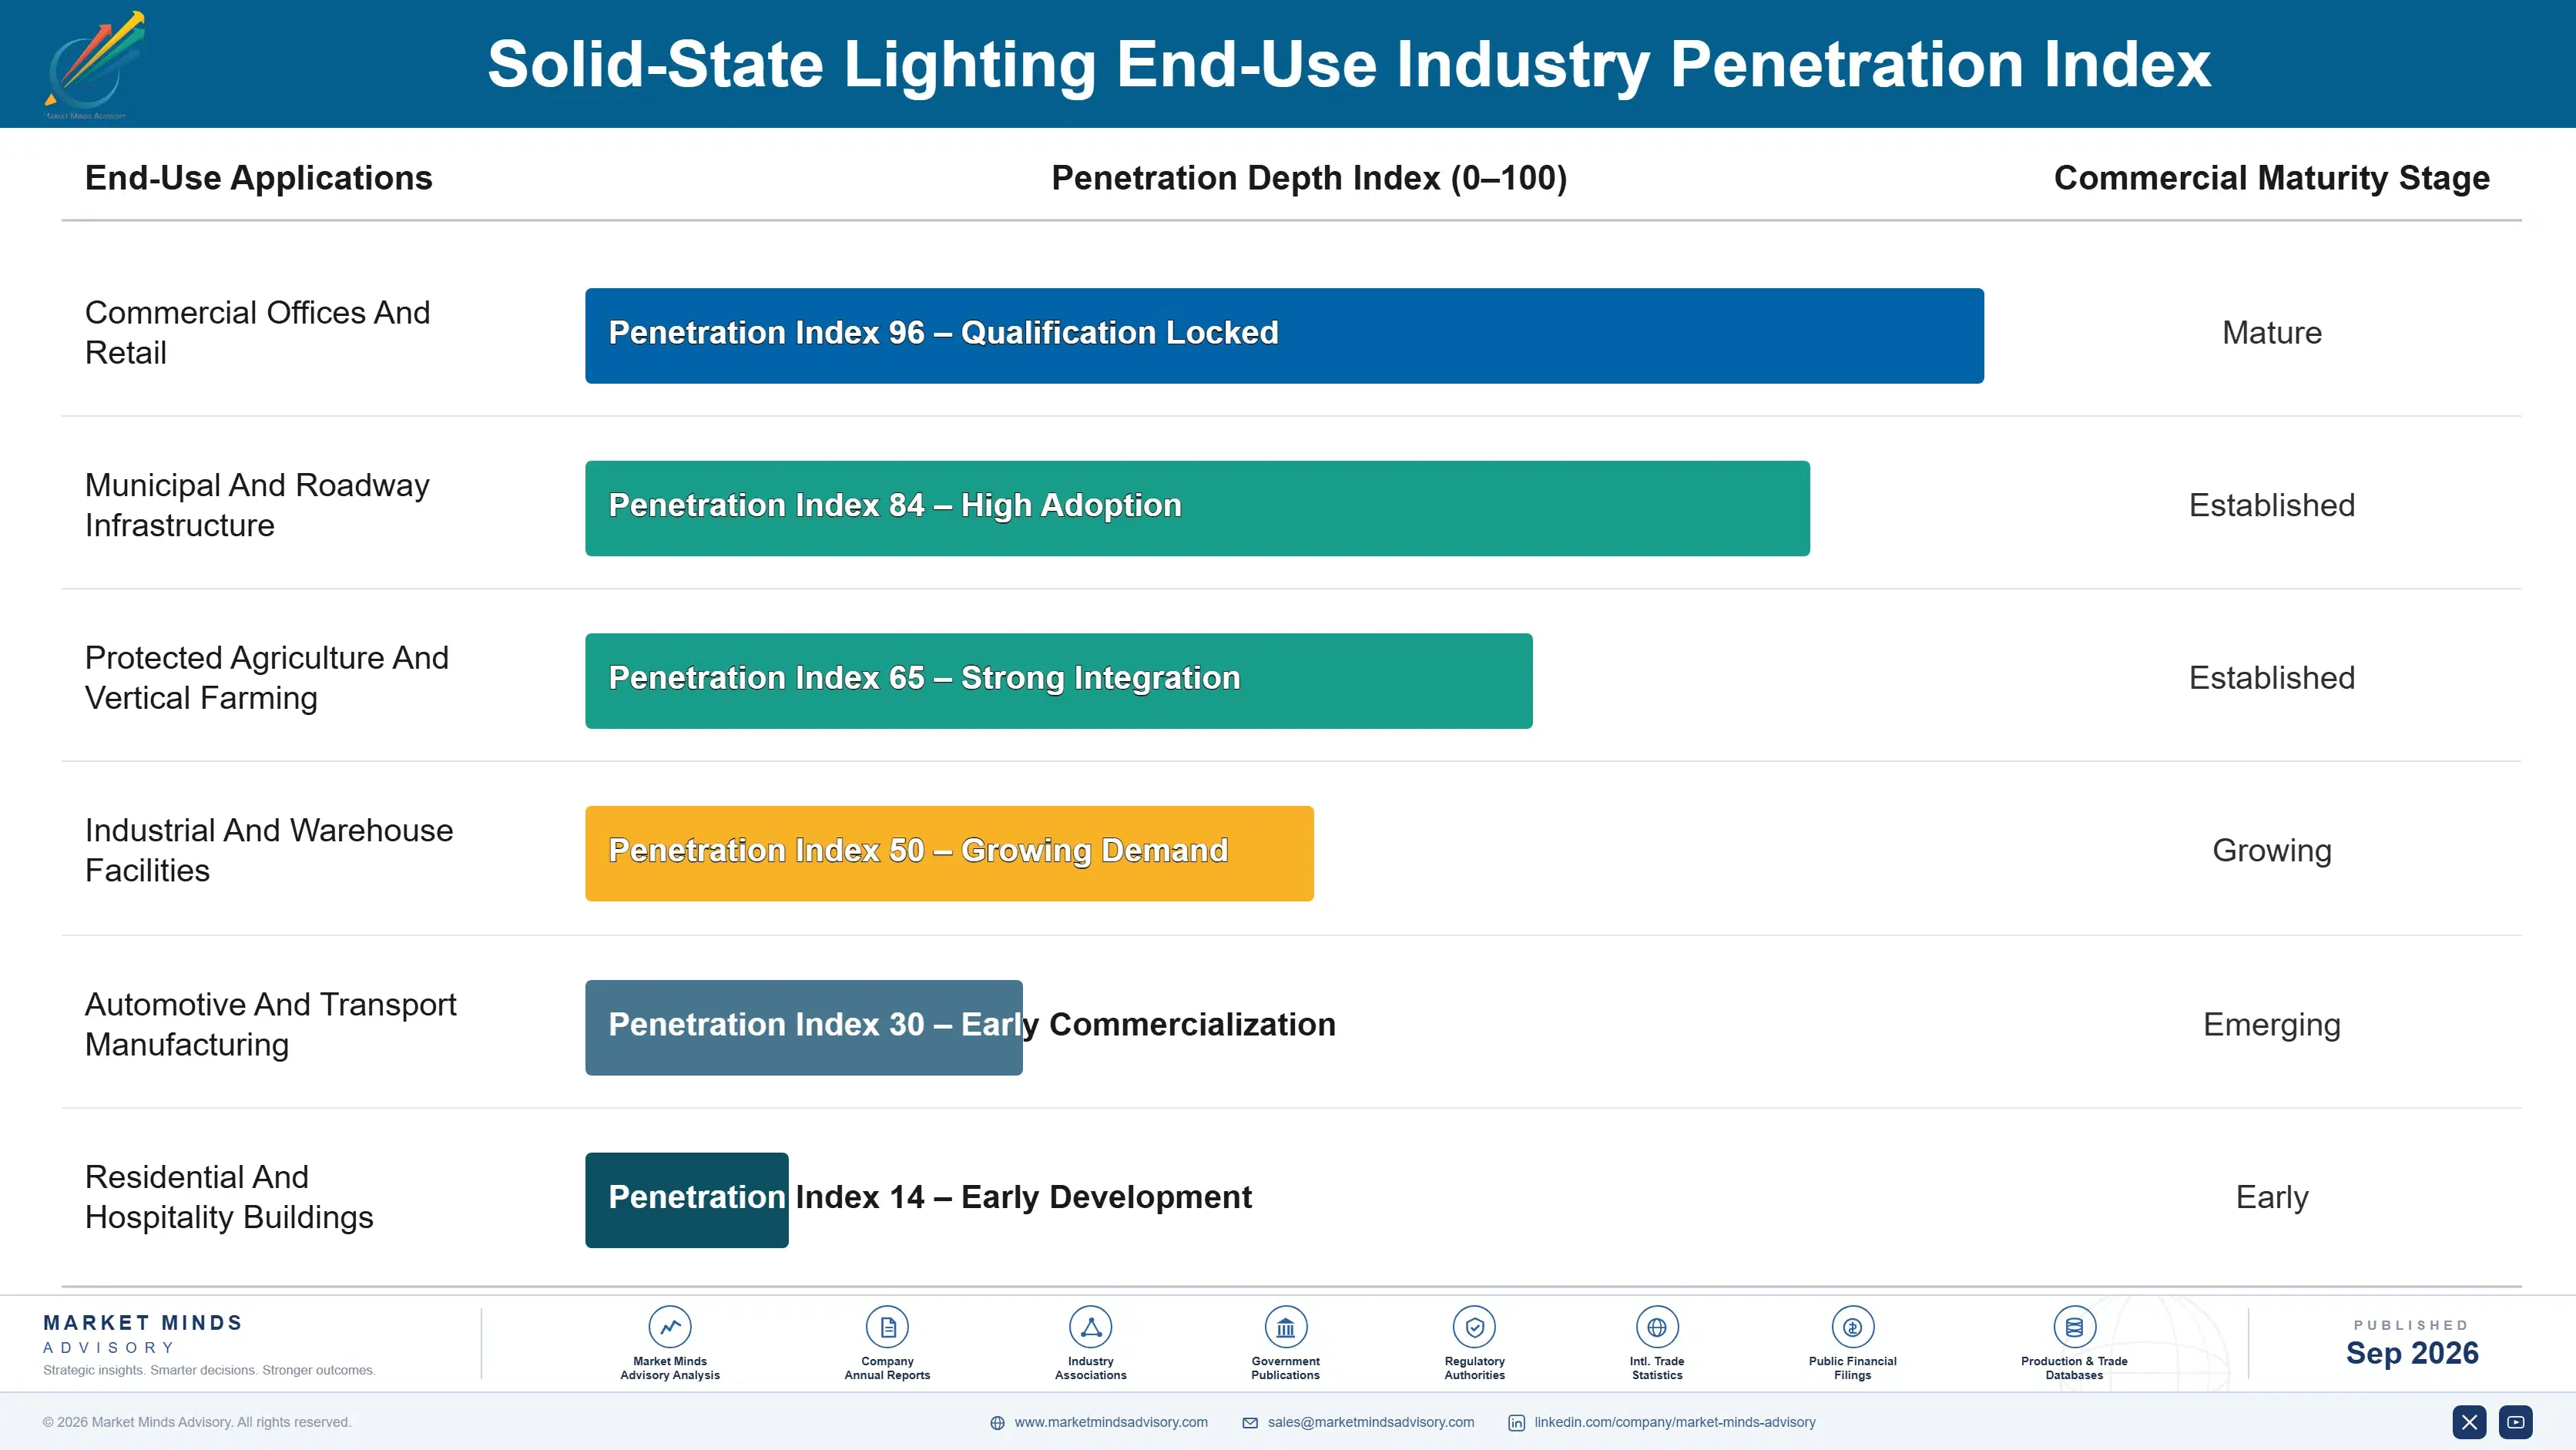
solid-state-lighting-market-end-use-penetration-index-1789995042898

What Decides Lighting Position

These are among the four positions where our research anticipates prominent divergence between winners and laggards over the coming forecast period. Each is grounded in the demand model, the regulatory perimeter, and the announced capacity pipeline.
01 / PRODUCTION APPLICATION FOCUS

Sell Light That Produces Measurable Output

A horticultural buyer purchasing roughly 18% yield uplift evaluates the whole installation against crop revenue, and price erosion in that segment has been a great deal gentler than in general lighting, because performance differences genuinely matter to the outcome achieved. The same pattern holds right across industrial inspection, aquaculture and specialist medical applications too. Manufacturers still selling general fittings compete against abundant Asian assembly capacity on delivered price alone, which is a contest that gets measurably harder with every passing year.
02 / CONTROLS ARGUMENT REPOSITIONING

Stop Selling Controls On Energy Savings

Connected lighting controls attach to only around 23% of commercial installations today, because solid-state conversion had already cut lighting electricity to roughly 11% of total building operating cost and the remaining savings pool is genuinely small. Occupancy analytics, space utilisation and asset tracking all sell instead to real estate and operations functions holding different budgets and considerably less scepticism about payback claims. Manufacturers still leading with energy savings arguments are arguing over a number that keeps shrinking beneath them every year.
03 / CONSTRUCTION MARKET COVERAGE

Follow Buildings, Not Maintenance Budgets

India compounds at 8.4% annually and Gulf construction keeps adding building stock that specifies lighting from new, which is a purchase entirely unaffected by any of the service life arithmetic constraining developed markets. Specification here happens through electrical contractors, consultants and project designers rather than through any facilities replacement budget that somebody manages internally. Manufacturers organised around refurbishment selling reach entirely the wrong function in those markets, and they frequently arrive well after the project specification has already been written into the documentation.
04 / REPLACEMENT WAVE READINESS

Meet Buyers Holding Fifteen Years Of Data

Installations converted a decade or more ago are now reaching the end of their service life at around 15 years, and a great many of them used components that underperformed their published ratings quite badly in practice. That customer already knows exactly what they are buying, holds measured performance data from the first installation, and negotiates considerably harder than they did the first time. Manufacturers whose original products underdelivered will now face that measured data directly across the negotiating table.

Engagement Snapshot From the Field

A live engagement with an industry participant carrying material or product regulatory and market exposure ahead of a defining policy shift, showing how our research translates into a defensible multi-year portfolio strategy.
MARKET MINDS ADVISORY · CLIENT ENGAGEMENT SUMMARY
Solid-State Lighting Producer Strategic Portfolio Review and Transition Roadmap 2026·Investment Scenario on Solid-State Lighting Exposure Evaluation 2025-26
CLIENT PROFILE
A commercial property group managing forty office and retail buildings across two countries, having converted every site to solid-state lighting between eight and twelve years ago. Maintenance spending on lighting had fallen to almost nothing, and the facilities function had no basis for the capital request it was now preparing for the first replacement cycle.
STRATEGIC CHALLENGE
Facilities wanted to replace on a fixed schedule based on nominal service life. Finance saw no failures and no obvious reason to spend. A separate proposal to add connected controls had been rejected twice on energy payback grounds, and nobody had tested whether the controls case might work on entirely different terms.
MMA APPROACH
MMA measured actual light output across a sample of installations against their original specifications to establish real rather than nominal degradation. We separated buildings by installation vintage and component quality, and reassessed the controls proposal against occupancy and space utilisation value rather than energy savings. Work drew on 47 expert interviews conducted in Q4 2025 with property groups and manufacturers.
KEY FINDINGS
  1. Around 3 in 10 installations had degraded well beyond their published ratings, concentrated entirely in the two earliest conversion vintages using cheaper components.
  2. The remaining installations were performing close to specification and had no operational case for replacement on any schedule the facilities team had proposed.
  3. Controls justified on space utilisation data rather than energy savings produced a return the property function accepted immediately (client-reported, unverified by MMA).
  4. Energy savings from controls would have amounted to a very small share of building operating cost, which is why finance had rejected the case twice.
CLIENT PROFILE
A commercial property group managing forty office and retail buildings across two countries, having converted every site to solid-state lighting between eight and twelve years ago. Maintenance spending on lighting had fallen to almost nothing, and the facilities function had no basis for the capital request it was now preparing for the first replacement cycle.
STRATEGIC CHALLENGE
Facilities wanted to replace on a fixed schedule based on nominal service life. Finance saw no failures and no obvious reason to spend. A separate proposal to add connected controls had been rejected twice on energy payback grounds, and nobody had tested whether the controls case might work on entirely different terms.
MMA APPROACH
MMA measured actual light output across a sample of installations against their original specifications to establish real rather than nominal degradation. We separated buildings by installation vintage and component quality, and reassessed the controls proposal against occupancy and space utilisation value rather than energy savings. Work drew on 47 expert interviews conducted in Q4 2025 with property groups and manufacturers.
KEY FINDINGS
  1. Around 3 in 10 installations had degraded well beyond their published ratings, concentrated entirely in the two earliest conversion vintages using cheaper components.
  2. The remaining installations were performing close to specification and had no operational case for replacement on any schedule the facilities team had proposed.
  3. Controls justified on space utilisation data rather than energy savings produced a return the property function accepted immediately (client-reported, unverified by MMA).
  4. Energy savings from controls would have amounted to a very small share of building operating cost, which is why finance had rejected the case twice.
RECOMMENDED STRATEGY
Phase 1: Phase one: replace only the two earliest conversion vintages where measured output had degraded well beyond published ratings, rather than replacing on schedule. Phase 2: Phase two: rebuild the controls case entirely on space utilisation data for the property function, since energy payback had already failed twice. Phase 3: Phase three: measure output annually across all sites so future replacement decisions rest on evidence rather than on nominal service life assumptions.
OUTCOME
The property group replaced two vintages rather than the whole estate and approved controls on space utilisation grounds (client-reported, unverified by MMA). Capital spending fell substantially against the original schedule-based proposal. Light output is now measured annually across every site, which is the change that outlasted the engagement itself.

Frequently Asked Questions

Foundational context covering the market sizes, CAGR, scope, country, region and competition that inform every finding below. This section is provided to cover basics and most often pre-purchase conversations, answered from the MMA Primary Research Dataset.

What is the current size of the Solid-State Lighting Market?

Global value reaches USD 77.9 billion in 2026, measured as luminaire and module revenue across six application classes. The 2025 base for the market is USD 74.5 billion.

How large will the Solid-State Lighting Market be by 2036?

The market reaches USD 122.1 billion by 2036, an increase of USD 44.2 billion across the forecast period. That represents 1.57 times expansion from the 2026 base.

What is the CAGR for the Solid-State Lighting Market 2026 to 2036?

The base case runs at 4.6% annually, with a bull case at 5.8% if the first replacement wave arrives early and a bear case at 3.4% if price erosion continues at the pace of the past decade.

Which segment is growing fastest?

Horticultural and controlled environment lighting grows at 6.9%, half again the market rate of 4.6%. Those buyers purchase light as a production input measured against crop revenue.

Who are the major companies in the Solid-State Lighting Market?

Signify, Acuity Brands, Zumtobel Group, Panasonic and Opple Lighting lead on luminaire and module revenue, together holding 38%. OSRAM, LEDVANCE and Havells India hold smaller positions.

Which country is growing fastest?

India leads at 8.4%, on construction volume and rural electrification proceeding at the same time rather than on any replacement demand. Vietnam and Saudi Arabia follow.

Report Segmentation Architecture

The full report scope spans multiple orthogonal segmentation dimensions, with cross-tabulated demand data provided for each dimension pair. Coverage extends further to regional breakdowns, trend trajectories, and the competitive detail needed to support segment-level decision-making.

By Application Class

  • Horticultural And Controlled Environment Lighting
  • Lighting Controls And Connected Management Systems
  • Outdoor And Roadway Lighting Systems
  • Industrial And High-Bay Lighting
  • Automotive And Transport Lighting Modules
  • General Indoor And Architectural Luminaires

By End-Use Industry

  • Commercial Offices And Retail
  • Municipal And Roadway Infrastructure
  • Protected Agriculture And Vertical Farming
  • Industrial And Warehouse Facilities
  • Automotive And Transport Manufacturing
  • Residential And Hospitality Buildings

By Commercial Dimension

  • Project Specification Through Consultants
  • Electrical Contractor And Distributor Channel
  • Direct Manufacturer Supply
  • Public Procurement And Framework Contracts
  • Energy Performance Contract Delivery
  • Retail And Online Channel

By Region

  • North America
  • Western Europe
  • East Asia
  • South Asia and Pacific
  • Latin America
  • Middle East and Africa
  • Eastern Europe

Scope, Methodology, and Coverage

Every figure in this report is reproducible from documented input assumptions. The scope below maps the historical period, the forecast horizon, the segmentation dimensions, and the countries covered, alongside the underlying primary and qualitative methodology.
Historical Period
2020 to 2025
Forecast Period
2026 to 2036
Base Year
2025 (USD billions; MMA Primary Research Dataset, September 2026)
Market Definition
This report covers solid-state lighting products by application class: general indoor and architectural luminaires, outdoor and roadway lighting systems, horticultural and controlled environment lighting, industrial and high-bay lighting, automotive and transport lighting modules, and lighting controls with connected management systems. It excludes LED chips and packaged emitters sold as components, display backlighting, conventional lamp technologies, ultraviolet and infrared emitters for non-illumination use, and electrical installation work.
Quantitative Units
USD millions, luminaire and module revenue basis; shipped units; service life in years; cumulative price decline as a percentage; controls attachment rate as a percentage; yield uplift in protected growing as a percentage.
Segmentation Dimensions
Application class; end-use sector; commercial specification and supply route; geography across seven regions.
Regions Covered
North America, Western Europe, East Asia, South Asia and Pacific, Latin America, Middle East and Africa, Eastern Europe
Countries Covered
China, Japan, South Korea, Taiwan, India, Vietnam, Indonesia, Australia, United States, Canada, Mexico, Brazil, Colombia, Germany, Netherlands, Sweden, United Kingdom, Poland, Saudi Arabia, South Africa.
Key Companies Profiled
Signify, Acuity Brands, Zumtobel Group, Panasonic, Opple Lighting, OSRAM, Cree Lighting, Hubbell Lighting, Eaton Lighting, LEDVANCE, Fagerhult Group, Glamox, NVC Lighting Technology, Havells India, Heliospectra.
Quantitative Methodology
Primary survey, n=3,800 respondents, Q4 2025, six countries; demand-side model with trade association cross-validation
Qualitative Methodology
47 expert interviews, Q4 2025; applied to validate demand model assumptions, identify emerging dynamics, and assess competitive positioning
Report Format
PDF and XLSX data workbook (Word format preview document)
Publisher
Market Minds Advisory
Report Code
MMA-2026-CON-761
Published
September 2026
Contact
sales@marketmindsadvisory.com | www.marketmindsadvisory.com

Purchase the full Solid-State Lighting Market Report (2026 to 2036).

This report sizes the global solid-state lighting market from 2026 to 2036 across six application classes, six end-use sectors and seven regions. It explains why an industry that won its technology argument completely destroyed the replacement revenue that had funded it for a century, with service life stretching to fifteen years and comparable fixture pricing down 64% across a decade. Controls attachment at only 23% is analysed against lighting electricity now representing roughly 11% of building operating cost. Cost composition is sourced to company annual reports. Regional analysis explains why East Asia holds 41% of value.
Six application classes sized through to 2036
Replacement cycle economics quantified against historical lamp revenue
Controls attachment assessed against shrinking energy savings pools
Twenty named manufacturers assessed on luminaire revenue
Four revenue levers with quantified commercial impact
Anonymised property group lighting strategy engagement documented fully

Built For The People Who Decide

From boardroom strategy to bench-side execution, this report is read cover-to-cover by leaders shaping the next decade of their industry, turning demand scenarios, market dynamics and valuation benchmarks into decisions.
CXOs/ Presidents/ VPs/ Managers
M&A and Corporate Development
Strategy Teams and R&D Heads
Procurement and Product Directors
Regulatory and Compliance Leaders
Investor Relations and Equity Analysts