Market Minds Advisory
Solar PV Module Market

Solar PV Module Market: Solar PV Module Market: Gigawatts Rise, Dollars Do Not

Gigawatts keep rising and dollars barely move, because prices fell sixty two percent while volume grew. Anybody forecasting this market from installation figures is going to be badly wrong about it.

Lead Analyst

Published

September 2026

Make Smarter Decisions with Customized Research Insights

Request a free sample report and evaluate market opportunities, growth trends, and competitive dynamics relevant to your business needs.

2025 MARKET VALUE$66.0BMarket Size 2025
2036 FORECAST VALUE$117.7BBase Case , 2026 to 2036
CAGR 2026 TO 20365.4 %Bull 6.6% / Bear 4.2%
INCREMENTAL OPPORTUNITY$48.1BNet 10- year value creation
EXPANSION MULTIPLE1.69x2036 value over 2026 base
Strategic Levers
M&A Pipeline
Regional Outlook
Country Rankings
Competitive Intelligence
Segmental Deep-dive
Call-Us : 91 93563 13602

Executive Snapshot and Market Trajectory.

Module shipments grow at double digits and module revenue grows at 5.4%, because prices have fallen 62% from their peak while volume expanded. Anybody reasoning from gigawatts to dollars in this market reaches a number wrong by a considerable multiple every single time.
TOPCon monocrystalline modules grow at 8.1%, half again the market rate of 5.4%, having displaced PERC from dominance to obsolescence in roughly three years and stranded 180 gigawatts of manufacturing capacity in the process. East Asia holds 38% of demand, far outside any normal band, because China both manufactures most of the world's modules and installs an enormous share of them. No technology transition in this industry has ever moved quite that fast.
Concentration is high at 57% of gigawatts shipped and the industry has been losing money at that scale for years, with a weighted operating margin around negative 4%. Consolidation is the textbook outcome and it keeps not arriving, because local employment considerations sustain capacity that no commercial logic would keep running. Trade policy has meanwhile split a single global market into three separate price zones for an identical product.
Market Definition
The solar photovoltaic module market covers assembled modules supplied for electricity generation, segmented by cell architecture across TOPCon monocrystalline modules, heterojunction modules, back-contact modules, thin film cadmium telluride modules, PERC monocrystalline modules, and perovskite tandem and emerging modules. Scope is measured as module revenue at the point of sale into project and distribution channels. Excluded are polysilicon, ingot, wafer and cell production sold as intermediate products, inverters and balance of system equipment, mounting structures and trackers, project development and installation services, and building integrated photovoltaic assemblies sold as construction materials.
Base Year Value
$66.0B in 2025 (MMA Primary Research Dataset, September 2026)
Forecast Period
2026 to 2036, eleven discrete annual values
CAGR
5.4% base case. Bull 6.6%. Bear 4.2%.
Fastest Growth Segment
TOPCon Monocrystalline Modules: 8.1% CAGR
Fastest Growth Country
India: 7.4% CAGR
Fastest Growth Region
South Asia and Pacific: 7.4% CAGR
Largest Region
East Asia: 38% of 2025 global value
Market Leaders
LONGi Green Energy, JinkoSolar, Trina Solar, JA Solar and Canadian Solar. Source: MMA Analysis, July 2026.
Primary Survey
n=3,800 procurement and R&D decision-makers, Q4 2025, six countries
Methodology
Demand-side build-up, cross-validated against public data, 47 expert interviews

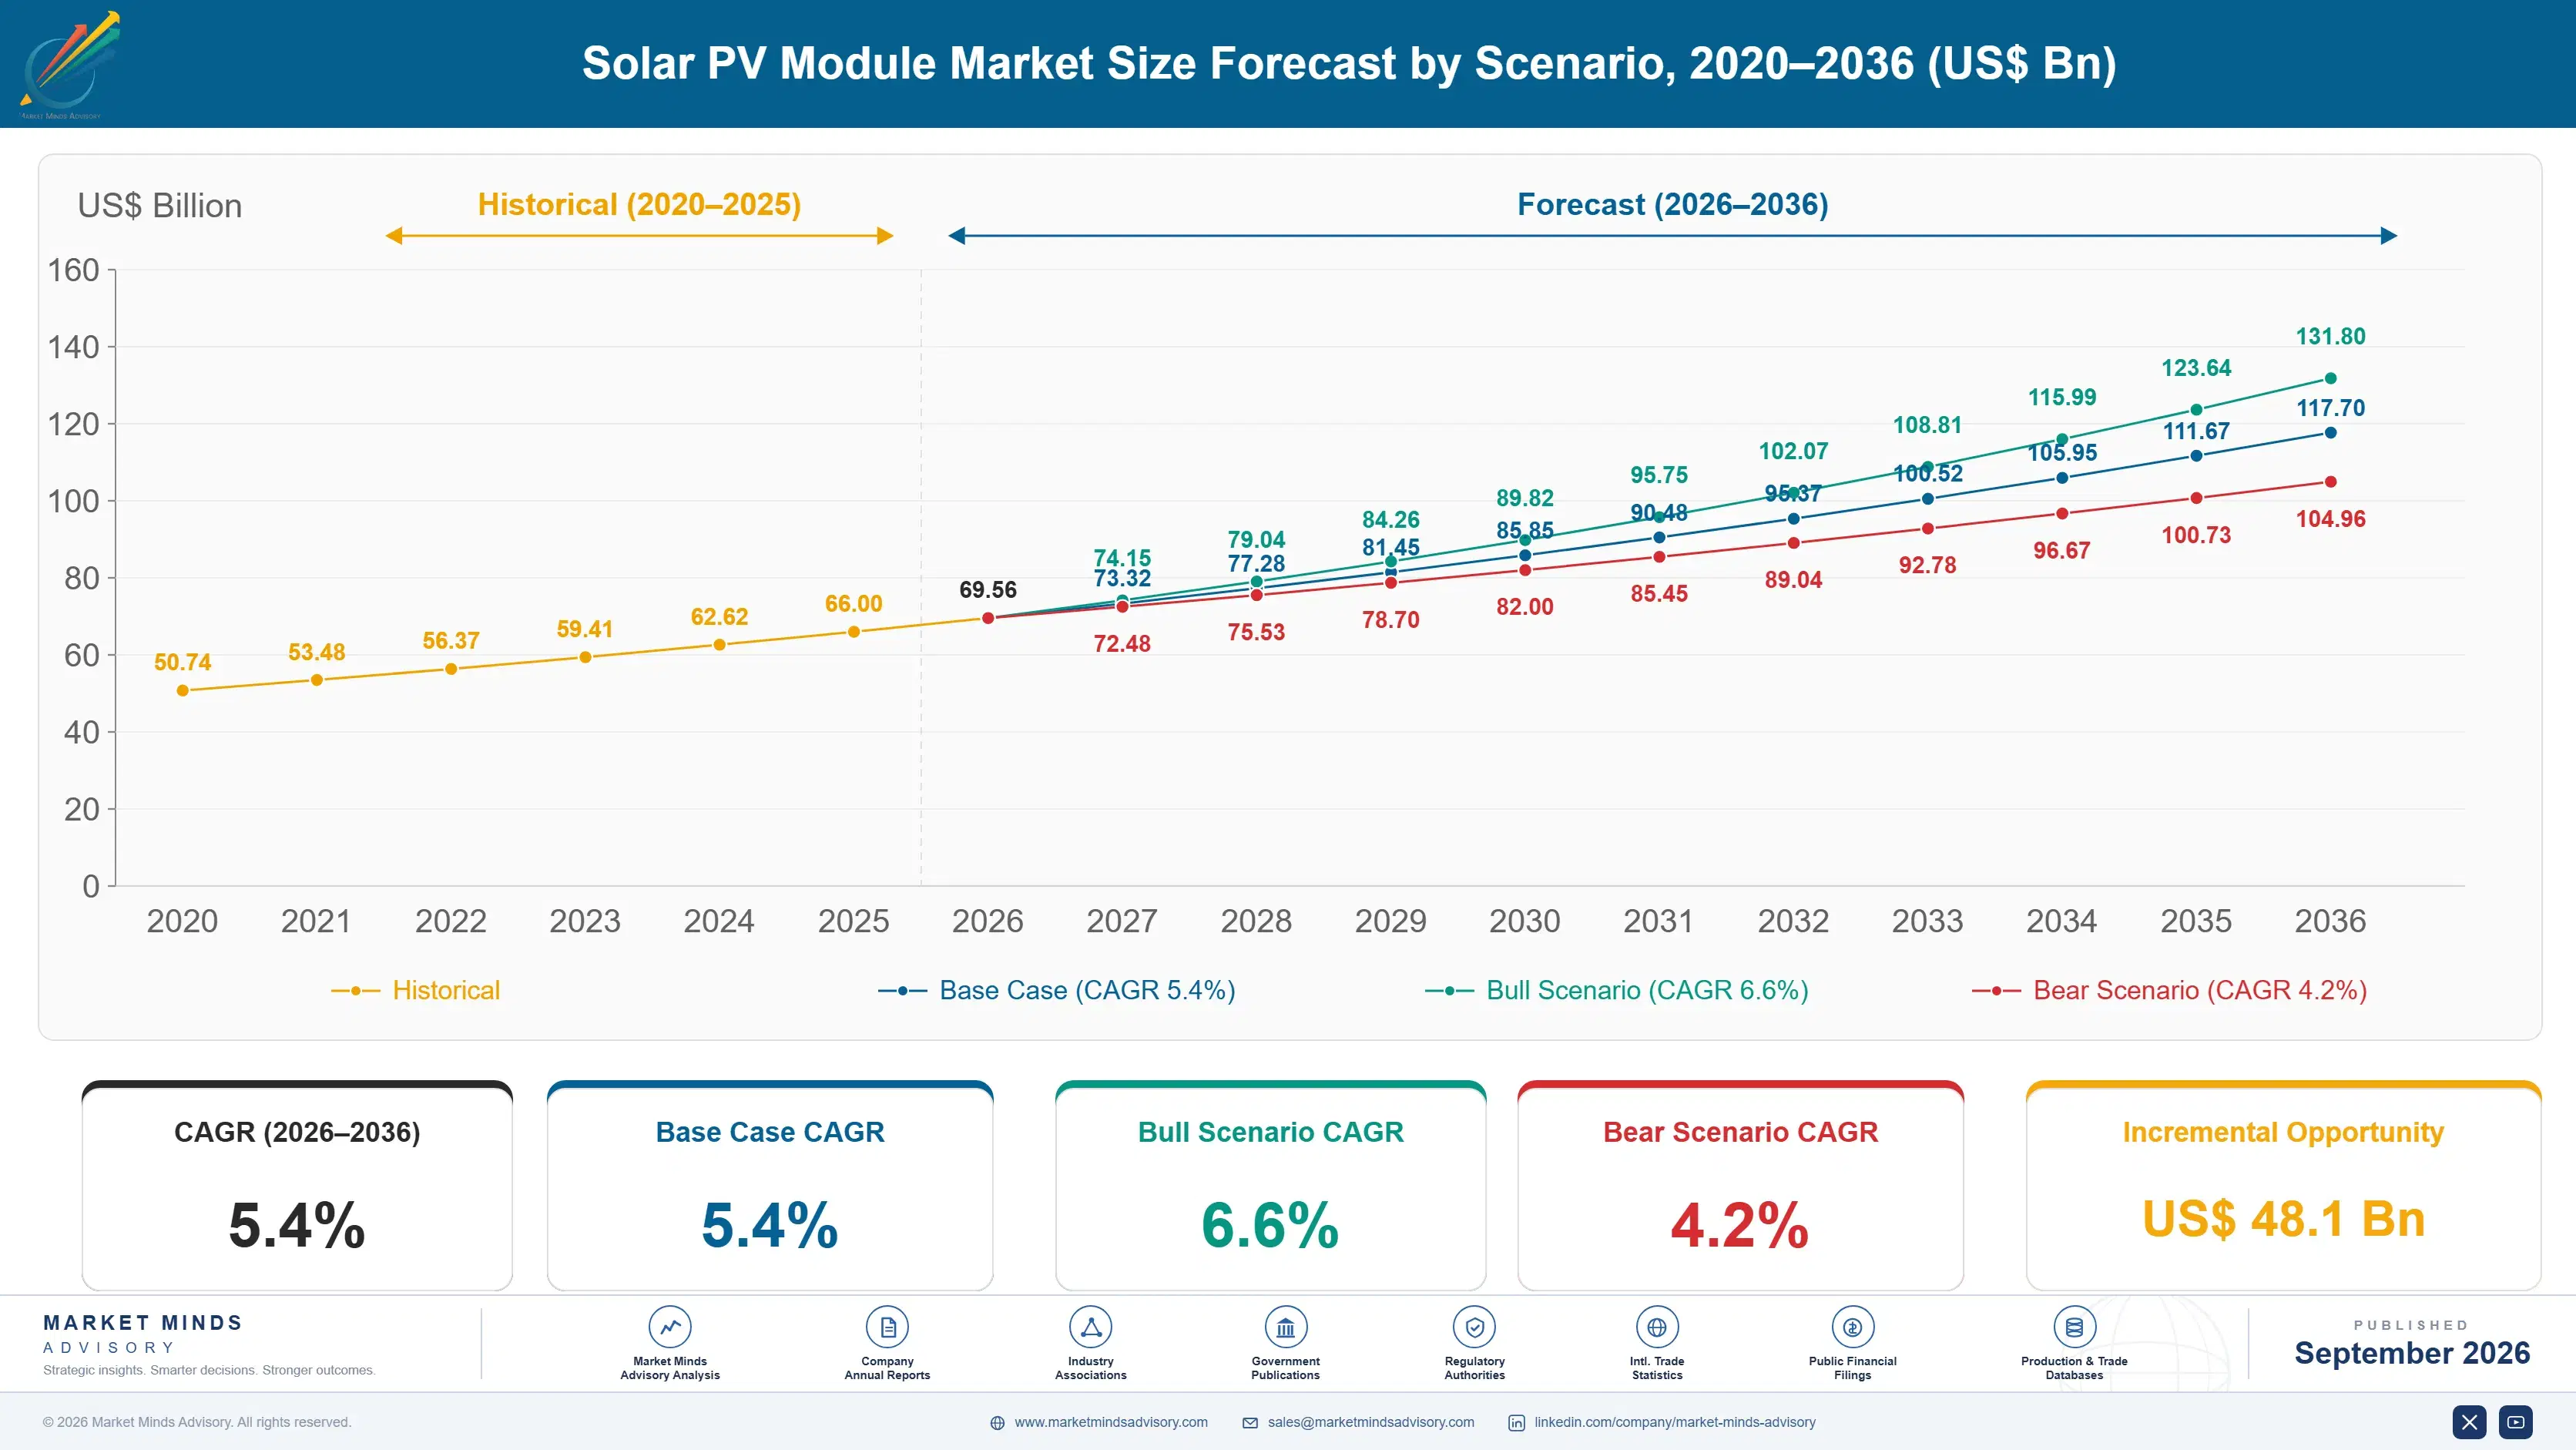
Solar PV Module Market Forecast Scenarios

solar-pv-module-market-size-forecast-scenario-1788255541293
Between 2020 and 2025 module revenue compounded at just 4.2% while shipments roughly tripled, which is the entire story of this industry in two numbers. Polysilicon and capacity expansion overshot demand badly, prices collapsed, and manufacturers shipped record volumes into losses. The technology transition from PERC to TOPCon happened in the middle of that, stranding capital that had not finished depreciating.
The 5.4% base case rests on three mechanisms. Installation volume keeps growing on economics that no longer need subsidy in most markets, which supports revenue even against falling prices. Trade barriers hold pricing well above Chinese domestic levels in protected markets, which lifts the revenue those gigawatts represent. And architecture transitions keep raising the value of the newest product against the old. None of the three requires module prices to recover.
The bull case at 6.6% turns on consolidation finally removing capacity and allowing prices to stabilise, which the industry has expected for three years without it happening. The bear case at 4.2% is the same capacity persisting: local support sustaining loss-making plants keeps supply ahead of demand and prices falling faster than volume grows, exactly as it has done recently.

Three Prices, One Product

The most common error in analysing this market is reasoning from installation gigawatts to module revenue. Shipments have grown at double digits for years while prices fell 62% from peak, so revenue growth is a fraction of volume growth and the two move almost independently. A forecast built on capacity additions and a stable price assumption produces a figure that is wrong by a large multiple.
TOP FIVE CONCENTRATION57%Share of gigawatts shipped held by five largest manufacturers
AVERAGE SELLING PRICEUSD 0.11/WMean module price per watt across all global markets
PRICE FALL62%Decline in module pricing measured from the recent peak
UNITED STATES PRICE MULTIPLE3.1 timesAmerican pricing against Chinese domestic levels for equivalent product
INDUSTRY OPERATING MARGIN-4%Weighted average margin across the largest listed manufacturers
PERC CAPACITY STRANDED180 GWManufacturing capacity obsoleted by the recent architecture transition
Trade policy has broken a genuinely global commodity into three separate markets. American module pricing runs around 3.1 times Chinese domestic levels for equivalent product, sustained by tariffs, anti-dumping duties, import restrictions and domestic content incentives operating together. European pricing sits between the two. The physical product is identical, the manufacturers are frequently the same, and the revenue per gigawatt differs enormously by destination.
The industry has been unprofitable at scale for an extended period and continues operating, with a weighted operating margin around negative 4% across the largest listed manufacturers. In any other sector that would force closures and consolidation within a year or two. Local employment considerations and provincial support have sustained capacity that commercial logic would have removed, which is why the price floor keeps failing to arrive.
"Every forecast I read multiplies gigawatts by a price that stopped being true two years ago. The interesting question in this business is not how much gets installed, it is what a watt is worth in the country where it lands."
Director, Solar Value Chain Practice · MMA Energy Practice · September 2026

Market Trends

Architecture transition moved faster than depreciation

TOPCon displaced PERC from clear dominance to effective obsolescence in roughly three years, which is faster than any previous transition in this industry and considerably faster than the equipment installed to make PERC cells could be depreciated. Around 180 gigawatts of manufacturing capacity was stranded in the process, much of it built within the preceding five years. TOPCon modules now grow at 8.1% against a market rate of 5.4%. Manufacturers who moved late carry both the write-down and a product customers increasingly will not specify at any price. Nobody depreciates a line properly now.
Market Impact: Grows without any of 3 subsidies

Trade policy created three separate price zones

Tariffs, anti-dumping and countervailing duties, import restrictions and domestic content incentives have together produced American module pricing around 3.1 times Chinese domestic levels for physically identical product, with European pricing sitting between them. That fragmentation is deliberate industrial policy rather than a market failure, and it means revenue per gigawatt now depends more on where a module lands than on what it is. Manufacturers with qualifying production in protected markets earn multiples of what the same output would earn elsewhere. Revenue per gigawatt now depends more on where a module lands than on anything about the module itself.
Market Impact: Earns 3.1 times on qualifying product

Market Opportunities and Growth Drivers

Installation economics no longer need any subsidy

Solar generation is the cheapest new capacity in most of the world on unsubsidised cost, which means installation volume now responds to electricity demand, grid access and financing rather than to policy support that could be withdrawn. That decoupling took two decades and it changes the demand profile fundamentally: the volume is no longer at risk from a change of government or a budget decision in the way it was throughout this industry's history. Revenue still depends entirely on what price those gigawatts clear at. Volume is now safe and price is not.
Market Impact: Operates at negative 4% margin

Protected markets pay multiples for qualifying product

Domestic content incentives and import restrictions mean a module manufactured in a protected market earns a very large premium over identical product made elsewhere, which has driven manufacturing investment into the United States and India at costs that would never compete on open terms. Those factories exist because of the price differential rather than despite it, and the differential is policy that could change. India grows at 7.4%, the fastest of any country covered, substantially on domestic content requirements attached to public procurement. The differential is policy that could change tomorrow.
Market Impact: Obsoletes lines within 3 years

Market Restraints and Challenges

Loss-making capacity refuses to leave the market

The largest listed manufacturers have operated at a weighted operating margin around negative 4% for an extended period while continuing to ship record volumes, because provincial support, employment considerations and access to patient financing sustain plants that commercial logic would have closed. The root cause is that this is treated as an industrial policy asset rather than as a business in several jurisdictions. Commercial impact is a price floor that keeps failing to arrive. Participants are responding with cost reduction, differentiated architectures, protected market manufacturing and integration into project development.
Market Impact: Stranded 180 GW of capacity

Technology transitions strand capital faster than depreciation

PERC went from dominant to obsolete in around three years and stranded 180 gigawatts of capacity built largely within the preceding five, and heterojunction, back-contact and perovskite tandem architectures are all advancing behind TOPCon on similar timescales. The root cause is that cell efficiency improvements arrive as new architectures rather than as incremental upgrades to existing lines. Commercial impact is capital equipment written down before it earns out. Mitigation runs through modular line design, equipment upgrade paths, delayed capacity commitment and licensing rather than owning production. Nobody gets a full depreciation cycle.
Market Impact: Produces a 3.1 times price gap
3 additional market trends, 4 additional growth drivers, and 2 additional restraints and challenges are covered in the full report. Contact sales@marketmindsadvisory.com to access the complete intelligence.

Segment CAGR and Growth Architecture

Segmentation follows cell architecture, the dimension on which efficiency, manufacturing capital and obsolescence risk all move together. PERC and thin film carry declining volume on installed capacity that is being written down. TOPCon and emerging tandem architectures carry the growth, because efficiency gains arrive as new architectures rather than as upgrades to old ones.
solar-pv-module-market-market-share-analysis-1788255541890

TOPCon Monocrystalline Modules

TOPCon monocrystalline modules grow at 8.1%, half again the market rate of 5.4%, having become the industry default in about three years through an efficiency advantage over PERC that manufacturing scale then made cheap. The transition stranded around 180 gigawatts of PERC capacity, much of it commissioned within five years of being obsoleted, which is a capital destruction rate this industry has normalised in a way no other manufacturing sector would. TOPCon is now the volume architecture and it faces exactly the same risk from heterojunction and back-contact designs advancing behind it. Nobody in this business gets to depreciate a production line over its useful mechanical life any more. That is normalised here.
CAGR 8.1%

Perovskite Tandem and Emerging Modules

Perovskite tandem and emerging architectures at 7.8% represent very small volumes against enormous attention, because stacking a perovskite layer above a silicon cell raises theoretical efficiency well beyond what silicon alone can reach. Laboratory results have advanced quickly and commercial deployment has not, since long-term stability under heat, humidity and ultraviolet exposure remains the unresolved problem and warranty periods run twenty five years. Manufacturers are building pilot lines rather than committing volume capacity. The commercial question is not whether the efficiency is real but whether a module lasts, and no amount of laboratory data settles a twenty five year warranty question quickly. Laboratory data does not settle a twenty five year warranty question quickly enough for anybody financing a project.
CAGR 7.8%
Full segment breakdown across 6 segments available in the complete report.

Regional Architecture and Country Demand Map

East Asia takes 38%, far outside any normal band, because China manufactures most modules and installs an enormous share. Western positions sit below band on volume and above on price. Volume and value point in opposite directions on this map, which is why gigawatt shares mislead so badly.

East Asia

A 38% share far outside any normal band reflects a region that both makes and installs more than everywhere else combined. Chinese manufacturing produces the overwhelming majority of world module output across an integrated supply chain running from polysilicon through to assembly, and Chinese installation volume is larger than any other market by a wide margin. Domestic pricing sits at the bottom of the global range because supply exceeds demand persistently and capacity does not exit. Japanese and Korean manufacturing has largely withdrawn from volume production. Growth at 6.0% reflects enormous volume meeting the lowest prices anywhere in the world. Supply and demand both concentrate here, which sets the world price.
Share: 38% | CAGR: 6.0% (2026 to 2036)

North America

The 16% share sits far below the usual band on volume and considerably above it on value, which is the whole story of this region. Module pricing runs around 3.1 times Chinese domestic levels for physically identical product, sustained by tariffs, duties, import restrictions and domestic content incentives working together. That premium has driven manufacturing investment into American assembly and increasingly into cell production, at costs that would never compete on open terms. First Solar's thin film position is genuinely domestic and unusual. Growth at 6.4% reflects installation volume rising against pricing that policy rather than markets determines. Policy rather than markets sets the price here. Manufacturing follows the incentive rather than the cost curve here.
Share: 16% | CAGR: 6.4% (2026 to 2036)
Regional intelligence for 5 additional markets available in the complete report: Western Europe, South Asia and Pacific, Latin America, Middle East and Africa, Eastern Europe. Contact sales@marketmindsadvisory.com.
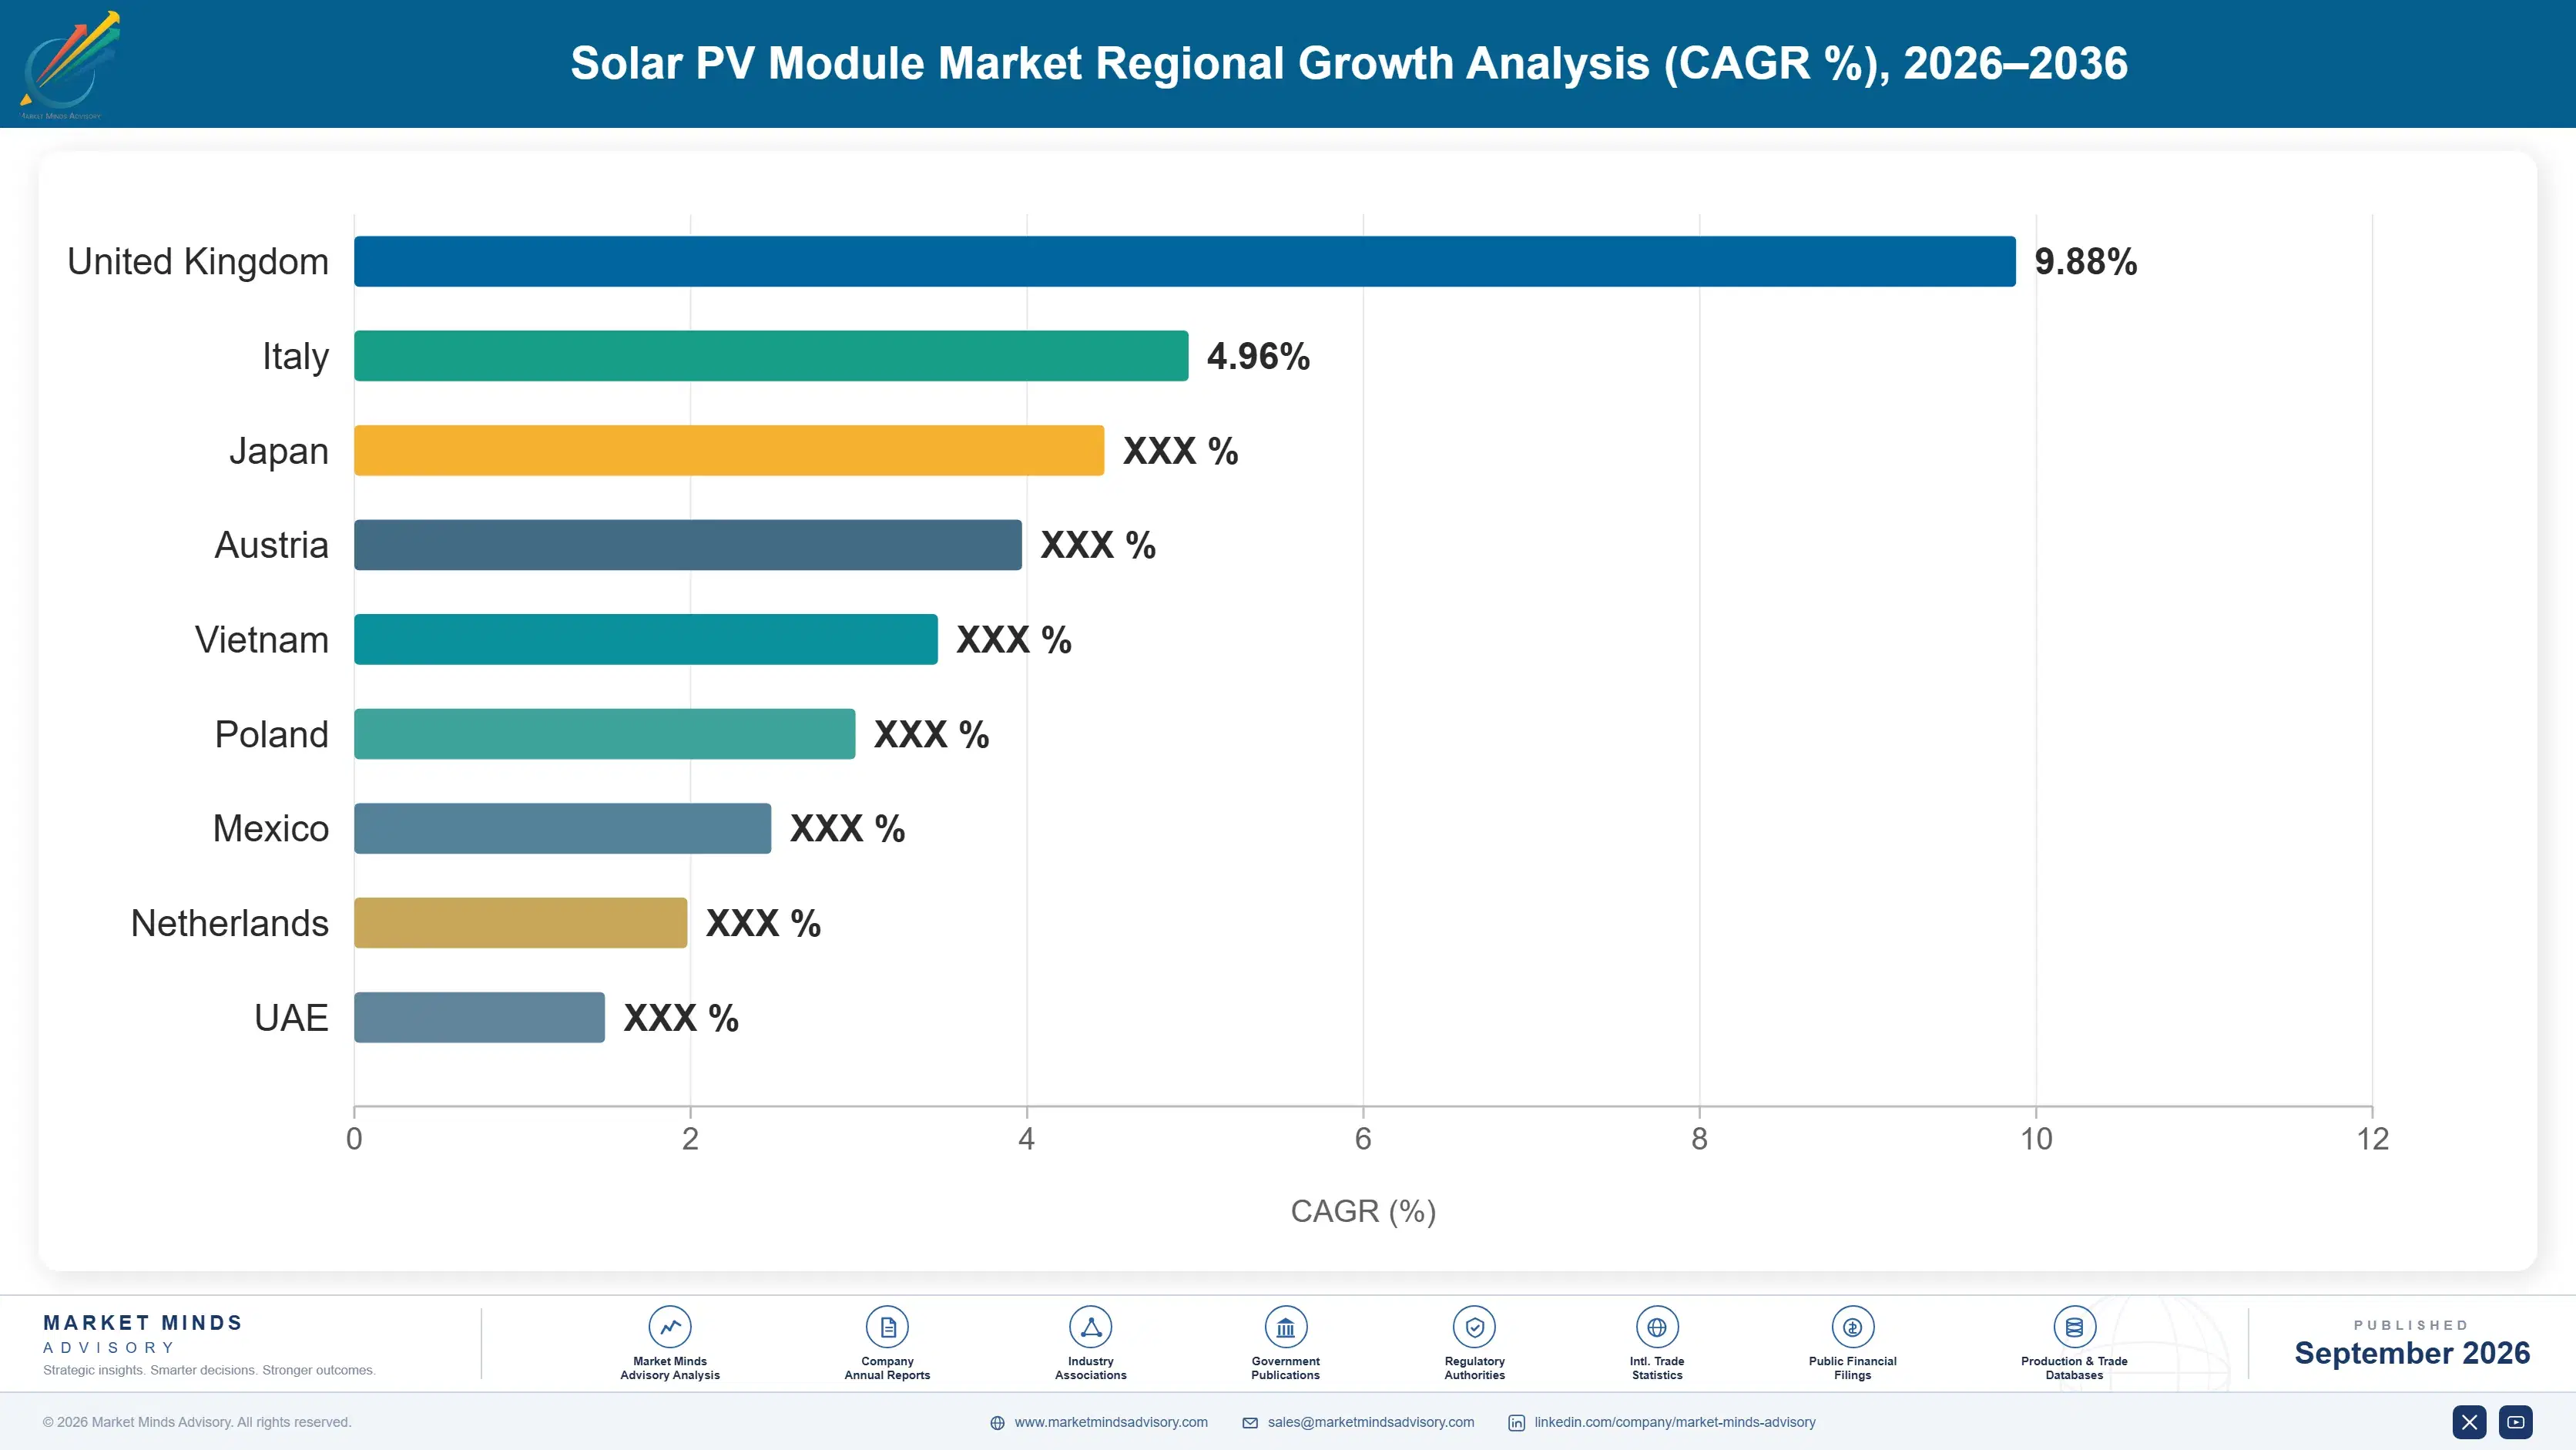
solar-pv-module-market-country-cagr-analysis-1788255542432

Four Moves In A Falling Market

None of these four is about making a better module, because efficiency gains arrive as architectures the whole industry adopts within two years. Each works on the fact that a watt is worth three times more in one country than another, and that capital keeps being written off early. Two are capital allocation decisions.

Manufacture inside the protected price zones

American module pricing runs around 3.1 times Chinese domestic levels for physically identical product, sustained by tariffs, duties and domestic content incentives that show every sign of persisting. A manufacturer with qualifying production inside that zone earns a multiple of what the same output earns elsewhere, which is why factories are being built at costs that would never compete on open terms. The exposure is that the differential is policy rather than economics. That is a risk worth taking while the policy holds. Worth taking while it holds. Policy rather than economics sets it.
Market Impact: Earns 3.1 times more on identical manufactured output

Design lines for the next architecture transition

PERC went from dominant to obsolete in three years and stranded 180 gigawatts of capacity built largely within the preceding five, and heterojunction, back-contact and tandem designs are all advancing behind TOPCon on comparable timescales. Committing capital to a line that cannot be upgraded is committing to writing it off early. Modular line design, equipment with defined upgrade paths and delayed final commitment cost some capital efficiency and prevent the write-down that has hit this industry repeatedly. Very few manufacturers plan capacity that way. Very few plan capacity that way.
Market Impact: Avoids stranding another 180 GW of production capacity

Sell watts delivered, not modules shipped

Module prices have fallen 62% and every manufacturer competes on price per watt into a market where the product is close to interchangeable, which is a contest nobody wins. Integrating forward into project development, or contracting on energy delivered rather than hardware supplied, moves the revenue away from the commodity and toward the asset the customer actually wants. Several manufacturers have done exactly this and the ones that did not are still discounting. It requires capital and project capability rather than any manufacturing change. The ones who did not are still discounting.
Market Impact: Escapes a 62% collapse in the module price

Solve the warranty question before the efficiency one

Perovskite tandem architectures raise theoretical efficiency well beyond silicon and grow at 7.8% on very small volumes, and the obstacle is entirely stability under heat, humidity and ultraviolet exposure across a twenty five year warranty rather than anything about the physics. A manufacturer arriving with credible accelerated ageing evidence and a warranty somebody will underwrite is selling the thing that actually blocks adoption. Laboratory efficiency records address a question nobody is asking. Almost every programme is still chasing the record. Efficiency records answer a question nobody is asking. Every programme still chases the record.
Market Impact: Answers a 25 year warranty question convincingly enough

Who Controls the Margin Pool

CR5 stands at 57% of gigawatts shipped, which is the appropriate basis given that revenue comparison is distorted by three separate regional price zones for identical product. Concentration is high and profitability is not, with a weighted operating margin around negative 4% across the largest listed manufacturers while they continue to ship record volumes into the market. Nobody has seen anything quite like it.
Competition runs on manufacturing cost, protected market access and architecture timing. Cost decides the open markets, which is most of the world by volume. Protected market access decides where the revenue per gigawatt is several times higher. Architecture timing decides who writes off capital early and who does not. Module performance differentiates remarkably little, since every manufacturer adopts each architecture within about two years.

Rankings will move on consolidation that the industry has expected for three years without seeing, because loss-making capacity sustained by local support does not exit the way commercial logic predicts. When it does, pricing changes quickly for everybody. The pressure comes from industrial policy in several jurisdictions at once, which no manufacturer can plan around with any confidence. Everything changes quickly when that capacity finally exits.
solar-pv-module-market-company-positioning-matrix-1788255542966

Competitive Moat and Risk Dimensions

LONGI GREEN ENERGY

Moat: Integrated cost position and scale

Integration across wafer, cell and module production at very large scale gives the company a manufacturing cost position that non-integrated competitors cannot approach in open markets, where most of the world's volume is sold. Technology development capability across successive architectures has kept it near the front of each transition. That combination of cost and timing is genuinely difficult to replicate.
LONGI GREEN ENERGY

Risk: Locked out of premium pricing

Trade measures and domestic content rules exclude the company's Chinese production from the markets paying around 3.1 times domestic prices, which means its cost advantage earns least where revenue per gigawatt is highest. Building qualifying capacity in those jurisdictions is expensive and politically uncertain. Cost leadership offers no answer to a barrier constructed specifically to defeat it.
FIRST SOLAR

Moat: Domestic manufacturing and different chemistry

Cadmium telluride thin film production located inside the American market qualifies for domestic content incentives and sits entirely outside the silicon supply chain that trade measures target, which is a genuinely differentiated position rather than a cost advantage. The technology is proprietary and the manufacturing is domestic. No competitor holds both attributes at meaningful scale.
FIRST SOLAR

Risk: Policy dependence is complete

The commercial position rests on domestic content incentives and trade barriers rather than on a cost advantage that would survive open competition, which makes the business a policy asset as much as a manufacturing one. A change in incentive structure removes the premium directly. Thin film also faces the efficiency gap against advancing silicon architectures without an obvious answer.

Players Tracked

Prominent Players

LONGi Green Energy
JinkoSolar
Trina Solar
JA Solar
Canadian Solar

Other Key Players

Tongwei
Astronergy
Risen Energy
First Solar
Qcells
GCL System Integration
DAS Solar
Seraphim
Waaree Energies
Adani Solar
Vikram Solar
REC Group
Maxeon Solar Technologies
Meyer Burger
SunPower

Recent Developments

JANUARY 2025

Module pricing reached new lows across open markets

Module prices in unprotected markets fell to new lows as manufacturing capacity continued to exceed demand and no meaningful consolidation occurred, with several large manufacturers reporting shipments at or below production cost. Protected market pricing meanwhile remained several times higher for physically identical product throughout the period.
Signal: Two prices for one product, and the gap is policy rather than anything about the module.
MAY 2025

Domestic content investment continued despite open market losses

Manufacturers committed further capital to assembly and cell production inside protected markets, at costs that would not compete on open terms, because domestic content incentives and import restrictions support pricing at a large multiple of world levels. The investment logic rests entirely on the policy persisting.
Signal: Factories are being built against a policy rather than against a cost curve, which is unusual.
SEPTEMBER 2025

Perovskite tandem pilot lines reported stability progress

Several manufacturers reported accelerated ageing results on perovskite tandem modules showing materially improved stability under combined heat, humidity and ultraviolet stress conditions, addressing the obstacle that has genuinely held commercial deployment back rather than the efficiency question that the laboratories had already answered several years earlier.
Signal: The industry has finally started testing the thing that actually blocks any adoption of this technology.

Polysilicon, Glass And Silver

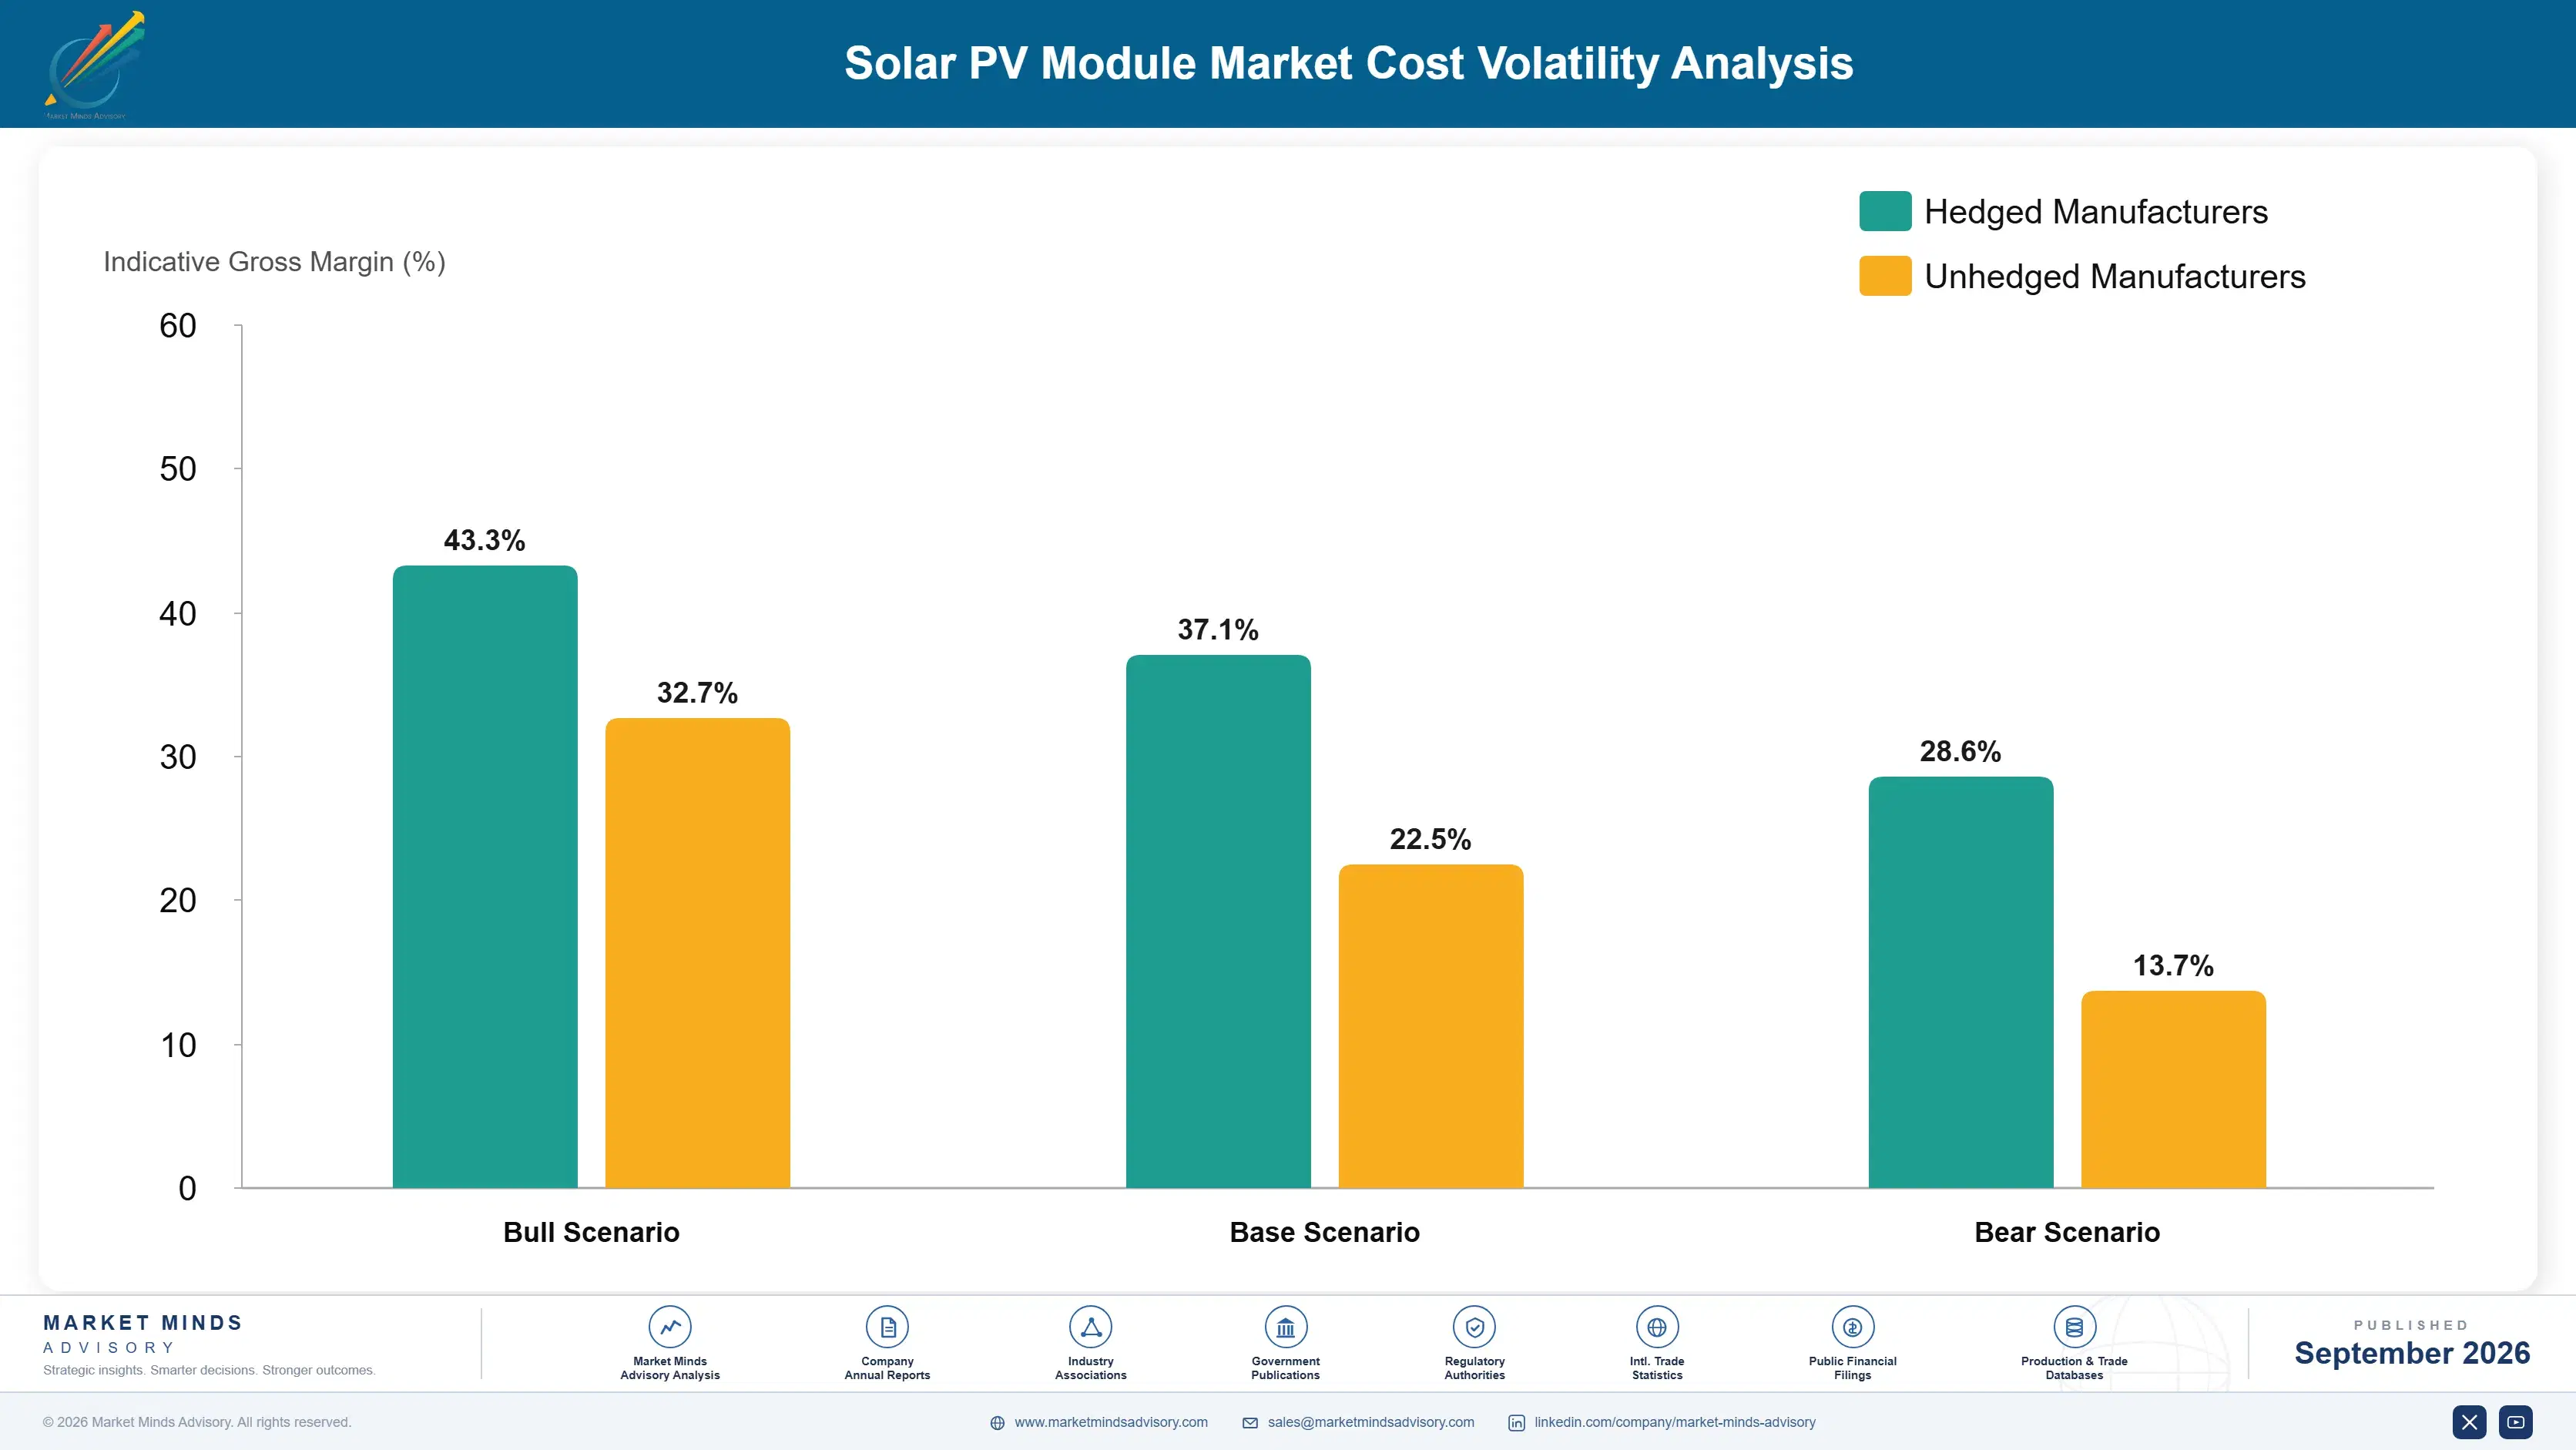
Polysilicon and wafer content account for roughly 31% of module cost at current pricing, solar glass around 12%, and silver paste for cell metallisation a further 11%. Encapsulant, frame, junction box and assembly make up most of the remainder. Silver is the input that has resisted reduction most stubbornly, and every architecture transition has been partly an effort to use less of it per watt produced.
Polysilicon pricing through 2021 and 2022 moved violently as capacity expansion lagged demand, and then collapsed as it overshot, which the International Energy Agency documented across the period. Manufacturers holding long-term polysilicon contracts signed at the peak delivered modules against a collapsing module price with a fixed input cost. Those buying on spot through the collapse gained. The direction of advantage reversed entirely within about eighteen months.

The disadvantage falls on integration position rather than on purchasing skill. A manufacturer producing its own wafers and cells captures margin at every stage and absorbs a collapse at one, while an assembler buying cells holds the thinnest position in the chain. That is why integration rather than assembly scale explains most of the cost difference visible between manufacturers.
solar-pv-module-market-cost-volatility-analysis-1788255543170

Reduce silver loading rather than buying it better

Silver paste is 11% of module cost and its price follows a precious metals market entirely unconnected to solar demand, which no purchasing arrangement addresses. Metallisation redesign, copper plating and narrower finger geometries reduce loading per watt directly. Every architecture transition has partly been a silver reduction exercise, and treating it as procurement misses the point.

Integrate backwards into cell production

Module assembly is the thinnest margin position in this chain and offers no protection when cell or wafer pricing moves, while an integrated manufacturer captures margin at each stage and can absorb a collapse at one. Integration costs capital and technology capability rather than purchasing skill. Assemblers buying cells on open terms hold the weakest position in the chain.

Avoid long polysilicon contracts at cycle peaks

Polysilicon pricing has moved violently in both directions within eighteen months, and manufacturers locking long-term supply at peak prices delivered modules into a collapsing market against fixed input costs. Shorter contracts cost security and preserve the ability to follow a price down. The direction of advantage in this input reverses faster than any contract term sensibly accommodates.

Portfolio Architecture for Margin Defence

Margin here follows destination rather than product, which no other manufacturing sector would recognise as normal. An identical module earns around 3.1 times more delivered into a protected market than into an open one, on the same manufacturing cost, because trade measures and content incentives rather than any quality difference determine the price. Participants managing by market access rather than by product line run an entirely different business.
Volume and premium pull against each other through manufacturing scale rather than through the market. Open market volume at very low prices keeps integrated production lines at the utilisation that makes the cost position work at all, and losing it raises unit cost across everything including the protected market output. Serving only the premium destinations produces plants running below the rate their economics assume.

High-value pools sit in protected market manufacturing, in forward integration into projects and in architecture licensing almost nobody pursues. The third is genuinely underused: a manufacturer with a proven architecture can license it to producers in protected markets rather than building there, earning without the capital exposure or the political risk that owning a foreign factory carries.

Volume / Commodity-Adjacent

Standard modules sold into open markets where price is the only variable and manufacturers frequently ship at or below cost. Product is genuinely interchangeable between suppliers. The 9 point spread reflects vertical integration position rather than any difference in the module.
Gross Margin: -2 to 7%

Premium / Certified

Modules qualifying for domestic content incentives or manufactured inside protected markets, earning pricing that policy rather than performance supports. Market access rather than product supports the margin. The 9 point spread reflects how completely the product satisfies local content rules.
Gross Margin: 12 to 21%

Sustainability / Regulatory / Next-Generation

Differentiated architectures, technology licensing and forward integration into project development and energy supply. Margins are higher because the revenue is not a commodity module price. The 16 point spread separates licensing income from project development returns entirely.
Gross Margin: 18 to 34%
solar-pv-module-market-portfolio-architecture-1788255543673

High-value Sub-segments and Strategic Watch-out

TOPCon Monocrystalline Modules

High value and high growth at 8.1%. It became the industry default in three years and faces exactly the same displacement risk from architectures advancing behind it now. The 8 point spread reflects vertical integration and whether the production line has any real upgrade path.
Gross Margin: 4 to 12%

Perovskite Tandem and Emerging Modules

High value with strong growth at 7.8% from very small volumes. Efficiency is proven and stability across a twenty five year warranty is not, which is what actually blocks deployment. The 16 point spread separates pilot production from anything approaching commercial volume manufacture. Volumes remain tiny.
Gross Margin: 14 to 30%

Thin Film Cadmium Telluride Modules

The volume core of the protected markets. It earns solidly because it sits outside the silicon supply chain that trade measures target and qualifies domestically. The 8 point spread reflects how much of the manufacturing is genuinely located inside the incentivised jurisdiction. Policy sustains the position.
Gross Margin: 10 to 18%

PERC Monocrystalline Modules

The strategic watch-out. It went from industry default to obsolete in about three years and 180 gigawatts of capacity was stranded. The 14 point spread separates written-down lines still running at cash cost from those carrying undepreciated capital they will never recover. Capital was destroyed here.
Gross Margin: -6 to 8%

Twenty Five Year Warranties

The annuity here is a warranty obligation rather than any revenue stream, which is an uncomfortable inversion. A module sold today carries performance guarantees running twenty five years, and the manufacturer must remain solvent for that period to honour them, which is a genuine concern in an industry operating at negative margins. Buyers increasingly assess balance sheet durability alongside product specification, and several manufacturers have already failed their warranties.
Stickiness varies enormously by channel rather than by product. A utility scale developer tenders every project and switches manufacturer on price without hesitation, since modules are interchangeable and warranties are broadly equivalent. A distribution and installer channel builds preference around availability, support and the perceived durability of the brand, and switches far less readily. The second channel is worth considerably more per watt and gets far less attention.

Buyer profiles have shifted from engineers toward procurement and increasingly toward financiers, and manufacturers have not fully adjusted. An engineer compared efficiency and temperature coefficient. A financier asks whether the manufacturer will exist in fifteen years to honour a warranty that underpins the project's financing assumptions. That question is now decisive on large projects and no product specification answers it at all.
solar-pv-module-market-end-use-penetration-index-1788255544184

What A Watt Is Worth

These are among the four positions where our research anticipates prominent divergence between winners and laggards over the coming forecast period. Each is grounded in the demand model, the regulatory perimeter, and the announced capacity pipeline.
01 / PROTECTED MARKET ACCESS

Manufacture where the policy pays

American module pricing runs around 3.1 times Chinese domestic levels for physically identical product, sustained by tariffs, anti-dumping duties, import restrictions and domestic content incentives all operating together at once. A manufacturer with qualifying production inside that zone earns a multiple of what the identical output earns anywhere else, which is precisely why factories are being built at costs that could never compete on open terms. The exposure is that the entire differential is policy rather than economics, and policy changes.
02 / ARCHITECTURE TRANSITION PLANNING

Buy lines you can upgrade, not replace

PERC went from clear industry default to effective obsolescence in around three years and stranded roughly 180 gigawatts of capacity built largely within the preceding five years of that transition. Heterojunction, back-contact and perovskite tandem designs are all advancing behind TOPCon on comparable timescales right now. Committing capital to a production line without an upgrade path is committing to writing it off early, and modular line design with defined equipment upgrade routes costs some capital efficiency to prevent exactly that outcome.
03 / FORWARD INTEGRATION STRATEGY

Sell energy rather than interchangeable hardware

Module prices have fallen 62% from peak and every manufacturer now competes on price per watt into a market where the physical product is close to genuinely interchangeable, which is a contest that nobody in this industry actually wins. Integrating forward into project development, or contracting on energy delivered rather than on hardware supplied, moves revenue away from the commodity toward the asset the customer wanted in the first place. It requires capital and project capability rather than any manufacturing change at all.
04 / WARRANTY CREDIBILITY BUILDING

Prove you will exist in fifteen years

Modules carry performance guarantees running twenty five years and the industry has operated at a weighted margin around negative 4% for an extended period, which makes manufacturer solvency a genuine financing question rather than a theoretical one. Project financiers now assess balance sheet durability alongside product specification, and several manufacturers have already failed warranties that buyers had relied upon. No efficiency figure or temperature coefficient answers that question, and remarkably few manufacturers in this industry address it directly at all.

Engagement Snapshot From the Field

A live engagement with an industry participant carrying material or product regulatory and market exposure ahead of a defining policy shift, showing how our research translates into a defensible multi-year portfolio strategy.
MARKET MINDS ADVISORY · CLIENT ENGAGEMENT SUMMARY
Solar PV Module Producer Strategic Portfolio Review and Transition Roadmap 2026·Investment Scenario on Solar PV Module Exposure Evaluation 2025-26
CLIENT PROFILE
A module manufacturer with integrated cell and assembly capacity supplying open markets across three continents, shipping several gigawatts annually at a group operating margin close to zero and falling (client-reported, unverified by MMA). All production sat in jurisdictions excluded from the markets paying premium prices for identical product. Nobody in the business had ever modelled the alternative.
STRATEGIC CHALLENGE
The client competed hard on cost in markets where the product was interchangeable and prices fell faster than costs, while watching competitors earn multiples on the same modules in protected jurisdictions. Management needed to decide whether to build in those markets, license the technology, or accept the commodity position permanently.
MMA APPROACH
MMA modelled returns on qualifying manufacturing investment against licensing and against continued export, under several assumptions about how long protective policy persists. Forty-seven expert interviews with project developers, financiers, policy specialists, equipment suppliers and competing manufacturers established what qualification actually required and how durable the differential looked. The conclusion was consistent throughout.
KEY FINDINGS
  1. Qualifying production in the premium market returned above cost of capital even assuming the policy lapsed after 6 years, on conservative price assumptions throughout.
  2. Licensing the client's architecture to a local manufacturer returned less in total and carried no capital exposure or political risk of any kind at all.
  3. Project financiers ranked manufacturer solvency alongside efficiency in 8 of 10 large tenders reviewed, and the client had never addressed that in any bid.
  4. Open market pricing had fallen faster than the client's cost reduction in every year of the period examined, with no evidence of that pattern changing.
CLIENT PROFILE
A module manufacturer with integrated cell and assembly capacity supplying open markets across three continents, shipping several gigawatts annually at a group operating margin close to zero and falling (client-reported, unverified by MMA). All production sat in jurisdictions excluded from the markets paying premium prices for identical product. Nobody in the business had ever modelled the alternative.
STRATEGIC CHALLENGE
The client competed hard on cost in markets where the product was interchangeable and prices fell faster than costs, while watching competitors earn multiples on the same modules in protected jurisdictions. Management needed to decide whether to build in those markets, license the technology, or accept the commodity position permanently.
MMA APPROACH
MMA modelled returns on qualifying manufacturing investment against licensing and against continued export, under several assumptions about how long protective policy persists. Forty-seven expert interviews with project developers, financiers, policy specialists, equipment suppliers and competing manufacturers established what qualification actually required and how durable the differential looked. The conclusion was consistent throughout.
KEY FINDINGS
  1. Qualifying production in the premium market returned above cost of capital even assuming the policy lapsed after 6 years, on conservative price assumptions throughout.
  2. Licensing the client's architecture to a local manufacturer returned less in total and carried no capital exposure or political risk of any kind at all.
  3. Project financiers ranked manufacturer solvency alongside efficiency in 8 of 10 large tenders reviewed, and the client had never addressed that in any bid.
  4. Open market pricing had fallen faster than the client's cost reduction in every year of the period examined, with no evidence of that pattern changing.
RECOMMENDED STRATEGY
Phase 1: Phase one: commit qualifying assembly capacity in the premium market, since returns hold even on conservative assumptions about policy duration. Phase 2: Phase two: license the architecture in parallel to a second protected jurisdiction, capturing return without further capital or political exposure. Phase 3: Phase three: address manufacturer solvency directly in project bids, since financiers rank it alongside efficiency and no competitor discusses it.
OUTCOME
Within six quarters qualifying capacity was under construction and a licensing agreement had been signed in a second jurisdiction (client-reported, unverified by MMA). Open market margins continued to compress exactly as modelled. Group profitability improved on the protected volume alone. A second licensing discussion is under way in another jurisdiction.

Frequently Asked Questions

Foundational context covering the market sizes, CAGR, scope, country, region and competition that inform every finding below. This section is provided to cover basics and most often pre-purchase conversations, answered from the MMA Primary Research Dataset.

What is the current size of the Solar PV Module Market?

The global solar photovoltaic module market was valued at USD 66.0 billion in 2025, measured as module revenue at point of sale. The 2026 figure reaches USD 69.56 billion.

How large will the Solar PV Module Market be by 2036?

MMA forecasts USD 117.70 billion by 2036, an increase of USD 48.14 billion over the 2026 base. That represents an expansion multiple of 1.69 times across the forecast period.

What is the CAGR for the Solar PV Module Market 2026 to 2036?

The base case value growth rate is 5.4%, with a bull case at 6.6% and a bear case at 4.2%. Shipment volume grows considerably faster while prices continue falling.

Which segment is growing fastest?

TOPCon monocrystalline modules grow at 8.1%, half again the market rate of 5.4%, having displaced PERC in about three years. Perovskite tandem architectures follow at 7.8%.

Who are the major companies in the Solar PV Module Market?

LONGi Green Energy, JinkoSolar, Trina Solar, JA Solar and Canadian Solar lead on gigawatts shipped, with combined CR5 of 57%. Concentration is high and profitability is not.

Which country is growing fastest?

India grows fastest at 7.4%, on domestic content requirements attached to public procurement alongside rapidly expanding installation volume. South Asia and Pacific leads regionally at 7.4%.

Report Segmentation Architecture

The full report scope spans multiple orthogonal segmentation dimensions, with cross-tabulated demand data provided for each dimension pair. Coverage extends further to regional breakdowns, trend trajectories, and the competitive detail needed to support segment-level decision-making.

By Cell Architecture

  • TOPCon Monocrystalline Modules
  • Heterojunction Modules
  • Back-Contact Modules
  • Thin Film Cadmium Telluride Modules
  • PERC Monocrystalline Modules
  • Perovskite Tandem and Emerging Modules

By End-Use Industry

  • Utility Scale Generation
  • Commercial and Industrial Rooftop
  • Residential Rooftop
  • Distributed Ground Mount
  • Agrivoltaic Installations
  • Off-Grid and Remote Power

By Commercial Dimension

  • Direct Developer Supply
  • Distribution and Installer Channels
  • Engineering and Construction Contractors
  • Original Equipment Supply Agreements
  • Technology Licensing Arrangements
  • Integrated Project Development

By Region

  • North America
  • Western Europe
  • East Asia
  • South Asia and Pacific
  • Latin America
  • Middle East and Africa
  • Eastern Europe

Scope, Methodology, and Coverage

Every figure in this report is reproducible from documented input assumptions. The scope below maps the historical period, the forecast horizon, the segmentation dimensions, and the countries covered, alongside the underlying primary and qualitative methodology.
Historical Period
2020 to 2025
Forecast Period
2026 to 2036
Base Year
2025 (USD billions; MMA Primary Research Dataset, September 2026)
Market Definition
The solar photovoltaic module market covers assembled modules supplied for electricity generation, segmented by cell architecture across TOPCon monocrystalline modules, heterojunction modules, back-contact modules, thin film cadmium telluride modules, PERC monocrystalline modules, and perovskite tandem and emerging modules. Scope is measured as module revenue at the point of sale into project and distribution channels. Excluded are polysilicon, ingot, wafer and cell production sold as intermediate products, inverters and balance of system equipment, mounting structures and trackers, project development and installation services, and building integrated photovoltaic assemblies sold as construction materials.
Quantitative Units
USD billion, 2025 base year, 2026 to 2036 forecast period
Segmentation Dimensions
Cell architecture, installation application, commercial channel, region
Regions Covered
North America, Western Europe, East Asia, South Asia and Pacific, Latin America, Middle East and Africa, Eastern Europe
Countries Covered
United States, Canada, Germany, Spain, Italy, Netherlands, Poland, Romania, China, Japan, South Korea, India, Australia, Brazil, Chile, Saudi Arabia, United Arab Emirates, South Africa
Key Companies Profiled
20 companies across integrated manufacturers, thin film producers and regional assemblers
Quantitative Methodology
Primary survey, n=3,800 respondents, Q4 2025, six countries; demand-side model with trade association cross-validation
Qualitative Methodology
47 expert interviews, Q4 2025; applied to validate demand model assumptions, identify emerging dynamics, and assess competitive positioning
Report Format
PDF and XLSX data workbook (Word format preview document)
Publisher
Market Minds Advisory
Report Code
MMA-2026-ENE-411
Published
September 2026
Contact
sales@marketmindsadvisory.com | www.marketmindsadvisory.com

Purchase the full Solar PV Module Market Report (2026 to 2036).

The full MMA report on the solar photovoltaic module market runs to detailed architecture and regional models across the 2026 to 2036 forecast period, with pricing benchmarks separated by destination market and trade policy exposure. It profiles 20 companies on a consistent gigawatts shipped basis, covering integrated manufacturers, thin film producers and regional assemblers. Volume and value are modelled separately throughout, since the two have moved almost independently for years. Regional chapters cover the seven MMA regions with country-level detail on the eighteen markets surveyed. Primary research draws on a quantitative survey of 3,800 respondents across six countries and 47 expert interviews conducted in Q4 2025.
Pricing benchmarks separated by destination market and policy exposure
Volume and value modelled independently across every regional market
Architecture transition timing tracked against capacity commissioning and write-downs
Twenty company profiles on consistent gigawatts shipped basis
Domestic content qualification requirements mapped across protected jurisdictions
Seven regional chapters with eighteen country detail tables

Built For The People Who Decide

From boardroom strategy to bench-side execution, this report is read cover-to-cover by leaders shaping the next decade of their industry, turning demand scenarios, market dynamics and valuation benchmarks into decisions.
CXOs/ Presidents/ VPs/ Managers
M&A and Corporate Development
Strategy Teams and R&D Heads
Procurement and Product Directors
Regulatory and Compliance Leaders
Investor Relations and Equity Analysts