Market Minds Advisory
Solar Panel Mounting Structures Market

Solar Panel Mounting Structures Market: Trackers, Steel, and the Domestic Content Race

Solar mounting structure makers are chasing utility-scale tracker orders across three continents at once, even as steel and aluminum price swings and new domestic-content rules force a rethink of where racking gets fabricated and assembled.

Lead Analyst

David Horsley

Published

September 2026

Make Smarter Decisions with Customized Research Insights

Request a free sample report and evaluate market opportunities, growth trends, and competitive dynamics relevant to your business needs.

2025 MARKET VALUE$8.4BMarket Size 2025
2036 FORECAST VALUE$18.7BBase Case , 2026 to 2036
CAGR 2026 TO 20367.6 %Bull 8.9% / Bear 6.3%
INCREMENTAL OPPORTUNITY$9.7BNet 10- year value creation
EXPANSION MULTIPLE2.08x2036 value over 2026 base
Strategic Levers
M&A Pipeline
Regional Outlook
Country Rankings
Competitive Intelligence
Segmental Deep-dive
Call-Us : 91 93563 13602

Executive Snapshot and Market Trajectory

Tracker suppliers are winning share from fixed-tilt racking faster than most utility-scale developers had expected only a few years ago, since the added energy yield now clears its cost hurdle across nearly every mid-latitude project financed anywhere in the world this year.
Utility-scale ground mount still dominates volume, but floating structures and single-axis trackers pull growth fastest as land-constrained markets and yield-hungry developers specify them over static fixed-tilt racking across most new project tenders worldwide. East Asia manufactures the bulk of global tonnage, while South Asia and Pacific compounds fastest as India rooftop and ground-mount targets pull local fabrication capacity into a market imports alone increasingly cannot serve on lead time.
Five suppliers hold a modest quarter of global share, and Nextracker has turned its tracking control software into a switching cost that rivals still struggle to replicate at any meaningful scale across comparable utility-scale project sizes anywhere worldwide. Domestic-content incentives, anti-dumping duties on Southeast Asian panel and racking components, and steel price volatility now decide who wins the largest utility-scale bids faster than any single tracking algorithm improvement moving through the industry this decade.
Market Definition
The market covers structural racking, tracking, and foundation systems that mount photovoltaic modules on ground, rooftop, floating, and carport installations, including associated tracker control electronics sold as part of the mounting system. Photovoltaic modules, inverters, and standalone balance-of-system electronics sold separately are excluded.
Base Year Value
$8.4B in 2025 (MMA Primary Research Dataset, August 2026)
Forecast Period
2026 to 2036, eleven discrete annual values
CAGR
7.6% base case. Bull 8.9%. Bear 6.3%.
Fastest Growth Segment
Floating Solar Mounting Structures: 13.5% CAGR
Fastest Growth Country
India: 12.5% CAGR
Fastest Growth Region
South Asia and Pacific: 9.8% CAGR
Largest Region
East Asia: 29% of 2025 global value
Market Leaders
Nextracker Inc., Array Technologies Inc., Arctech Solar Holding Co., GameChange Solar, PV Hardware. Source: MMA Analysis based on company annual reports.
Primary Survey
n=3,800 procurement and R&D decision-makers, Q4 2025, six countries
Methodology
Demand-side build-up, cross-validated against public data, 47 expert interviews

Solar Panel Mounting Structures Market Forecast Scenarios

solar-panel-mounting-structures-market-size-forecast-scenario-1787300142803
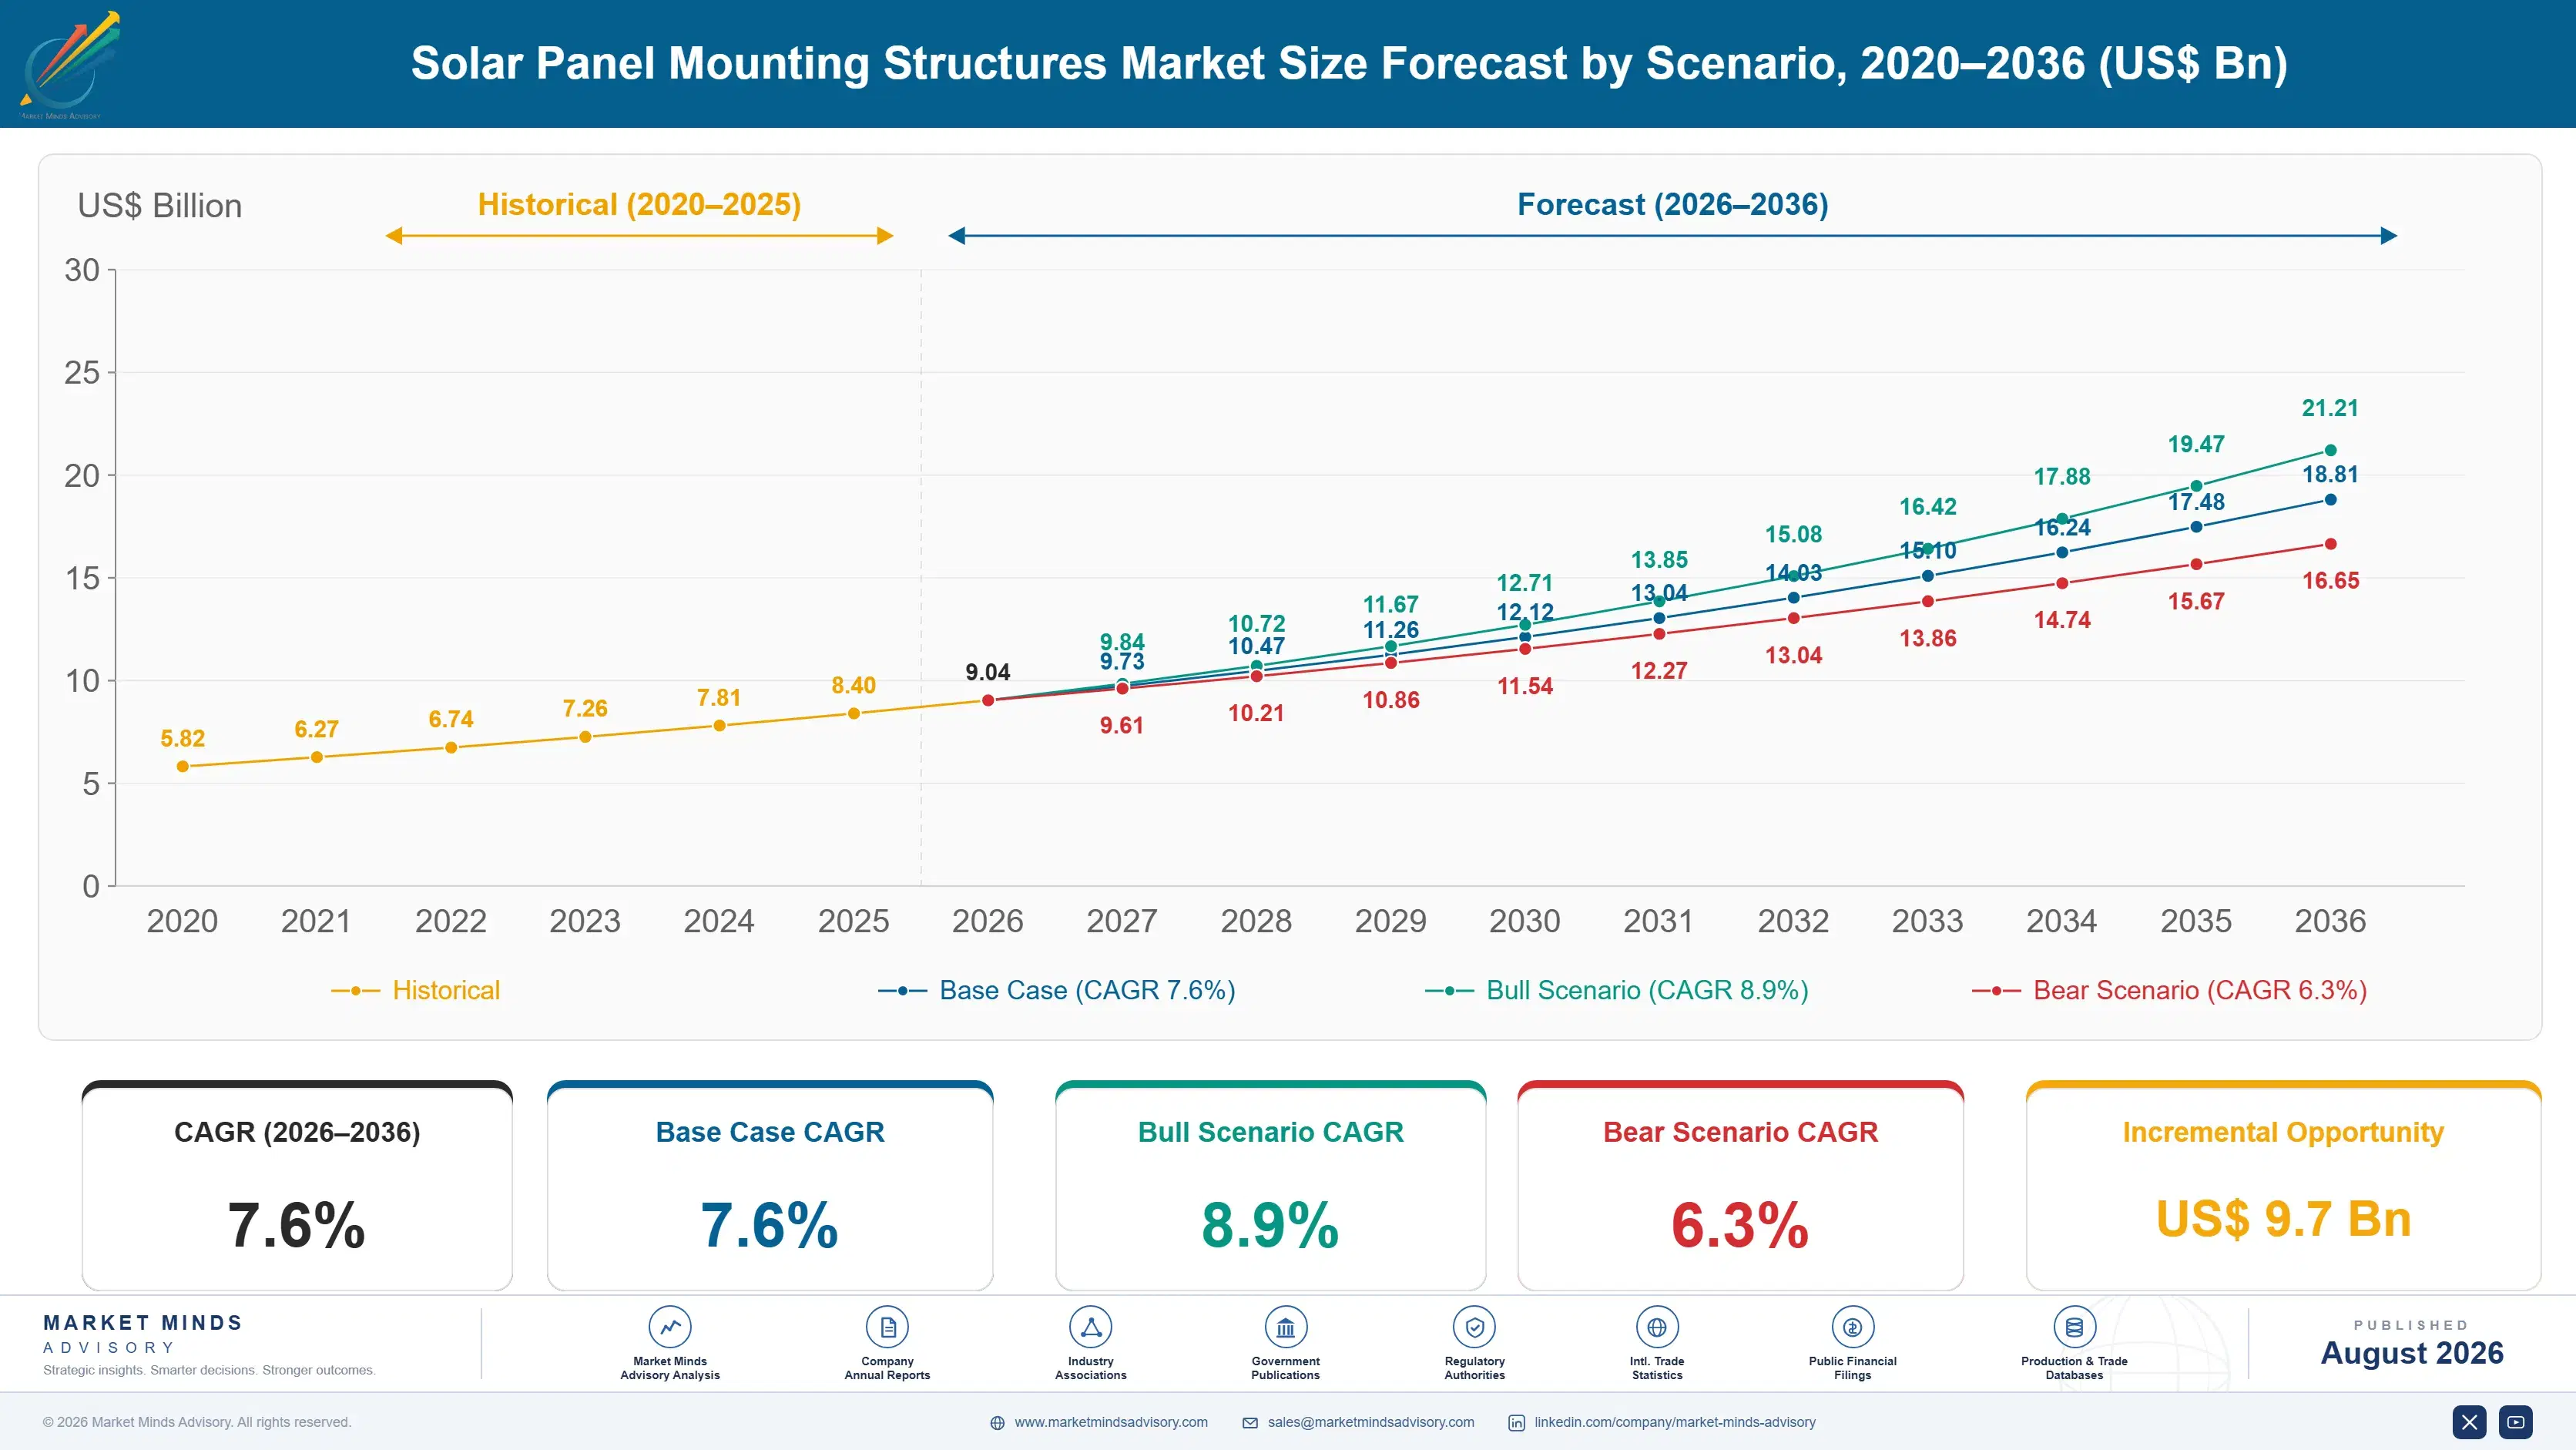
Global mounting structure demand grew near 6.4% annually between 2020 and 2025, slowed by 2022 steel and freight cost spikes before utility-scale build-outs in the United States, India, and the Middle East restored momentum through the back half of the period. Tracker penetration rose steadily across nearly every major solar market during those five years.
The base case reaches 7.6% on three mechanisms. First, single-axis trackers keep displacing fixed-tilt racking as module prices fall and the relative cost of chasing extra energy yield keeps shrinking. Second, floating solar mounting scales from a tiny base as land-constrained markets in East Asia and South Asia turn to reservoirs and irrigation canals. Third, domestic-content incentives in the United States and India pull fabrication capacity onshore faster than organic demand alone would justify.
The bull case at 8.9% assumes steel and aluminum prices stay range-bound while tracker penetration accelerates faster than modelled in markets still dominated by fixed-tilt racking today. The bear case at 6.3% assumes renewed trade tariff escalation on racking components and continued interest rate pressure slow utility-scale financial closes enough to push several announced gigawatt-scale projects into later years.

Racking Economics Behind the Tracker Shift

Mounting structures behave like a bet on land and labor cost. Ground-mount racking competes on steel tonnage and installation speed, while rooftop and carport systems compete on wind and snow load engineering and permitting simplicity. Both draw on the same steel and aluminum extrusion supply chain, so a single metals price shock reaches every mounting type at once regardless of project scale or geography.
CR5 CONCENTRATION22%Top five suppliers hold a modest combined market share
AVERAGE SELLING PRICEUSD 0.045 per wattBlended tracker and fixed-tilt system price across markets today
LEADING PRODUCING COUNTRYChina, 38% shareOne country dominates global racking fabrication capacity by far
TRACKER PENETRATION RATE62%Share of utility-scale capacity now using single-axis tracking
TRADE INTENSITY27% cross-borderA meaningful share of finished racking crosses a border
STEEL SHARE OF COGS34-40%Structural steel dominates the total production cost base
Commercial activity concentrates around tracker control software and domestic fabrication capacity rather than racking design alone. Suppliers that pair tracking algorithms with local galvanizing and roll-forming capacity win utility-scale bids that pure racking exporters increasingly cannot match on lead time or content rules. EPC contractors now qualify mounting suppliers on bankability and warranty duration nearly as much as on unit cost.
Over the next decade, fabrication footprint decisions made in Texas, Gujarat, and Jiangsu will matter more than incremental tracking algorithm gains alone. Domestic-content rules, steel tariff schedules, and utility interconnection queues will decide who captures the next wave of gigawatt-scale demand before developers lock supplier agreements years ahead of scheduled construction start dates across every region tracked in this report.
"Everybody benchmarks tracker software. The real differentiator is whether a supplier can galvanize steel domestically fast enough to hit an interconnection deadline, which has nothing to do with the algorithm at all."
Director, Renewable Energy Infrastructure Practice · MMA Renewable Energy Infras

Market Trends

Domestic Content Rules Reshape Where Racking Gets Made

The US Inflation Reduction Act's domestic content bonus, awarding an extra 10% investment tax credit to projects meeting steel and manufactured product thresholds, has pushed Nextracker, Array Technologies, and several Chinese-linked suppliers to open or expand US roll-forming and galvanizing lines since 2023. India's Approved List of Models and Manufacturers has separately pushed racking fabrication toward domestic capacity for government-backed tenders. Suppliers without local fabrication now compete for a shrinking share of tenders that do not require domestic content, a segment that keeps narrowing as more utilities specify the bonus threshold explicitly in bid requirements.
Market Impact: Lifts tracker share past 60% globally
Floating Solar Mounting Scales Across Land-Constrained Asian Markets

China, South Korea, and India have all commissioned utility-scale floating solar installations on reservoirs and irrigation canals since 2022, driven by land scarcity near population centers and the cooling effect water provides to panel output. China's Huaneng Group and several state utilities have floating projects exceeding 300 megawatts under construction, requiring specialized corrosion-resistant floats and anchoring systems that differ substantially from ground-mount racking design. Mounting suppliers building floating-specific product lines are capturing early-mover positioning in a segment still small enough that few competitors have committed serious engineering resources to it yet.
Market Impact: Locks 3 gigawatts framework agreement volume

Market Opportunities and Growth Drivers

Utility-Scale Tracker Adoption Keeps Displacing Fixed-Tilt Racking

Single-axis trackers now capture a majority of new utility-scale capacity in the United States, India, and several Middle Eastern markets, as falling module prices make the incremental energy yield gain, typically 15% to 25% over fixed-tilt, worth the added mechanical and control system cost. Nextracker and Array Technologies have both reported order backlogs extending several years, evidence that developers are locking tracker supply well ahead of construction start dates. This adoption curve converts a design choice into sustained multi-year order visibility for suppliers holding qualified tracker product lines across major solar-resource markets.
Market Impact: Swings input cost 45% yearly

Gulf and Indian Gigawatt-Scale Tenders Lock Multi-Year Orders

Saudi Arabia's PIF-backed solar programme and India's national solar mission have both issued gigawatt-scale tenders specifying multi-year mounting structure supply agreements rather than single-project purchase orders. Saudi Arabia's Al Shuaibah and Sudair projects alone required racking and tracker systems exceeding 3 gigawatts combined capacity, awarded through framework agreements that extend supplier relationships across multiple project phases. This tender structure converts what would otherwise be one-off project wins into contracted pipeline visibility that smaller regional fabricators, lacking the balance sheet to bid multi-year framework volumes, increasingly cannot compete for directly at all.
Market Impact: Adds up to 20% cost

Market Restraints and Challenges

Steel Price Volatility Compresses Fixed-Price Contract Margins

Hot-rolled steel coil prices swung from roughly USD 600 to over USD 1,900 per tonne between 2020 and 2022 before retreating, driven by pandemic supply disruption and subsequent demand normalisation across every steel-consuming industry. The root cause is thin global rolling capacity relative to demand swings, layered onto energy cost volatility that directly affects steel mill operating cost. Mounting suppliers that quoted fixed-price utility-scale contracts during the 2021 order surge absorbed losses when steel costs spiked before delivery. Several suppliers now negotiate steel price-adjustment clauses into framework agreements to share that risk with developers directly rather than absorb it alone.
Market Impact: Adds 10% tax credit bonus eligibility

Anti-Dumping Duties Disrupt Cross-Border Racking Supply Chains

The United States has imposed anti-dumping and countervailing duties on solar components, including racking-adjacent inputs, from China and several Southeast Asian transshipment countries across multiple determinations since 2022. The root cause is genuine price undercutting by Chinese-linked manufacturers relocating final assembly to Vietnam, Malaysia, and Cambodia to avoid existing duties, prompting new circumvention investigations. Suppliers with only offshore fabrication now face unpredictable duty exposure that can add 20% or more to landed cost overnight. Several are responding by qualifying domestic or allied-country fabrication capacity specifically to remove that exposure from future utility-scale bids entirely.
Market Impact: Adds 4.8 gigawatts floating capacity
3 additional market trends, 4 additional growth drivers, and 2 additional restraints and challenges are covered in the full report. Contact sales@marketmindsadvisory.com to access the complete intelligence.

Segment CAGR and Growth Architecture

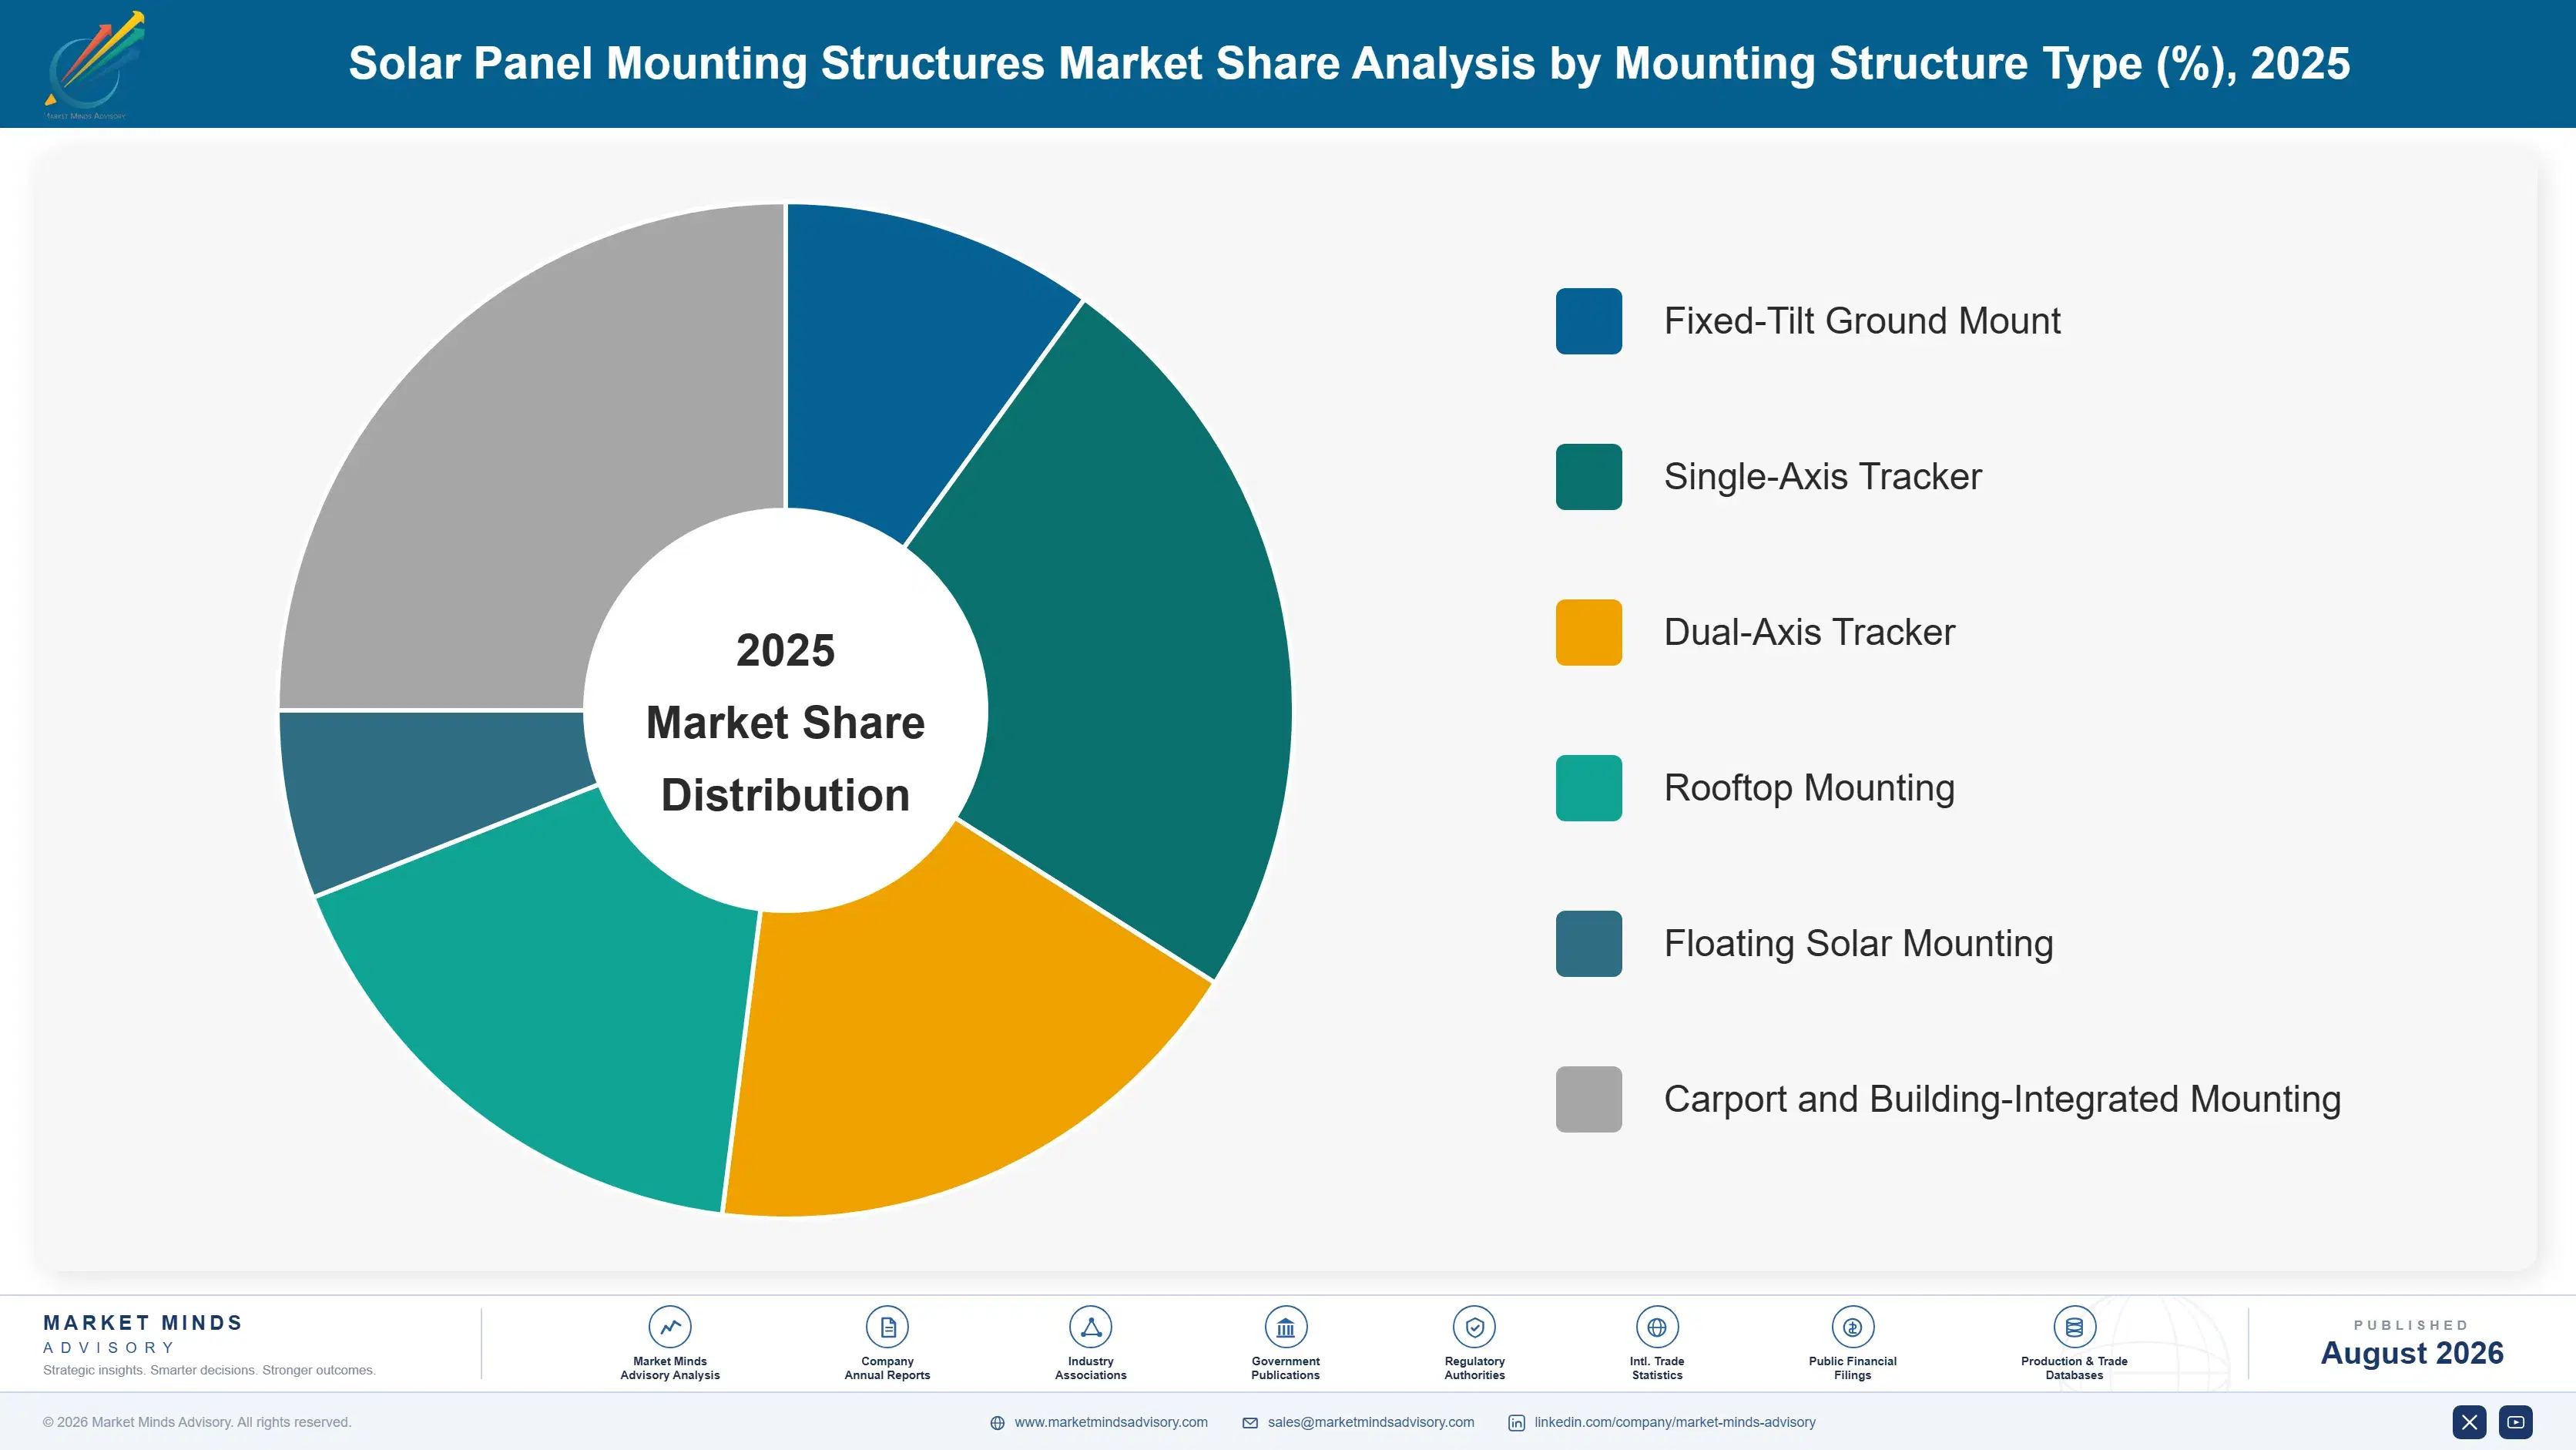
Segmentation follows mounting structure type, a single classification logic grounded in installation surface, tracking mechanism, and structural engineering approach across every project scale. Each type carries its own foundation design, wind and snow load calculation, and installer qualification process, so commercial position tracks structural design rather than end-use project ownership, covered separately in the framework.
solar-panel-mounting-structures-market-market-share-analysis-1787300143334

Floating Solar Mounting Structures

Floating solar mounting structures grow fastest at 13.5%, about 1.78 times the overall 7.6% rate, as land-constrained markets in China, South Korea, and India turn reservoirs and irrigation canals into generation sites. High-density polyethylene floats and marine-grade anchoring systems differ entirely from ground-mount steel racking, and only a handful of suppliers, mostly Chinese and South Korean, hold proven designs at gigawatt scale today. Corrosion resistance and wave-load engineering create a real technical barrier that keeps competition thinner than in conventional ground-mount racking. Developers report the water's cooling effect lifts panel output measurably, adding a performance case on top of the land-scarcity argument that first justified the segment's existence in these markets.
CAGR 13.5%

Single-Axis Tracker Mounts

Single-axis tracker mounts grow second-fastest at 10.5%, capturing a majority of new utility-scale capacity as falling module prices make the incremental energy yield, typically 15% to 25% over fixed-tilt racking, worth the added mechanical cost almost everywhere today. Nextracker and Array Technologies dominate this category through tracking control software that optimises tilt angle against real-time weather and shading data, a layer smaller competitors struggle to replicate credibly at scale. Order backlogs extending several years are now common among qualified suppliers, evidence that developers lock tracker supply well before construction begins. Fixed-tilt racking still holds share in smaller distributed projects where the yield gain does not clear the added engineering cost.
CAGR 10.5%
Full segment breakdown across 6 segments available in the complete report.

Regional Architecture and Country Demand Map

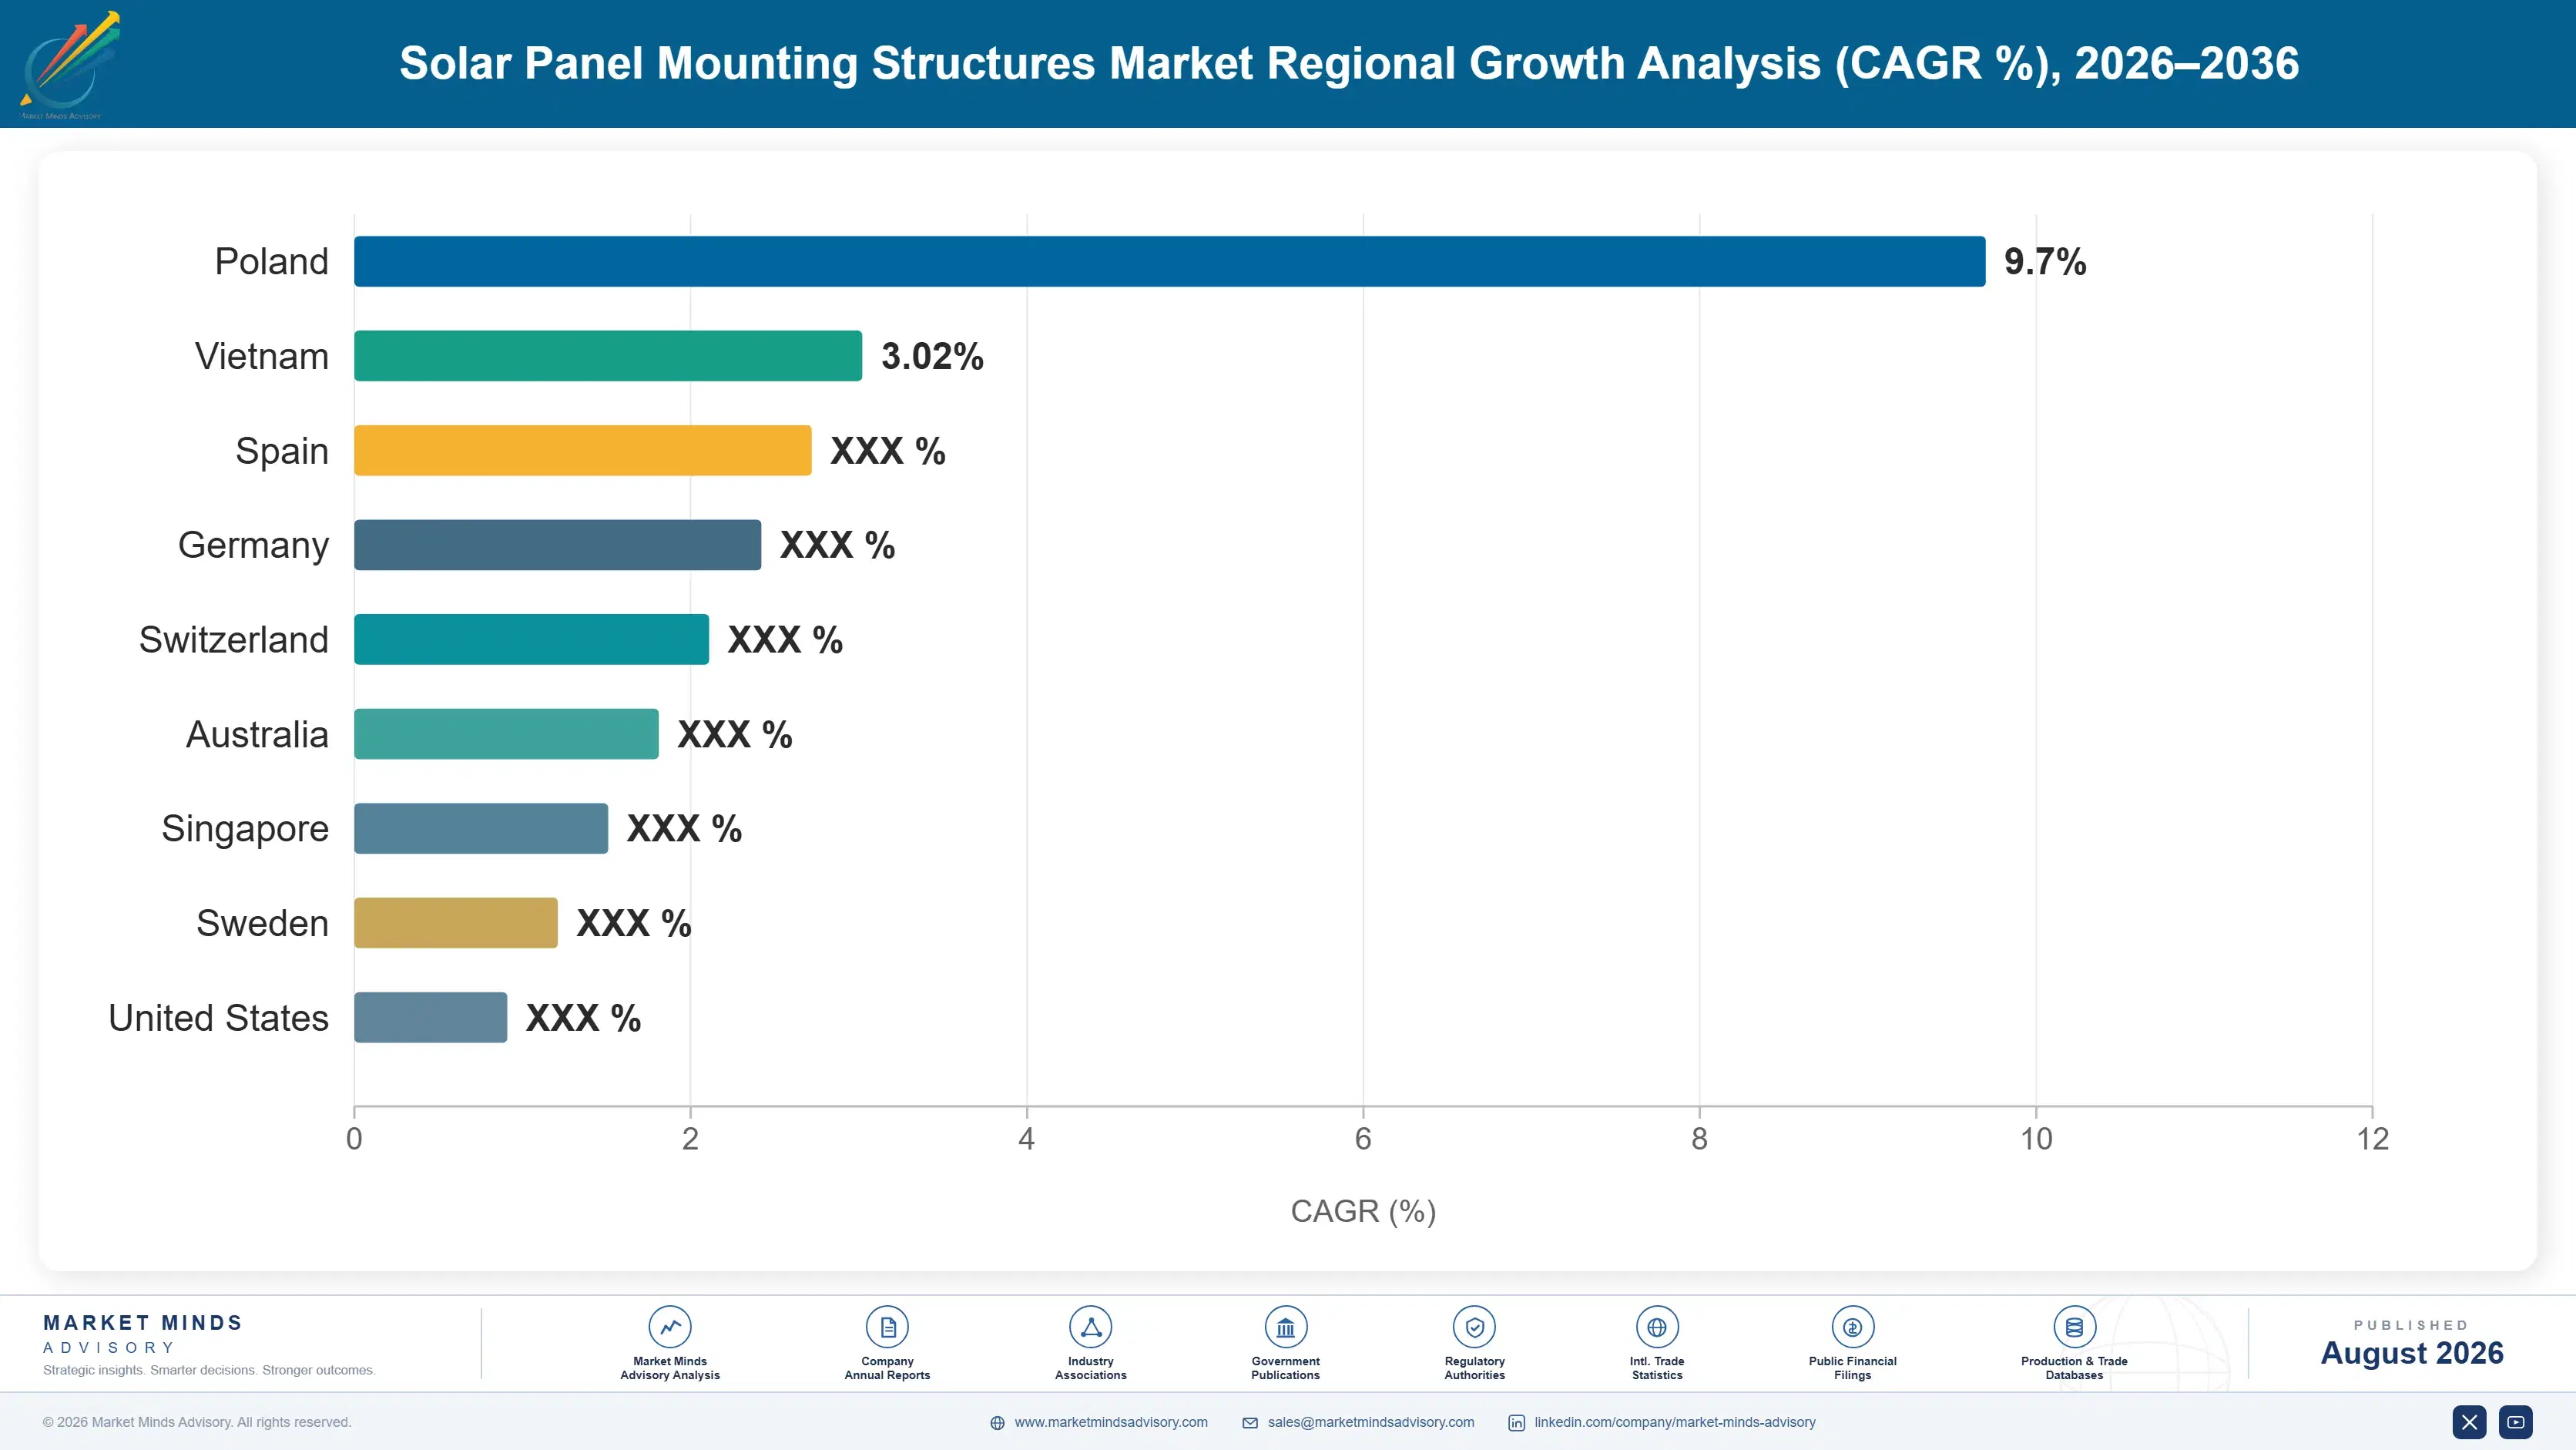
Seven regions split unevenly between fabrication scale and deployment growth. East Asia manufactures the largest volume on Chinese capacity, while South Asia and Pacific compounds fastest as Indian utility-scale and rooftop targets pull local fabrication into a market that imports cannot serve on lead time.

North America

Domestic content bonus credits under the Inflation Reduction Act have pulled tracker and racking fabrication back onshore at a pace few predicted three years ago, with Nextracker, Array Technologies, and several Asian-linked suppliers all expanding Texas and Southeast roll-forming capacity since 2023. Utility-scale build-out concentrates in Texas, California, and a growing Southeast corridor where interconnection queues, despite delays, keep clearing gigawatt-scale projects steadily. Community and commercial rooftop growth adds a smaller but steady distributed demand pool that tracks state-level net metering policy rather than utility procurement cycles. Growth trails East Asia and South Asia because permitting timelines and interconnection backlogs continue to constrain how fast announced capacity actually reaches construction.
Share: 24% | CAGR: 7.0% (2026 to 2036)

Western Europe

Rooftop and commercial-scale installations anchor demand here far more than utility-scale ground mount, since land availability and permitting complexity favor distributed generation across Germany, the Netherlands, and increasingly Poland's western neighbours. The EU's rooftop solar mandate for new commercial buildings, phasing in through the rest of this decade, is pulling carport and building-integrated mounting demand ahead of pure ground-mount racking growth across the bloc. Schletter and K2 Systems, both German-headquartered, hold strong positions in this distributed segment specifically, competing on engineering certification rather than unit price alone. Growth trails East Asia and South Asia and Pacific because utility-scale land constraints and higher installation labor cost cap how quickly gigawatt-scale capacity can be added across most member states.
Share: 19% | CAGR: 6.0% (2026 to 2036)
Regional intelligence for 5 additional markets available in the complete report: East Asia, South Asia and Pacific, Latin America, Middle East and Africa, Eastern Europe. Contact sales@marketmindsadvisory.com.
solar-panel-mounting-structures-market-country-cagr-analysis-1787300143845

How Mounting Suppliers Can Capture More Margin

Margin in this market concentrates where domestic fabrication, engineering differentiation, and contract structure protect a supplier from steel volatility and tariff exposure simultaneously across the full project development cycle from bid to delivery. The four moves below shift revenue toward developers who consistently pay for bankability and local content rather than racking priced purely off tonnage alone.

Qualify Domestic Fabrication For IRA Bonus Credit Tenders

Projects meeting the Inflation Reduction Act's domestic content threshold earn an extra 10 percentage point investment tax credit, and developers now specify qualifying racking suppliers explicitly in bid documents rather than treating content as a bonus consideration. Suppliers with certified domestic roll-forming and galvanizing capacity can price a premium of roughly 8% to 14% over non-qualifying imports, since that premium still costs the developer less than losing the tax credit entirely. Nextracker and Array Technologies both expanded US fabrication specifically to capture this qualifying tender segment, and the order backlog evidence suggests the strategy is working as intended.
Market Impact: Captures an 8% to 14% domestic content premium

Build Floating Solar Engineering Capability Ahead Of Demand

Floating mounting systems require corrosion-resistant floats and anchoring engineering that conventional ground-mount racking suppliers do not currently hold, leaving the fastest-growing segment concentrated among a handful of mostly Chinese and Korean specialists. Suppliers investing in floating-specific engineering now, ahead of broader market entry, can capture roughly 20% to 30% higher margins than commodity ground-mount racking commands, since qualified competition remains genuinely thin. Reservoir and irrigation canal projects across China, India, and Southeast Asia are already moving from pilot to gigawatt-scale procurement, so the qualification window before broader competition arrives is narrowing steadily each year.
Market Impact: Earns 20% to 30% higher floating segment margin

Bundle Long-Term Operations And Maintenance Contracts With Supply

Tracker systems require periodic motor and control system maintenance across a 25-to-30-year project life, and suppliers that bundle multi-year O&M contracts into the original mounting supply agreement capture recurring revenue that pure equipment sales cannot provide. This bundled model can add roughly 12% to 18% to total contract value over the project lifetime while giving developers a single accountable party for tracker performance guarantees. Nextracker's software-plus-service model has demonstrated this can lift customer retention meaningfully at contract renewal, converting what was once a one-time equipment sale into a durable, recurring commercial relationship worth defending.
Market Impact: Adds 12% to 18% in total contract value

Lock Multi-Year Steel Offtake To Stabilize Bid Pricing

Steel price swings of over 100% within a two-year window have repeatedly forced suppliers to either walk away from fixed-price bids or absorb losses on contracts signed before delivery. Producers locking multi-year steel supply agreements with domestic mills, rather than buying entirely on the spot market, can bid utility-scale tenders with roughly 6% to 10% tighter pricing margins because the underlying cost is no longer a live risk during the bid-to-delivery window. That pricing confidence increasingly wins framework agreements against competitors still quoting on spot steel assumptions that developers have grown wary of trusting.
Market Impact: Tightens bid pricing margin by 6% to 10%

Who Controls the Margin Pool

Concentration is light at CR5 22%, assessed on installed tracker and racking capacity shipped, and the gap between leader and challenger reflects software depth more than manufacturing scale. Nextracker's tracking control platform gives it a switching-cost advantage Arctech's larger manufacturing base has not closed.
Three dimensions define current activity. Domestic fabrication racing continues as suppliers open roll-forming and galvanizing lines to qualify for content-linked incentives that increasingly decide tender eligibility outright. Floating solar engineering investment is accelerating, with a handful of Chinese and Korean suppliers building specialist capability before broader competition arrives at scale. Tracker software differentiation keeps advancing, as suppliers add weather-responsive and bifacial-optimised algorithms that squeeze incremental yield gains competitors without comparable data cannot easily match.

Pressure is building from two directions at once. Steel fabricators and structural engineering firms are entering racking directly, competing on manufacturing cost against specialists who built the category. Meanwhile Chinese-linked suppliers keep relocating final assembly across Southeast Asia to manage duty exposure, testing enforcement faster than regulators can close loopholes. Rankings will shift toward suppliers combining qualified domestic fabrication with genuine software differentiation, not toward whoever ships the most tonnage.
solar-panel-mounting-structures-market-company-positioning-matrix-1787300144363

Competitive Moat and Risk Dimensions

NEXTRACKER INC.

Moat: Software-Integrated Tracking Control Platform

Nextracker's tracking algorithms, tuned against weather and shading data across a huge installed base, deliver energy yield gains rivals without comparable operating data struggle to match at scale. That software layer creates a genuine switching cost once a developer standardises its fleet on the platform.
NEXTRACKER INC.

Risk: US Trade Policy Dependency

A large share of Nextracker's revenue concentrates in the US utility-scale market, where domestic content bonus rules currently favour it but could shift under a future policy revision. Renewed tariff escalation or a bonus threshold change would compress margin faster than diversified international competitors would feel it.
ARCTECH SOLAR HOLDING CO.

Moat: Vertically Integrated Manufacturing Scale

Arctech runs integrated steel processing and tracker assembly at a scale few global competitors can match on unit cost, giving it a genuine price advantage in tenders that do not require domestic content. That scale also lets it absorb steel price swings other suppliers cannot.
ARCTECH SOLAR HOLDING CO.

Risk: Geopolitical Trade Barrier Exposure

Anti-dumping and countervailing duties targeting Chinese-linked manufacturers have already closed off large parts of the US market and could extend further into European tenders soon. Arctech's growth increasingly depends on markets outside the duty perimeter, a shrinking list as more governments adopt similar trade measures.

Players Tracked

Prominent Players

Nextracker Inc.
Array Technologies Inc.
Arctech Solar Holding Co.
GameChange Solar
PV Hardware

Other Key Players

Schletter Group
Valmont Solar
Soltec Power Holdings
Clenergy
Esdec Solar
K2 Systems
IronRidge
Unirac Inc.
Renusol
Sunrack
TrinaTracker
Terrasmart
Mibet Energy
Origami Solar
STI Norland

Recent Developments

FEBRUARY 2026

Nextracker expands Texas roll-forming capacity

Nextracker commissioned an expanded roll-forming and galvanizing facility in Texas, lifting US-based tracker fabrication capacity to qualify a larger share of orders for the Inflation Reduction Act domestic content bonus credit ahead of a wave of scheduled utility-scale project financial closes across several states this year.
Signal: Organic capacity expansion, not an acquisition, signals confidence in sustained domestic content demand well ahead of construction.
SEPTEMBER 2025

US Commerce Department extends solar component duties

The US Department of Commerce extended anti-dumping and countervailing duty determinations covering solar racking-adjacent components assembled in Vietnam, Malaysia, and Cambodia, closing transshipment routes that Chinese-linked manufacturers had used to avoid earlier duty determinations on comparable products from several prior review cycles dating back years.
Signal: A regulatory extension, not a corporate transaction, narrows the routes available for circumventing existing duties further.
JUNE 2025

Array Technologies signs multi-year steel supply agreement

Array Technologies signed a multi-year hot-rolled steel supply agreement with a domestic mill to stabilize input cost across its fixed-price utility-scale bidding pipeline, reducing exposure to the spot steel volatility that compressed margins during the 2021 and 2022 project delivery cycles, when several competitors absorbed material losses.
Signal: A supply agreement, not a joint venture, secures pricing certainty without equity entanglement or shared control.

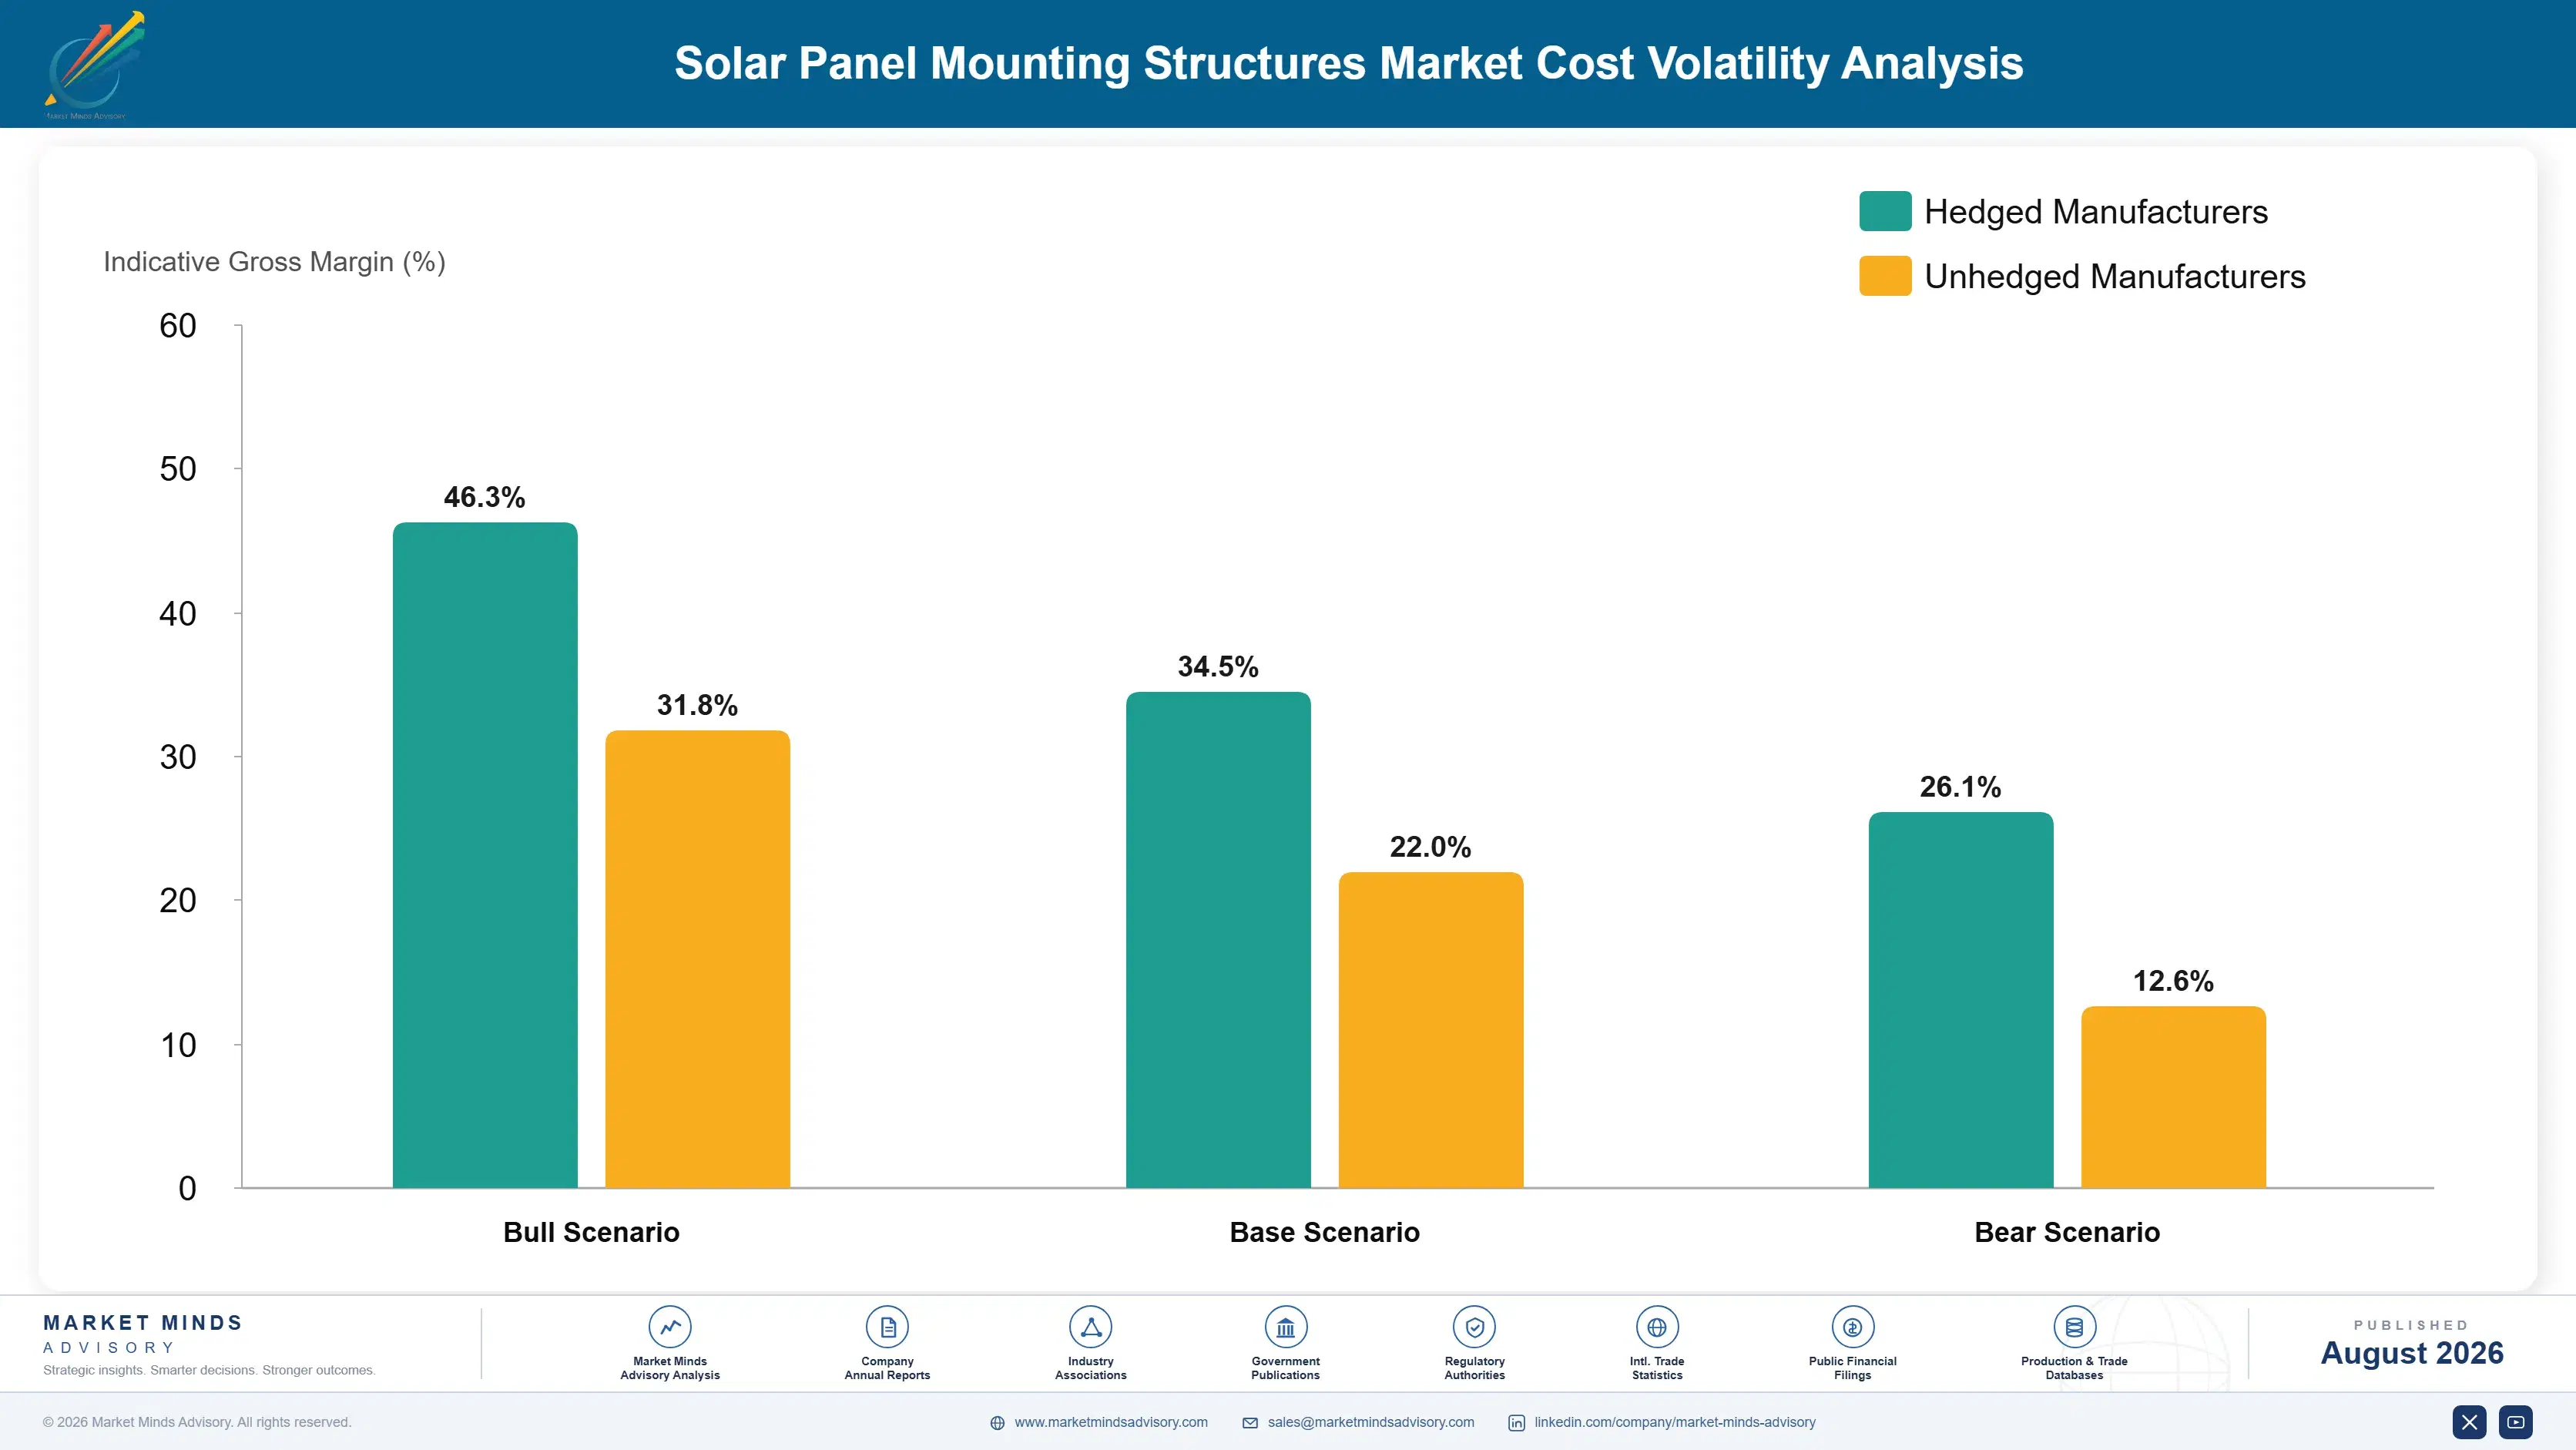
Steel, Zinc, and the Racking Cost Base

Structural steel accounts for 34% to 40% of cash cost of goods sold in ground-mount racking, sourced from hot-rolled coil mills in China, India, and the United States depending on fabrication location. Zinc for hot-dip galvanizing contributes a further 8% to 12%, with tracker motors, gearboxes, and control electronics making up most of the remainder.
Hot-rolled steel coil prices doubled between 2020 and mid-2022, driven by pandemic supply disruption and a subsequent demand surge across every steel-consuming industry at once. The World Steel Association and EIA industrial pricing data both recorded the spike, and several trackers and racking suppliers disclosed materially compressed 2022 gross margins in annual reports as fixed-price contracts signed before the spike came due for delivery. Suppliers without steel hedges absorbed the swing directly against thin margins that could not be renegotiated.

Exposure separates suppliers with domestic fabrication from those relying on imported components. Nextracker and Array Technologies, holding US-based roll-forming capacity, source steel domestically and pass fewer currency and tariff variables through to customers than import-dependent competitors do. Smaller regional fabricators buying steel on the spot market absorb volatility directly, while Southeast Asian assemblers face added tariff exposure integrated competitors avoid.
solar-panel-mounting-structures-market-cost-volatility-analysis-1787300144557

Hedge Steel Exposure Against Futures Through The Bid Cycle

Locking a share of expected steel tonnage through futures contracts, matched to the bid-to-delivery window on major utility-scale tenders, removes the exposure that turned fixed-price 2021 contracts into 2022 losses for several suppliers across the industry. It costs a modest premium but converts an unpredictable cost line into a budgetable one that finance teams can actually plan around.

Diversify Steel Sourcing Across Domestic And Allied Mills

Qualifying steel from multiple domestic and allied-country mills, rather than relying on a single supplier, reduces exposure to any one region's price or trade policy shock and gives procurement genuine negotiating leverage during tight capacity cycles across the calendar year. Suppliers with diversified sourcing also qualify more easily for domestic content credit calculations across most jurisdictions.

Pre-Negotiate Zinc Galvanizing Capacity Ahead Of Peak Season

Galvanizing capacity tightens seasonally as construction activity peaks, and suppliers that pre-book capacity months ahead avoid the premium pricing and delivery delays that spot buyers face during those peak periods regularly. This matters especially for utility-scale projects, where a missed galvanizing slot can push an entire interconnection deadline back significantly and expensively for everyone involved.

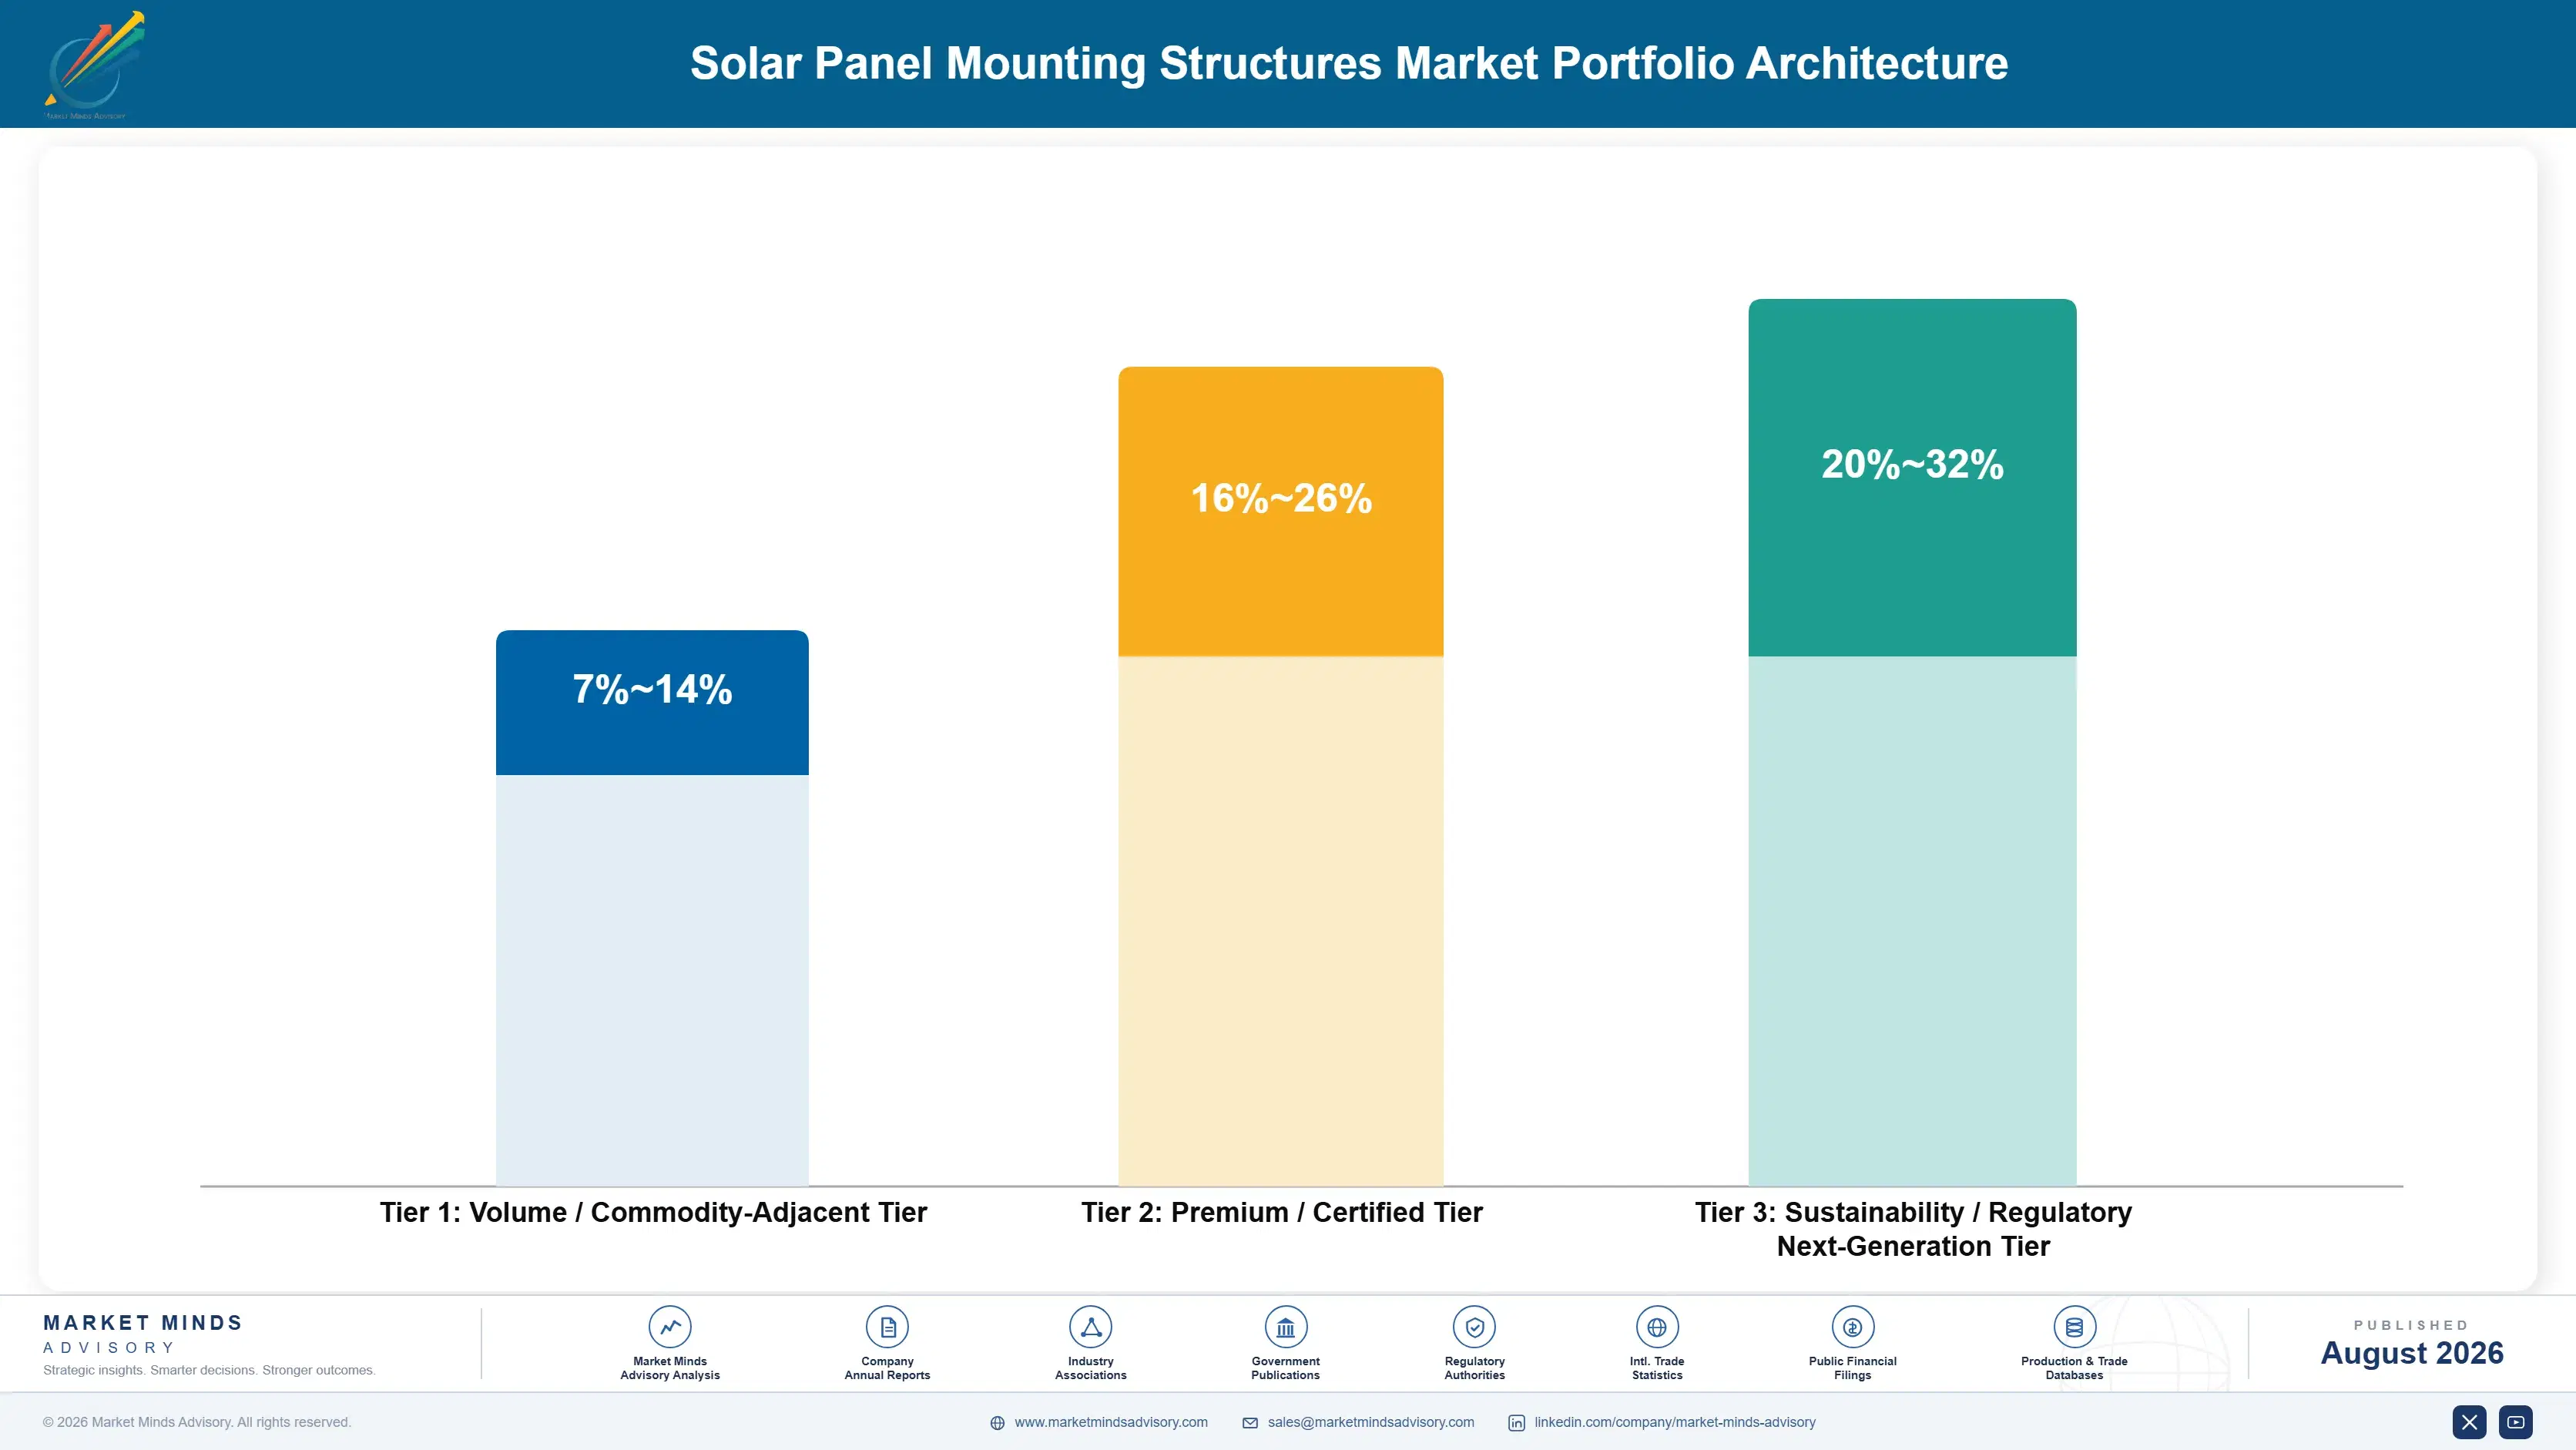
Portfolio Architecture for Margin Defence

The portfolio splits into three margin tiers separated by engineering complexity, certification, and buyer sophistication rather than tonnage alone. Commodity fixed-tilt racking competes almost entirely on steel cost and installation speed, while certified utility-scale tracker systems and next-generation floating structures earn considerably more because fewer suppliers can engineer and warranty them credibly at meaningful project scale.
The tension running through every supplier strategy is volume against premium. Commodity racking funds fixed roll-forming overhead and keeps fabrication lines running, but it earns thin single-digit to low-double-digit margins that barely survive a bad steel quarter. Tracker systems and floating structures carry the earnings upside, yet they demand engineering talent, software development, and patient certification work that smaller fabricators often cannot sustain through a full multi-year investment cycle.

High-value pools concentrate wherever a buyer cannot easily substitute supplier or design: floating structures for land-constrained reservoirs, domestic-content-qualified trackers for incentive-linked tenders, and bankable utility-scale systems carrying long warranty terms all sit here. Commodity fixed-tilt racking, sold into distributed and smaller ground-mount projects, remains the volume anchor that keeps fabrication lines utilised but contributes comparatively little to blended profitability across a typical supplier full product mix.

Volume / Commodity-Adjacent Tier

Commodity fixed-tilt ground mount and standard residential rooftop racking sold on steel cost and installation speed, competing directly against regional fabricators on landed cost with minimal engineering differentiation across most project types and geographies.
Gross Margin: 7-14%

Premium / Certified Tier

Certified utility-scale single-axis and dual-axis tracker systems carrying bankability documentation, wind and snow load engineering certification, and multi-year warranty terms that smaller uncertified fabricators cannot credibly offer institutional buyers today.
Gross Margin: 16-26%

Sustainability / Regulatory / Next-Generation Tier

Floating solar structures and domestic-content-qualified trackers built specifically for incentive-linked tenders, plus emerging agrivoltaic mounting designed for genuine dual land use that commands a real engineering premium over commodity racking.
Gross Margin: 20-32%
solar-panel-mounting-structures-market-portfolio-architecture-1787300145053

High-value Sub-segments and Strategic Watch-out

Floating Solar Mounting Structures

Floating solar mounting is the high-value, high-growth pool, expanding at 13.5% as reservoir and canal projects scale across China, South Korea, and India. The wide margin range reflects engineering maturity: proven suppliers with gigawatt-scale references capture the top end, while newer entrants without a track record earn considerably less.
Gross Margin: 22-32%

Single-Axis Tracker Mounts

Single-axis tracker mounts form the high-value, moderate-growth pool at 10.5%, now capturing most new utility-scale capacity as the energy yield case clears its cost hurdle almost everywhere. The wide range reflects software differentiation, since suppliers with proven control algorithms earn more than commodity tracker mechanics alone can command.
Gross Margin: 18-27%

Fixed-Tilt Ground Mount Racking

Fixed-tilt ground mount racking is the volume core, the largest tonnage segment by far and the one every fabricator depends on to keep roll-forming lines running through cycles. Margins stay thin because pricing tracks steel and delivered cost closely, leaving limited room for differentiation across competing domestic and imported supply.
Gross Margin: 7-13%

Residential Rooftop Racking

Residential rooftop racking is the strategic watch-out, exposed to net metering policy rollbacks like California's NEM 3.0 that have already slowed distributed installation growth in several major markets. The wide range reflects that installers with strong brand and financing partnerships still earn well while undifferentiated racking competes purely on price.
Gross Margin: 9-19%

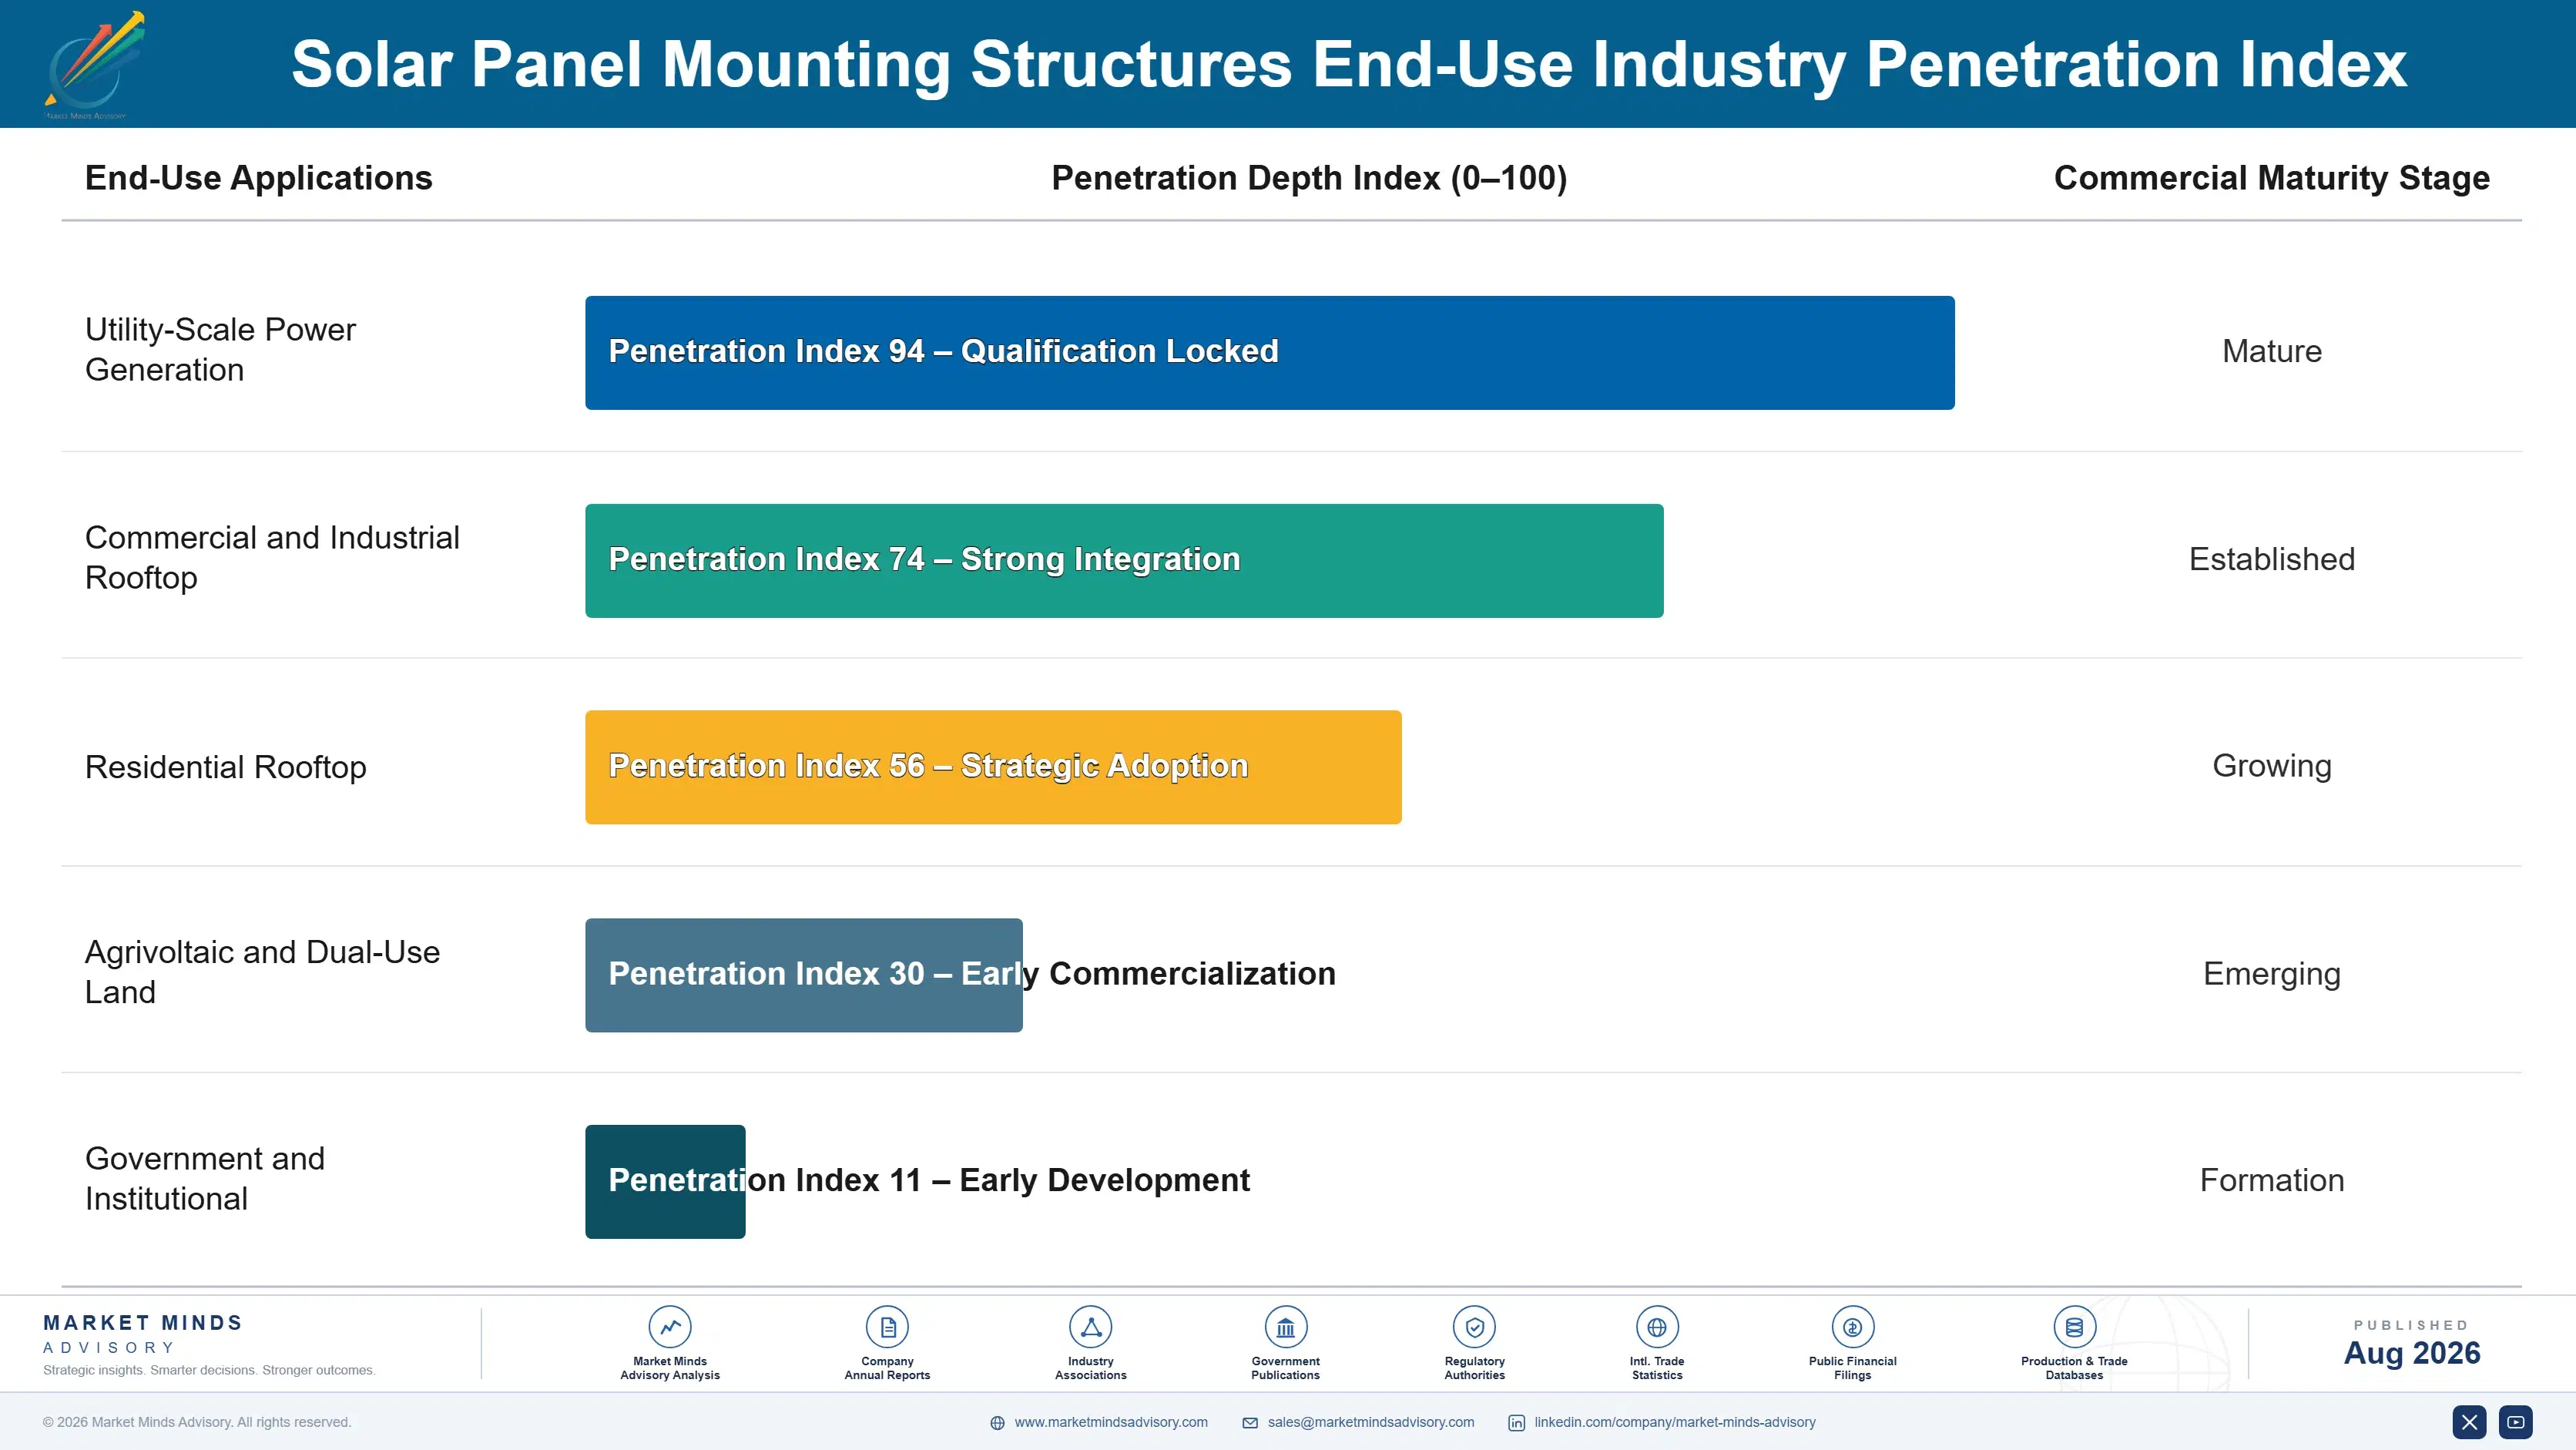
How Mounting Demand Actually Repeats

Demand here runs increasingly on service annuities rather than one-off equipment sales for tracker systems specifically. Warranty terms extending 25 to 30 years and bundled operations and maintenance contracts give suppliers recurring revenue tied to the installed base rather than only to new construction volume. Fixed-tilt racking still sells mostly as one-time equipment.
Adoption depth varies sharply by vertical. Utility-scale developers, once a supplier clears bankability review with project financiers, rarely switch suppliers mid-portfolio, since requalifying a new tracker platform costs more in engineering and financing delay than any price gap could offset. Residential and commercial rooftop buyers sit at the other extreme, treating racking largely as a commodity input selected by the installer. Floating solar developers fall between the two, loyal to a proven partner but open-bid on unproven ones.

Buyer profiles have shifted generationally too. Utility-scale procurement increasingly runs through digital bid platforms that score suppliers on bankability data and warranty terms rather than relationship alone, opening qualification to newer entrants that can demonstrate the data. Younger project finance teams also weigh domestic content and embedded carbon more heavily than predecessors did, a shift starting to matter as much as unit price in some tenders.
solar-panel-mounting-structures-market-end-use-penetration-index-1787300145541

Where Mounting Suppliers Should Bet Next

These are among the four positions where our research anticipates prominent divergence between winners and laggards over the coming forecast period. Each is grounded in the demand model, the regulatory perimeter, and the announced capacity pipeline.
01 / DOMESTIC FABRICATION STRATEGY

Qualifying for content bonus credits is now a core capital allocation decision

Suppliers that invested in US roll-forming and galvanizing capacity ahead of the Inflation Reduction Act's domestic content rules are now winning tenders that non-qualifying competitors cannot bid competitively at all, regardless of unit price offered. Nextracker and Array Technologies both expanded domestic fabrication specifically to capture this qualifying segment, and order backlog data suggests the strategy has paid off faster than initially modelled internally. Suppliers still relying entirely on offshore fabrication should treat qualification as urgent, not optional, capital planning.
02 / FLOATING SOLAR POSITIONING

Early engineering investment in floating structures secures a thinning competitive window

Floating solar mounting remains concentrated among a handful of mostly Chinese and Korean specialists, and that qualification window is narrowing as reservoir and canal projects move from pilot scale toward genuine gigawatt-scale procurement across several Asian markets over the next few years. Suppliers building corrosion-resistant float and anchoring engineering now can capture margins meaningfully above commodity ground-mount racking before broader competition arrives and compresses that advantage. Waiting until the segment matures further will mean entering against entrenched incumbents holding real operating track records.
03 / STEEL HEDGING DISCIPLINE

Fixed-price bidding without steel hedges remains an avoidable, self-inflicted margin risk

The 2021 to 2022 steel price spike taught the industry a lesson that some suppliers still have not fully internalized, given how many fixed-price utility-scale contracts were signed without any hedge against underlying steel cost. Producers locking multi-year mill agreements or futures positions ahead of major bid cycles now price tenders with materially tighter, more defensible margins than competitors still quoting purely on spot assumptions. This discipline is becoming a genuine competitive differentiator in bid evaluations, not merely a finance department concern.
04 / SOFTWARE DIFFERENTIATION MOAT

Tracking software is becoming the durable moat hardware alone cannot replicate

Nextracker's lead traces less to manufacturing scale than to tracking algorithms tuned against a uniquely large base of real operating data that smaller rivals simply do not possess yet at any comparable scale. Competitors investing purely in hardware cost reduction, without comparable software and data investment, will keep losing bankability-sensitive utility-scale tenders to suppliers who can demonstrate proven yield performance across many prior operating projects already deployed. Expect software and data capability to matter more than manufacturing cost in future supplier selection.

Engagement Snapshot From the Field

A live engagement with an industry participant carrying material or product regulatory and market exposure ahead of a defining policy shift, showing how our research translates into a defensible multi-year portfolio strategy.
MARKET MINDS ADVISORY · CLIENT ENGAGEMENT SUMMARY
Solar Panel Mounting Structures Producer Strategic Portfolio Review and Transition Roadmap 2026·Investment Scenario on Solar Panel Mounting Structures Exposure Evaluation 2025-26
CLIENT PROFILE
A US-based utility-scale solar developer with a multi-gigawatt project pipeline approached MMA while selecting a tracker supplier for a 400 megawatt Texas project nearing financial close. The client reported total project capital cost near USD 380 million, with domestic content bonus eligibility worth a targeted 10 percentage point investment tax credit uplift (client-reported, unverified by MMA).
STRATEGIC CHALLENGE
Two shortlisted tracker suppliers offered broadly similar pricing, but only one could credibly document domestic content compliance under evolving Treasury guidance, and management could not tell whether the documentation risk genuinely justified paying a premium for the more conservatively compliant option given looming financial close deadlines and lender requirements ahead.
MMA APPROACH
MMA reviewed both suppliers domestic content documentation against current Treasury safe harbor guidance and modelled the tax credit exposure under three separate compliance interpretation scenarios. We also benchmarked each supplier steel sourcing structure and delivery track record on comparable recent utility-scale projects to assess execution risk beyond documentation quality alone.
KEY FINDINGS
  1. The lower-priced supplier's domestic content documentation relied on an aggressive interpretation of manufactured product cost allocation that Treasury guidance had not yet clearly validated.
  2. A conservative compliance failure scenario would have cost the client roughly USD 38 million in lost tax credit value, far exceeding the price premium of the safer supplier option (client-reported, unverified by MMA).
  3. The more conservative supplier's steel sourcing came entirely from two qualified domestic mills, reducing delivery risk relative to the competitor's broader but less vetted supply base.
  4. Neither supplier had modelled a scenario where Treasury guidance tightened after financial close, a gap the client had not previously identified in its own risk register.
CLIENT PROFILE
A US-based utility-scale solar developer with a multi-gigawatt project pipeline approached MMA while selecting a tracker supplier for a 400 megawatt Texas project nearing financial close. The client reported total project capital cost near USD 380 million, with domestic content bonus eligibility worth a targeted 10 percentage point investment tax credit uplift (client-reported, unverified by MMA).
STRATEGIC CHALLENGE
Two shortlisted tracker suppliers offered broadly similar pricing, but only one could credibly document domestic content compliance under evolving Treasury guidance, and management could not tell whether the documentation risk genuinely justified paying a premium for the more conservatively compliant option given looming financial close deadlines and lender requirements ahead.
MMA APPROACH
MMA reviewed both suppliers domestic content documentation against current Treasury safe harbor guidance and modelled the tax credit exposure under three separate compliance interpretation scenarios. We also benchmarked each supplier steel sourcing structure and delivery track record on comparable recent utility-scale projects to assess execution risk beyond documentation quality alone.
KEY FINDINGS
  1. The lower-priced supplier's domestic content documentation relied on an aggressive interpretation of manufactured product cost allocation that Treasury guidance had not yet clearly validated.
  2. A conservative compliance failure scenario would have cost the client roughly USD 38 million in lost tax credit value, far exceeding the price premium of the safer supplier option (client-reported, unverified by MMA).
  3. The more conservative supplier's steel sourcing came entirely from two qualified domestic mills, reducing delivery risk relative to the competitor's broader but less vetted supply base.
  4. Neither supplier had modelled a scenario where Treasury guidance tightened after financial close, a gap the client had not previously identified in its own risk register.
RECOMMENDED STRATEGY
Phase 1: Phase 1 (0 to 2 months): Select the conservatively compliant supplier despite the modest price premium, prioritising tax credit certainty over headline equipment cost. Phase 2: Phase 2 (2 to 6 months): Negotiate contractual indemnification from the supplier covering any retroactive domestic content compliance determination by Treasury. Phase 3: Phase 3 (6 to 24 months): Monitor Treasury guidance updates quarterly and maintain a documented compliance file independent of the supplier's own records.
OUTCOME
The client selected the conservatively compliant supplier and secured contractual indemnification language that no competing bidder had offered. Treasury guidance tightened six months later in a way that would have jeopardized the alternative supplier's compliance claim, validating the more cautious selection (client-reported, unverified by MMA).

Frequently Asked Questions

Foundational context covering the market sizes, CAGR, scope, country, region and competition that inform every finding below. This section is provided to cover basics and most often pre-purchase conversations, answered from the MMA Primary Research Dataset.

What is the current size of the Solar Panel Mounting Structures Market?

The global solar panel mounting structures market was valued at USD 8.4 billion in 2025. Utility-scale tracker systems and floating structures now account for the fastest-growing share of that total.

How large will the Solar Panel Mounting Structures Market be by 2036?

The market is projected to reach USD 18.7 billion by 2036, up from USD 9.0 billion in 2026. That represents an incremental opportunity of roughly USD 9.7 billion across the forecast decade.

What is the CAGR for the Solar Panel Mounting Structures Market 2026 to 2036?

The base case CAGR is 7.6% annually. MMA models a bull case of 8.9% if steel prices stay range-bound, and a bear case of 6.3% if renewed trade tariffs slow project financing.

Which segment is growing fastest?

Floating solar mounting structures grow fastest at 13.5% CAGR, about 1.78 times the overall market rate, as land-constrained markets in China, South Korea, and India turn reservoirs into generation sites.

Who are the major companies in the Solar Panel Mounting Structures Market?

Nextracker Inc., Array Technologies Inc., Arctech Solar Holding Co., GameChange Solar, and PV Hardware lead on installed capacity shipped. Nextracker leads specifically on tracking control software depth.

Which country is growing fastest?

India posts the fastest national CAGR at 12.5%, driven by national solar mission targets, the PM Surya Ghar rooftop scheme, and domestic content requirements pulling fabrication capacity into Gujarat and Tamil Nadu.

Report Segmentation Architecture

The full report scope spans multiple orthogonal segmentation dimensions, with cross-tabulated demand data provided for each dimension pair. Coverage extends further to regional breakdowns, trend trajectories, and the competitive detail needed to support segment-level decision-making.

By Mounting Structure Type

  • Fixed-Tilt Ground Mount
  • Single-Axis Tracker
  • Dual-Axis Tracker
  • Rooftop Mounting
  • Floating Solar Mounting
  • Carport and Building-Integrated Mounting

By End-Use Industry

  • Utility-Scale Power Generation
  • Commercial and Industrial Rooftop
  • Residential Rooftop
  • Agrivoltaic and Dual-Use Land
  • Government and Institutional

By Commercial Dimension

  • Direct EPC and Developer Supply
  • Distributor and Installer Channel Sales
  • Engineering and O&M Service Contracts
  • Government Tender and Framework Agreements

By Region

  • North America
  • Western Europe
  • East Asia
  • South Asia and Pacific
  • Latin America
  • Middle East and Africa
  • Eastern Europe

Scope, Methodology, and Coverage

Every figure in this report is reproducible from documented input assumptions. The scope below maps the historical period, the forecast horizon, the segmentation dimensions, and the countries covered, alongside the underlying primary and qualitative methodology.
Historical Period
2020 to 2025
Forecast Period
2026 to 2036
Base Year
2025 (USD billions; MMA Primary Research Dataset, August 2026)
Market Definition
The market covers structural racking, tracking, and foundation systems that mount photovoltaic modules on ground, rooftop, floating, and carport installations, including tracker control electronics sold as part of the mounting system. Standalone photovoltaic modules, inverters, and balance-of-system electronics sold separately are excluded from the defined scope.
Quantitative Units
USD billions (current prices); megawatts of installed mounting capacity shipped where applicable
Segmentation Dimensions
By Mounting Structure Type; By End-Use Industry; By Commercial Dimension; By Region
Regions Covered
North America, Western Europe, East Asia, South Asia and Pacific, Latin America, Middle East and Africa, Eastern Europe
Countries Covered
USA, China, Germany, France, UK, Japan, South Korea, India, Australia, Canada, Brazil, Mexico, Indonesia, Vietnam, Thailand, Malaysia, UAE, Saudi Arabia, South Africa, Nigeria, Turkey, Poland, Netherlands, Italy, Spain, Sweden, Switzerland, Argentina, Colombia, Singapore, and additional markets relevant to this sector
Key Companies Profiled
Nextracker Inc., Array Technologies Inc., Arctech Solar Holding Co., GameChange Solar, PV Hardware, Schletter Group, Valmont Solar, Soltec Power Holdings, Clenergy, Esdec Solar, K2 Systems, IronRidge, Unirac Inc., Renusol, Sunrack, TrinaTracker, Terrasmart, Mibet Energy, Origami Solar, STI Norland
Quantitative Methodology
Primary survey, n=3,800 respondents, Q4 2025, six countries; demand-side model with trade association cross-validation
Qualitative Methodology
47 expert interviews, Q4 2025; applied to validate demand model assumptions, identify emerging dynamics, and assess competitive positioning
Report Format
PDF and XLSX data workbook (Word format preview document)
Publisher
Market Minds Advisory
Report Code
MMA-2026-ENE-102
Published
August 2026
Contact
sales@marketmindsadvisory.com | www.marketmindsadvisory.com

Purchase the full Solar Panel Mounting Structures Market Report (2026 to 2036).

The full MMA Solar Panel Mounting Structures report sizes the market across six structure types, five end-use industries, four commercial channels, and seven regions through 2036. It profiles 20 participants on a consistent installed capacity shipped basis, scoring the top two on software differentiation, domestic fabrication depth, and trade policy exposure. Scenario models quantify how domestic content incentives, anti-dumping duty schedules, and steel price volatility move both demand and realised pricing. The report also includes delivered-cost modelling by structure type, a tariff exposure screen, floating solar engineering readiness tracking, and a certification investment prioritisation framework built for strategy, procurement, and investment teams.
Six-type segmentation with capacity and value forecasts
Seven-region demand map with country-level detail
Twenty-company competitive profiles on shipped capacity
Steel and zinc feedstock cost sensitivity modelling
Domestic content and trade policy tracking
Floating solar engineering readiness assessment playbook

Built For The People Who Decide

From boardroom strategy to bench-side execution, this report is read cover-to-cover by leaders shaping the next decade of their industry, turning demand scenarios, market dynamics and valuation benchmarks into decisions.
CXOs/ Presidents/ VPs/ Managers
M&A and Corporate Development
Strategy Teams and R&D Heads
Procurement and Product Directors
Regulatory and Compliance Leaders
Investor Relations and Equity Analysts