Market Minds Advisory
Solar Inverter Market

Solar Inverter Market: Solar Inverter: The Only Component That Has to Be Replaced Twice

Panels are warranted for a quarter century and inverters for barely half that, so a replacement fleet is arriving from the last installation boom while manufacturers stay organised entirely around new capacity.

Lead Analyst

David Horsley

Published

August 2026

Make Smarter Decisions with Customized Research Insights

Request a free sample report and evaluate market opportunities, growth trends, and competitive dynamics relevant to your business needs.

2025 MARKET VALUE$14.8BMarket Size 2025
2036 FORECAST VALUE$35.9BBase Case , 2026 to 2036
CAGR 2026 TO 20368.4 %Bull 9.6% / Bear 7.2%
INCREMENTAL OPPORTUNITY$19.9BNet 10- year value creation
EXPANSION MULTIPLE2.24x2036 value over 2026 base
Strategic Levers
M&A Pipeline
Regional Outlook
Country Rankings
Competitive Intelligence
Segmental Deep-dive
Call-Us : 91 93563 13602

Executive Snapshot and Market Trajectory.

One component in a solar array has to be replaced during the array's own life. Panels carry 25 year warranties and inverters are designed for around 12, which means a replacement fleet is building underneath the new installation market and almost nobody has organised for it.
Roughly 340 gigawatts of installed capacity now sits on inverters approaching the end of their rated life, and that volume arrives whether or not anybody installs another panel. The economics are different too, because a replacement decision is made by an asset owner watching yield rather than by a developer minimising capital cost per watt on a new project. Very few manufacturers sell credibly to both.
Meanwhile the product itself changed. Grid codes turned the inverter from a power converter into a grid asset that must supply reactive power to around 0.8 power factor, ride through disturbances and increasingly form grid voltage itself. That is software and certification work rather than silicon, and it is where differentiation moved once hardware pricing collapsed toward five cents per watt. Certification depth across national grid codes is now the most durable asset available.
Market Definition
Photovoltaic inverters supplied across all topologies and power ratings, covering string inverters, central inverters, hybrid and storage-coupled inverters, microinverters, power optimisers, and off-grid and standalone inverters. Measured at manufacturer selling value across new installation and replacement demand. Excludes photovoltaic modules, mounting structures, batteries and battery management systems, standalone grid-scale power conversion systems, and installation or engineering services.
Base Year Value
$14.8B in 2025 (MMA Primary Research Dataset, August 2026)
Forecast Period
2026 to 2036, eleven discrete annual values
CAGR
8.4% base case. Bull 9.6%. Bear 7.2%.
Fastest Growth Segment
Hybrid and Storage-Coupled Inverters: 12.6% CAGR
Fastest Growth Country
India: 14.2% CAGR
Fastest Growth Region
South Asia and Pacific: 10.6% CAGR
Largest Region
East Asia: 30% of 2025 global value
Market Leaders
Huawei, Sungrow, SMA Solar Technology, Enphase Energy, SolarEdge Technologies. Source: MMA Primary Research Dataset, July 2026.
Primary Survey
n=3,800 procurement and R&D decision-makers, Q4 2025, six countries
Methodology
Demand-side build-up, cross-validated against public data, 47 expert interviews

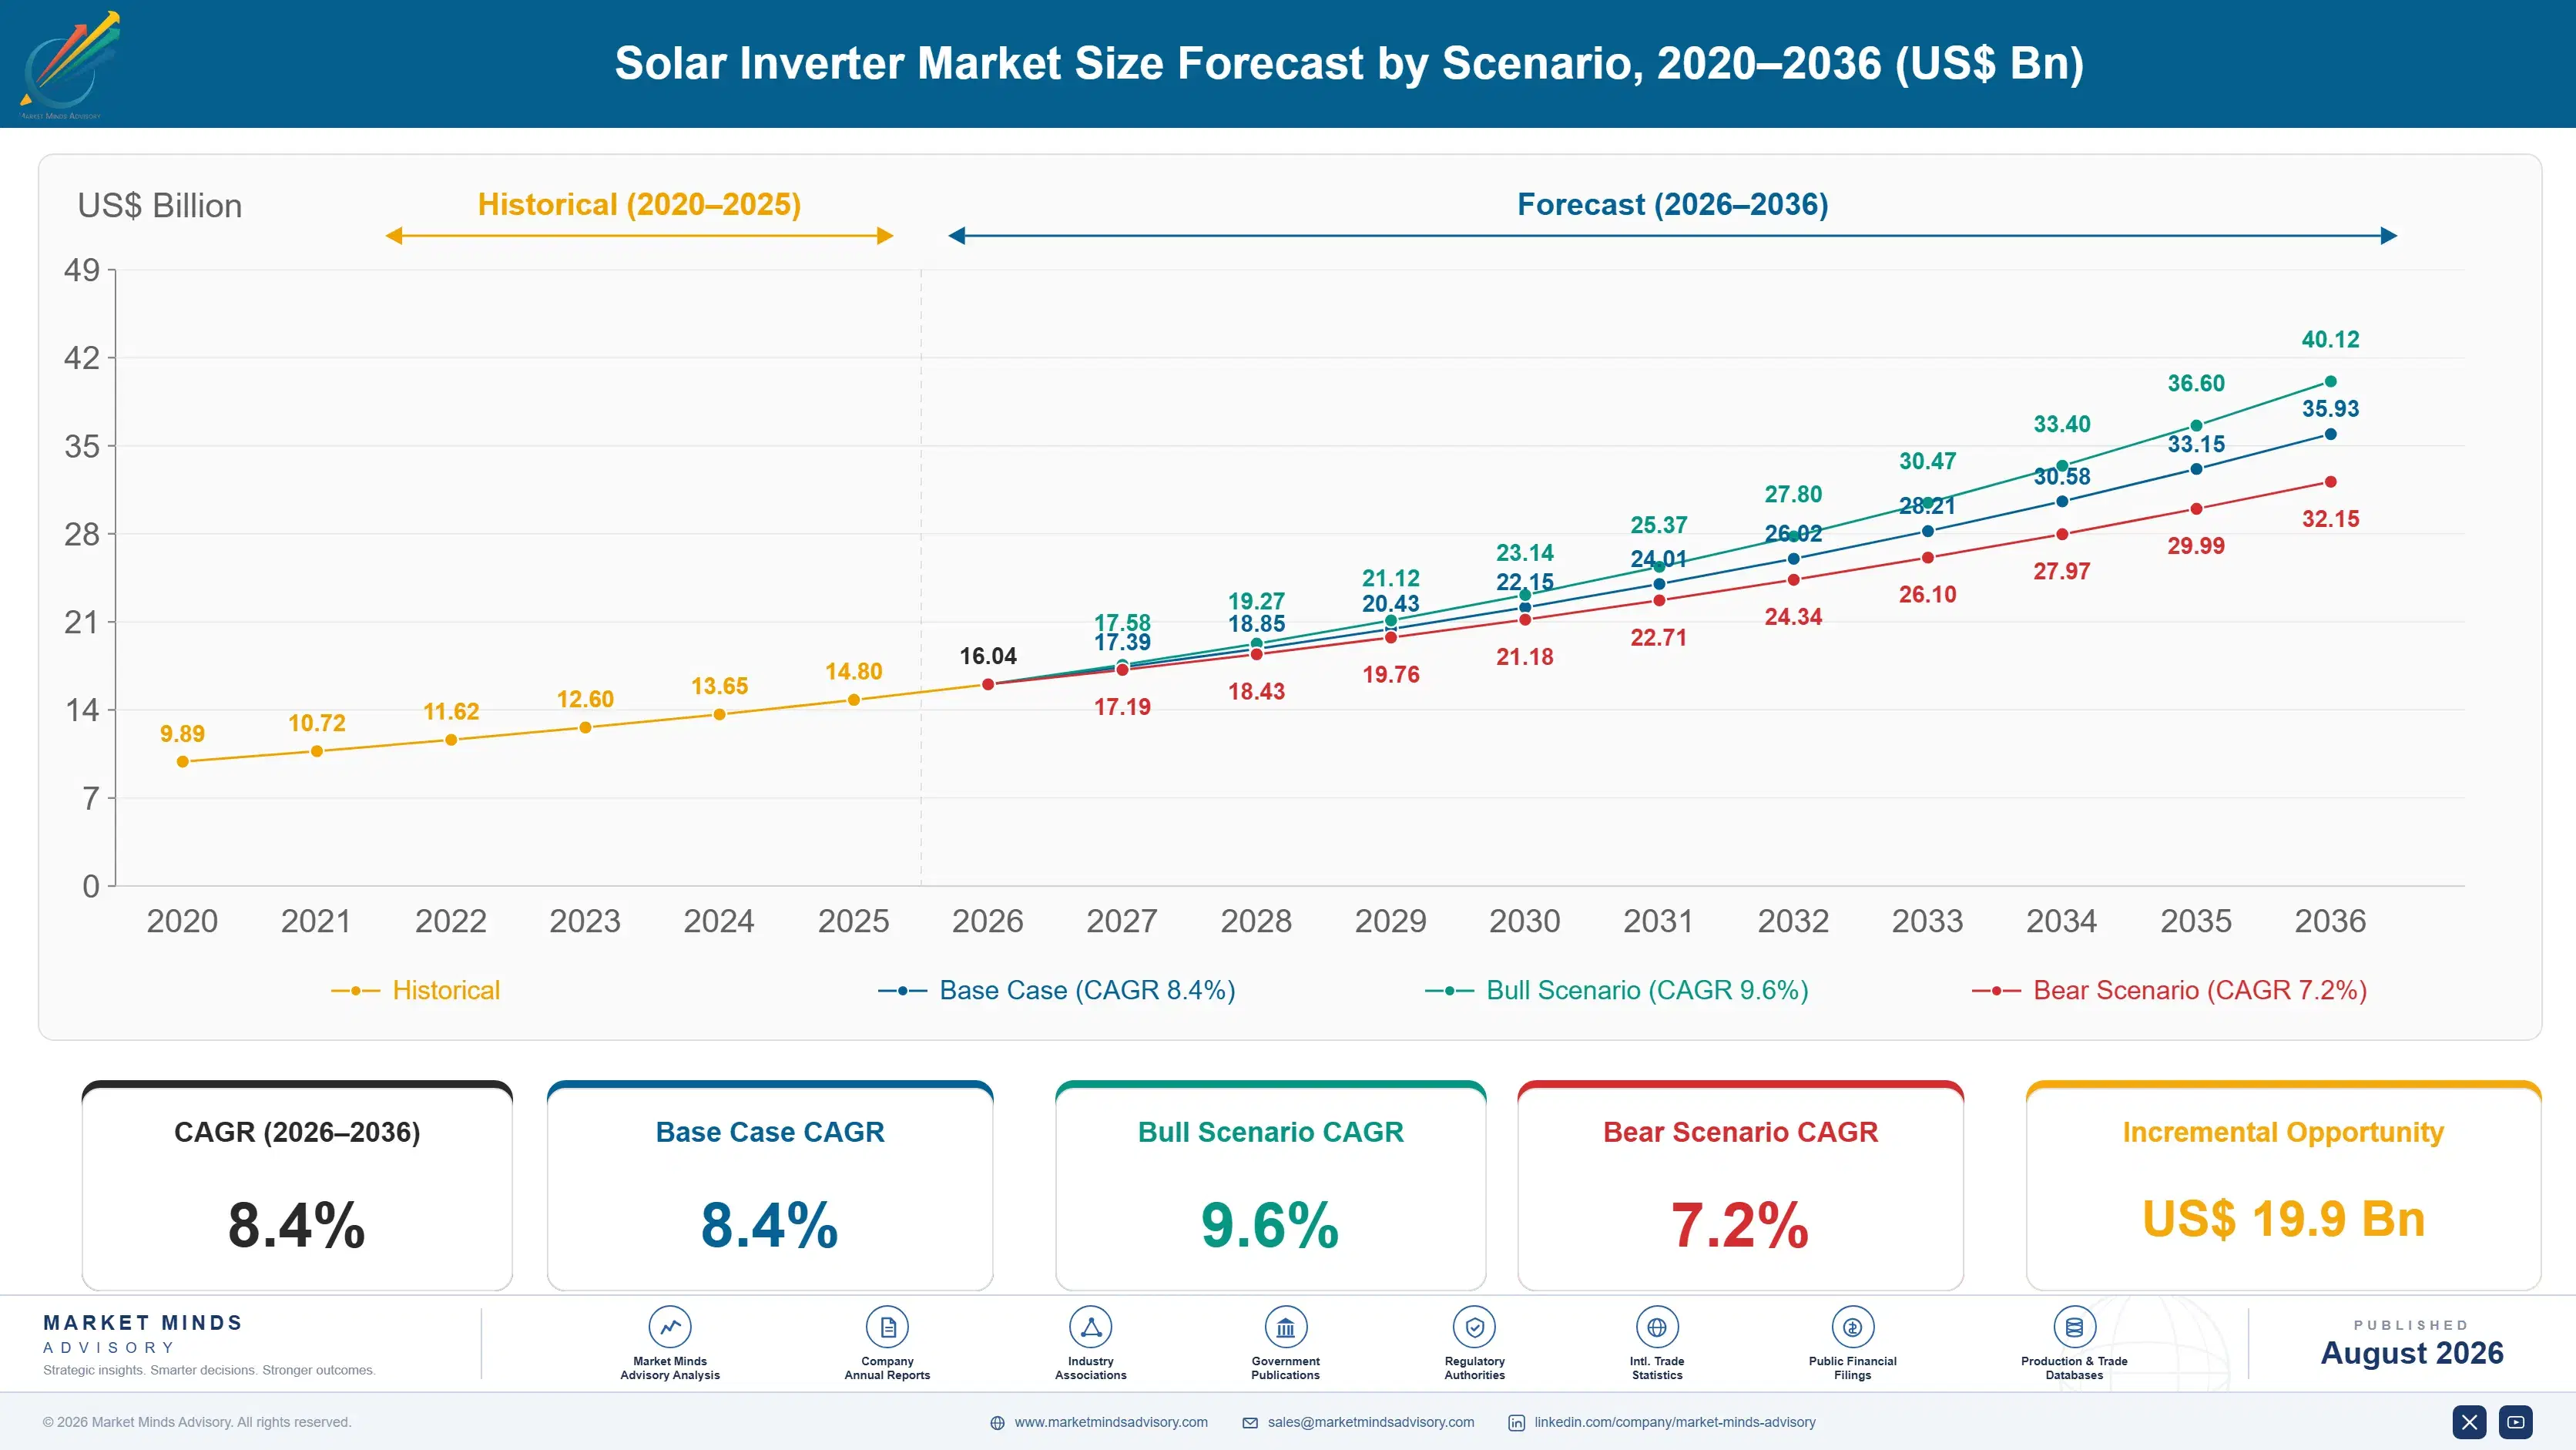
Solar Inverter Market Forecast Scenarios

solar-inverter-market-size-forecast-scenario-1787595257701
Growth ran near 7.4% between 2020 and 2025, and the shape of it was unusual because installed capacity grew far faster than value did. Inverter pricing fell continuously across the period as Chinese manufacturing scale expanded, so shipment volume rose considerably more quickly than revenue. Storage-coupled hybrid units were the exception, holding pricing on functionality conventional string products could not match.
Base case 8.4% rests on three mechanisms. Hybrid and storage-coupled inverters grow at 12.6% as residential and commercial storage attaches to new and existing arrays across markets where export tariffs have fallen. Replacement demand from roughly 340 gigawatts of ageing installed capacity arrives independently of new build entirely. And grid code requirements push average selling prices up on advanced units even as basic hardware pricing keeps falling. Content per unit rises while cost per watt keeps falling.
The bull case at 9.6% assumes grid-forming capability becoming a connection requirement in more markets, which would lift content per unit materially. The bear case at 7.2% is continued price deflation outrunning volume growth, with commoditised string hardware pulling value down faster than storage attachment and replacement demand lift it. Utility scale bidding is where that pressure lands hardest.

The Component With Two Lives to Fund

The defining commercial fact here is a mismatch in service life. A module carries a 25 year performance warranty and often outlives it, while the inverter behind it is designed for around 12 years and fails first. Every array therefore buys at least two inverters across its life, and roughly 340 gigawatts of installed capacity worldwide is now approaching that second purchase whether or not another panel gets installed anywhere.
TOP FIVE CONCENTRATION62%Manufacturing scale has concentrated the field considerably over time
INVERTER DESIGN LIFE12 yearsRated service life against the panel array behind it
UTILITY INVERTER PRICING$0.05/WManufacturer pricing measured on a delivered capacity basis
SHARE OF SYSTEM CAPITAL8%Inverter portion of total installed system capital cost
REPLACEMENT FLEET DUE340 GWInstalled capacity reaching the end of inverter life
REACTIVE POWER RANGE0.8 pfGrid support capability now required by most connection codes
That replacement demand behaves nothing like new installation demand. A developer building a new project minimises capital cost per watt because the inverter is only about 8% of system capital and every cent shows up in the bid. An asset owner replacing a failed inverter watches yield, downtime and warranty support instead, and pays more for a unit that does not need visiting. Very few manufacturers sell to both properly.
The product itself has also changed underneath the pricing. Grid codes now require reactive power support to around 0.8 power factor, fault ride-through, frequency response and increasingly grid-forming behaviour. That is control software and certification testing rather than power electronics, and it is where genuine differentiation now sits after hardware pricing fell toward five cents per watt.
"Everybody in this industry sells against a developer's capital cost model and then wonders why margins keep disappearing. The asset owner replacing a dead inverter on a ten year old array has an entirely different question, and almost nobody has built a commercial organisation capable of answering it."
Director, Power Electronics and Grid Integration Practice · MMA Energy and Power Practice · August 2026

Market Trends

Replacement fleet arriving from the last installation boom

Roughly 340 gigawatts of installed photovoltaic capacity now sits on inverters approaching the end of a rated life of around 12 years, against panels warranted for 25. That replacement volume arrives on its own schedule regardless of new installation activity, which makes it the most predictable demand in this market. Asset owners buy on yield, downtime and support rather than on capital cost per watt, and manufacturers organised around developer bidding are simply not equipped to serve them properly. The channel is wrong before anybody quotes a price. Almost nobody has built for it.
Market Impact: Hybrid units growing at 12.6%
Grid codes moving differentiation from silicon into software

Connection requirements now demand reactive power support to around 0.8 power factor, fault ride-through, frequency response and increasingly grid-forming behaviour that establishes voltage rather than following an existing grid. Meeting them is control software and certification testing rather than power electronics design, and certification for each national grid code takes months and considerable expense. That barrier holds value where hardware pricing at five cents per watt no longer can, and it favours manufacturers with certification depth across many markets. It also favours manufacturers who certify ahead of a requirement rather than after one,
Market Impact: India growing fastest at 14.2%

Market Opportunities and Growth Drivers

Storage attachment rewriting the inverter specification entirely

Hybrid and storage-coupled inverters grow at 12.6% as falling export tariffs push residential and commercial owners toward self-consumption, which requires an inverter managing both photovoltaic input and battery flow rather than simply converting direct current. The unit carries considerably more content, more control software and better pricing than a comparable string product. Retrofit onto existing arrays adds a second demand pool that most manufacturers have barely begun addressing with dedicated commercial effort. Pricing holds far better than commodity string products, which matters considerably in a market where hardware value has been falling for a decade.
Market Impact: Pricing fell toward $0.05 per watt

Indian installation programmes scaling faster than anywhere else

India grows fastest of any country at 14.2%, driven by utility scale tendering, rooftop programmes and domestic content requirements that favour local manufacture. Those content rules have brought several international manufacturers into Indian assembly rather than importing finished units, which changes the competitive position considerably. Grid integration requirements are tightening alongside the volume, which lifts content per unit at the same time as the installed base expands across both utility and distributed segments. Rooftop programme volume is arriving alongside utility tendering rather than after it, which spreads demand across topologies rather than concentrating it in central units.
Market Impact: Affects fleets above 1 GW

Market Restraints and Challenges

Price deflation outrunning volume growth across commodity topologies

Utility scale inverter pricing has fallen toward five cents per watt, and shipment volumes have grown considerably faster than revenue for a decade as a result. The root cause is manufacturing scale concentrated in a small number of very large producers who compete directly on delivered cost per watt. Commercially it means volume growth does not translate to value growth. Storage attachment, grid code content and replacement demand are the three mitigations participants are pursuing, and all three raise value per unit rather than volume. None of them stops the deflation itself.
Market Impact: Covers 340 GW of installed capacity

Remote control capability raising grid security concerns

Inverters aggregating to many gigawatts are remotely updatable and remotely controllable, which grid operators and security agencies in Europe and North America have begun treating as a genuine control question rather than a theoretical one. The root cause is that connectivity was designed for fleet management before anybody considered the aggregate. Commercially it is producing procurement rules favouring domestic manufacture and auditable firmware. Local control architecture and independent firmware audit are the mitigations manufacturers are now offering. Neither is expensive, and both reach procurement functions that competitors currently cannot answer at all.
Market Impact: Requires 0.8 power factor support
3 additional market trends, 4 additional growth drivers, and 2 additional restraints and challenges are covered in the full report. Contact sales@marketmindsadvisory.com to access the complete intelligence.

Segment CAGR and Growth Architecture

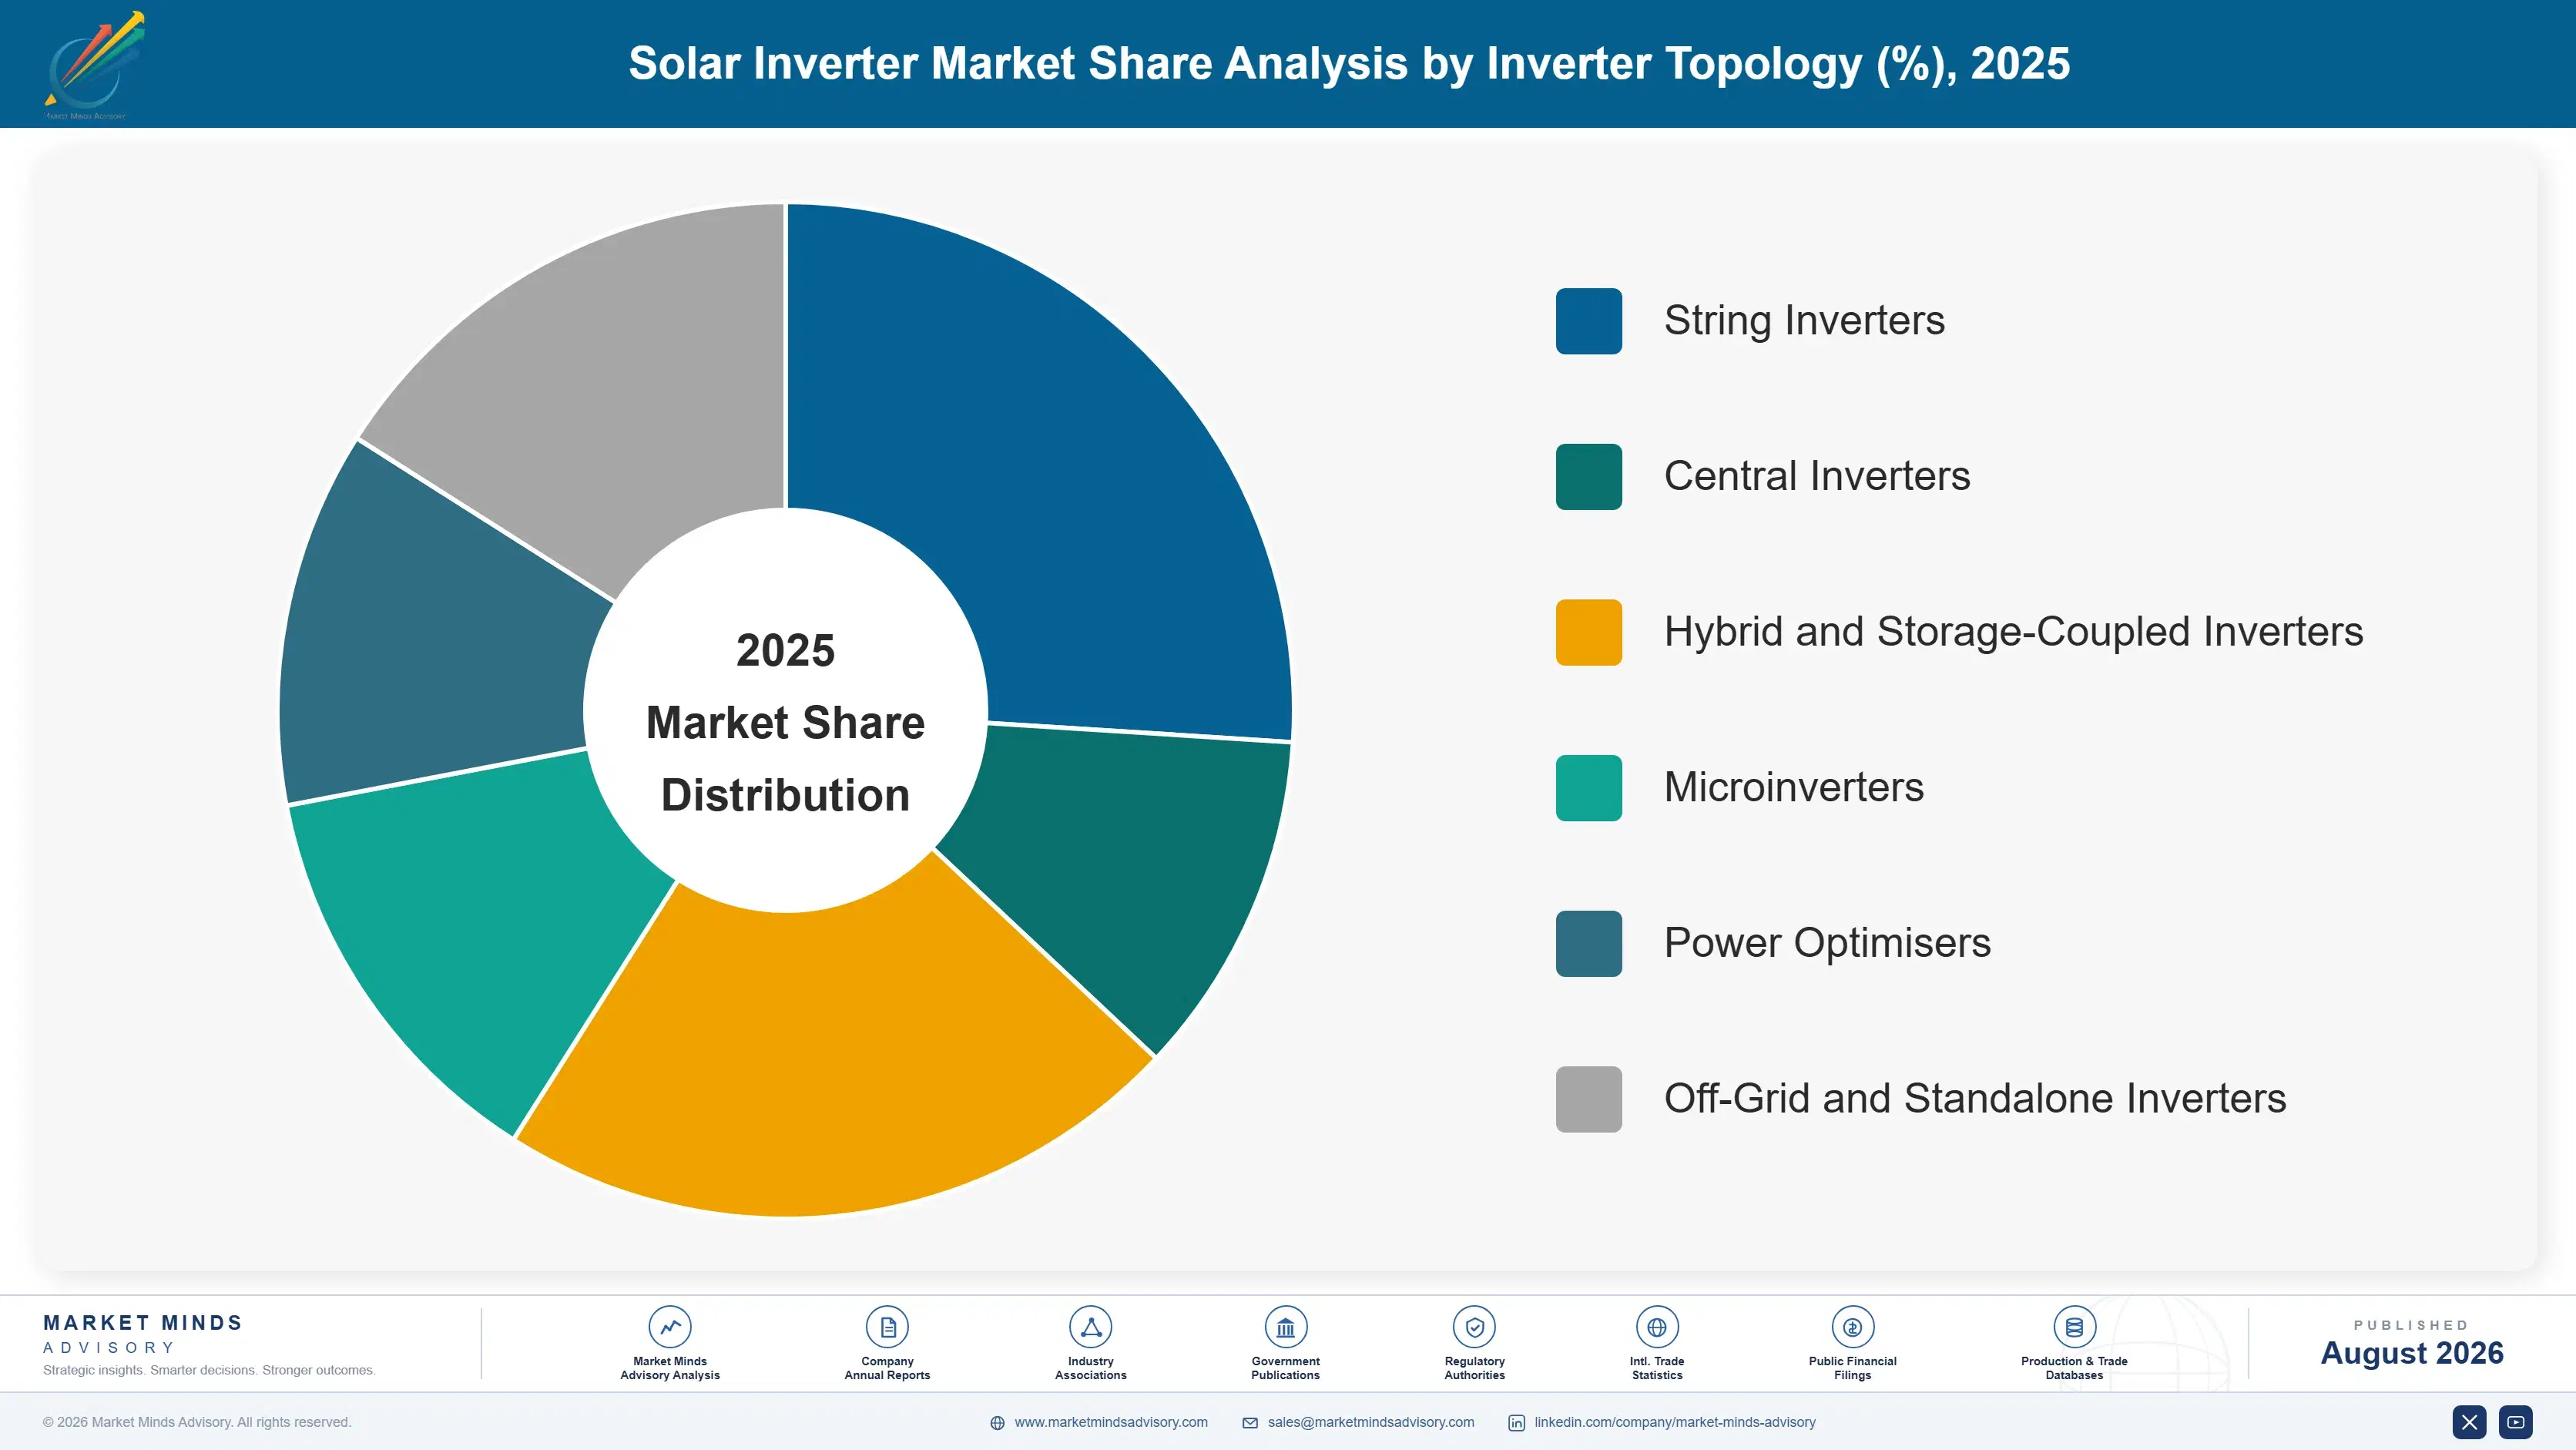
Six segments are split by inverter topology, because topology determines the power rating, the installation context, the control architecture and the buyer a manufacturer is actually selling to. Power rating bands and enclosure variants sit inside each topology rather than beside them. End-use application and channel are handled separately in the framework instead. Buyer type sits there too.
solar-inverter-market-market-share-analysis-1787595258235

Hybrid and Storage-Coupled Inverters

Growing at 12.6%, half again the market rate of 8.4%, these units manage photovoltaic input and battery flow together rather than simply converting direct current to alternating current for export. Falling export tariffs across residential and commercial markets have pushed owners toward self-consumption, which makes the storage-coupled unit the default rather than the upgrade in a growing number of markets. Content per unit is considerably higher and pricing holds far better than commodity string products. Retrofit onto existing arrays is a second demand pool that most manufacturers have barely begun to address with dedicated commercial resource. Grid codes increasingly expect storage-coupled units to provide frequency response as well, which raises content further and separates them from commodity string comparison.
CAGR 12.6%

Off-Grid and Standalone Inverters

At 10.2% these units serve installations with no grid connection at all, running battery-backed systems for rural electrification, telecommunications sites, mining operations and island grids where diesel generation is the alternative being displaced. Demand grows with electrification programmes across Africa and South Asia and with falling battery pricing that improves the economics against diesel considerably. The units require different control architecture from grid-connected products, since they must establish voltage and frequency themselves rather than follow an existing grid, and that capability overlaps directly with the grid-forming requirements now appearing in connection codes. Pricing holds considerably better than grid-connected string products because the buyer is comparing against diesel generation economics rather than against another inverter on a cost per watt basis.
CAGR 10.2%
Full segment breakdown across 6 segments available in the complete report.

Regional Architecture and Country Demand Map

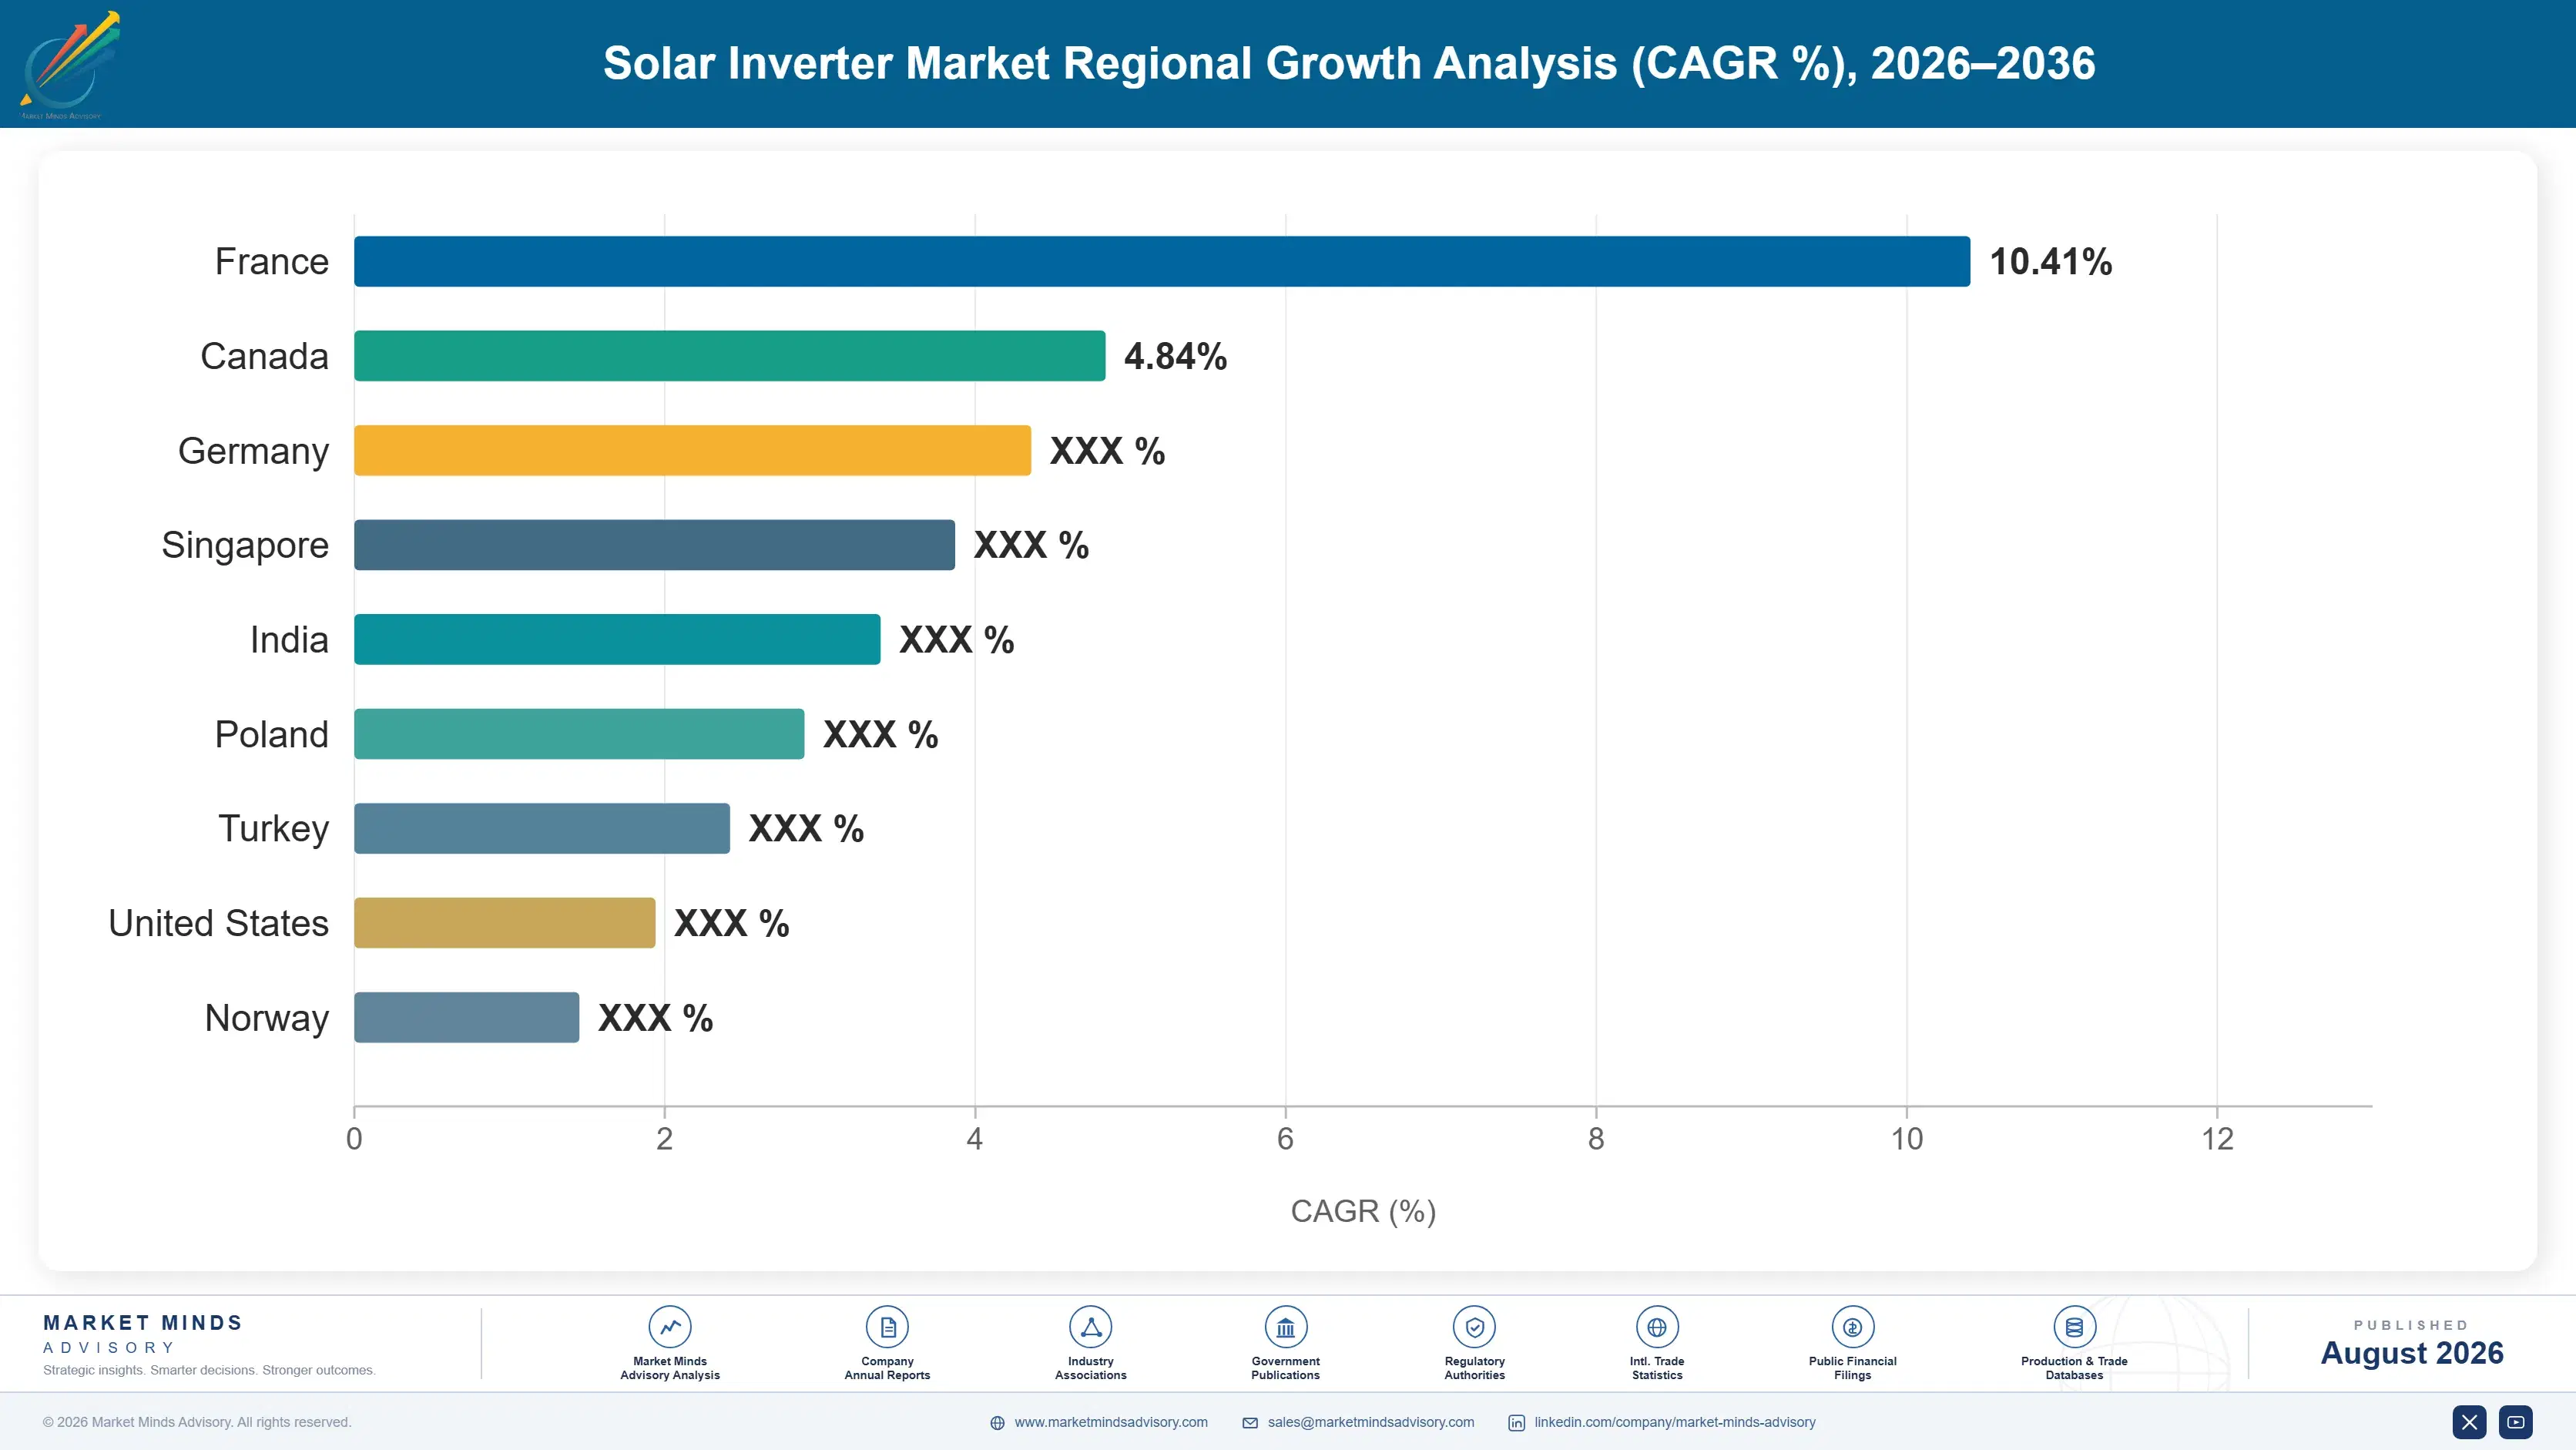
East Asia holds 30% of value on Chinese installation volume and manufacturing scale that no other region approaches. North America follows at 23% on utility scale build and the highest residential inverter pricing found anywhere in the world. South Asia and Pacific grows fastest of the seven regions.

North America

Residential inverter pricing here is the highest anywhere, sustained by microinverter and optimiser architecture that rapid shutdown requirements in the national electrical code effectively mandate at module level. Utility scale demand runs on central and large string products bid on capital cost per watt. Procurement rules favouring domestic manufacture and auditable firmware have grown considerably more consequential following grid security concerns about remotely controllable fleets. Replacement demand from the installed base is arriving now. Growth at 7.6% reflects mature installation volume against rising content per unit. Microinverter and optimiser architecture also raises value per installed watt well above what any other region achieves on comparable residential capacity. Replacement volume is arriving first here of anywhere.
Share: 23% | CAGR: 7.6% (2026 to 2036)

Western Europe

Export tariff reductions across Germany, the Netherlands and Italy have made self-consumption the economic case for residential solar, which pushes hybrid and storage-coupled units toward default specification rather than upgrade. Grid codes are the most demanding anywhere and grid-forming requirements are appearing in connection rules ahead of other regions. Domestic manufacturing has contracted considerably against Chinese cost positions. Replacement demand from early installations is substantial and growing. Growth of 6.8% is held back by mature installation volumes across the largest national markets. Certification depth across national grid codes remains the most defensible asset regional manufacturers hold, and it is the one thing scale alone has not been able to answer.
Share: 22% | CAGR: 6.8% (2026 to 2036)
Regional intelligence for 5 additional markets available in the complete report: East Asia, South Asia and Pacific, Latin America, Middle East and Africa, Eastern Europe. Contact sales@marketmindsadvisory.com.
solar-inverter-market-country-cagr-analysis-1787595258746

Four Moves Beyond Cost Per Watt

Hardware pricing has fallen toward five cents per watt and will keep falling, so any move that competes on delivered cost per watt is a move toward zero margin. The value now sits in replacement demand, grid code content, storage attachment and firmware assurance, and each reaches a different buyer entirely. Pick the buyer, not the product.

Build a replacement channel separate from project sales

Roughly 340 gigawatts of capacity sits on inverters near the end of a 12 year life, and that demand arrives regardless of new installation activity. The asset owner making that decision watches yield and downtime rather than capital cost per watt, and will pay a premium of 20% or more for a unit with credible support behind it. Selling to them through a channel built for developer bidding wastes the entire advantage. The channel has to be built separately, because a team compensated on project wins will not chase individual site replacements.
Market Impact: Addresses 340 GW of replacement demand now arriving

Certify across grid codes ahead of the requirement

Grid code certification takes months and considerable expense per national market, which is exactly why it holds value when hardware does not. Manufacturers certified for grid-forming operation before it becomes a connection requirement win specification at prices around 15% above compliant conventional units. Those certifying afterwards arrive into a market already specified. The work is unglamorous and the payback is genuinely substantial across every market that tightens its code. Certification breadth across many national codes compounds too, since each additional market costs less to enter than the first one did.
Market Impact: Commands roughly 15% pricing premium on certified units

Attach storage capability to the existing installed base

Hybrid units grow at 12.6% on new installations, but the retrofit pool of existing arrays without storage is considerably larger and almost nobody is selling into it deliberately. An owner already generating and now facing a reduced export tariff has a clear economic case, and the inverter replacement they need anyway is the natural moment to make it. Combining the replacement and storage conversations doubles the value of a single site visit. Owners of arrays a manufacturer originally supplied are the obvious starting list, and nobody is contacting them. Nobody else has the list.
Market Impact: Serves hybrid segment growth running at 12.6% annually

Offer auditable firmware and local control architecture

Grid operators and security agencies now treat remotely controllable inverter fleets above a gigawatt as a control question rather than a theoretical concern, and procurement rules are following in several markets. Independent firmware audit and local control fallback cost relatively little to build and answer a question competitors currently cannot. It reaches utility procurement and regulatory affairs rather than the purchasing function, which is a different conversation entirely. Fleets above 1 GW are where the concern concentrates, and independent audit typically costs under 2% of annual firmware development spend to establish properly.
Market Impact: Addresses aggregated inverter fleets exceeding 1 GW capacity

Who Controls the Margin Pool

Participation is measured on annual inverter shipment capacity in gigawatts, and the top five hold 62%. Concentration is high because manufacturing scale directly determines cost position in a product competing at five cents per watt. Huawei and Sungrow lead on shipment volume by a wide margin, and the gap to Western challengers is manufacturing scale rather than any deficit in engineering capability. Certification breadth separates the challengers from each other rather than from the leaders.
Competition runs on four fronts. Cost per watt decides utility scale bidding almost entirely. Grid code certification breadth decides which national markets a product can even enter. Storage integration decides the residential and commercial specification. And firmware assurance has become a fourth front that did not exist commercially three years ago. Firmware assurance reaches procurement functions that never previously evaluated inverters at all,

Pressure ahead comes from procurement rules favouring domestic manufacture and auditable firmware in North America and Europe, and from replacement demand rewarding support capability over unit cost. Expect Western manufacturers to compete on those two grounds rather than on price. Rankings shift where security rules bite hardest and where replacement volume concentrates. Concentration holds at the top while the middle field consolidates.
solar-inverter-market-company-positioning-matrix-1787595259267

Competitive Moat and Risk Dimensions

HUAWEI

Moat: Manufacturing scale and software depth

Shipment volume at a scale no competitor approaches drives a cost position that cannot be answered through engineering, combined with control software and fleet management capability developed across an installed base spanning most global markets. That combination compounds, since scale funds the software investment and the software supports the scale in a loop competitors cannot enter partway through.
HUAWEI

Risk: Security procurement rules narrowing access

Procurement rules in North America and parts of Europe favouring domestic manufacture and auditable firmware restrict access to exactly the markets carrying the highest inverter pricing anywhere. That exposure is political rather than commercial, so no product improvement addresses it, and the affected markets are where replacement demand is arriving first and largest.
SUNGROW

Moat: Utility scale product breadth globally

Central and large string product breadth deployed across utility scale projects in every major region gives reference installations and grid code certifications that a challenger cannot assemble quickly at any price. Utility procurement weights operating track record heavily, and a decade of gigawatt scale references is a genuinely difficult asset to replicate through engineering effort alone.
SUNGROW

Risk: Utility segment pricing exposure

Weighting toward utility scale bidding concentrates exposure in the segment where cost per watt decides awards most directly and where pricing deflation has run hardest. Residential and commercial storage-coupled demand carries better economics but requires channel capability of a different kind, and building it takes years rather than quarters to complete properly.

Players Tracked

Prominent Players

Huawei
Sungrow
SMA Solar Technology
Enphase Energy
SolarEdge Technologies

Other Key Players

Ginlong Solis
GoodWe
Growatt
Sineng Electric
FIMER
Power Electronics
TMEIC
Fronius
Delta Electronics
Schneider Electric
Hitachi Energy
Chint Power Systems
Kstar
Sofar Solar
Tesla

Recent Developments

APRIL 2026

Grid operator adds grid-forming capability to connection requirements

A transmission operator added grid-forming capability to connection requirements for new photovoltaic capacity above a defined threshold, moving the inverter from following grid voltage to helping establish it. Manufacturers already certified for the capability won specification ahead of the requirement date. Others faced a specification already written around competing products.
Signal: Certification completed before a requirement lands is worth considerably more than the same work afterwards has ever been
NOVEMBER 2025

Utility procurement adds firmware audit requirement to inverter tender

A utility added independent firmware audit and local control fallback requirements to an inverter tender, citing aggregate remote control exposure across a fleet exceeding one gigawatt. Several otherwise competitive manufacturers could not meet the requirement within the tender timetable at all. The requirement is now standard across that utility's tenders.
Signal: Firmware assurance has become a procurement gate rather than a technical differentiator worth marketing separately at all
AUGUST 2025

Asset owner replaces inverter fleet across ageing utility portfolio

An asset owner replaced inverters across a portfolio of arrays reaching roughly 12 years of operation, selecting on availability guarantees and service response rather than on unit pricing. The original supplier lost the position on support capability rather than product deficiency. Pricing barely featured in the evaluation criteria at all.
Signal: Replacement buyers weigh yield and downtime heavily, and unit pricing barely enters their evaluation at all

Semiconductors, Magnetics and Freight

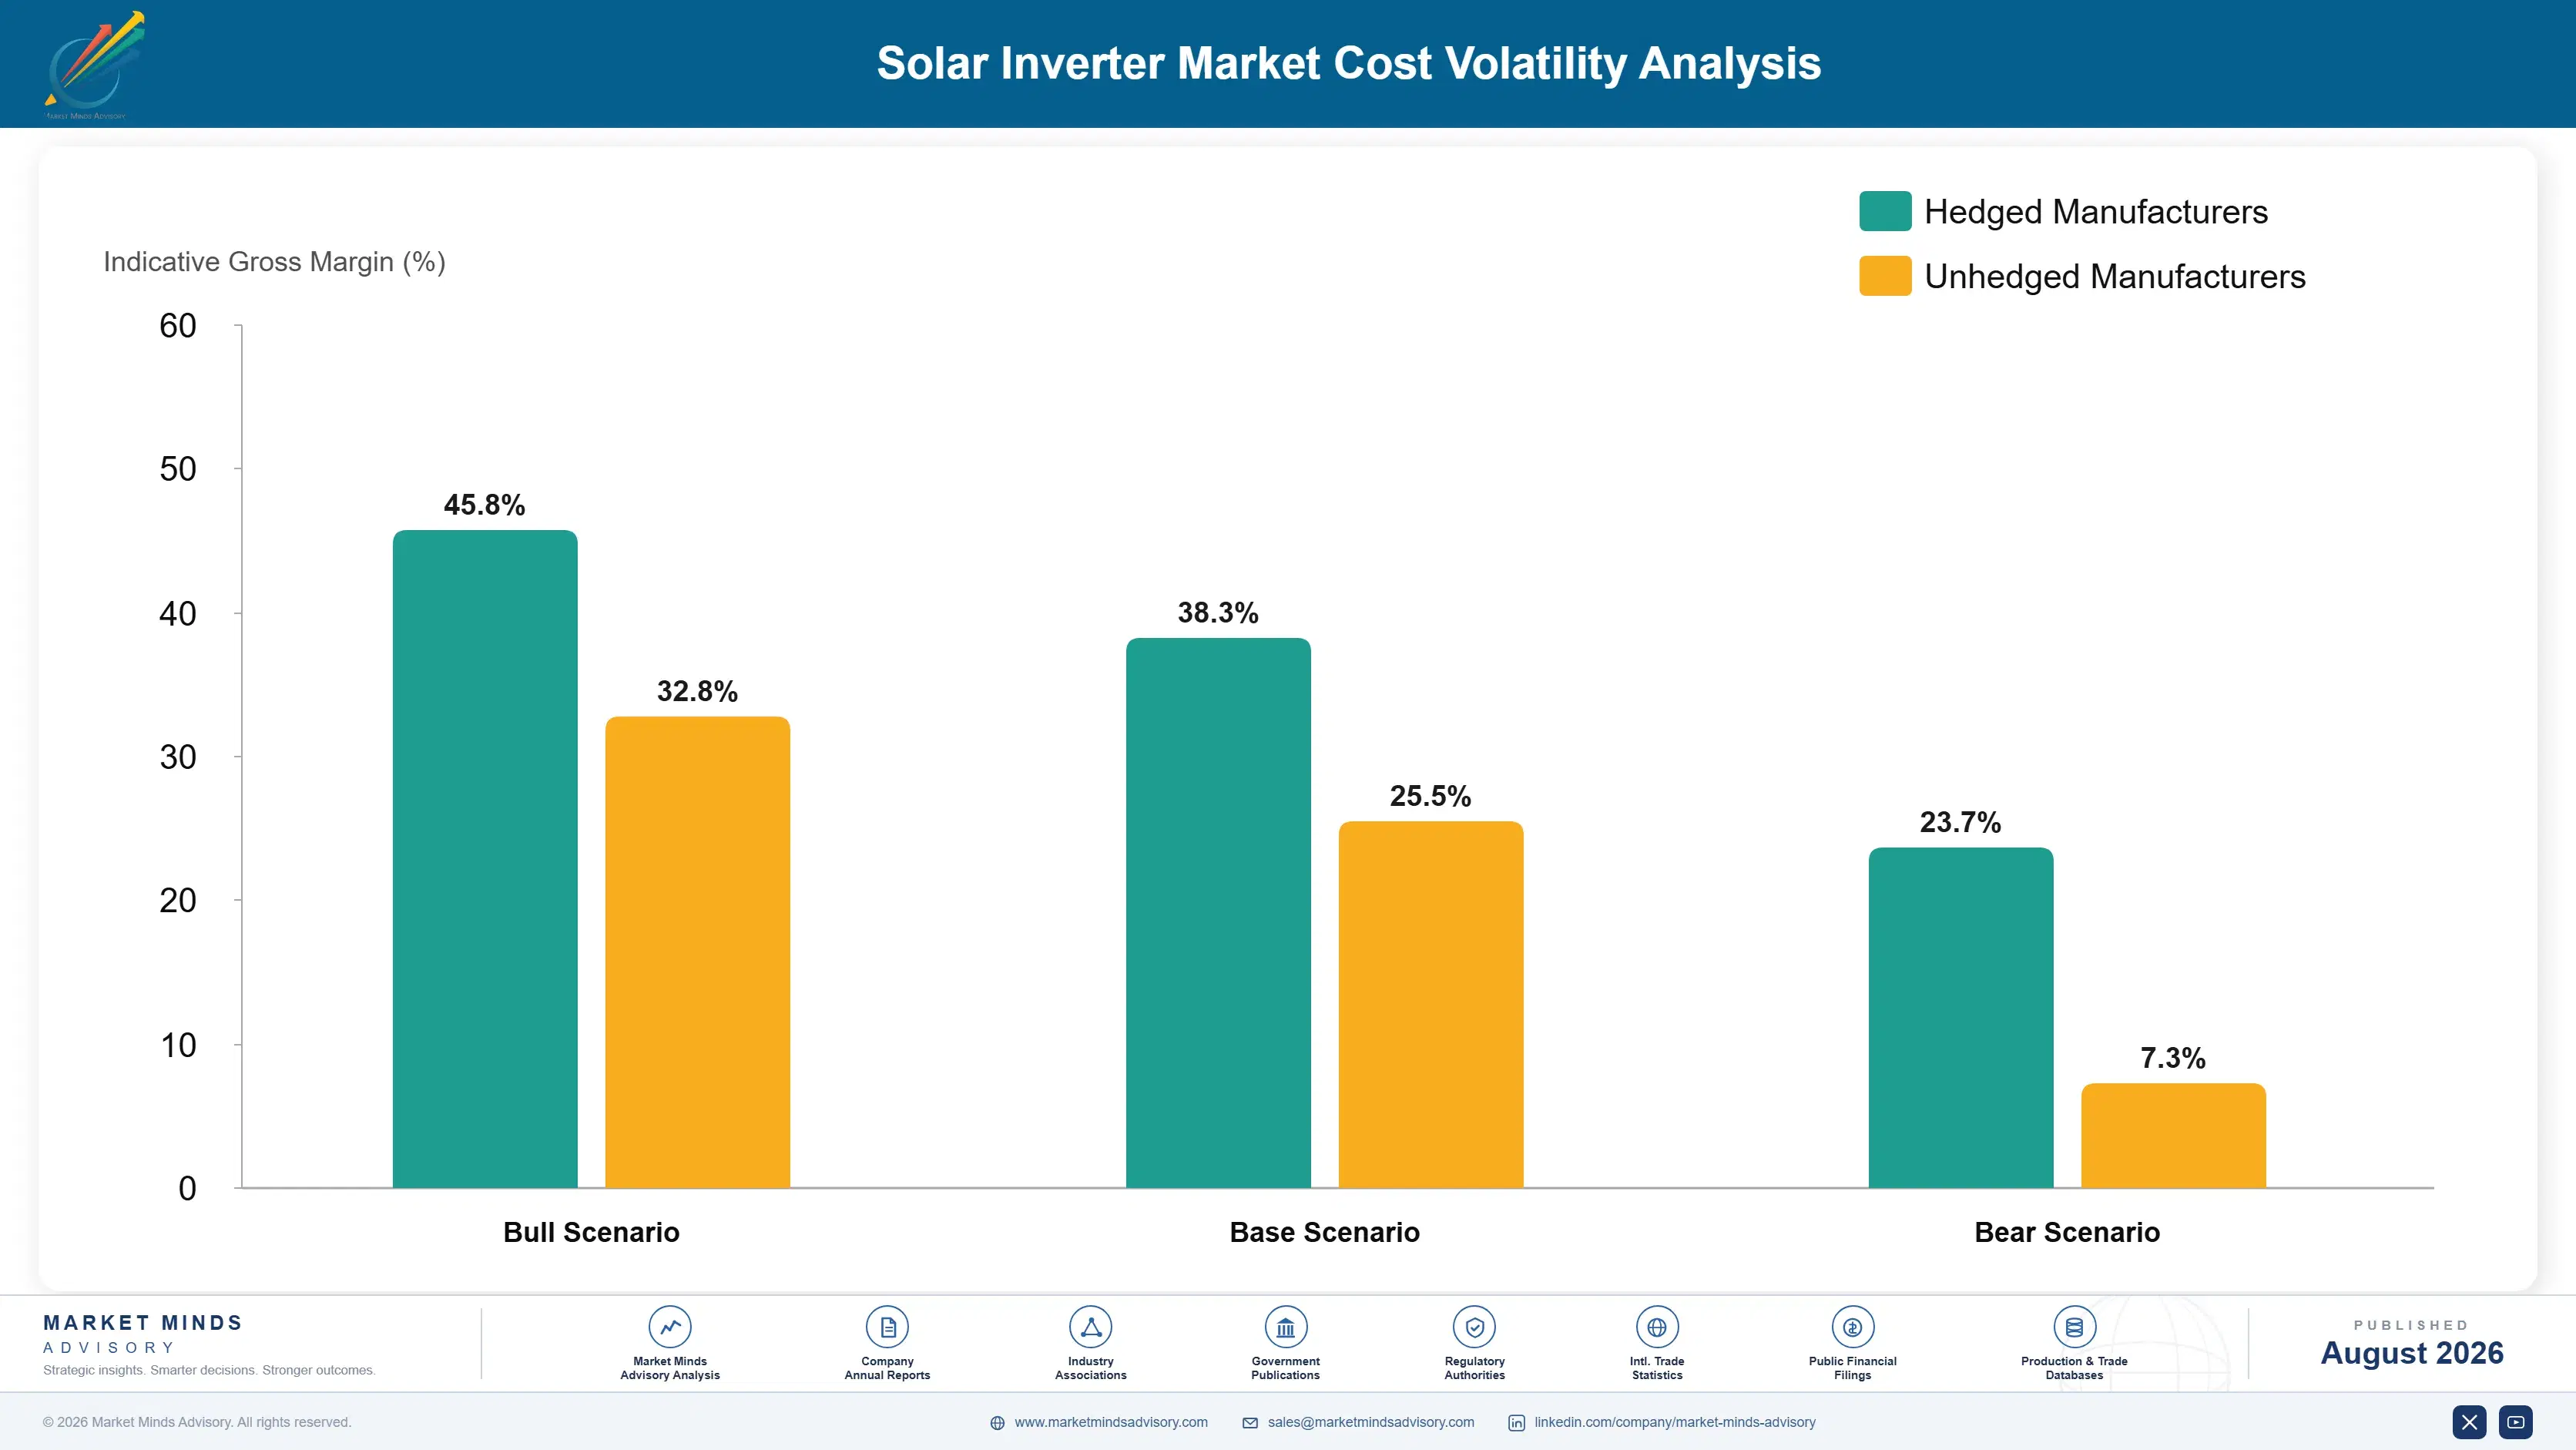
Power semiconductors including insulated gate bipolar transistors and increasingly silicon carbide devices carry around 31% of manufacturing cost, sourced from a concentrated group of suppliers in Europe, Japan and the United States. Magnetics, capacitors and passive components take about 24%. Enclosures, cooling and mechanical assembly account for around 18%. Control electronics, software development amortisation and certification absorb the balance across most manufacturers.
Power semiconductor availability tightened severely through 2021 and 2022 and lead times extended well beyond a year on some device families, per IEA reporting on clean energy supply chains alongside SMA Solar Technology Annual Report 2025 disclosures on component constraints. Manufacturers holding allocation agreements shipped while others could not, and several lost project positions they had already won. Pricing recovered afterwards but allocation discipline did not relax.

Exposure divides on scale and on device choice. A high volume manufacturer holds semiconductor allocation agreements that smaller producers cannot obtain at any price, which converts a component constraint into a competitive weapon. Silicon carbide adoption raises component cost while reducing cooling and magnetics content, so the exposure profile differs by product generation rather than uniformly across the industry.
solar-inverter-market-cost-volatility-analysis-1787595259461

Hold multi-year power semiconductor allocation agreements

Power semiconductors carry around 31% of manufacturing cost and availability rather than price is the binding constraint during any supply tightening. Multi-year allocation agreements protect shipment capability when competitors cannot ship at all, which has decided project positions before. Volume is the price of entry to those agreements, which disadvantages smaller manufacturers considerably. Scale buys access here.

Design across multiple power semiconductor device families

Designing a platform that accepts devices from more than one supplier family costs engineering effort upfront and removes a single point of failure that has stopped production lines across this industry. The qualification work is substantial but it converts an allocation problem into a sourcing decision, which is a far more manageable position to hold.

Shift value toward software and certification content

Grid code certification, control software and fleet management capability carry no component exposure at all and hold pricing where hardware cannot at five cents per watt. Growing that share of value reduces sensitivity to semiconductor cost and availability simultaneously, and it is the only part of the product where a Western manufacturer competes on equal terms.

Portfolio Architecture for Margin Defence

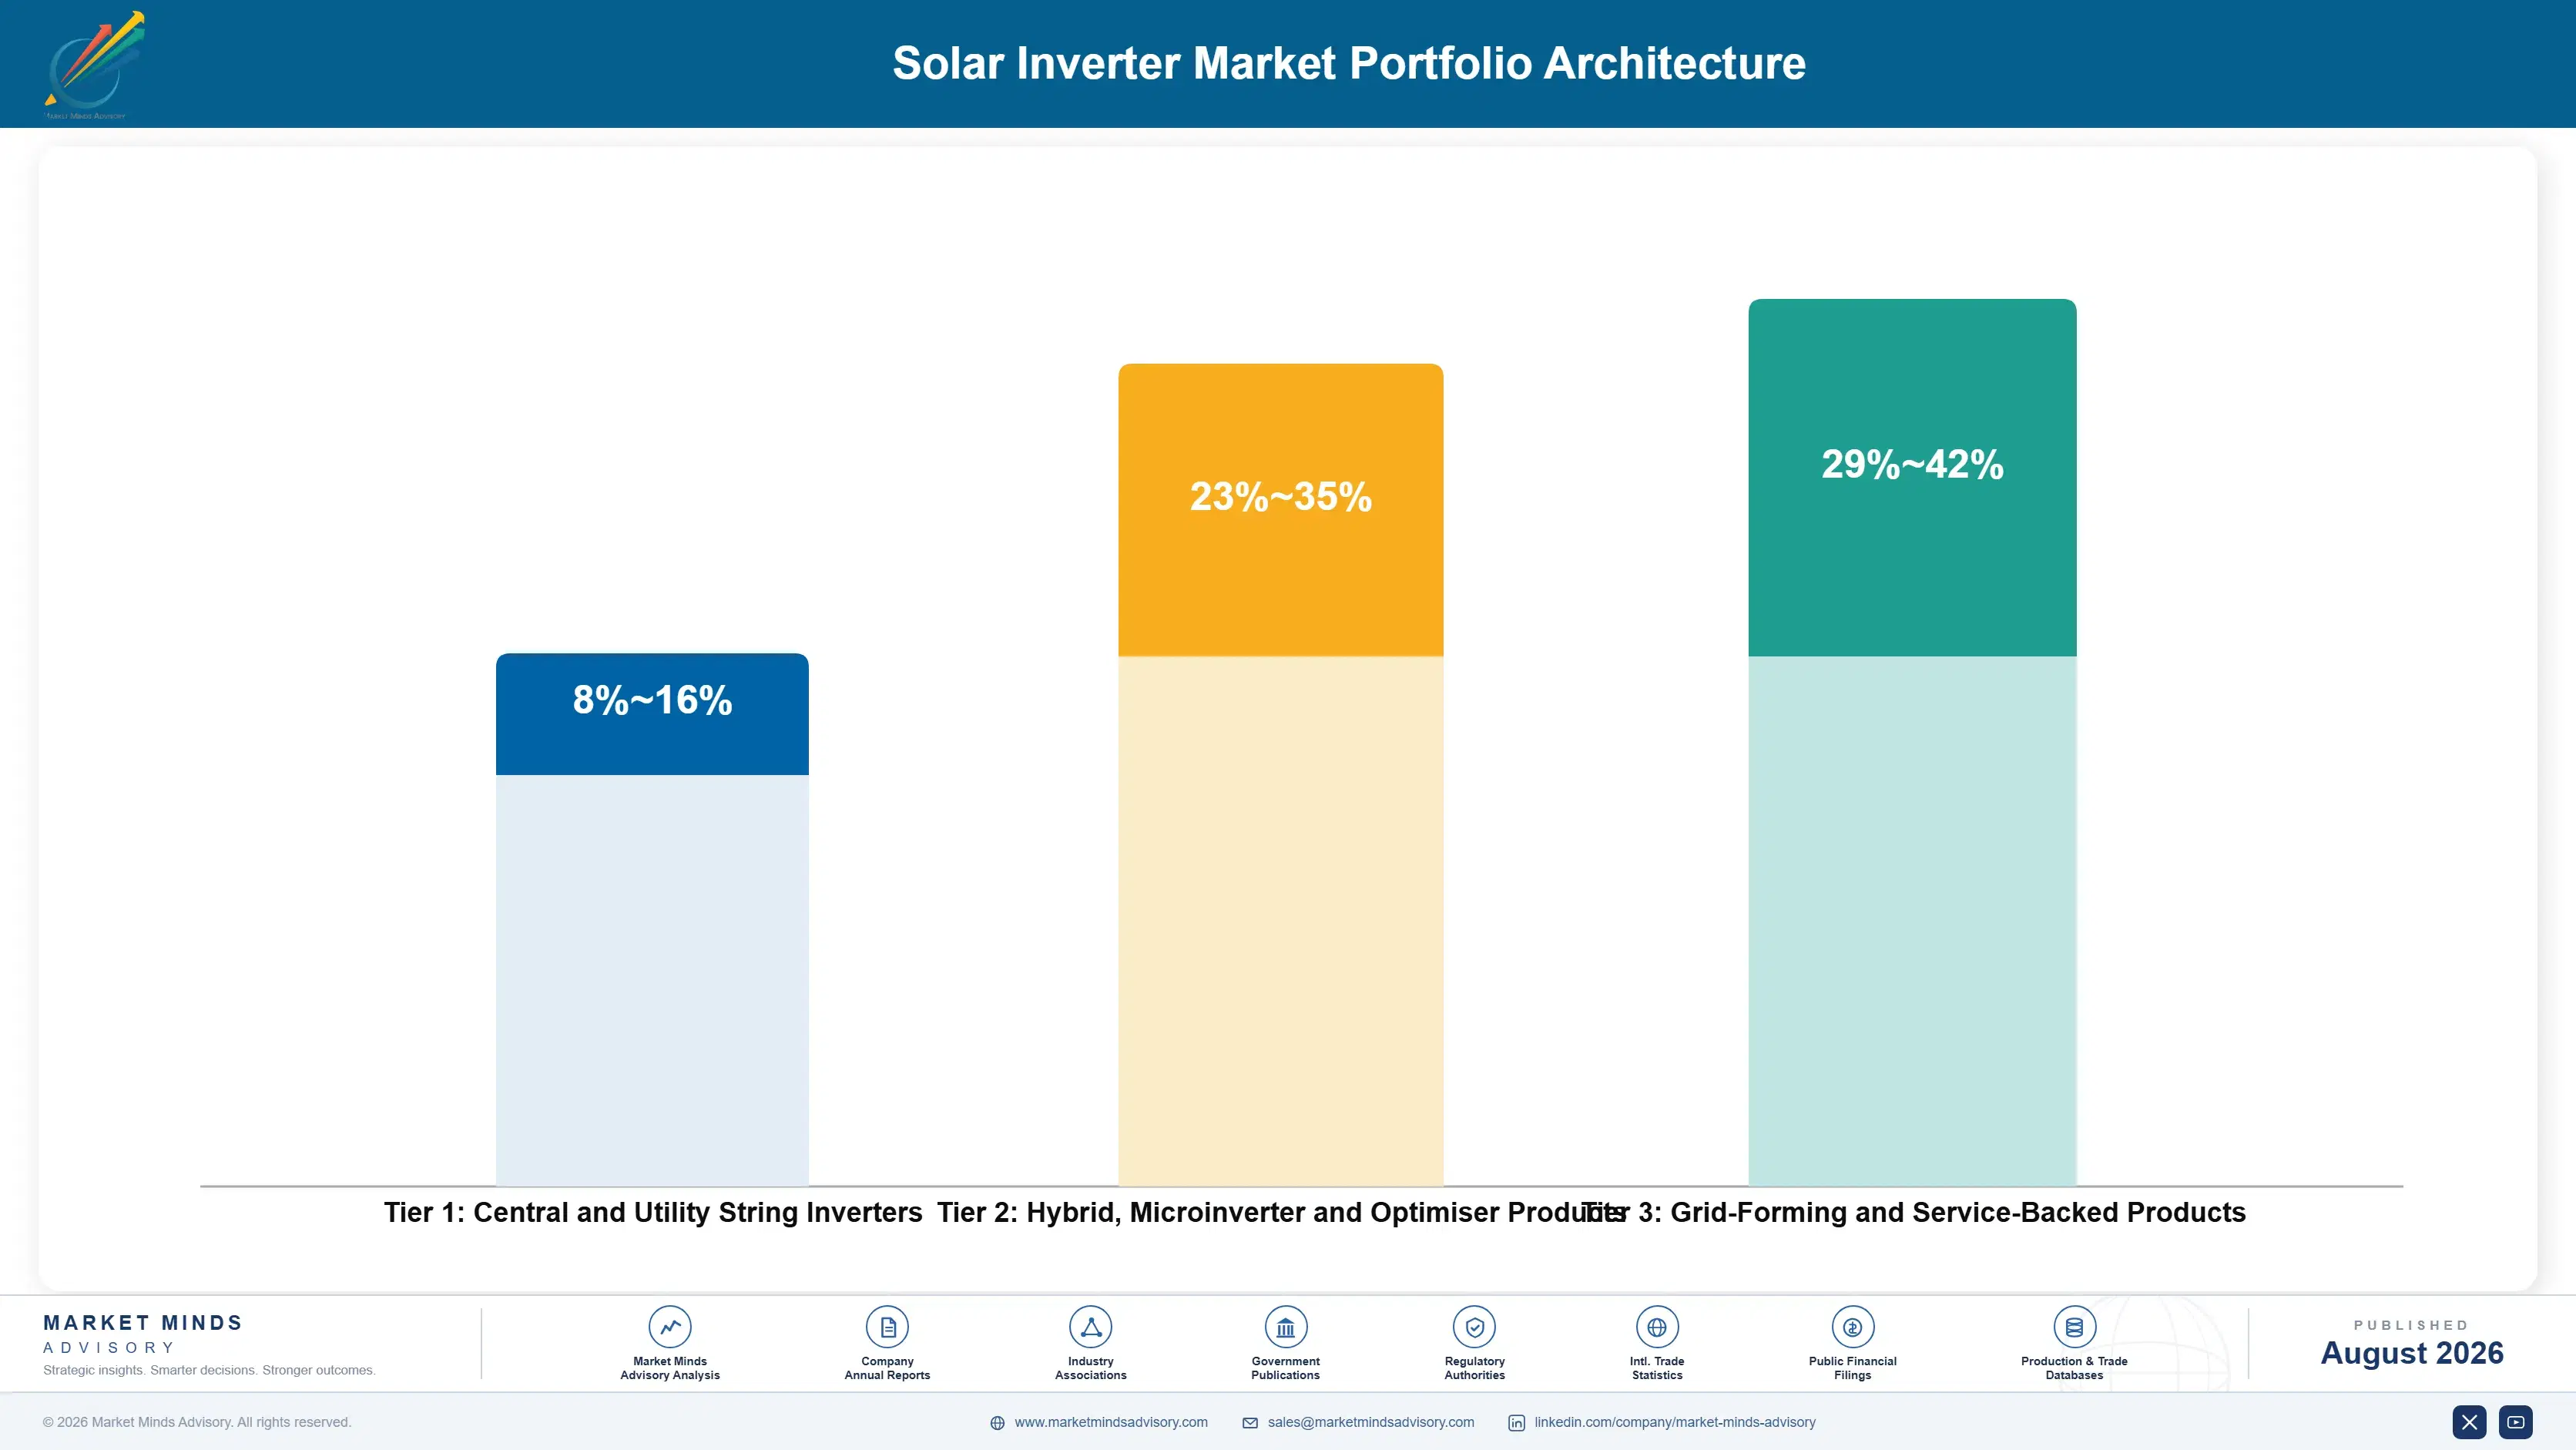
Margin here follows how far a product sits from competitive bidding on cost per watt. Central and large string inverters sold into utility tendering earn margins in the high single digits to mid teens, because the buyer compares delivered cost per watt directly across a shortlist and every cent is visible in the bid evaluation model. There is no differentiation available in that comparison.
Hybrid, microinverter and optimiser products do considerably better in the mid twenties to mid thirties, because storage integration, module-level control and safety compliance all carry content that the buyer cannot easily compare on a per watt basis. Residential channel structure adds a further layer of separation from direct price comparison entirely. Installer relationships and channel economics vary enormously by national market, which widens the range considerably.

Grid-forming units, certified advanced products and long-term service agreements hold the strongest position, reaching into the low forties, where certification depth, availability guarantees and firmware assurance decide the award rather than unit pricing. Those margins reflect qualification and software rather than any advantage in power electronics manufacturing scale. Very few manufacturers have built genuine service capability behind the products they sell, which is exactly why the position holds its pricing.

Central and Utility String Inverters

Products bid into utility tendering where delivered cost per watt decides awards directly. The eight point range reflects manufacturing scale and component allocation position rather than product capability, and it compresses further each year.
Gross Margin: 8-16%

Hybrid, Microinverter and Optimiser Products

Storage integration and module-level products where content and channel structure both separate the buyer from direct per watt comparison. The twelve point range reflects storage attachment rate and regional channel economics across very different residential markets.
Gross Margin: 23-35%

Grid-Forming and Service-Backed Products

Advanced certified units, firmware assurance and long-term availability agreements where qualification decides awards rather than pricing. The thirteen point range reflects certification breadth and how far a manufacturer has built genuine service capability behind it.
Gross Margin: 29-42%
solar-inverter-market-portfolio-architecture-1787595259961

High-value Sub-segments and Strategic Watch-out

Hybrid and Storage-Coupled Inverters

High value and the fastest growth at 12.6% as export tariff reductions make self-consumption the residential economic case. Retrofit onto the existing installed base is a second pool almost nobody is addressing with dedicated commercial resource. Grid codes increasingly expect frequency response from these units too.
Gross Margin: 25-35%

Replacement and Service-Backed Supply

High value and growing steadily as 340 gigawatts of installed capacity reaches the end of a 12 year inverter life. Asset owners buy on yield and downtime, and pay well for support that developers never valued. The channel required is entirely different from project sales.
Gross Margin: 27-40%

Central and Utility String Inverters

The volume core, bid on delivered cost per watt into utility tendering where pricing has fallen toward five cents. Manufacturing scale decides who competes and the field has concentrated sharply as a result. Certification breadth is the only differentiation left available here at all. Scale decides everything.
Gross Margin: 8-16%

Firmware and Grid Security Exposure

The strategic watch-out. Remotely controllable fleets above a gigawatt are now a procurement question in several markets, and the range reflects how far a manufacturer has built auditable firmware and local control fallback. Utility procurement and regulatory affairs now ask the question directly. Auditable firmware answers it.
Gross Margin: 5-38%

Two Buyers, One Product

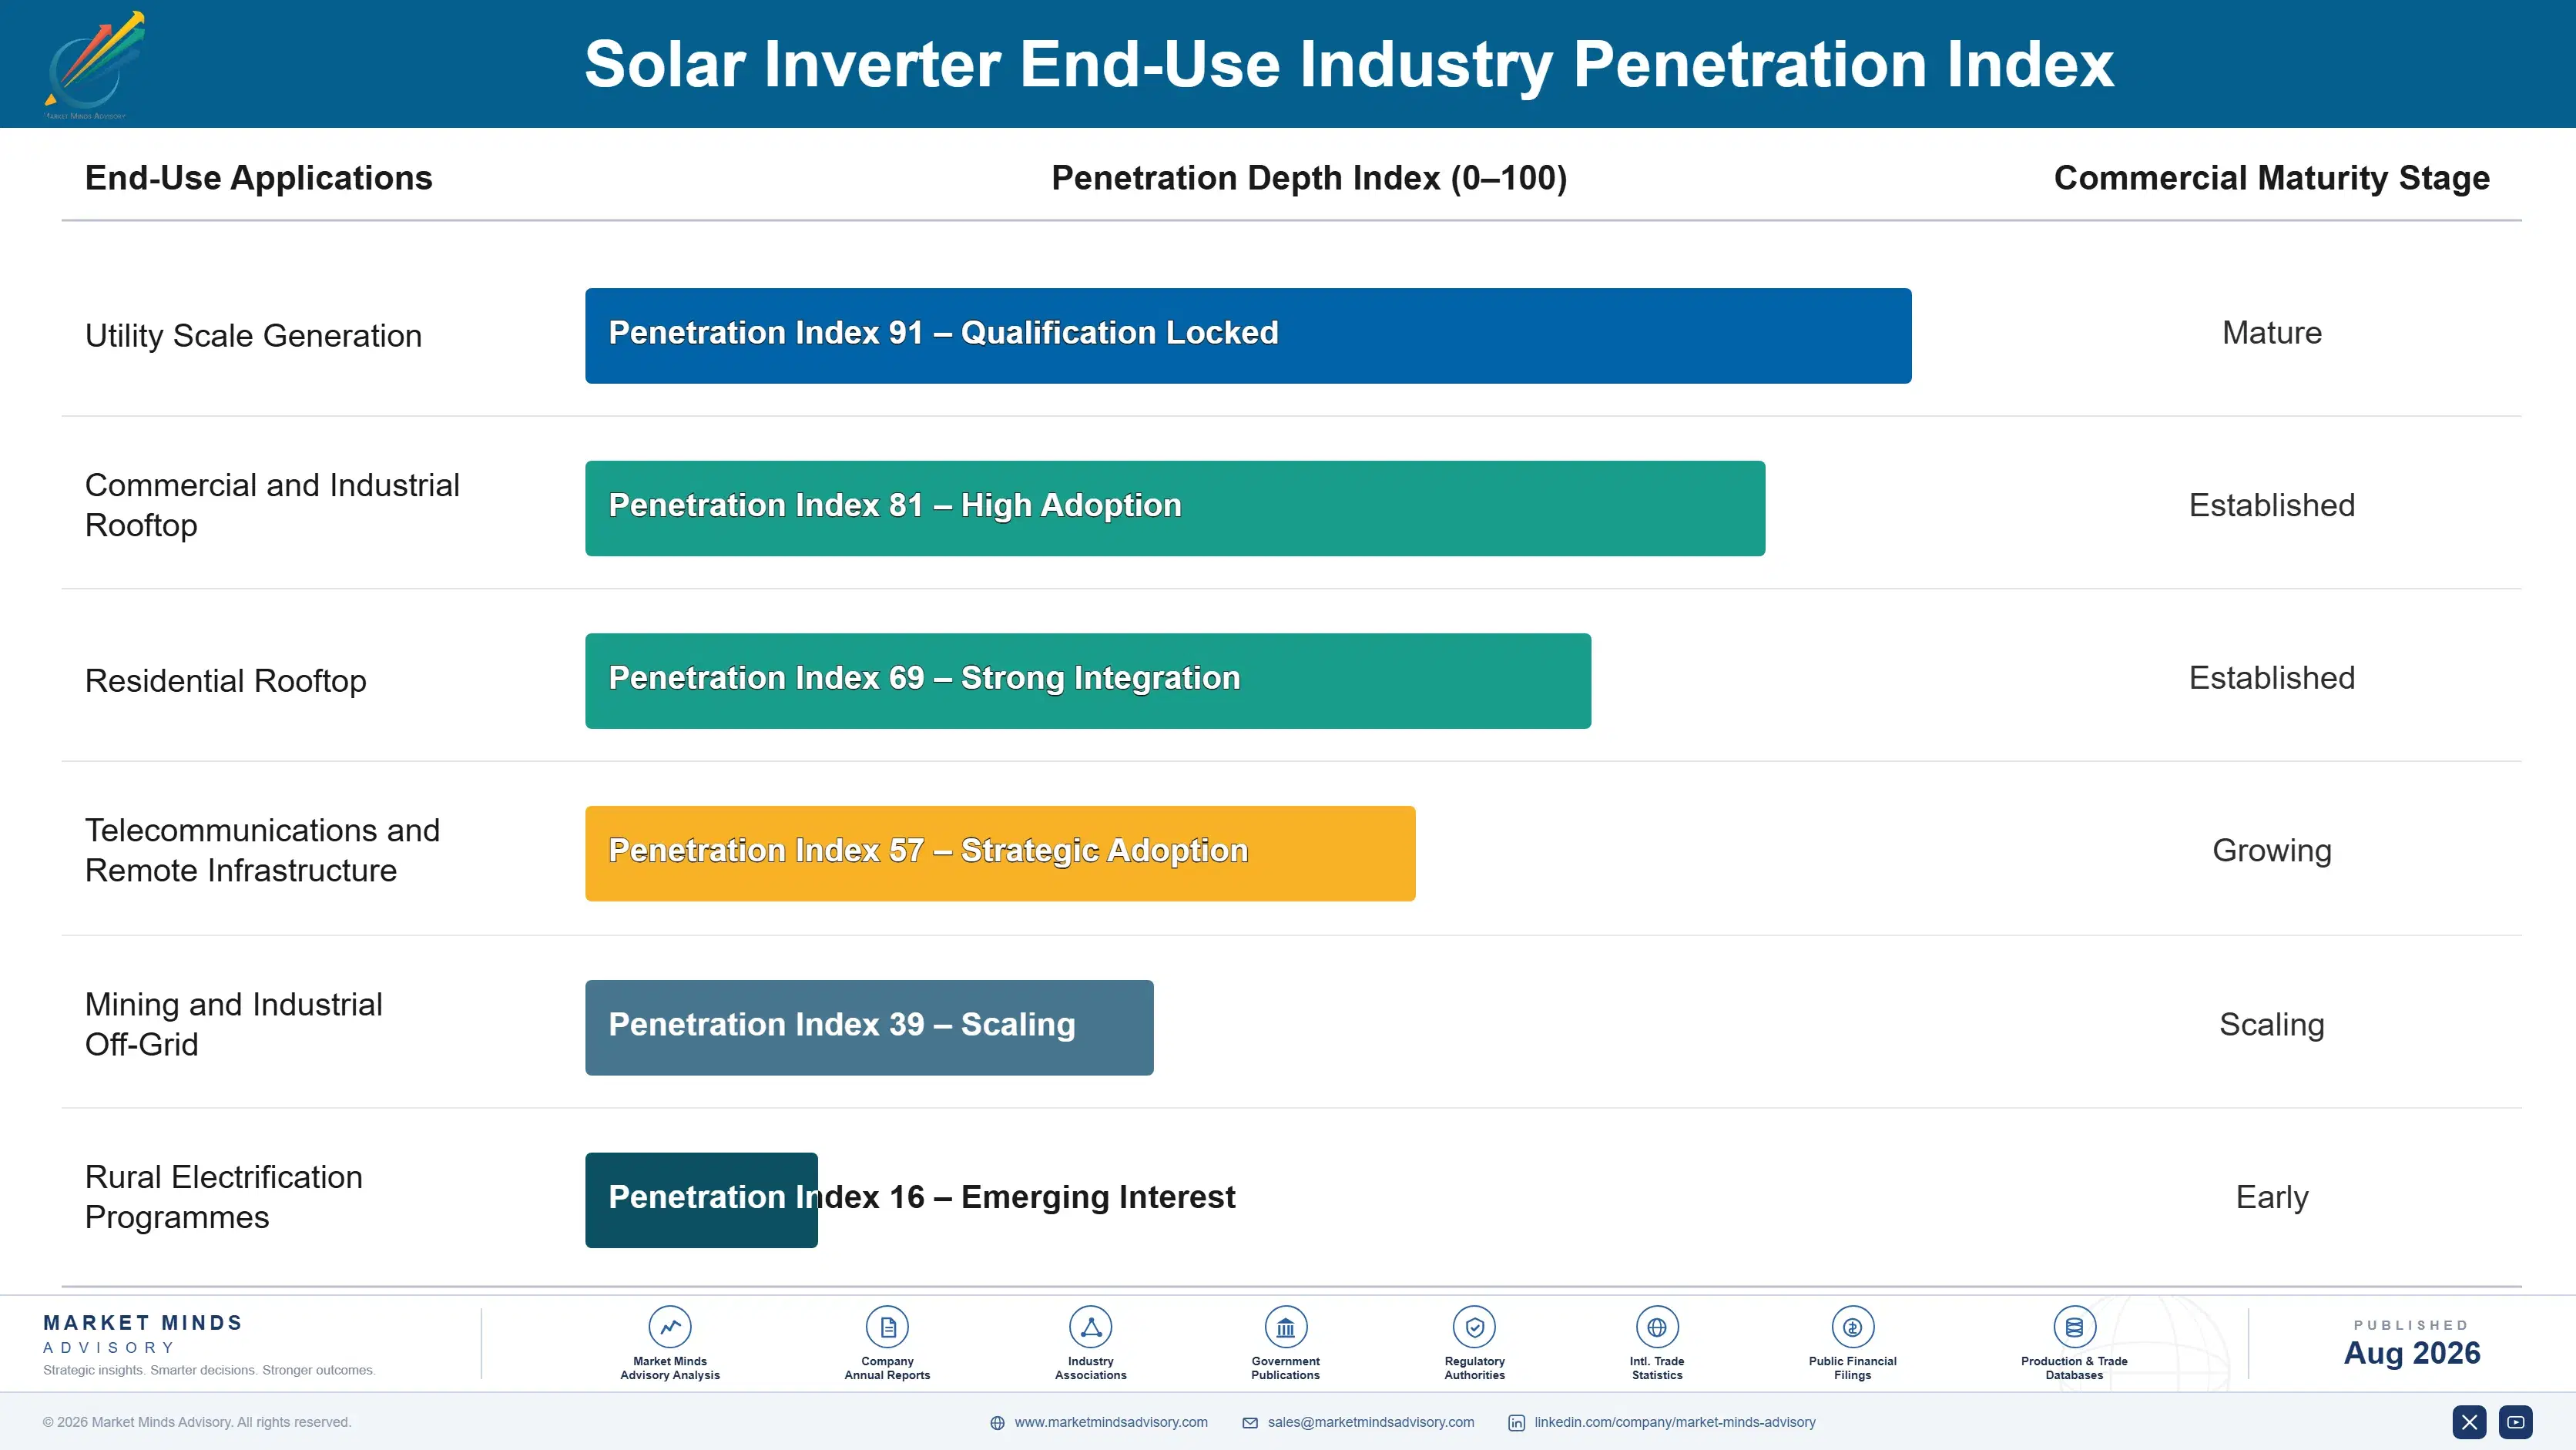
Demand here comes from two buyers with almost nothing in common. A developer specifying inverters for a new project minimises capital cost per watt across roughly 8% of system capital, and every cent is visible in a bid evaluation. An asset owner replacing inverters on a producing array watches yield, downtime and service response, and unit pricing barely enters the decision at all.
Stickiness follows that split precisely. Utility project awards carry nothing forward, since the next tender starts from delivered price again with no memory of the last one. Replacement and service-backed positions hold for years, because an owner who has settled availability guarantees and spares logistics with a supplier has little reason to reopen any of it. Residential channel positions sit somewhere between the two.

Buyer profiles are shifting generationally as well. Utility procurement has added grid operators and regulatory affairs functions to evaluations that engineering once controlled alone, particularly on firmware assurance. Residential decisions increasingly involve an energy retailer or aggregator rather than an installer, because storage attachment turns the array into a dispatchable asset somebody else wants to control. That shift is only beginning.
solar-inverter-market-end-use-penetration-index-1787595260447

Where We Would Put Effort

These are among the four positions where our research anticipates prominent divergence between winners and laggards over the coming forecast period. Each is grounded in the demand model, the regulatory perimeter, and the announced capacity pipeline.
01 / REPLACEMENT CHANNEL BUILDING

A different buyer needs a different organisation

Around 340 gigawatts of installed capacity sits on inverters approaching the end of a 12 year life against panels warranted for 25, and that demand arrives regardless of new installation activity anywhere. The asset owner making the decision watches yield and downtime rather than cost per watt, and pays accordingly for credible support behind the unit. Selling to them through a channel built for developer bidding throws away the entire advantage before anybody quotes a price, because the compensation structure alone will stop the team ever chasing it.
02 / GRID CODE CERTIFICATION

Certify before the requirement, not after

Grid code certification takes months and real expense in every national market, which is precisely why it holds value in a product where hardware pricing has fallen toward five cents per watt. Manufacturers certified for grid-forming operation before it becomes a connection requirement win specification at meaningful premiums to compliant conventional units. Those certifying afterwards arrive into a market where the specification has already been written around somebody else's product, and reopening a specification is very rarely worth anybody's effort.
03 / STORAGE RETROFIT ATTACHMENT

The replacement visit is the storage conversation

Hybrid units grow at 12.6% against a market rate of 8.4%, but the retrofit pool of existing arrays without storage is considerably larger than the new installation opportunity and almost nobody sells into it deliberately. An owner facing a reduced export tariff already has the economic case in front of them. The inverter replacement they need anyway is the natural moment to have that conversation properly, and it doubles the value of a site visit that somebody was going to make regardless.
04 / FIRMWARE ASSURANCE POSITIONING

Answer a question competitors currently cannot

Grid operators and security agencies now treat remotely controllable inverter fleets above a gigawatt as a genuine control question, and procurement rules in several markets have already followed that concern into tender documents. Independent firmware audit and local control fallback cost relatively little to build against what they protect. The capability reaches utility procurement and regulatory affairs rather than purchasing, which is a different conversation with entirely different criteria and, in most organisations, a completely separate budget sitting behind it as well.

Engagement Snapshot From the Field

A live engagement with an industry participant carrying material or product regulatory and market exposure ahead of a defining policy shift, showing how our research translates into a defensible multi-year portfolio strategy.
MARKET MINDS ADVISORY · CLIENT ENGAGEMENT SUMMARY
Solar Inverter Producer Strategic Portfolio Review and Transition Roadmap 2026·Investment Scenario on Solar Inverter Exposure Evaluation 2025-26
CLIENT PROFILE
A European photovoltaic inverter manufacturer supplying string and central products into utility and commercial projects across eight countries, at annual revenue near 410 million euros (client-reported, unverified by MMA). Replacement demand was served reactively through the same sales organisation that handled new project bidding, with no separate resource behind it. Margins had been compressing for several years.
STRATEGIC CHALLENGE
Utility project margins had compressed for four consecutive years against Chinese manufacturing scale, and management could see no path to competing on cost per watt. The board wanted to know whether any defensible position existed at all before deciding on further capacity investment or a strategic exit. Nothing in the existing plan addressed either question.
MMA APPROACH
MMA sized replacement demand across the client's regional installed base by installation vintage, reconstructed how asset owners actually evaluate replacement decisions through direct interviews, assessed grid code certification position against forthcoming requirements, and modelled storage retrofit potential across arrays the client had originally supplied. Interviews with 47 experts covered utility procurement, asset management and grid integration.
KEY FINDINGS
  1. Replacement demand within the client's own supplied installed base exceeded its annual new project volume by roughly a third and was arriving over the following four years.
  2. Asset owners ranked service response and availability guarantees above unit pricing in every replacement decision examined, which the client's sales organisation was not equipped to address.
  3. Grid-forming certification was achievable within existing engineering capability ahead of connection requirements the client's largest markets were preparing to introduce. The client's largest markets were preparing to introduce them within two years.
  4. Storage retrofit interest among owners of arrays the client had supplied was substantial and entirely unaddressed, with no manufacturer contacting those owners at all.
CLIENT PROFILE
A European photovoltaic inverter manufacturer supplying string and central products into utility and commercial projects across eight countries, at annual revenue near 410 million euros (client-reported, unverified by MMA). Replacement demand was served reactively through the same sales organisation that handled new project bidding, with no separate resource behind it. Margins had been compressing for several years.
STRATEGIC CHALLENGE
Utility project margins had compressed for four consecutive years against Chinese manufacturing scale, and management could see no path to competing on cost per watt. The board wanted to know whether any defensible position existed at all before deciding on further capacity investment or a strategic exit. Nothing in the existing plan addressed either question.
MMA APPROACH
MMA sized replacement demand across the client's regional installed base by installation vintage, reconstructed how asset owners actually evaluate replacement decisions through direct interviews, assessed grid code certification position against forthcoming requirements, and modelled storage retrofit potential across arrays the client had originally supplied. Interviews with 47 experts covered utility procurement, asset management and grid integration.
KEY FINDINGS
  1. Replacement demand within the client's own supplied installed base exceeded its annual new project volume by roughly a third and was arriving over the following four years.
  2. Asset owners ranked service response and availability guarantees above unit pricing in every replacement decision examined, which the client's sales organisation was not equipped to address.
  3. Grid-forming certification was achievable within existing engineering capability ahead of connection requirements the client's largest markets were preparing to introduce. The client's largest markets were preparing to introduce them within two years.
  4. Storage retrofit interest among owners of arrays the client had supplied was substantial and entirely unaddressed, with no manufacturer contacting those owners at all.
RECOMMENDED STRATEGY
Phase 1: Phase one: build a dedicated replacement and service organisation separate from project sales, targeting the client's own supplied installed base first. Phase 2: Phase two: complete grid-forming certification ahead of connection requirements, since engineering capability exists and specification advantage disappears once rules land. Phase 3: Phase three: combine replacement and storage retrofit conversations into a single site visit across the existing supplied base. Owners of client-supplied arrays come first.
OUTCOME
The manufacturer established a separate replacement organisation during 2026 and reported service-backed revenue reaching roughly 18% of turnover at materially higher margin than project supply (client-reported, unverified by MMA). Grid-forming certification completed ahead of the requirement date. Utility project volume was deliberately reduced across the same period.

Frequently Asked Questions

Foundational context covering the market sizes, CAGR, scope, country, region and competition that inform every finding below. This section is provided to cover basics and most often pre-purchase conversations, answered from the MMA Primary Research Dataset.

What is the current size of the Solar Inverter Market?

MMA sizes it at USD 14.8 billion in 2025, rising to USD 16.04 billion in 2026. The figure covers all inverter topologies at manufacturer selling value across new and replacement demand.

How large will the Solar Inverter Market be by 2036?

USD 35.94 billion by 2036, an incremental USD 19.90 billion over the 2026 base and an expansion multiple of 2.24 times. Storage-coupled units account for a disproportionate share of that.

What is the CAGR for the Solar Inverter Market 2026 to 2036?

8.4% in the base case, with a bull case at 9.6% and a bear case at 7.2%. The spread turns on whether content growth outruns continued hardware price deflation.

Which segment is growing fastest?

Hybrid and storage-coupled inverters at 12.6%, half again the market rate of 8.4%. Falling export tariffs are pushing residential and commercial owners toward self-consumption architecture.

Who are the major companies in the Solar Inverter Market?

Huawei, Sungrow, SMA Solar Technology, Enphase Energy and SolarEdge Technologies lead on annual shipment capacity. Fifteen further participants are profiled in the full report on that same basis.

Which country is growing fastest?

India at 14.2%, driven by utility scale tendering, rooftop programmes and domestic content requirements that have brought international manufacturers into local assembly rather than imports.

Report Segmentation Architecture

The full report scope spans multiple orthogonal segmentation dimensions, with cross-tabulated demand data provided for each dimension pair. Coverage extends further to regional breakdowns, trend trajectories, and the competitive detail needed to support segment-level decision-making.

By Inverter Topology

  • String Inverters
  • Central Inverters
  • Hybrid and Storage-Coupled Inverters
  • Microinverters
  • Power Optimisers
  • Off-Grid and Standalone Inverters

By End-Use Industry

  • Utility Scale Generation
  • Commercial and Industrial Rooftop
  • Residential Rooftop
  • Telecommunications and Remote Infrastructure
  • Mining and Industrial Off-Grid
  • Rural Electrification Programmes

By Commercial Dimension

  • Direct Utility and Developer Supply
  • Distributor and Installer Channels
  • Replacement and Aftermarket Supply
  • Original Equipment Integration Agreements
  • Service and Availability Contracts
  • Export and Cross-Border Supply

By Region

  • North America
  • Western Europe
  • East Asia
  • South Asia and Pacific
  • Latin America
  • Middle East and Africa
  • Eastern Europe

Scope, Methodology, and Coverage

Every figure in this report is reproducible from documented input assumptions. The scope below maps the historical period, the forecast horizon, the segmentation dimensions, and the countries covered, alongside the underlying primary and qualitative methodology.
Historical Period
2020 to 2025
Forecast Period
2026 to 2036
Base Year
2025 (USD billions; MMA Primary Research Dataset, August 2026)
Market Definition
Photovoltaic inverters supplied across all topologies and power ratings, covering string inverters, central inverters, hybrid and storage-coupled inverters, microinverters, power optimisers, and off-grid and standalone inverters. Measured at manufacturer selling value across both new installation and replacement demand. Photovoltaic modules, mounting structures, batteries and battery management systems, standalone grid-scale power conversion systems, and installation or engineering services are excluded from scope.
Quantitative Units
USD billions (current prices); gigawatts shipped; USD per watt by topology
Segmentation Dimensions
Inverter topology; end-use industry; commercial dimension; region
Regions Covered
North America, Western Europe, East Asia, South Asia and Pacific, Latin America, Middle East and Africa, Eastern Europe
Countries Covered
United States, Canada, Mexico, Germany, Netherlands, Italy, Spain, France, China, Japan, South Korea, India, Australia, Vietnam, Brazil, Chile, Saudi Arabia, South Africa, Poland, Romania
Key Companies Profiled
Huawei, Sungrow, SMA Solar Technology, Enphase Energy, SolarEdge Technologies, Ginlong Solis, GoodWe, Growatt, Sineng Electric, FIMER, Power Electronics, TMEIC, Fronius, Delta Electronics, Schneider Electric, Hitachi Energy, Chint Power Systems, Kstar, Sofar Solar, Tesla
Quantitative Methodology
Primary survey, n=3,800 respondents, Q4 2025, six countries; demand-side model with trade association cross-validation
Qualitative Methodology
47 expert interviews, Q4 2025; applied to validate demand model assumptions, identify emerging dynamics, and assess competitive positioning
Report Format
PDF and XLSX data workbook (Word format preview document)
Publisher
Market Minds Advisory
Report Code
MMA-2026-ENE-133
Published
August 2026
Contact
sales@marketmindsadvisory.com | www.marketmindsadvisory.com

Purchase the full Solar Inverter Market Report (2026 to 2036).

The full report sizes replacement demand by installation vintage across every region, because that is the most predictable volume in this market and the one manufacturers are least organised to capture. It forecasts all six topologies independently through 2036, models grid code certification requirements against forthcoming connection rules by market, and assesses firmware assurance positioning as procurement rules tighten. Regional chapters cover all seven regions with installation and replacement demand separated throughout. Competitive profiling covers 20 participants on one consistent shipment capacity basis. Replacement channel economics are modelled separately from project supply throughout.
Six inverter topologies sized independently through 2036
Replacement demand modelled by installation vintage across all regions
Grid code certification requirements mapped against forthcoming connection rules
Firmware assurance positioning assessed across twenty profiled manufacturers
Storage retrofit potential sized against the existing installed base
Twenty participants profiled on one consistent shipment capacity basis

Built For The People Who Decide

From boardroom strategy to bench-side execution, this report is read cover-to-cover by leaders shaping the next decade of their industry, turning demand scenarios, market dynamics and valuation benchmarks into decisions.
CXOs/ Presidents/ VPs/ Managers
M&A and Corporate Development
Strategy Teams and R&D Heads
Procurement and Product Directors
Regulatory and Compliance Leaders
Investor Relations and Equity Analysts