Market Minds Advisory
Software-Defined Anything (SDx) Market

Software-Defined Anything (SDx) Market: Software-Defined Anything Market: Abstraction Economics, Operational Skill Debt and Where Control Planes Actually Pay 2026 to 2036

Abstracting hardware into software moved the difficulty rather than removing it. Buyers who costed the licences and not the operators are running control planes nobody in the building fully understands.

Lead Analyst

Published

September 2026

Make Smarter Decisions with Customized Research Insights

Request a free sample report and evaluate market opportunities, growth trends, and competitive dynamics relevant to your business needs.

2025 MARKET VALUE$42.6BMarket Size 2025
2036 FORECAST VALUE$161.8BBase Case , 2026 to 2036
CAGR 2026 TO 203612.9 %Bull 14.2% / Bear 11.6%
INCREMENTAL OPPORTUNITY$113.7BNet 10- year value creation
EXPANSION MULTIPLE3.36x2036 value over 2026 base
Strategic Levers
M&A Pipeline
Regional Outlook
Country Rankings
Competitive Intelligence
Segmental Deep-dive
Call-Us : 91 93563 13602

Executive Snapshot and Market Trajectory.

Abstracting hardware into software moved the difficulty rather than removing it. Buyers who costed the licences and skipped the operators are now running control planes that nobody in the building fully understands, and that gap is where most deployments stall. Abstraction does not remove complexity.
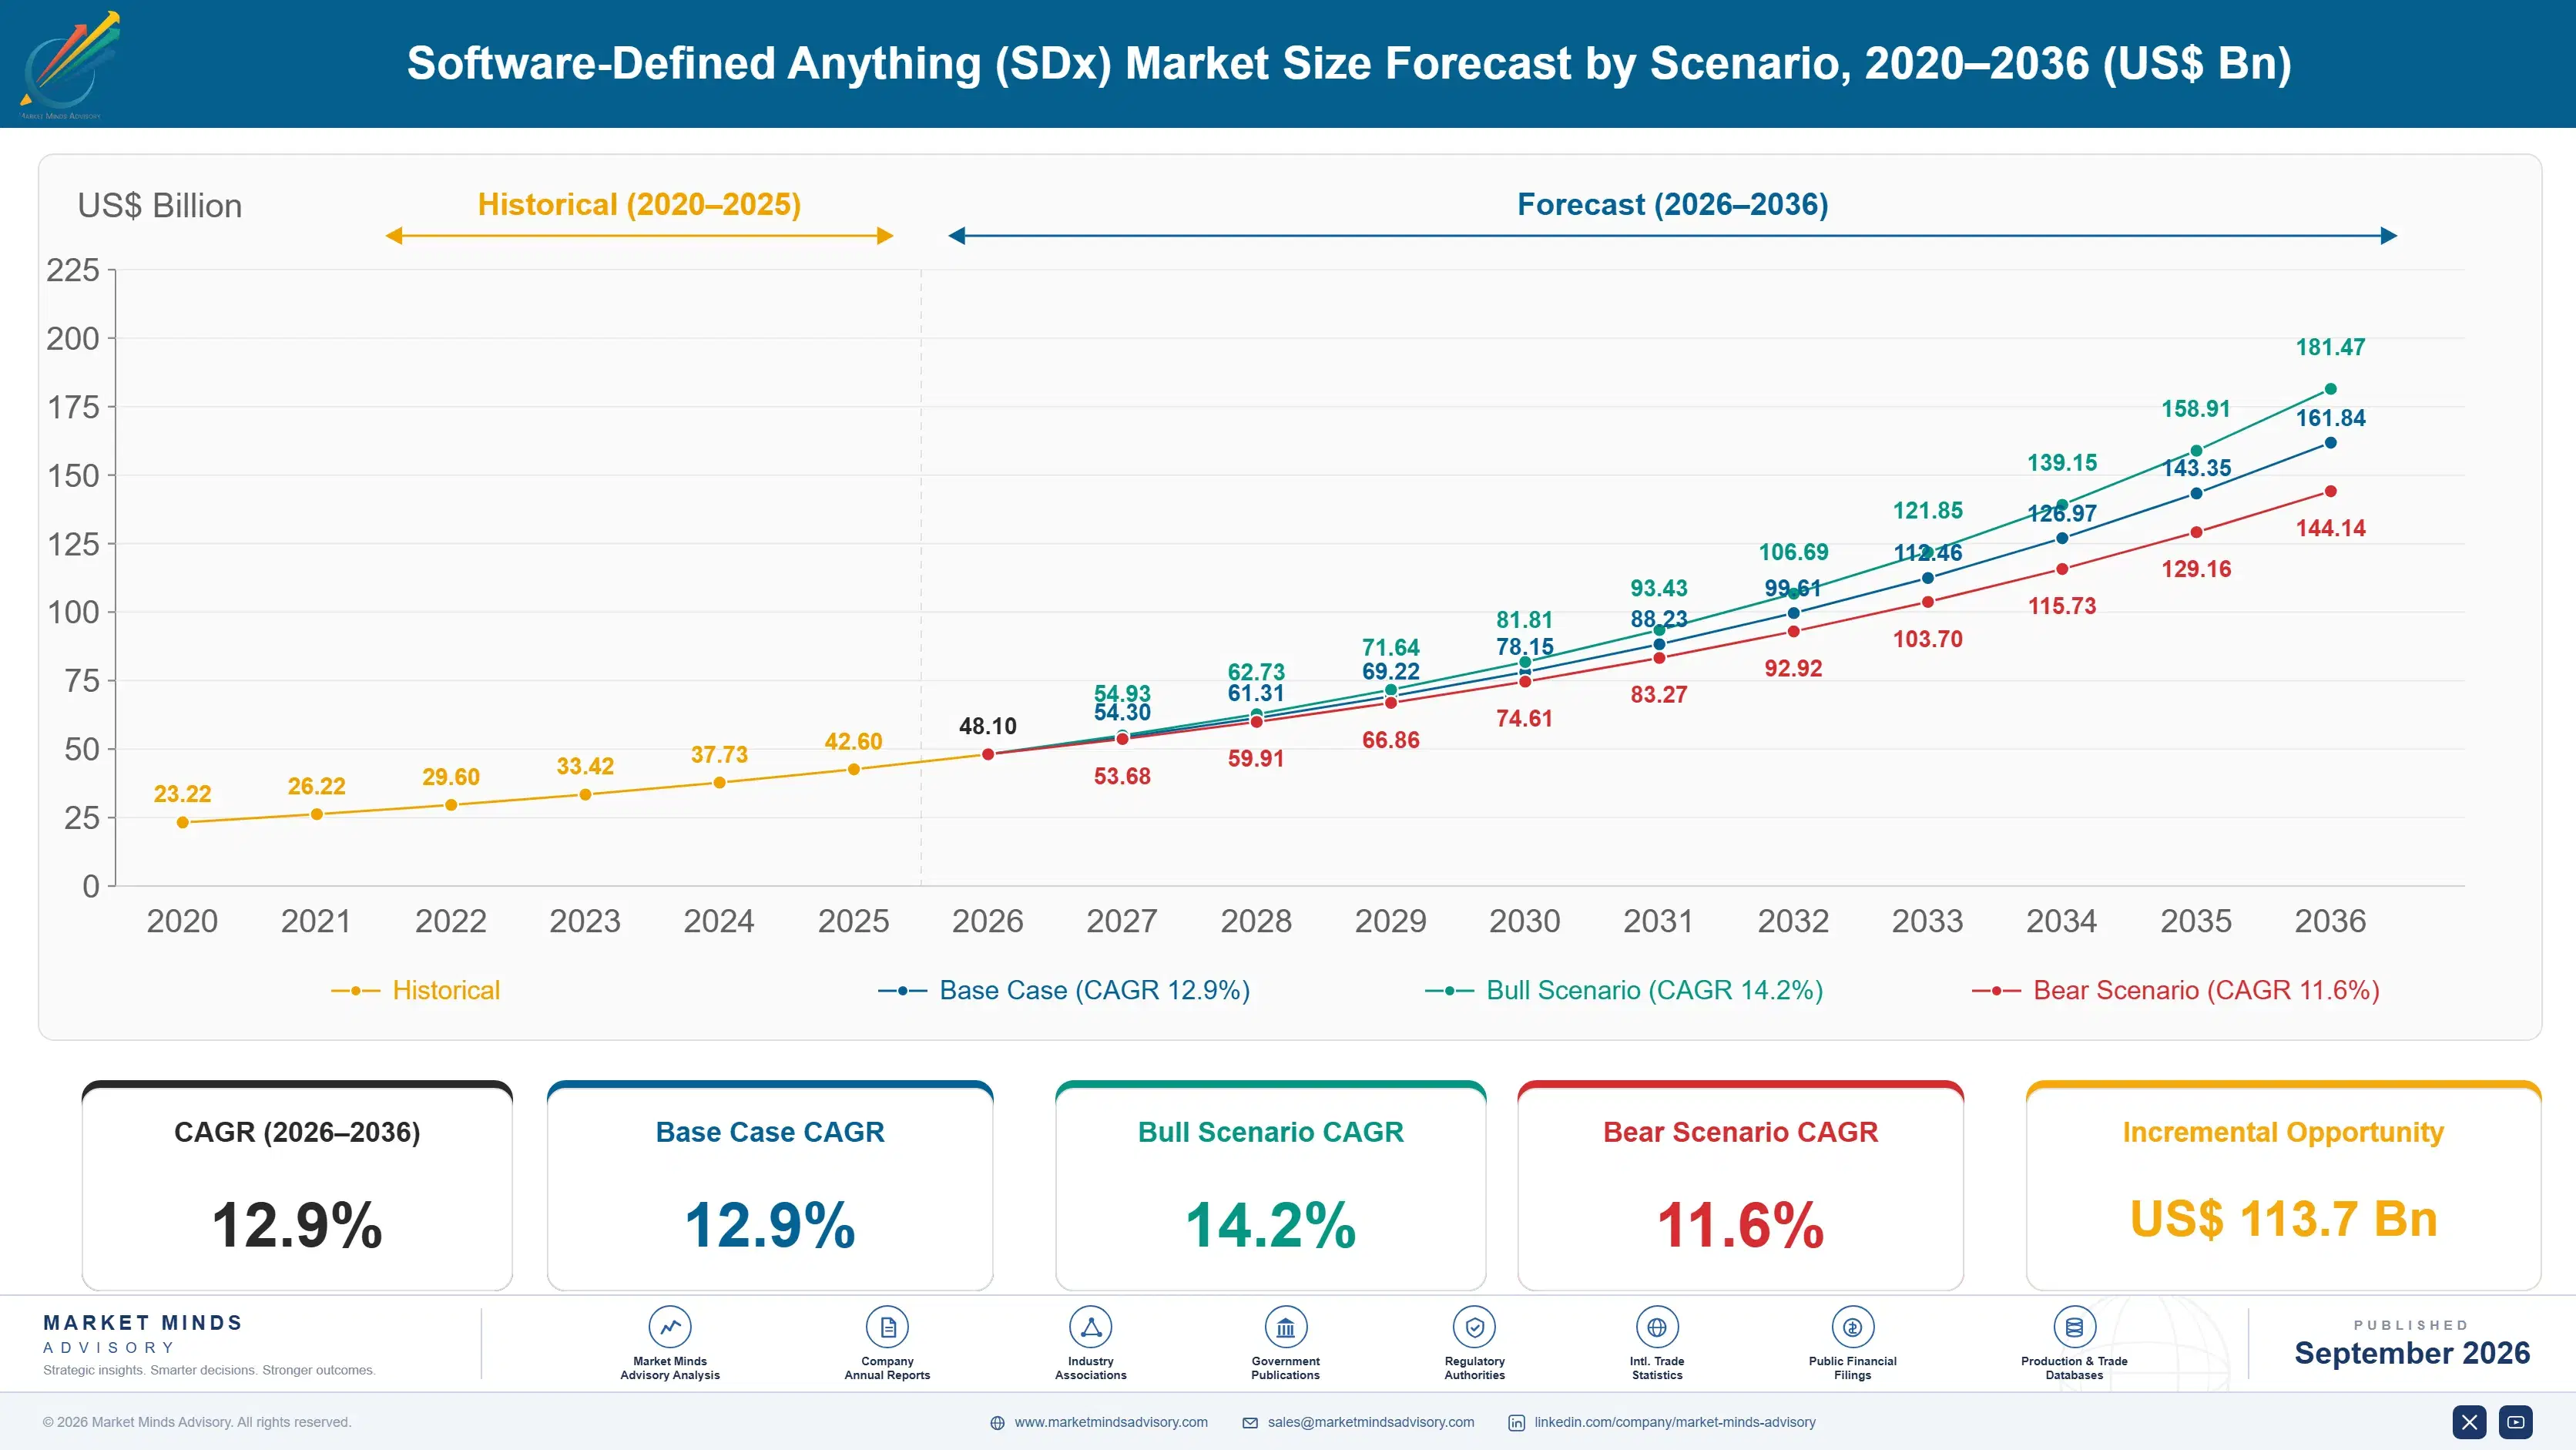
The market reaches USD 48.1 billion in 2026 and USD 161.8 billion by 2036, a 3.36 times expansion at 12.9% annually. Software-defined wide area networking grows at 19.4%, half again the market rate of 12.9%, because branch connectivity is where the hardware being replaced was most expensive per site. East Asia holds 29% of spending and India compounds fastest at 20.8%. Both figures rest on licensing and support revenue.
Five vendors hold 44% of spending, which is unusually low for enterprise infrastructure and reflects how differently the subsegments behave. VMware, Cisco Systems, Nutanix, Hewlett Packard Enterprise and Red Hat lead. Operational skill is the binding constraint on deployment, not licence cost or technical capability. Concentration has been falling rather than consolidating, which is unusual and reflects licensing upheaval reopening decisions buyers had treated as settled. Roughly 46% now formally evaluate alternatives at each renewal.
Market Definition
This report covers software-defined infrastructure control planes and their associated licensing and support: software-defined wide area networking, software-defined networking within data centres, software-defined storage, software-defined compute and hypervisor platforms, software-defined security policy enforcement, and orchestration and automation layers spanning them. It excludes the underlying server, storage and network hardware, public cloud infrastructure services, application software, and managed service delivery contracts.
Base Year Value
$42.6B in 2025 (MMA Primary Research Dataset, September 2026)
Forecast Period
2026 to 2036, eleven discrete annual values
CAGR
12.9% base case. Bull 14.2%. Bear 11.6%.
Fastest Growth Segment
Software-Defined Wide Area Networking: 19.4% CAGR
Fastest Growth Country
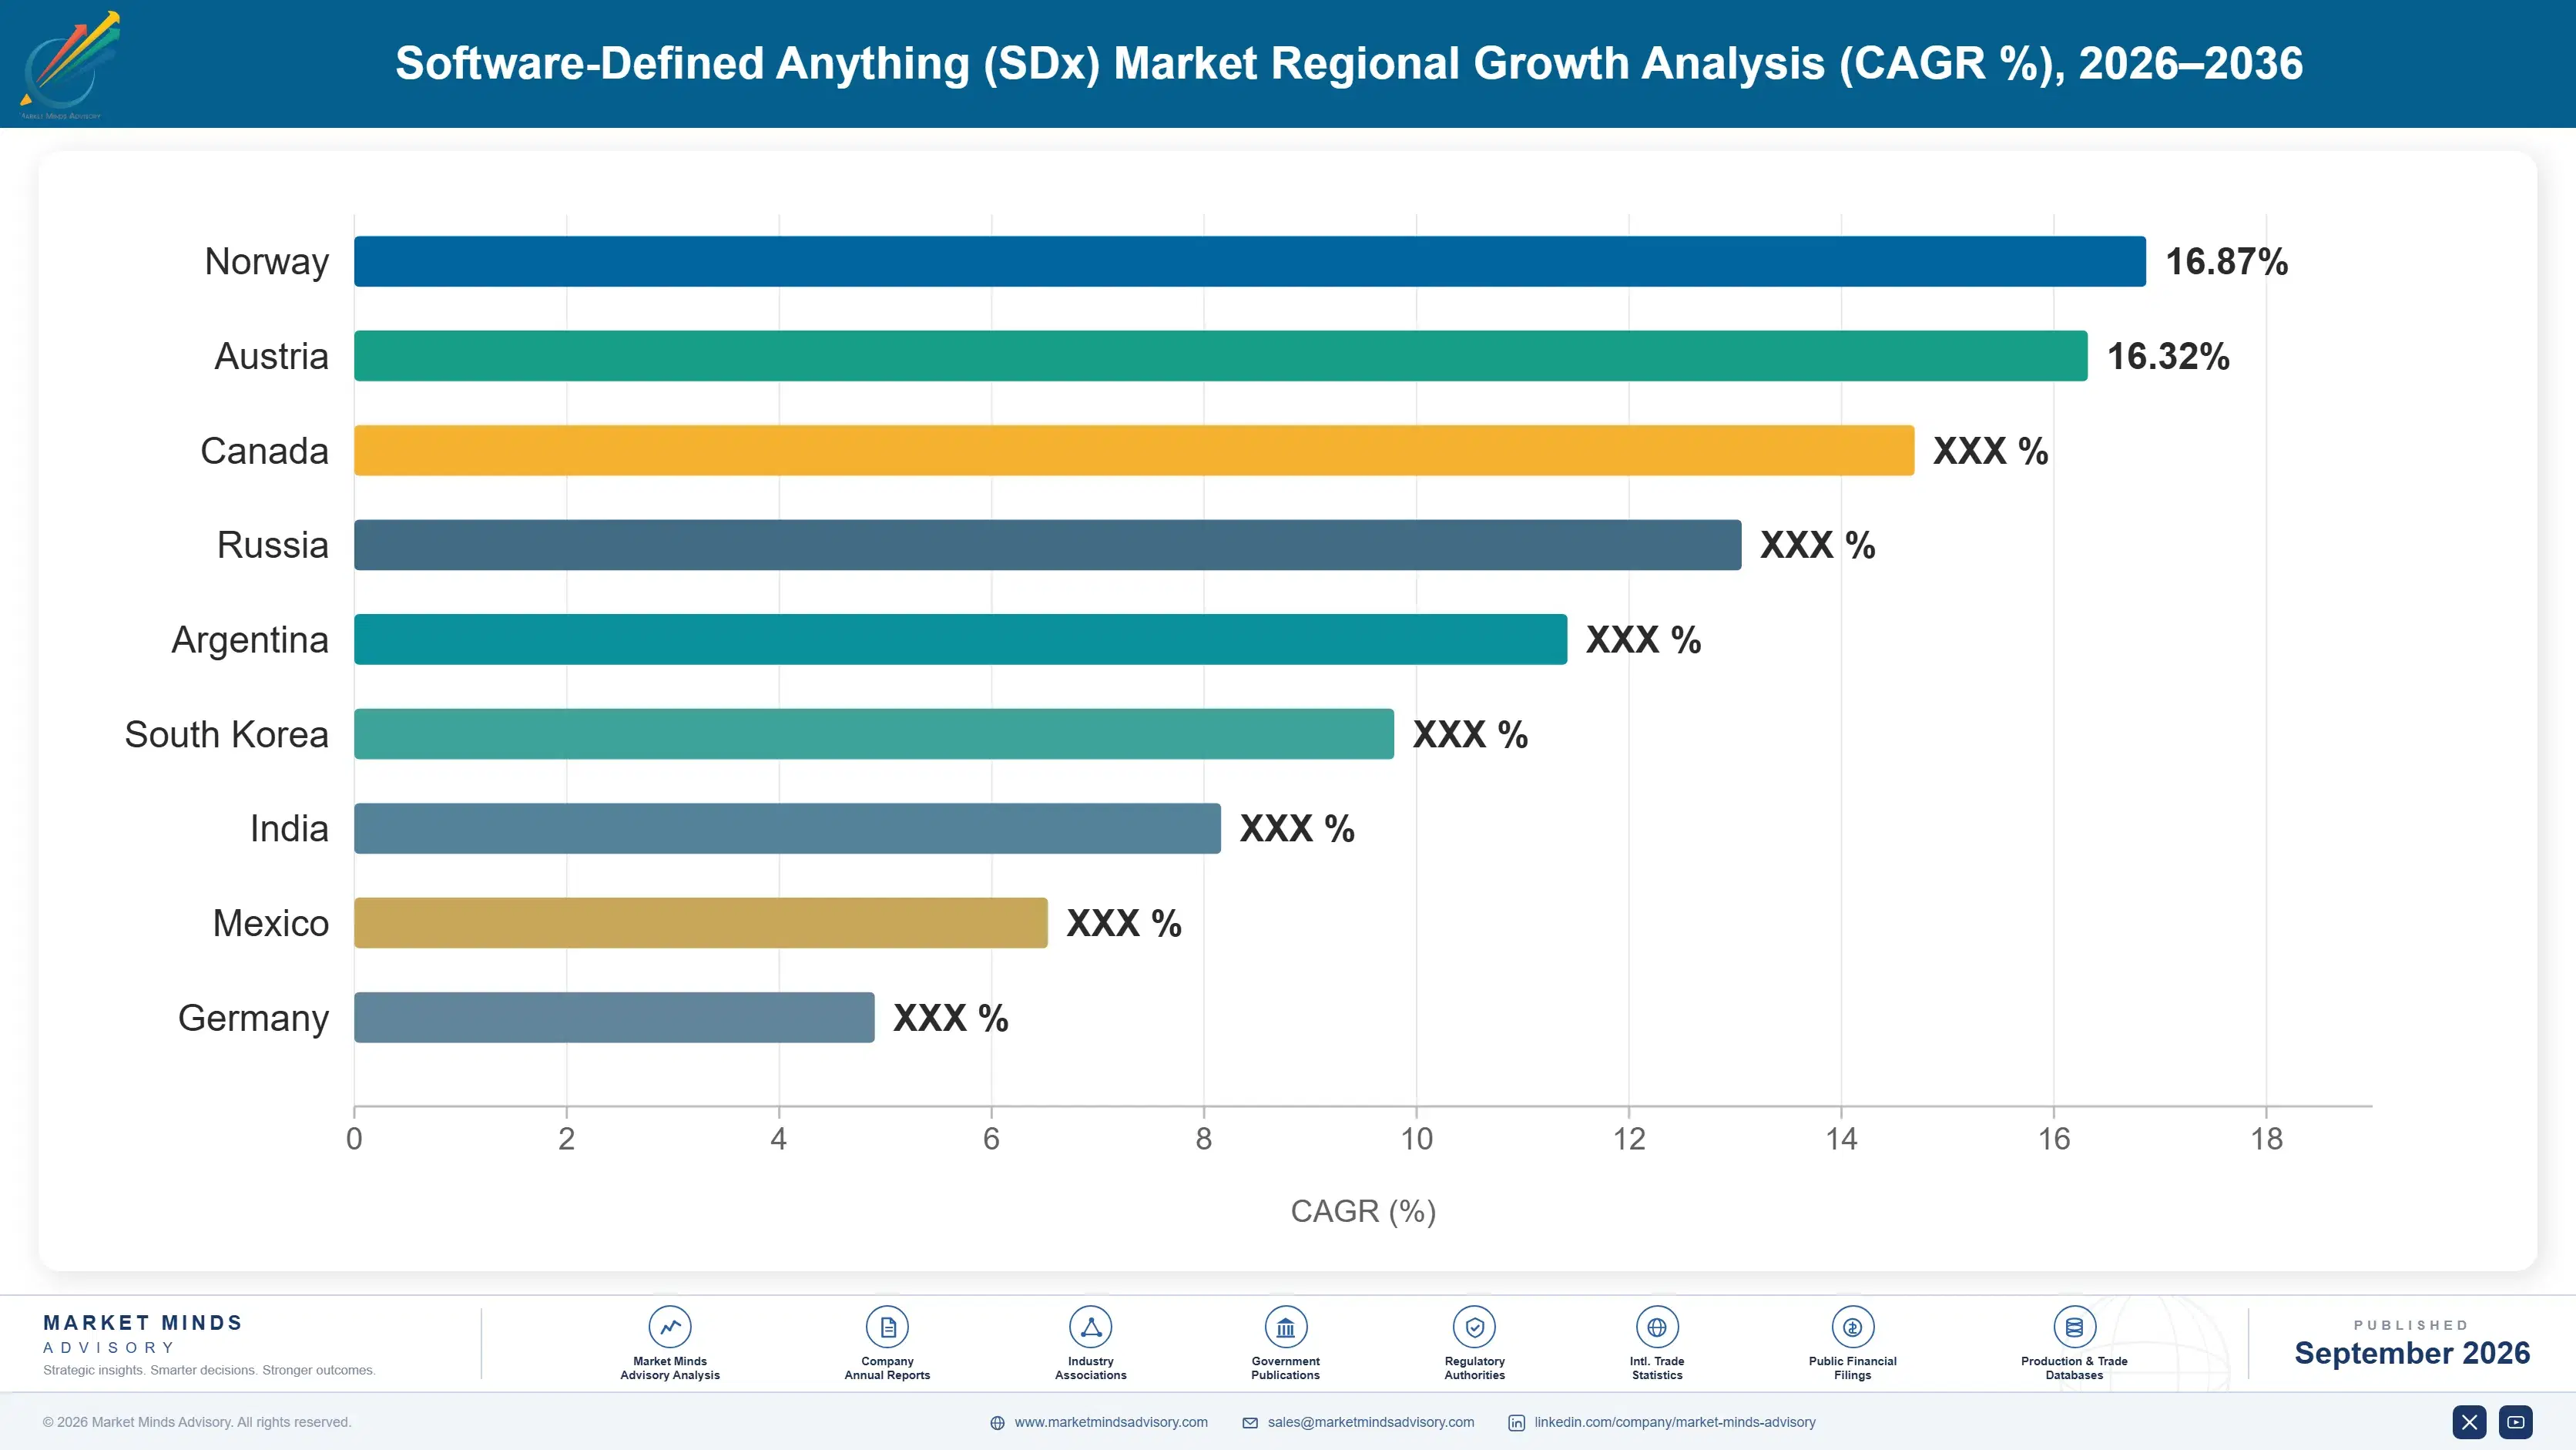
India: 20.8% CAGR
Fastest Growth Region
South Asia and Pacific: 14.9% CAGR
Largest Region
East Asia: 29% of 2025 global value
Market Leaders
VMware, Cisco Systems, Nutanix, Hewlett Packard Enterprise and Red Hat lead on software-defined infrastructure licensing and support revenue. Source: MMA Analysis.
Primary Survey
n=3,800 procurement and R&D decision-makers, Q4 2025, six countries
Methodology
Demand-side build-up, cross-validated against public data, 47 expert interviews

Software-Defined Anything (SDx) Market Forecast Scenarios

software-defined-anything-sdx-market-size-forecast-scenario-1789997585768
The category compounded at 11.7% between 2020 and 2025, and the disappointments were as instructive as the growth. Plenty of organisations bought control planes and never reached the automation that justified them, because the operating model underneath stayed exactly as it was. Abstraction rewards teams who change how they work and punishes those who install it over an unchanged process.
The base case holds 12.9% on three mechanisms. Branch connectivity keeps converting to software-defined wide area networking because the hardware per site was expensive and the savings are legible to finance. Licensing changes at major vendors keep pushing buyers to reassess platforms they had treated as permanent. And regulated industries keep needing policy enforcement expressed as code rather than as configuration nobody can audit afterwards. Each of those three mechanisms runs largely independently of the other two.
The bull case at 14.2% assumes skills supply improves as training and tooling mature, since operational capability rather than budget is what actually caps deployment today. The bear case at 11.6% is consolidation onto public cloud platforms, where organisations decide that running their own control plane was never worth the operational burden it turned out to carry.

Abstraction Moves The Difficulty

The pitch was that abstraction removes complexity. What it actually does is move complexity from hardware configuration into software operation, and those require different people. Only around 38% of deployments reach the automation their business case assumed, and the gap is almost never technical. It takes roughly 14 months before a network team runs a control plane confidently without vendor assistance, and organisations that budgeted the licence and not that period are the ones whose projects stall.
TOP FIVE CONCENTRATION44%Unusually low for infrastructure, reflecting how differently subsegments behave
DEPLOYMENTS REACHING AUTOMATION38%Share that actually reached the automation their purchase assumed
OPERATOR RETRAINING PERIOD14 monthsBefore a network team runs a control plane unaided
RENEWAL REASSESSMENT RATE46%Buyers formally evaluating alternatives at each licensing renewal now
BRANCH HARDWARE DISPLACED61%Site equipment removed where wide area networking converted to software
SERVICES SHARE OF SPEND34%Deployment and integration services alongside the licence itself
Wide area networking is where the economics are clearest. Branch sites carried expensive hardware that software-defined approaches displace at around 61% of installed equipment, and finance departments understand that arithmetic immediately. Software-defined wide area networking grows at 19.4% against 12.9% for the market as a result. Data centre networking and storage are harder sells precisely because the hardware being displaced was already reasonably efficient.
Licensing upheaval has done more for competitive movement than any technology has. Roughly 46% of buyers now formally evaluate alternatives at renewal, which is a considerable change from a category where platform decisions used to be treated as permanent. Concentration sits at 44%, low for enterprise infrastructure, and has been falling rather than consolidating.
"Every one of these deployments has the same failure mode and it is never the software. Somebody buys a control plane, keeps the same operating process, and then wonders why the automation never arrived. The licence was the cheap part and almost nobody budgets for the expensive one."
Director, Enterprise Infrastructure and Automation Practice · MMA Technology Practice · September 2026

Market Trends

Licensing Changes Reopened Settled Platform Decisions

Roughly 46% of buyers now formally evaluate alternatives at each licensing renewal, in a category where platform choices were previously treated as permanent and rarely revisited at all. Pricing and packaging changes at major vendors did more to move competitive position than any technical development across the same period. Concentration sits at 44% and has been falling rather than consolidating. Incumbents defending on switching cost are defending something buyers have started to measure and question seriously. Buyers have started costing the move rather than assuming it is impossible, which is the change that matters.
Market Impact: Displaces 61% of branch hardware
Skill Supply Caps Deployment More Than Budget

It takes roughly 14 months before a network or infrastructure team runs a control plane confidently without vendor assistance, and only around 38% of deployments reach the automation their business case assumed. The constraint is operational capability rather than licence cost or technical capability in the product. Organisations that budgeted the software and skipped the retraining period are the ones whose projects stall halfway, and vendors who ignore this see renewals fail on outcomes they could have influenced. The licence was always the cheap part of this purchase. Retraining is the expensive part nobody budgets.
Market Impact: India compounds at 20.8% yearly

Market Opportunities and Growth Drivers

Branch Hardware Economics Make Wide Area Networking Obvious

Branch sites carried expensive equipment that software-defined approaches displace at around 61% of installed hardware, and finance departments understand that arithmetic without needing any technical briefing at all. Software-defined wide area networking grows at 19.4% against 12.9% for the market for exactly that reason. The savings are legible per site and multiply across estates measured in hundreds or thousands of locations, which makes the business case considerably easier than any data centre equivalent. No other domain in this market has an argument a finance function follows unaided. Site count drives the whole case.
Market Impact: Only 38% reach intended automation

Regulated Industries Need Policy Expressed As Code

Auditors increasingly want security and network policy expressed as versioned code rather than as device configuration that nobody can reconstruct after the fact. That requirement pushes software-defined security policy enforcement into organisations that would otherwise have deferred, particularly across financial services and healthcare where evidence matters more than efficiency. India compounds at 20.8% partly on regulated sector deployment. The audit argument reaches budget holders that efficiency arguments never persuaded at all. Regulated buyers therefore deploy this domain ahead of others they had deferred, which reverses the usual adoption sequence in this market entirely.
Market Impact: Retraining consumes 14 months

Market Restraints and Challenges

Operating Models Rarely Change With The Technology

Only around 38% of deployments reach the automation their business case assumed, and the failure is almost never in the software itself. The root cause is that abstraction moves complexity from hardware configuration into software operation, and organisations keep the same team, the same change process and the same approval chain. Commercially this destroys renewal confidence. Mitigation runs through outcome-based deployment contracts, through vendor-funded retraining, and through phased rollouts that prove automation on a subset first. None of those removes the retraining period; they only make it visible before the money is committed.
Market Impact: Some 46% reassess at renewal

Public Cloud Removes The Question Entirely

Organisations weighing a control plane against public cloud infrastructure increasingly conclude that running their own was never worth the operational burden it carried. The root cause is that the 14 month operator retraining period and the automation shortfall both disappear when somebody else operates the platform. Commercially this caps the addressable base. Mitigation runs through hybrid positioning, through data residency and latency arguments that cloud cannot answer, and through pricing that reflects operational cost honestly. Substitution pressure is strongest exactly where deployment has already disappointed once. Honest pricing beats defensive positioning here.
Market Impact: Only 38% reach intended automation
4 additional market trends, 3 additional growth drivers, and 2 additional restraints and challenges are covered in the full report. Contact sales@marketmindsadvisory.com to access the complete intelligence.

Segment CAGR and Growth Architecture

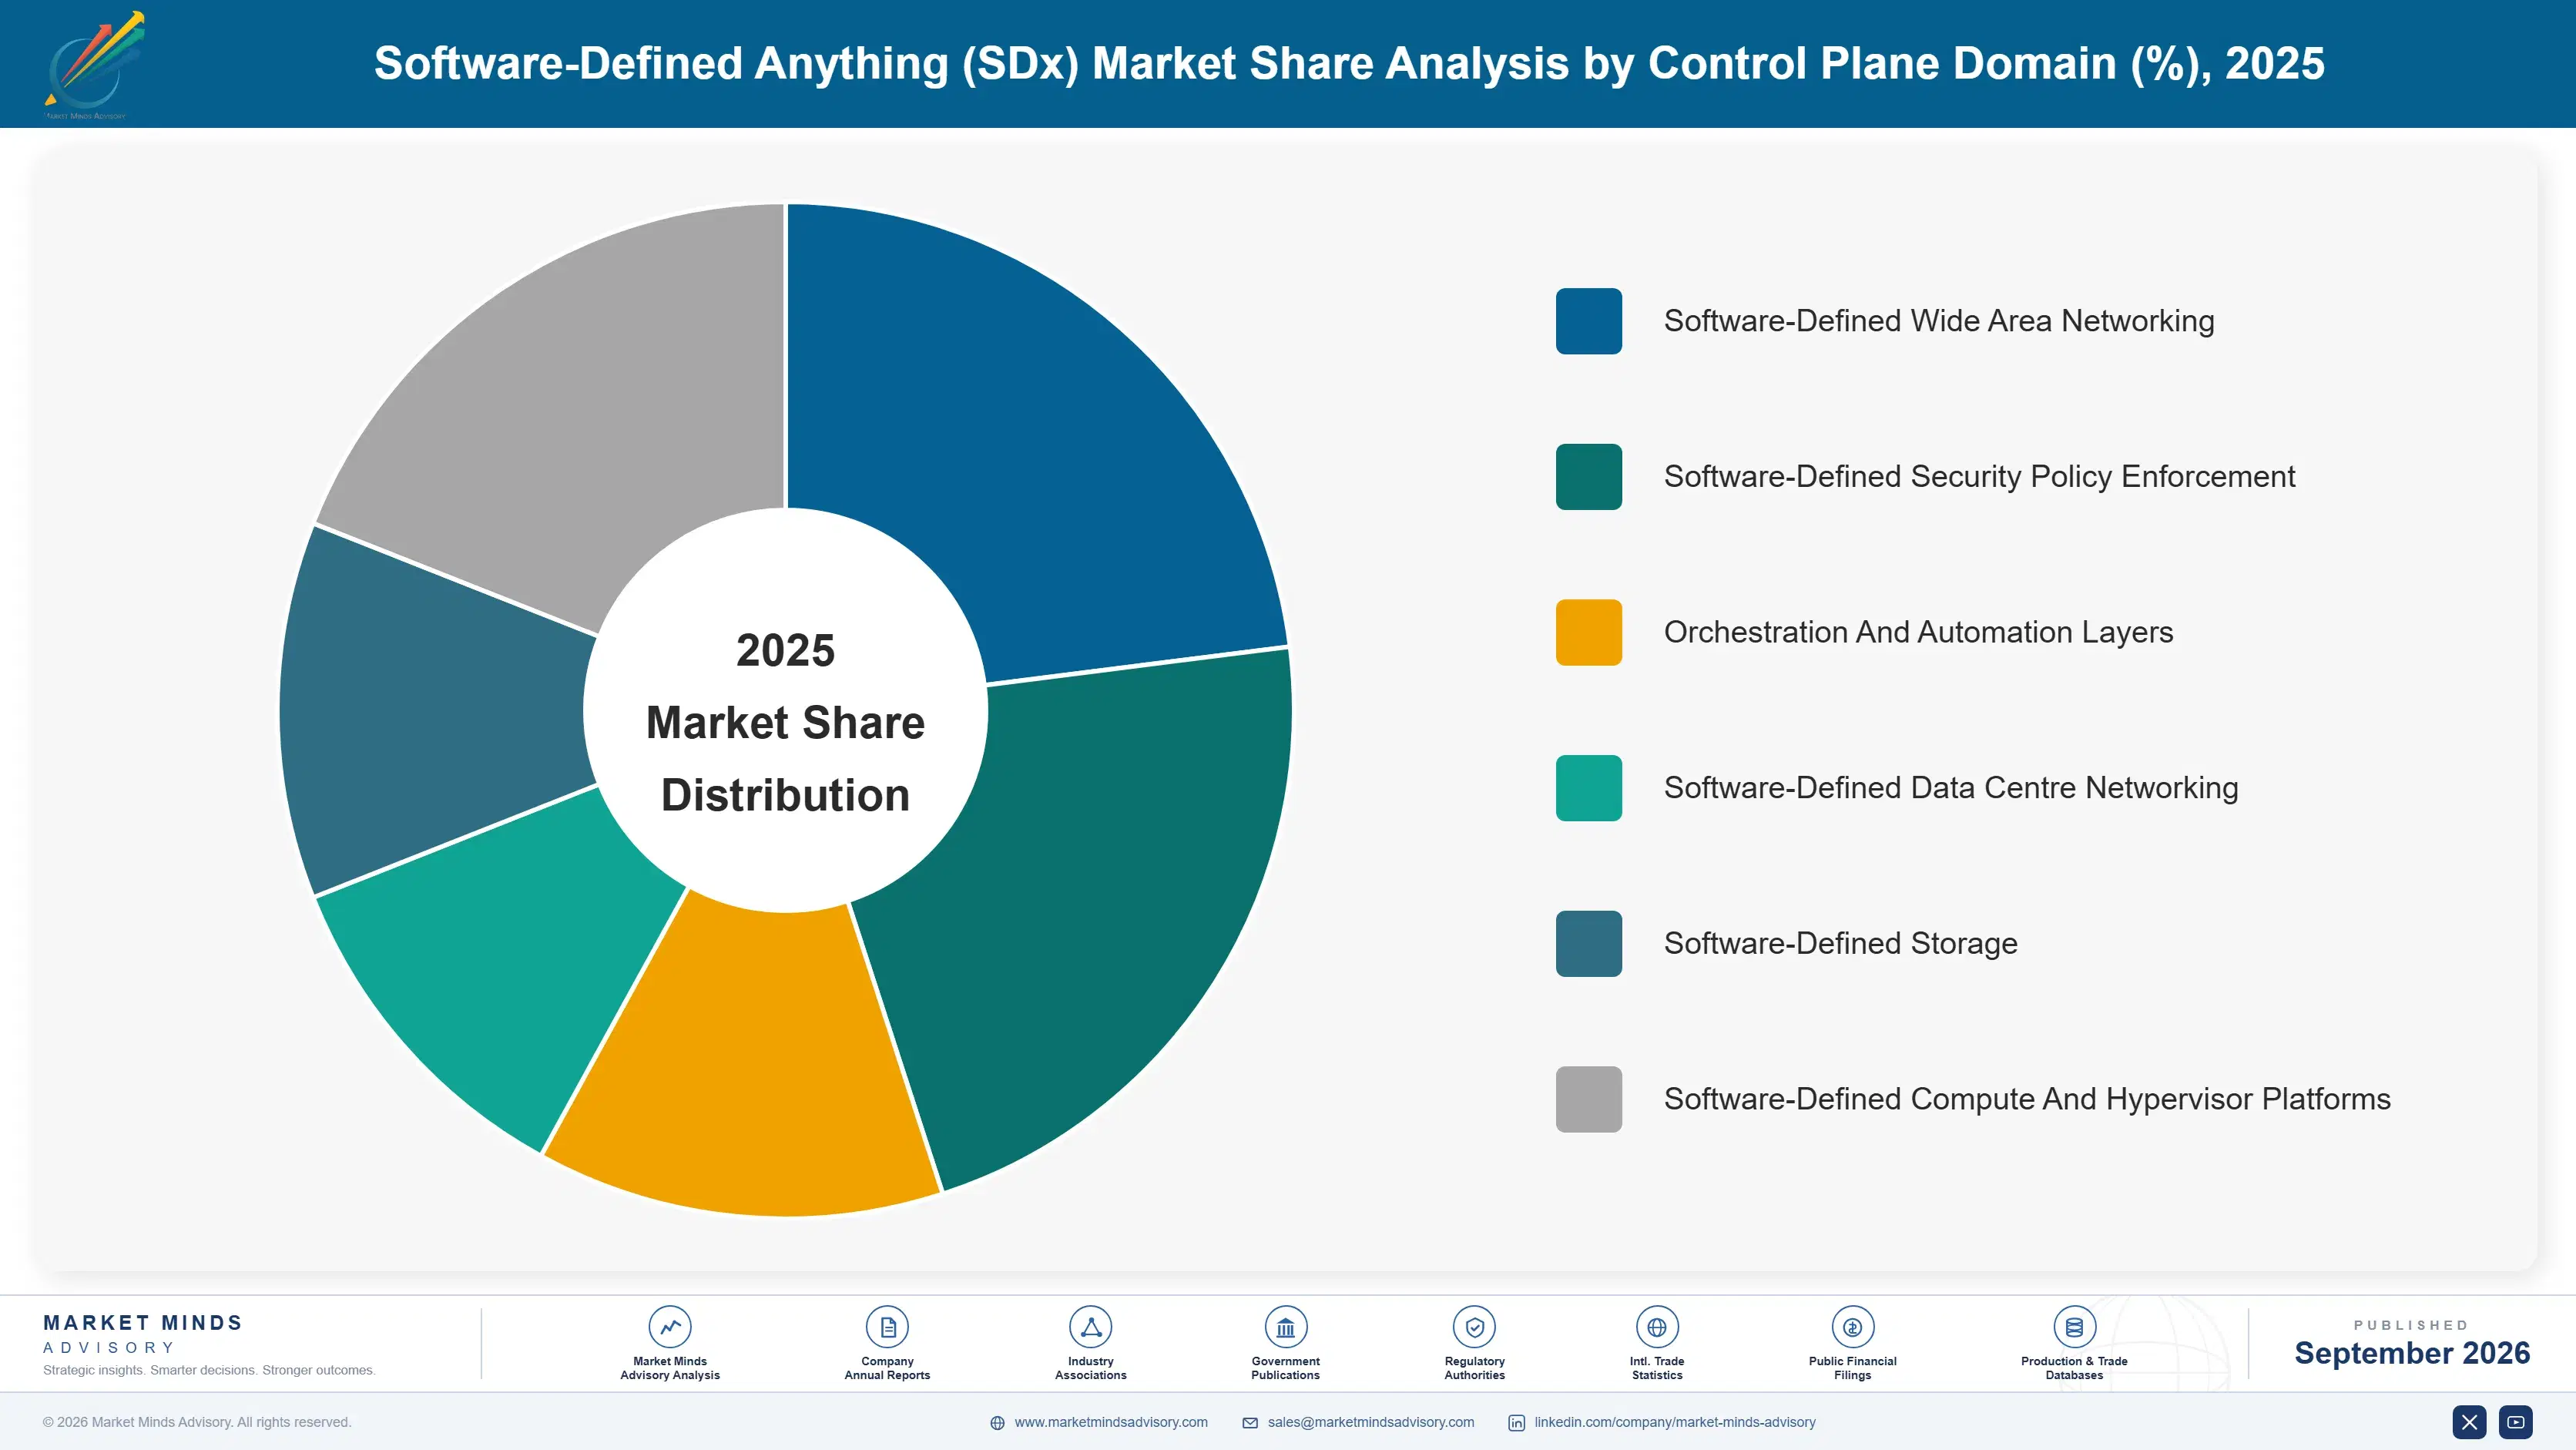
Segmentation follows control plane domain, since each carries different displacement economics, different operator skill demands and quite different exposure to public cloud substitution. Six domains cover the market: wide area networking, data centre networking, storage, compute and hypervisor platforms, security policy enforcement, and orchestration layers. Deployment model and buyer industry are separate dimensions. Both are handled elsewhere.
software-defined-anything-sdx-market-market-share-analysis-1789997586317

Software-Defined Wide Area Networking

Software-defined wide area networking grows at 19.4%, half again the market rate of 12.9%, because branch sites carried expensive hardware that software-defined approaches displace at around 61% of installed equipment. Finance departments understand that arithmetic without needing a technical briefing, which is not true of any other domain in this market. The savings are legible per site and multiply across estates measured in hundreds or thousands of locations. That combination makes the business case far easier than data centre networking or storage, where the hardware being displaced was already reasonably efficient and the argument becomes an operational one instead. Vendors leading with data centre abstraction start from the hardest argument available to them.
CAGR 19.4%

Software-Defined Security Policy Enforcement

Software-defined security policy enforcement compounds at 15.6% because auditors increasingly want policy expressed as versioned code rather than as device configuration nobody can reconstruct afterwards. That requirement reaches budget holders whom efficiency arguments never persuaded, particularly across financial services and healthcare where evidence of control matters more than operational saving. Regulated buyers deploy this domain ahead of others they had deferred, which reverses the usual adoption sequence entirely. The retraining burden is real here too, though audit pressure tends to fund it more reliably than efficiency cases ever managed to. Networking vendors lack the compliance depth this domain requires, and compliance vendors lack the network engineering, which keeps the competing field unusually narrow.
CAGR 15.6%
Full segment breakdown across 6 segments available in the complete report.

Regional Architecture and Country Demand Map

East Asia holds 29% of spending, the largest regional share, because greenfield infrastructure build and telecommunications operator deployment both concentrate there without legacy estates to work around. North America follows at 27% on enterprise renewal activity. India compounds fastest at 20.8% on regulated sector deployment.

East Asia

East Asia takes 29% of spending, the largest regional share, because greenfield infrastructure build and telecommunications operator deployment both concentrate here without decades of legacy estate to work around first. Chinese and South Korean operators deploy control planes at scale that enterprise buyers elsewhere never approach. Japanese enterprise adoption is more cautious and slower, weighted toward storage and compute rather than networking. The absence of legacy hardware is worth more here than any licensing argument. Growth at 13.9% runs above the global rate on operator deployment rather than enterprise renewal. Skills supply here is better than in most regions, which shortens the retraining period that constrains deployment elsewhere. Legacy migration is rarely the problem.
Share: 29% | CAGR: 13.9% (2026 to 2036)

North America

North America accounts for 27% of spending, where the activity is renewal reassessment rather than new deployment across most large enterprises. Roughly 46% of buyers now formally evaluate alternatives at renewal, and this region is where that behaviour started and remains most pronounced. VMware, Cisco Systems, Nutanix and Hewlett Packard Enterprise all operate from here. Public cloud substitution pressure is also strongest here, which caps the addressable base more than in any other region. Growth at 13.2% sits above the global rate on wide area networking conversion. Services attach rates here run above the global average as vendors defend renewals through deployment support. Renewal timing now governs vendor engagement here more than product roadmaps do.
Share: 27% | CAGR: 13.2% (2026 to 2036)
Regional intelligence for 5 additional markets available in the complete report: Western Europe, South Asia and Pacific, Latin America, Middle East and Africa, Eastern Europe. Contact sales@marketmindsadvisory.com.
software-defined-anything-sdx-market-country-cagr-analysis-1789997586888

Where Control Plane Deals Land

Operational skill caps deployment rather than budget, licensing upheaval reopened decisions buyers had treated as permanent, and branch hardware displacement is the only economics finance understands unaided. The four levers below follow those conditions rather than any argument about control plane capability. Each addresses a commercial condition rather than an engineering one. Capability arguments come last here.

Sell The Retraining Alongside The Licence

It takes roughly 14 months before a team runs a control plane confidently without vendor help, and only around 38% of deployments reach the automation their business case assumed. Vendors who price and deliver that retraining as part of the deal protect renewals they would otherwise lose on outcomes. Those who sell the licence and leave the operating model alone are funding their own churn, and the customer usually blames the product rather than the process. Accounts reaching automation within 12 months renew at rates well above portfolio average. That difference is the whole retention problem.
Market Impact: Only 38% of deployments now reach full automation

Attack Renewals Where Licensing Changed Recently

Roughly 46% of buyers now formally evaluate alternatives at each renewal, in a category where platform decisions used to be permanent and unexamined. That window is short and it closes once a decision is retaken. Vendors who time engagement to renewal calendars rather than to their own quarters reach buyers who are genuinely open, and concentration at 44% and falling shows the movement is real rather than theoretical positioning by challengers. Concentration has fallen across 3 consecutive years on that behaviour alone. Timing the approach matters more than the pitch itself.
Market Impact: Fully 46% of enterprise buyers now reassess yearly

Lead With Branch Economics Not Data Centre Ones

Wide area networking displaces around 61% of branch hardware and finance departments follow that arithmetic without any technical briefing, which is not true of data centre networking or storage. Leading with the domain that sells itself opens the account, and the harder domains follow once operational capability exists. Vendors leading with data centre abstraction are starting with the argument that requires the most explanation and delivers the least immediate saving. An estate of 400 branches makes that saving legible immediately. Opening on the easy domain buys the credibility the harder ones require later on.
Market Impact: Branch hardware displacement now reaches a full 61%

Answer Cloud Substitution Before The Buyer Raises It

Organisations weighing a control plane against public cloud increasingly conclude the operational burden was never worth carrying, and the 14 month retraining period is exactly the burden they mean. Vendors who raise data residency, latency and audit evidence first frame the comparison on ground they can hold. Those who wait for the buyer to raise it are answering a question that has usually already been decided somewhere above the technical evaluation. Framing the comparison early is worth more than answering it well later. Residency and latency are the two arguments cloud cannot answer.
Market Impact: Operator retraining now consumes a full 14 months

Who Controls the Margin Pool

Five vendors hold 44% of software-defined infrastructure spending, which is unusually low for enterprise infrastructure and reflects how differently the six control plane domains behave commercially. VMware, Cisco Systems, Nutanix, Hewlett Packard Enterprise and Red Hat lead. All participants here are assessed on software-defined infrastructure licensing and support revenue rather than on hardware or services businesses they also operate. Concentration has been falling rather than consolidating.
Competition runs on licensing terms and renewal economics far more than on control plane capability, since roughly 46% of buyers now formally reassess alternatives at renewal. The second dimension is deployment support depth, because operational skill rather than budget caps what customers actually achieve and vendors who ignore that lose renewals on outcomes they could have influenced directly. Product capability competes a distant third behind both of those.

Pressure is emerging from public cloud substitution, which removes the requirement entirely rather than competing for it. Rankings shift where licensing changes push buyers to reassess and where greenfield deployment avoids migration, particularly across East Asia, India and the Gulf at present. Vendors organised entirely around technical evaluation are selling to the constituency with the least remaining budget authority.
software-defined-anything-sdx-market-company-positioning-matrix-1789997587435

Competitive Moat and Risk Dimensions

VMWARE

Moat: Installed Estate Depth

VMware sits underneath a very large share of enterprise virtualised infrastructure, and migrating away means touching workloads organisations would rather not disturb. That reluctance is worth more than any technical advantage, because the operator retraining period applies to the replacement as much as the original. Buyers reassessing still find switching harder than the licensing argument suggests.
VMWARE

Risk: Licensing Reassessment Exposure

Licensing and packaging changes are precisely what pushed roughly 46% of buyers to formally evaluate alternatives at renewal, in a category where decisions used to be permanent. Installed estate depth protects against casual switching and not against a buyer who has already started costing the move. Concentration falling rather than consolidating suggests some of those evaluations are converting.
NUTANIX

Moat: Operational Simplicity Position

Nutanix built its position on reducing the operational burden that constrains this market, which addresses the 14 month retraining period more directly than capability-led competitors do. Since only around 38% of deployments reach intended automation, a platform shortening the operator learning curve sells against the actual failure mode rather than against a feature list.
NUTANIX

Risk: Cloud Substitution Overlap

The operational simplicity argument competes directly with public cloud, which removes the operating burden entirely rather than reducing it. Buyers persuaded that operational cost matters most are precisely the ones most open to letting somebody else carry it altogether. That makes the positioning strong against on-premises rivals and exposed against the substitution that caps the whole category.

Players Tracked

Prominent Players

VMware
Cisco Systems
Nutanix
Hewlett Packard Enterprise
Red Hat

Other Key Players

Fortinet
Juniper Networks
Arista Networks
Palo Alto Networks
Dell Technologies
IBM
Huawei Technologies
Versa Networks
Cato Networks
Netskope
SUSE
Pure Storage
NetApp
Extreme Networks
Aryaka Networks

Recent Developments

FEBRUARY 2025

Licensing Changes Push Enterprise Buyers To Reassess Platforms

Packaging and pricing changes at major virtualisation vendors pushed enterprise buyers to formally evaluate alternatives at renewal, a commercial development rather than any corporate transaction. Roughly 46% of buyers now run those evaluations, in a category where platform decisions had previously been treated as permanent and rarely examined again.
Signal: Concentration falling rather than consolidating suggests some of those renewal evaluations are genuinely converting into moves.
AUGUST 2024

Vendors Bundle Operator Retraining Into Deployment Contracts

Several control plane vendors began bundling operator retraining into deployment contracts, a commercial packaging development rather than any acquisition or partnership. Only around 38% of deployments reach the automation their business case assumed, and vendors concluded that renewal risk sat in the operating model rather than in the product.
Signal: Vendors are finally pricing the expensive part of a deployment instead of only the cheap one.
MAY 2025

Regulated Buyers Prioritise Policy Enforcement Over Efficiency Domains

Financial services and healthcare buyers accelerated software-defined security policy deployment ahead of networking and storage domains, a procurement sequencing development rather than any corporate event. Auditors increasingly require policy expressed as versioned code rather than as device configuration that cannot be reconstructed after the fact.
Signal: Audit evidence funds deployment far more reliably than efficiency arguments ever managed to across these regulated industries.

What Delivery Actually Costs

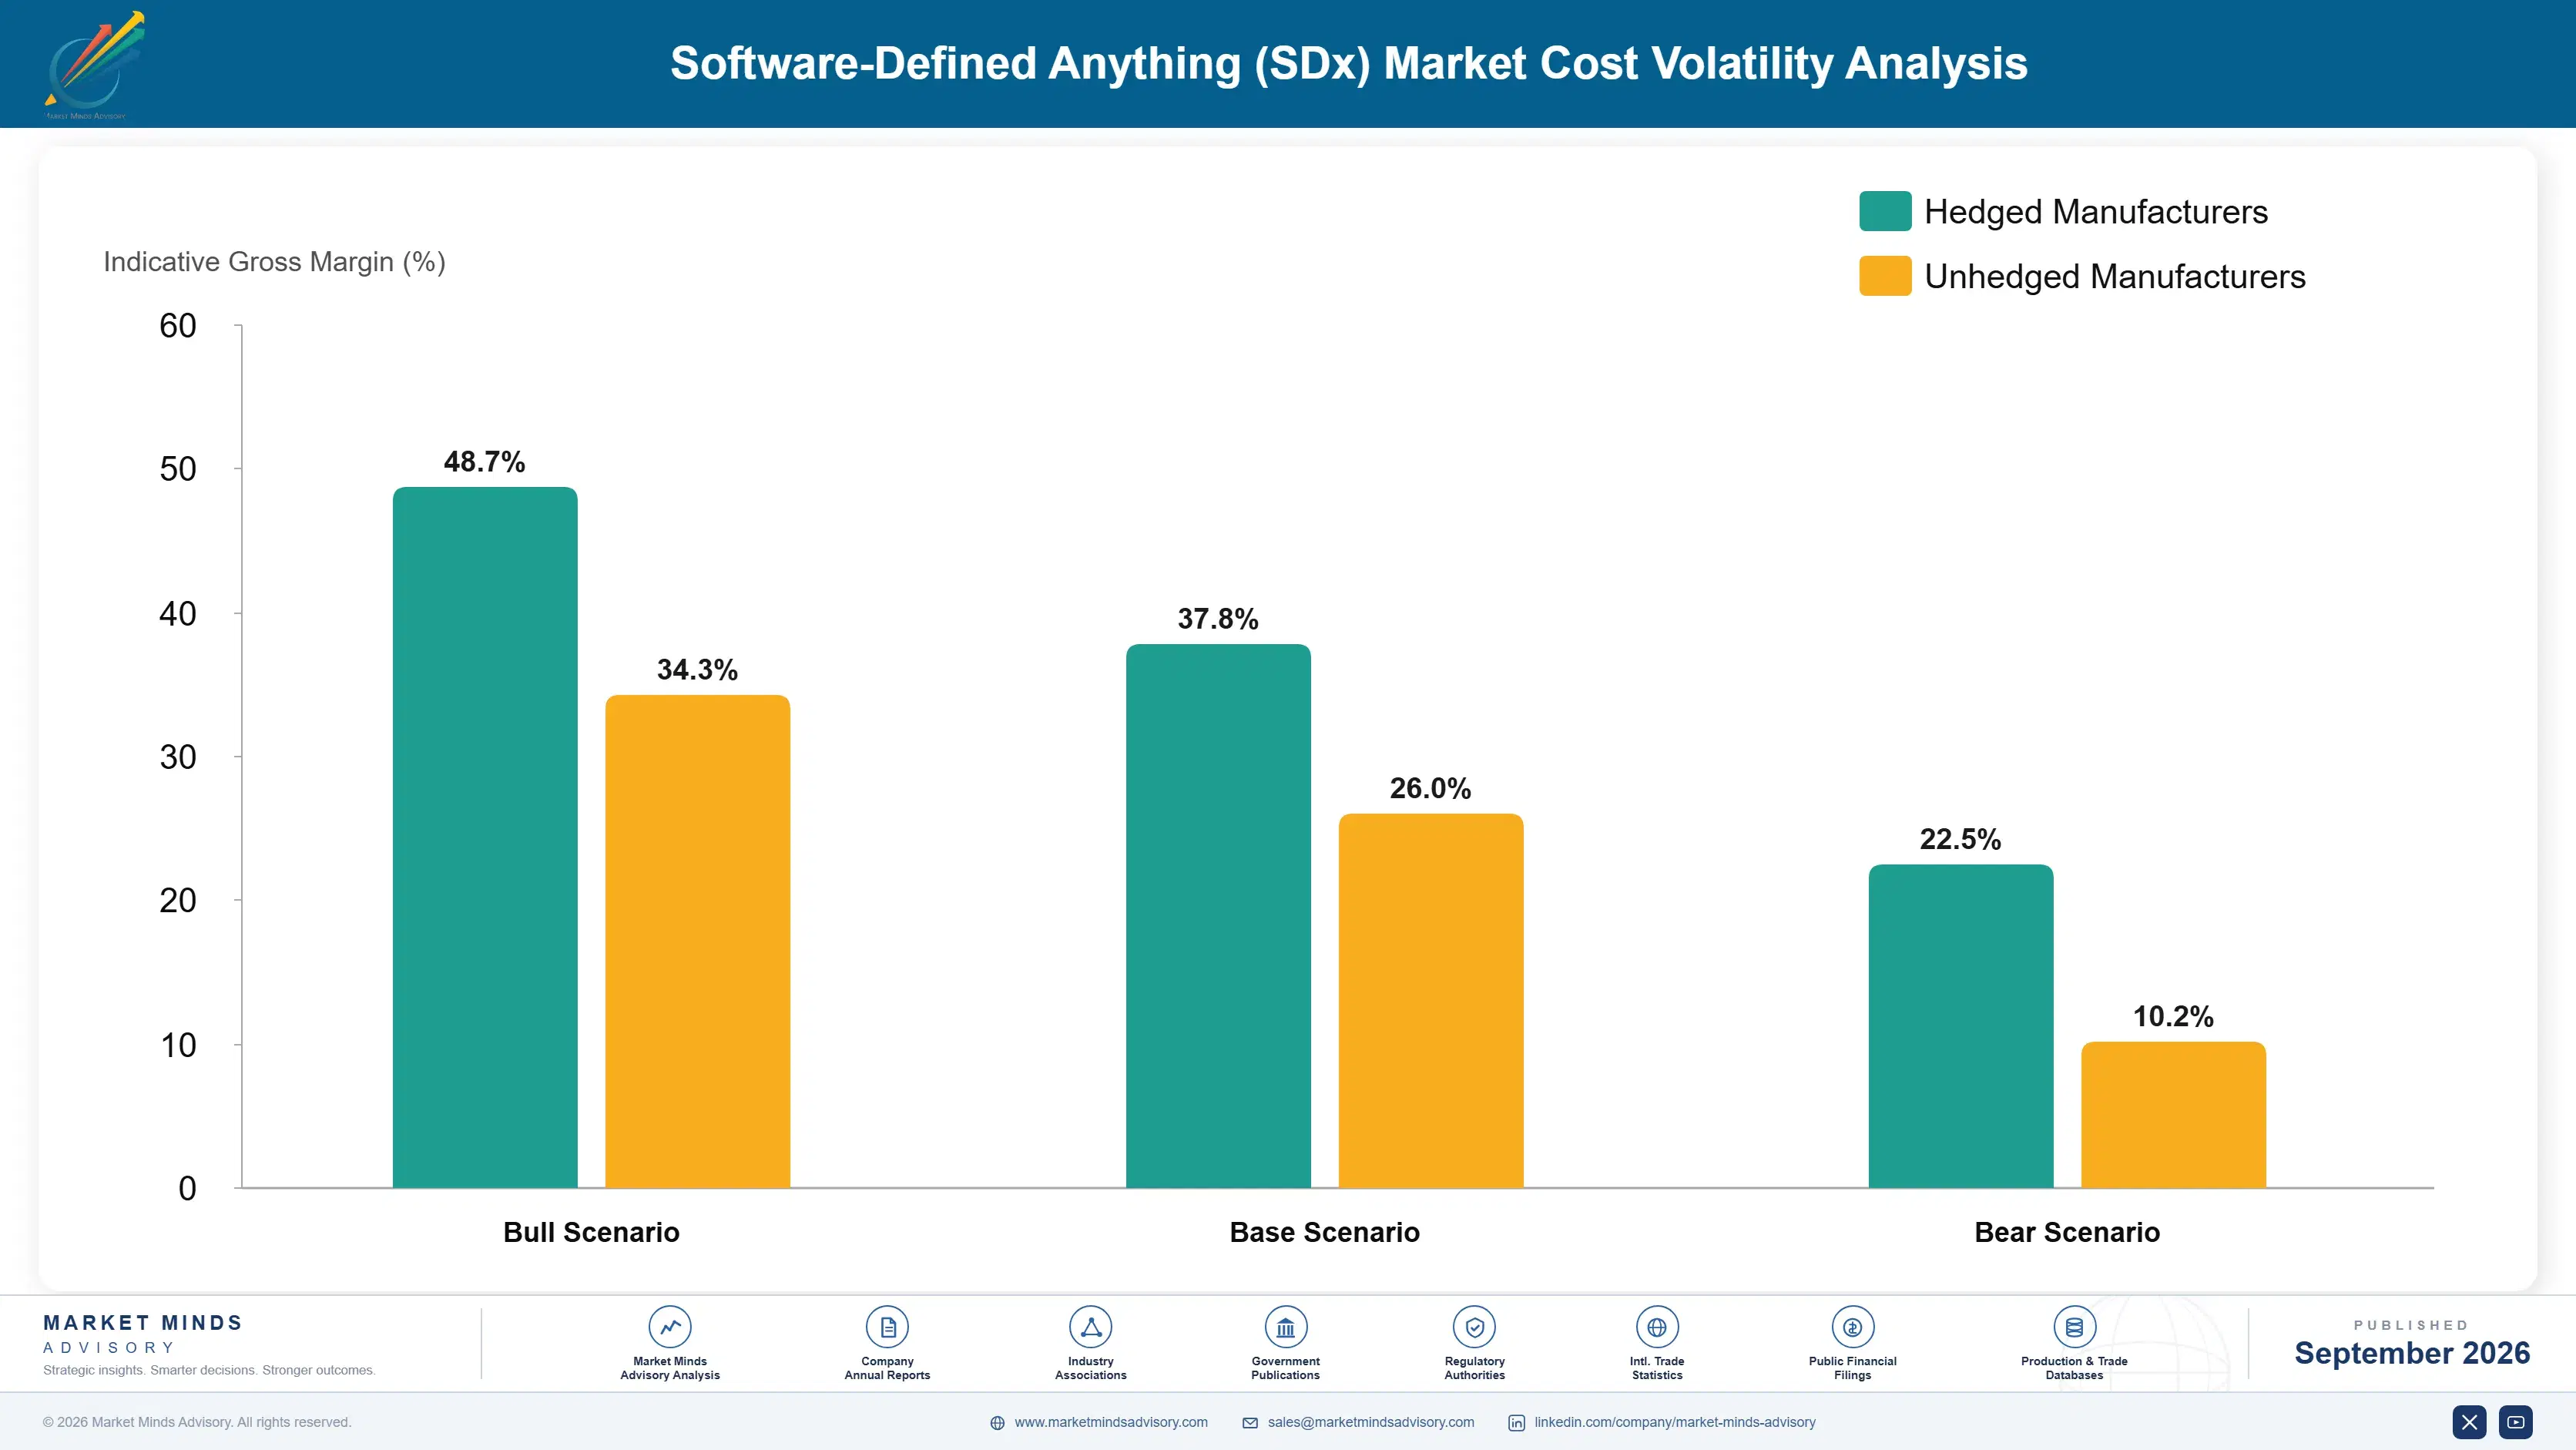
Engineering and product development absorb roughly 36% of vendor cost in this category, concentrated in control plane software and the integrations that make it work against varied hardware. Deployment and support services take around 34% of what customers spend, sitting alongside the licence rather than inside it. Certification, testing and compatibility validation absorb about 12%, and channel and partner enablement takes most of the remainder.
Technical skills costs rose sharply through 2023 and 2024 as demand for control plane and automation engineers outpaced supply across every major market. Cisco Systems Annual Report 2024 and Hewlett Packard Enterprise Annual Report 2024 both record engineering talent cost and services delivery capacity as principal operating variables. Vendors relying on partner delivery capacity fared better than those staffing deployment teams directly at premium rates.

The competitive disadvantage mechanism is services delivery capacity rather than software cost. A vendor able to deploy through trained partners scales into demand that a direct services organisation simply cannot staff at the same speed or price. Exposure concentrates among vendors whose products require deep deployment expertise and whose partner networks are thin, since every deal then consumes scarce internal capacity.
software-defined-anything-sdx-market-cost-volatility-analysis-1789997587638

Build Partner Delivery Capacity Ahead Of Demand

Deployment and support services absorb roughly 34% of customer spending, and vendors staffing that directly cannot scale at the speed demand arrives. Certifying partner engineers ahead of pipeline converts a capacity ceiling into a variable cost. The investment looks premature right up until demand arrives, at which point building the capacity takes considerably longer than closing the deals does.

Reduce Deployment Expertise Required By The Product

It takes roughly 14 months before a team operates a control plane confidently without vendor help, and that period is a product characteristic as much as a customer one. Engineering effort spent reducing required expertise pays back through services capacity freed and renewals protected. Vendors treating deployment difficulty as a revenue opportunity are monetising a problem competitors are removing.

Validate Hardware Compatibility Once Across Families

Certification, testing and compatibility validation absorb around 12% of vendor cost and repeat with every hardware platform and version combination supported. Validating across families rather than individual configurations spreads that expense while keeping the supported matrix honest. Vendors validating exhaustively against every combination carry cost their customers do not value and cannot see in any comparison.

Portfolio Architecture for Margin Defence

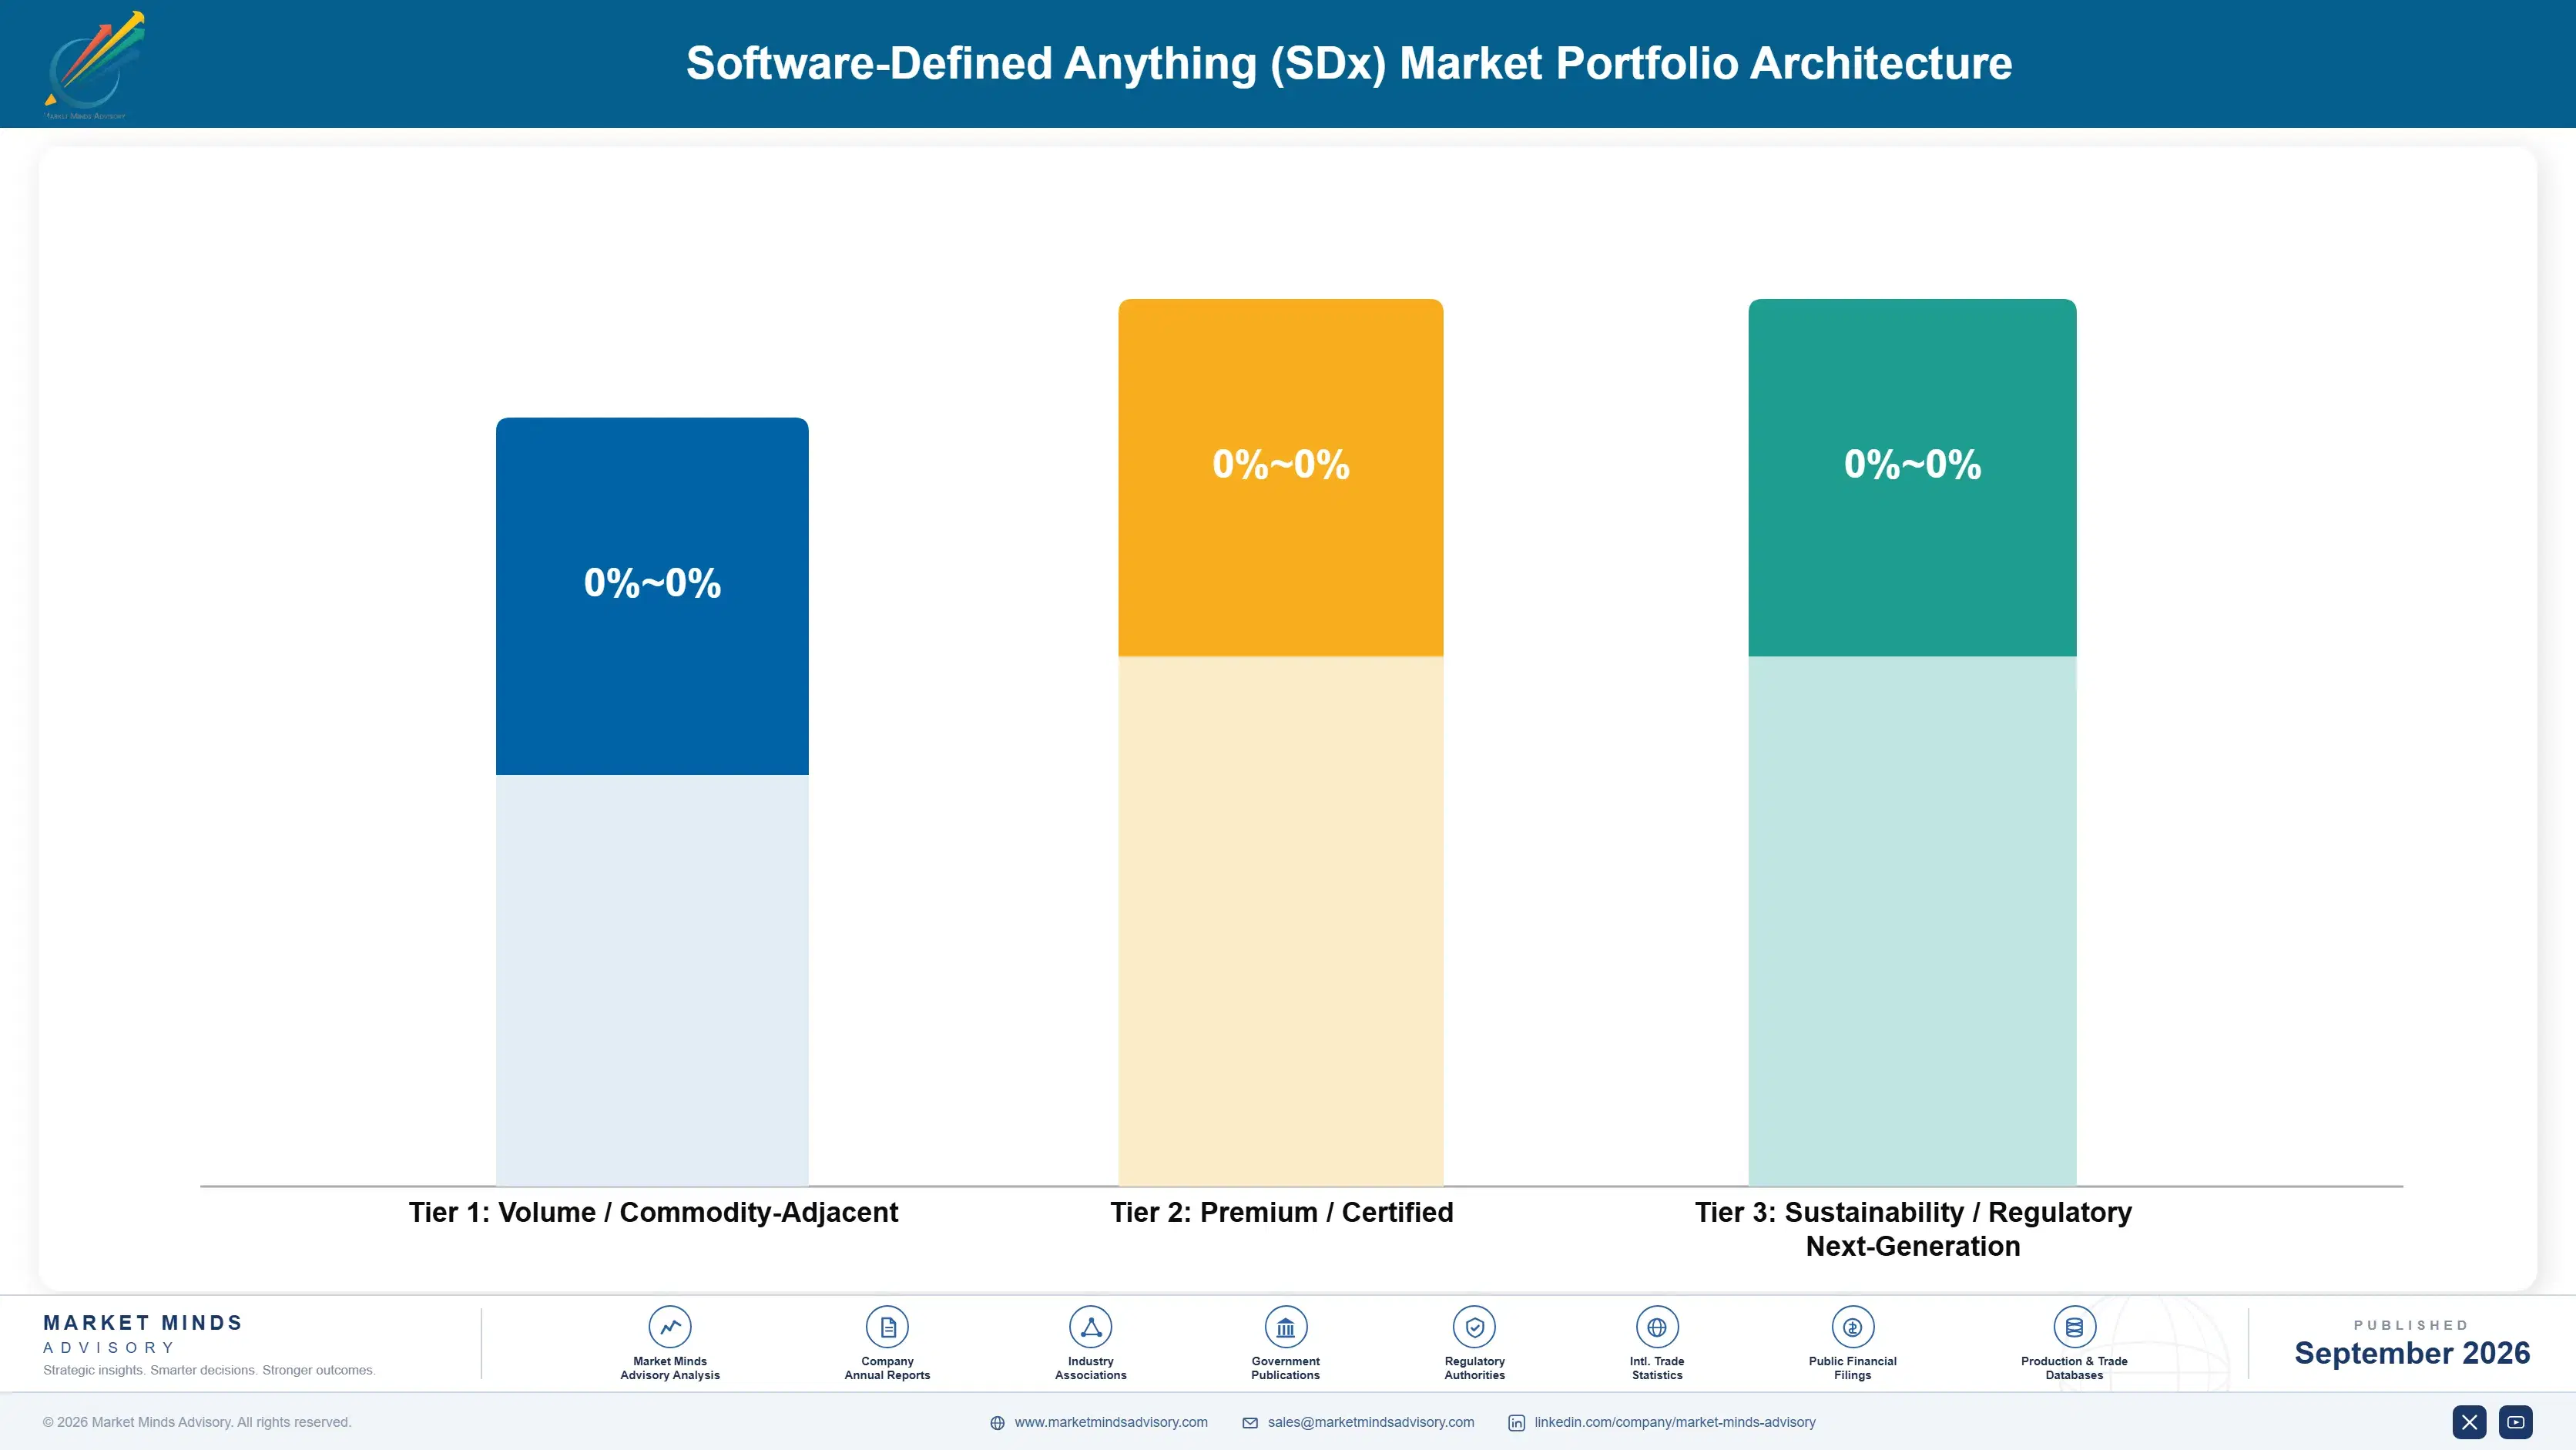
Margin architecture separates on how much deployment expertise a domain demands. Software-defined storage and compute earn least, since alternatives are numerous and the displacement argument is weakest against already efficient hardware. Data centre networking and orchestration sit above on integration complexity. Wide area networking and security policy enforcement earn most, because each pairs clear commercial justification with genuine deployment difficulty.
The volume versus premium tension runs between self-service deployment and expertise-led delivery, which reward opposite product decisions entirely. Volume requires products a customer team can run within months rather than a year. Premium requires depth that justifies services attach at roughly 34% of spending. Vendors pursuing both usually deliver a product too complex for one and too shallow for the other. Choosing one deliberately beats serving both indifferently.

High-value pools concentrate in wide area networking and in security policy enforcement, and neither is reached through general infrastructure abstraction capability. Wide area networking requires branch and connectivity engineering that data centre vendors have not built. Policy enforcement requires audit and compliance depth that networking vendors lack. Both take domain expertise accumulated over years, which is why positions there stay stable.

Volume / Commodity-Adjacent

Software-defined storage and compute platforms, where alternatives are numerous and the hardware being displaced was already reasonably efficient before abstraction arrived. The twelve point spread separates vendors delivering through certified partners from those staffing deployment directly at premium engineering rates.
Gross Margin: 48% to 60%

Premium / Certified

Data centre networking control planes and orchestration layers, where integration complexity across varied hardware determines selection alongside licensing terms. The eleven point spread tracks how much compatibility validation each vendor carries and how efficiently that testing is amortised across hardware families.
Gross Margin: 63% to 74%

Sustainability / Regulatory / Next-Generation

Wide area networking and security policy enforcement, each pairing commercial justification a finance department follows unaided with deployment difficulty that sustains services attach. The ten point spread reflects domain expertise depth, which does not transfer between the two despite both sitting at this layer.
Gross Margin: 76% to 86%
software-defined-anything-sdx-market-portfolio-architecture-1789997588148

High-value Sub-segments and Strategic Watch-out

Software-Defined Wide Area Networking

Grows at 19.4% because branch hardware displacement at around 61% is arithmetic finance follows without any technical briefing. The ten point spread reflects branch engineering depth. Data centre vendors have not built that capability and cannot acquire it quickly. Site count is what drives the case.
Gross Margin: 76% to 86%

Software-Defined Security Policy Enforcement

Grows at 15.6% because auditors want policy expressed as versioned code rather than as configuration nobody can reconstruct. The ten point spread reflects compliance depth. Audit pressure funds deployment more reliably than efficiency arguments ever managed to. Compliance depth is the barrier to entry here.
Gross Margin: 76% to 86%

Orchestration And Automation Layers

Grows at 13.4% and is where the automation shortfall actually bites, since only around 38% of deployments reach it. The eleven point spread reflects integration breadth. Sold alongside other domains rather than standing alone in most deals. Automation is what the whole purchase assumed. Standalone demand stays thin.
Gross Margin: 63% to 74%

Software-Defined Storage And Compute

Grows at 8.2%, slowest of the six domains, on displacement arguments weakest against hardware that was already efficient. The twelve point spread reflects partner delivery leverage. Public cloud substitution pressure bites here harder than anywhere else. Alternatives here are numerous and cheap. Displacement arguments land weakest here.
Gross Margin: 48% to 60%

Why Renewals Now Move

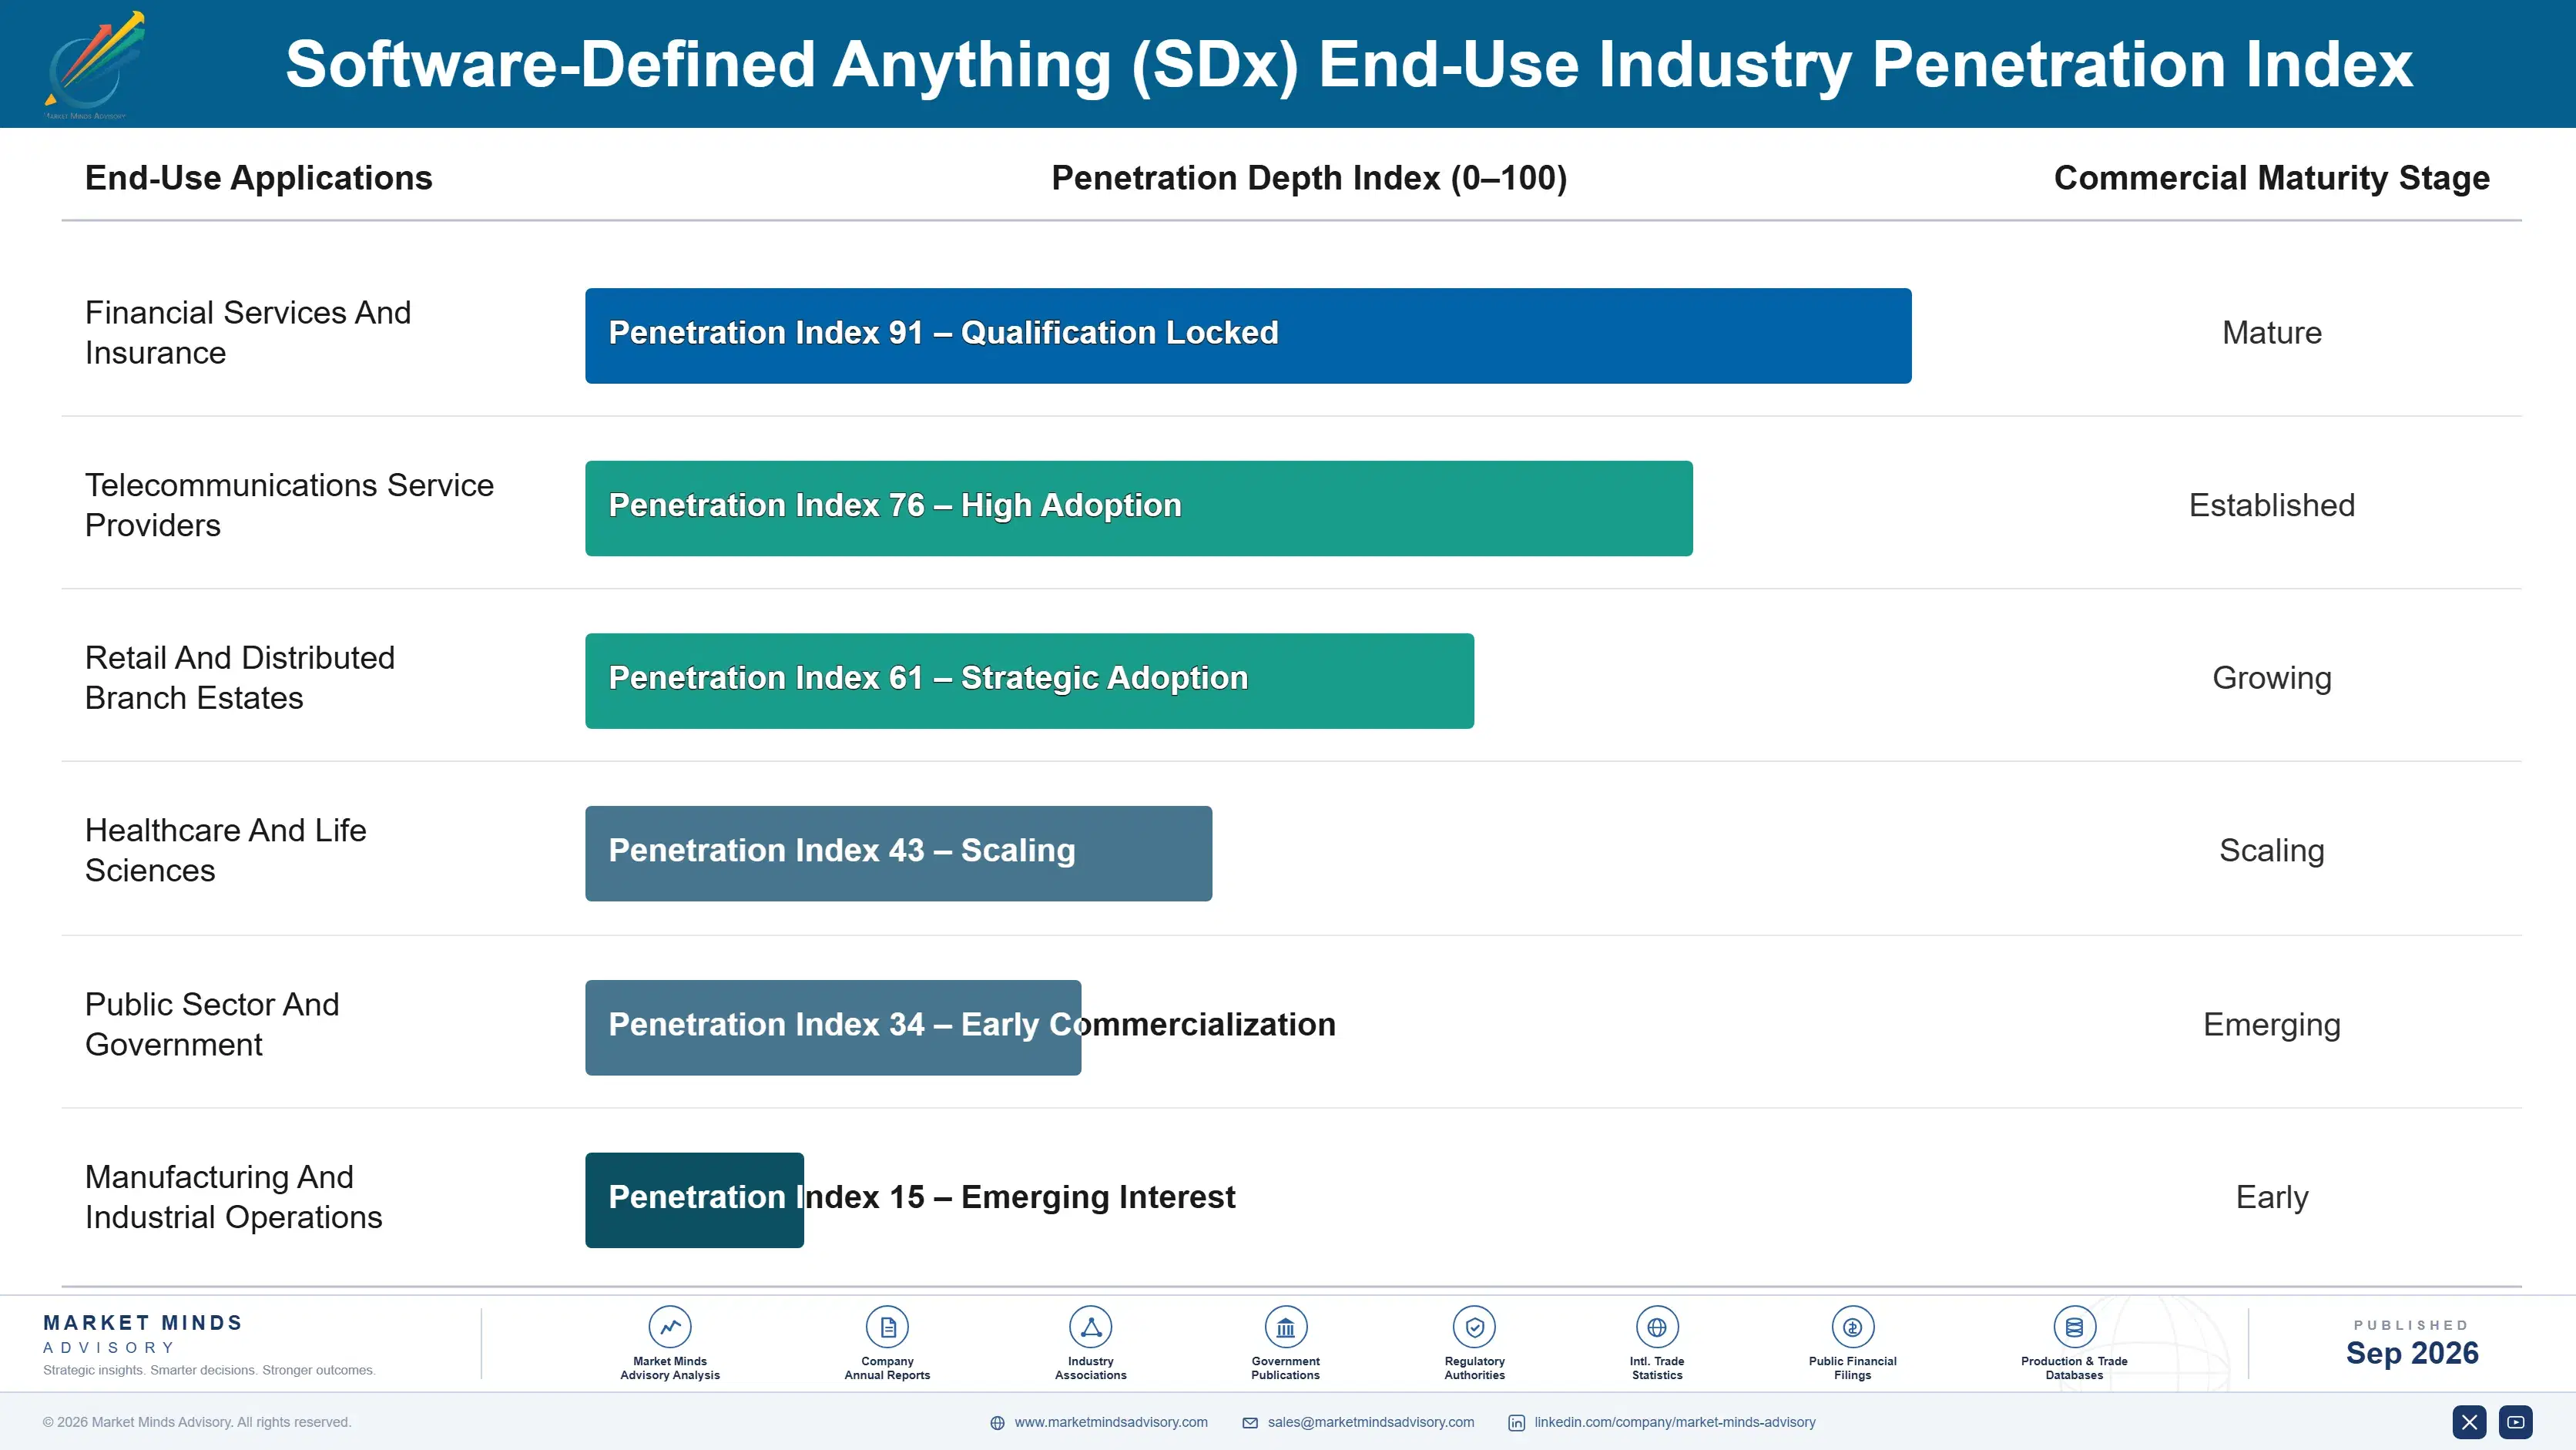
The annuity here used to be automatic and is not any more. A control plane sits underneath workloads an organisation would rather not disturb, which historically made renewal a formality nobody examined. Licensing changes broke that: roughly 46% of buyers now formally evaluate alternatives at each renewal. The switching work is still genuinely hard, so most evaluations do not convert, but concentration at 44% and falling shows enough of them do to matter.
Depth varies by how much operational capability the customer actually built. An organisation whose team runs the control plane confidently after the 14 month learning period has automation working and switching costs that are real. One still dependent on vendor assistance has neither, and only around 38% of deployments reach that automation at all. The stickiest customers are the ones the vendor invested in most.

The buyer has changed as much as the commercial terms. An infrastructure team evaluated technical capability against a workload roadmap. A finance function evaluates branch hardware displacement arithmetic that needs no translation. An audit function evaluates whether policy exists as versioned code at all. Vendors organised around the first buyer are selling to the constituency with least budget authority.
software-defined-anything-sdx-market-end-use-penetration-index-1789997588688

What Wins Infrastructure Deals

These are among the four positions where our research anticipates prominent divergence between winners and laggards over the coming forecast period. Each is grounded in the demand model, the regulatory perimeter, and the announced capacity pipeline.
01 / RETRAINING ATTACH DISCIPLINE

Price The Operating Model, Not The Licence

It takes roughly 14 months before a customer team runs a control plane confidently without vendor assistance, and only around 38% of deployments reach the automation their business case originally assumed. Vendors who price and deliver that retraining as part of the deal protect renewals they would otherwise lose on outcomes rather than on product. Those selling the licence alone are funding their own churn, and the customer will blame the software every time, and the renewal will be lost before anybody in the account admits what went wrong.
02 / RENEWAL TIMING COVERAGE

Engage On Their Calendar, Not Yours

Roughly 46% of buyers now formally evaluate alternatives at each licensing renewal, in a category where platform decisions had been treated as permanent and rarely reopened for examination at all. That window is short and it closes the moment a decision gets retaken by the customer. Vendors timing engagement to renewal calendars rather than to their own quarters reach buyers who are genuinely open rather than merely polite, and concentration at 44% and falling shows that movement is real rather than merely theoretical.
03 / DOMAIN ENTRY SEQUENCING

Lead With Branch, Follow With Everything

Wide area networking displaces around 61% of branch hardware and a finance department follows that arithmetic without needing any technical briefing at all, which is not true of data centre networking or storage. Leading with the domain that sells itself opens the account and the harder domains follow once operational capability exists. Vendors leading with data centre abstraction start with the argument requiring most explanation and delivering least saving, which is a difficult way to open any account at all.
04 / SUBSTITUTION FRAMING CONTROL

Raise Cloud Before The Buyer Does

Organisations weighing a control plane against public cloud increasingly decide the operational burden was never worth carrying, and the 14 month retraining period is precisely the burden they have in mind when they say it. Vendors raising data residency, latency and audit evidence first frame that comparison on ground they can actually hold. Those waiting are answering a question usually settled well above the technical evaluation already by people the technical evaluation team never speaks to directly at any point.

Engagement Snapshot From the Field

A live engagement with an industry participant carrying material or product regulatory and market exposure ahead of a defining policy shift, showing how our research translates into a defensible multi-year portfolio strategy.
MARKET MINDS ADVISORY · CLIENT ENGAGEMENT SUMMARY
Software-Defined Anything (SDx) Producer Strategic Portfolio Review and Transition Roadmap 2026·Investment Scenario on Software-Defined Anything (SDx) Exposure Evaluation 2025-26
CLIENT PROFILE
An infrastructure software vendor holding strong technical evaluations and losing renewals at a rate management could not explain, since win rates in competitive new business remained healthy throughout the same period. Leadership had approved discounting at renewal as a retention measure without establishing why customers who had chosen the product were declining to keep it.
STRATEGIC CHALLENGE
Sales attributed renewal losses to competitor pricing. Product attributed them to feature gaps against newer entrants. Nobody had asked departing customers what had actually happened during deployment, and the renewal cohort arriving over the following four quarters was substantially larger than the one that had just churned. Both explanations assumed the problem was competitive rather than internal.
MMA APPROACH
MMA interviewed lost and retained accounts to establish what differed between them, focusing on deployment outcomes rather than on product or price comparisons. We measured how far each account had reached toward its intended automation and how long teams had operated without vendor assistance. Work drew on 47 expert interviews conducted in Q4 2025 alongside the vendor's own account records.
KEY FINDINGS
  1. Around 71% of churned accounts had never reached the automation their business case assumed, against just 22% among the accounts that renewed.
  2. Deployment support hours, rather than price or feature coverage, separated retained accounts from churned ones across almost the entire sample that was examined.
  3. Discounting at renewal retained accounts for 1 further cycle and then lost them anyway at the following renewal (client-reported, unverified by MMA).
  4. Accounts reaching their intended automation within 12 months renewed at rates well above the portfolio average regardless of what competitors offered them.
CLIENT PROFILE
An infrastructure software vendor holding strong technical evaluations and losing renewals at a rate management could not explain, since win rates in competitive new business remained healthy throughout the same period. Leadership had approved discounting at renewal as a retention measure without establishing why customers who had chosen the product were declining to keep it.
STRATEGIC CHALLENGE
Sales attributed renewal losses to competitor pricing. Product attributed them to feature gaps against newer entrants. Nobody had asked departing customers what had actually happened during deployment, and the renewal cohort arriving over the following four quarters was substantially larger than the one that had just churned. Both explanations assumed the problem was competitive rather than internal.
MMA APPROACH
MMA interviewed lost and retained accounts to establish what differed between them, focusing on deployment outcomes rather than on product or price comparisons. We measured how far each account had reached toward its intended automation and how long teams had operated without vendor assistance. Work drew on 47 expert interviews conducted in Q4 2025 alongside the vendor's own account records.
KEY FINDINGS
  1. Around 71% of churned accounts had never reached the automation their business case assumed, against just 22% among the accounts that renewed.
  2. Deployment support hours, rather than price or feature coverage, separated retained accounts from churned ones across almost the entire sample that was examined.
  3. Discounting at renewal retained accounts for 1 further cycle and then lost them anyway at the following renewal (client-reported, unverified by MMA).
  4. Accounts reaching their intended automation within 12 months renewed at rates well above the portfolio average regardless of what competitors offered them.
RECOMMENDED STRATEGY
Phase 1: Phase one: stop discounting at renewal entirely, since it postpones churn by a single cycle without addressing why customers are leaving. Phase 2: Phase two: redirect that whole budget into deployment support hours during the first year, which is where the retention difference actually originates. Phase 3: Phase three: measure automation actually reached rather than deployment completed, and escalate any account falling behind well before renewal arrives.
OUTCOME
The vendor stopped renewal discounting and funded first-year deployment support instead (client-reported, unverified by MMA). Renewal rates improved materially once the first cohort passed through, and the escalation trigger caught several accounts early. Automation reached is now a tracked account metric, which is the change that outlasted the engagement itself.

Frequently Asked Questions

Foundational context covering the market sizes, CAGR, scope, country, region and competition that inform every finding below. This section is provided to cover basics and most often pre-purchase conversations, answered from the MMA Primary Research Dataset.

What is the current size of the Software-Defined Anything (SDx) Market?

Global value reaches USD 48.1 billion in 2026, measured as control plane licensing and support revenue. The 2025 base was USD 42.6 billion on the same basis.

How large will the Software-Defined Anything (SDx) Market be by 2036?

The market reaches USD 161.8 billion by 2036, an increase of USD 113.7 billion across the forecast period. That represents 3.36 times expansion from the 2026 base.

What is the CAGR for the Software-Defined Anything (SDx) Market 2026 to 2036?

The base case runs at 12.9% annually, with a bull case at 14.2% if skills supply improves as tooling matures and a bear case at 11.6% if public cloud substitution accelerates.

Which segment is growing fastest?

Software-defined wide area networking grows at 19.4%, half again the market rate of 12.9%. Branch hardware displacement is arithmetic that finance departments follow without any technical briefing.

Who are the major companies in the Software-Defined Anything (SDx) Market?

VMware, Cisco Systems, Nutanix, Hewlett Packard Enterprise and Red Hat lead on licensing and support revenue, holding 44%. Fortinet and Arista Networks hold smaller positions.

Which country is growing fastest?

India leads at 20.8%, on regulated sector deployment alongside service provider infrastructure build across a rapidly expanding base. Indonesia and Vietnam follow some way behind.

Report Segmentation Architecture

The full report scope spans multiple orthogonal segmentation dimensions, with cross-tabulated demand data provided for each dimension pair. Coverage extends further to regional breakdowns, trend trajectories, and the competitive detail needed to support segment-level decision-making.

By Control Plane Domain

  • Software-Defined Wide Area Networking
  • Software-Defined Security Policy Enforcement
  • Orchestration And Automation Layers
  • Software-Defined Data Centre Networking
  • Software-Defined Storage
  • Software-Defined Compute And Hypervisor Platforms

By End-Use Industry

  • Financial Services And Insurance
  • Telecommunications Service Providers
  • Retail And Distributed Branch Estates
  • Healthcare And Life Sciences
  • Public Sector And Government
  • Manufacturing And Industrial Operations

By Commercial Dimension

  • Direct Enterprise Licensing
  • Channel Partner Delivery
  • Service Provider Embedded Licensing
  • Subscription And Consumption Pricing
  • Perpetual Licence With Support
  • Original Equipment Manufacturer Bundling

By Region

  • North America
  • Western Europe
  • East Asia
  • South Asia and Pacific
  • Latin America
  • Middle East and Africa
  • Eastern Europe

Scope, Methodology, and Coverage

Every figure in this report is reproducible from documented input assumptions. The scope below maps the historical period, the forecast horizon, the segmentation dimensions, and the countries covered, alongside the underlying primary and qualitative methodology.
Historical Period
2020 to 2025
Forecast Period
2026 to 2036
Base Year
2025 (USD billions; MMA Primary Research Dataset, September 2026)
Market Definition
This report covers software-defined infrastructure control planes and their associated licensing and support: wide area networking, data centre networking, storage, compute and hypervisor platforms, security policy enforcement, and orchestration and automation layers. It excludes underlying server, storage and network hardware, public cloud infrastructure services, application software, and managed service delivery contracts.
Quantitative Units
USD millions, control plane licensing and support revenue basis; deployed control plane instances; operator retraining periods in months; automation attainment as a percentage of deployments; branch hardware displacement rates; services share of customer spending.
Segmentation Dimensions
Control plane domain; end-use industry; commercial licensing route; geography across seven regions.
Regions Covered
North America, Western Europe, East Asia, South Asia and Pacific, Latin America, Middle East and Africa, Eastern Europe
Countries Covered
United States, Canada, United Kingdom, Germany, France, Netherlands, Spain, Italy, Poland, Czechia, China, Japan, South Korea, India, Australia, Indonesia, Brazil, Mexico, Saudi Arabia, South Africa.
Key Companies Profiled
VMware, Cisco Systems, Nutanix, Hewlett Packard Enterprise, Red Hat, Fortinet, Juniper Networks, Arista Networks, Palo Alto Networks, Dell Technologies, IBM, Huawei Technologies, Versa Networks, SUSE, NetApp.
Quantitative Methodology
Primary survey, n=3,800 respondents, Q4 2025, six countries; demand-side model with trade association cross-validation
Qualitative Methodology
47 expert interviews, Q4 2025; applied to validate demand model assumptions, identify emerging dynamics, and assess competitive positioning
Report Format
PDF and XLSX data workbook (Word format preview document)
Publisher
Market Minds Advisory
Report Code
MMA-2026-TEC-911
Published
September 2026
Contact
sales@marketmindsadvisory.com | www.marketmindsadvisory.com

Purchase the full Software-Defined Anything (SDx) Market Report (2026 to 2036).

This report sizes the global software-defined anything market from 2026 to 2036 across six control plane domains, six industries and seven regions. It explains why abstraction moved complexity from hardware configuration into software operation rather than removing it, leaving only around 38% of deployments reaching intended automation. Licensing upheaval reopening decisions buyers had treated as permanent is analysed as the main source of competitive movement. Branch hardware displacement at around 61% is examined as the only economics finance follows unaided. Regional analysis explains why East Asia holds 29% of spending.
Six control plane domains sized through to 2036
Operator retraining periods quantified as a deployment constraint
Renewal reassessment behaviour analysed across enterprise buyers
Twenty named vendors assessed on licensing revenue
Four revenue levers with quantified commercial impact
Anonymised vendor renewal retention engagement documented in full

Built For The People Who Decide

From boardroom strategy to bench-side execution, this report is read cover-to-cover by leaders shaping the next decade of their industry, turning demand scenarios, market dynamics and valuation benchmarks into decisions.
CXOs/ Presidents/ VPs/ Managers
M&A and Corporate Development
Strategy Teams and R&D Heads
Procurement and Product Directors
Regulatory and Compliance Leaders
Investor Relations and Equity Analysts