Market Minds Advisory
Sodium Silicate Market

Sodium Silicate Market: Downstream silica integration, furnace energy and delivery radius economics

Sold as a bulk solution at commodity prices, sodium silicate is also the feedstock behind tyre silica and zeolite catalysts, which is where nearly all of the value in this chain actually ends up sitting.

Lead Analyst

Bilal Shaikh

Published

September 2026

Make Smarter Decisions with Customized Research Insights

Request a free sample report and evaluate market opportunities, growth trends, and competitive dynamics relevant to your business needs.

2025 MARKET VALUE$8.4BMarket Size 2025
2036 FORECAST VALUE$13.8BBase Case , 2026 to 2036
CAGR 2026 TO 20364.6 %Bull 5.8% / Bear 3.3%
INCREMENTAL OPPORTUNITY$5.0BNet 10- year value creation
EXPANSION MULTIPLE1.57x2036 value over 2026 base
Strategic Levers
M&A Pipeline
Regional Outlook
Country Rankings
Competitive Intelligence
Segmental Deep-dive
Call-Us : 91 93563 13602

Executive Snapshot and Market Trajectory

Most producers here sell a bulk solution and watch somebody downstream capture the value it creates. Sodium silicate is the feedstock for precipitated silica in tyres and for zeolite catalysts, and both of those downstream businesses earn several multiples of what the silicate itself realises per tonne delivered into them.
Growth concentrates in powder and spray-dried grades, expanding at 6.9%, where removing the water solves the freight problem capping every liquid producer's addressable radius and opens detergent, construction and export applications that solution supply simply cannot reach economically. East Asia holds 31% of value, the largest regional share, because Chinese detergent manufacture, tyre silica production and catalyst plants all consume silicate at a scale nobody else matches.
The supplier base is extremely fragmented for a chemical business of this size, with the top five holding just 24% of production capacity, and it divides between integrated specialty houses, regional furnace operators and captive producers feeding their own silica plants. Competition runs on delivered cost inside a radius rather than on chemistry. Furnace energy is the input position separating those able to price aggressively from those who simply cannot do so.
Market Definition
Sodium silicate comprises alkali silicate solutions and solids produced by furnace fusion or hydrothermal digestion, spanning low, neutral and high modulus liquid grades, solid cullet and lump silicate, powder and spray-dried grades, and specialty low-iron and high-purity classes. Sizing covers silicate sold or transferred to industrial users and formulators at realised delivered price. Potassium and lithium silicates, precipitated silica and silica gel produced downstream, zeolite catalysts and molecular sieves, colloidal silica sols, and silicate-containing formulated products all fall outside scope.
Base Year Value
$8.4B in 2025 (MMA Primary Research Dataset, August 2026)
Forecast Period
2026 to 2036, eleven discrete annual values
CAGR
4.6% base case. Bull 5.8%. Bear 3.3%.
Fastest Growth Segment
Sodium Silicate Powder and Spray-Dried Grades: 6.9% CAGR
Fastest Growth Country
India: 7.4% CAGR
Fastest Growth Region
South Asia and Pacific: 6.9% CAGR
Largest Region
East Asia: 31% of 2025 global value
Market Leaders
Ecovyst, Occidental Chemical, CIECH Group, Silmaco and Nippon Chemical Industrial lead on sodium silicate production capacity across liquid and solid grades. Source: MMA Primary Research Dataset, July 2026.
Primary Survey
n=3,800 procurement and R&D decision-makers, Q4 2025, six countries
Methodology
Demand-side build-up, cross-validated against public data, 47 expert interviews

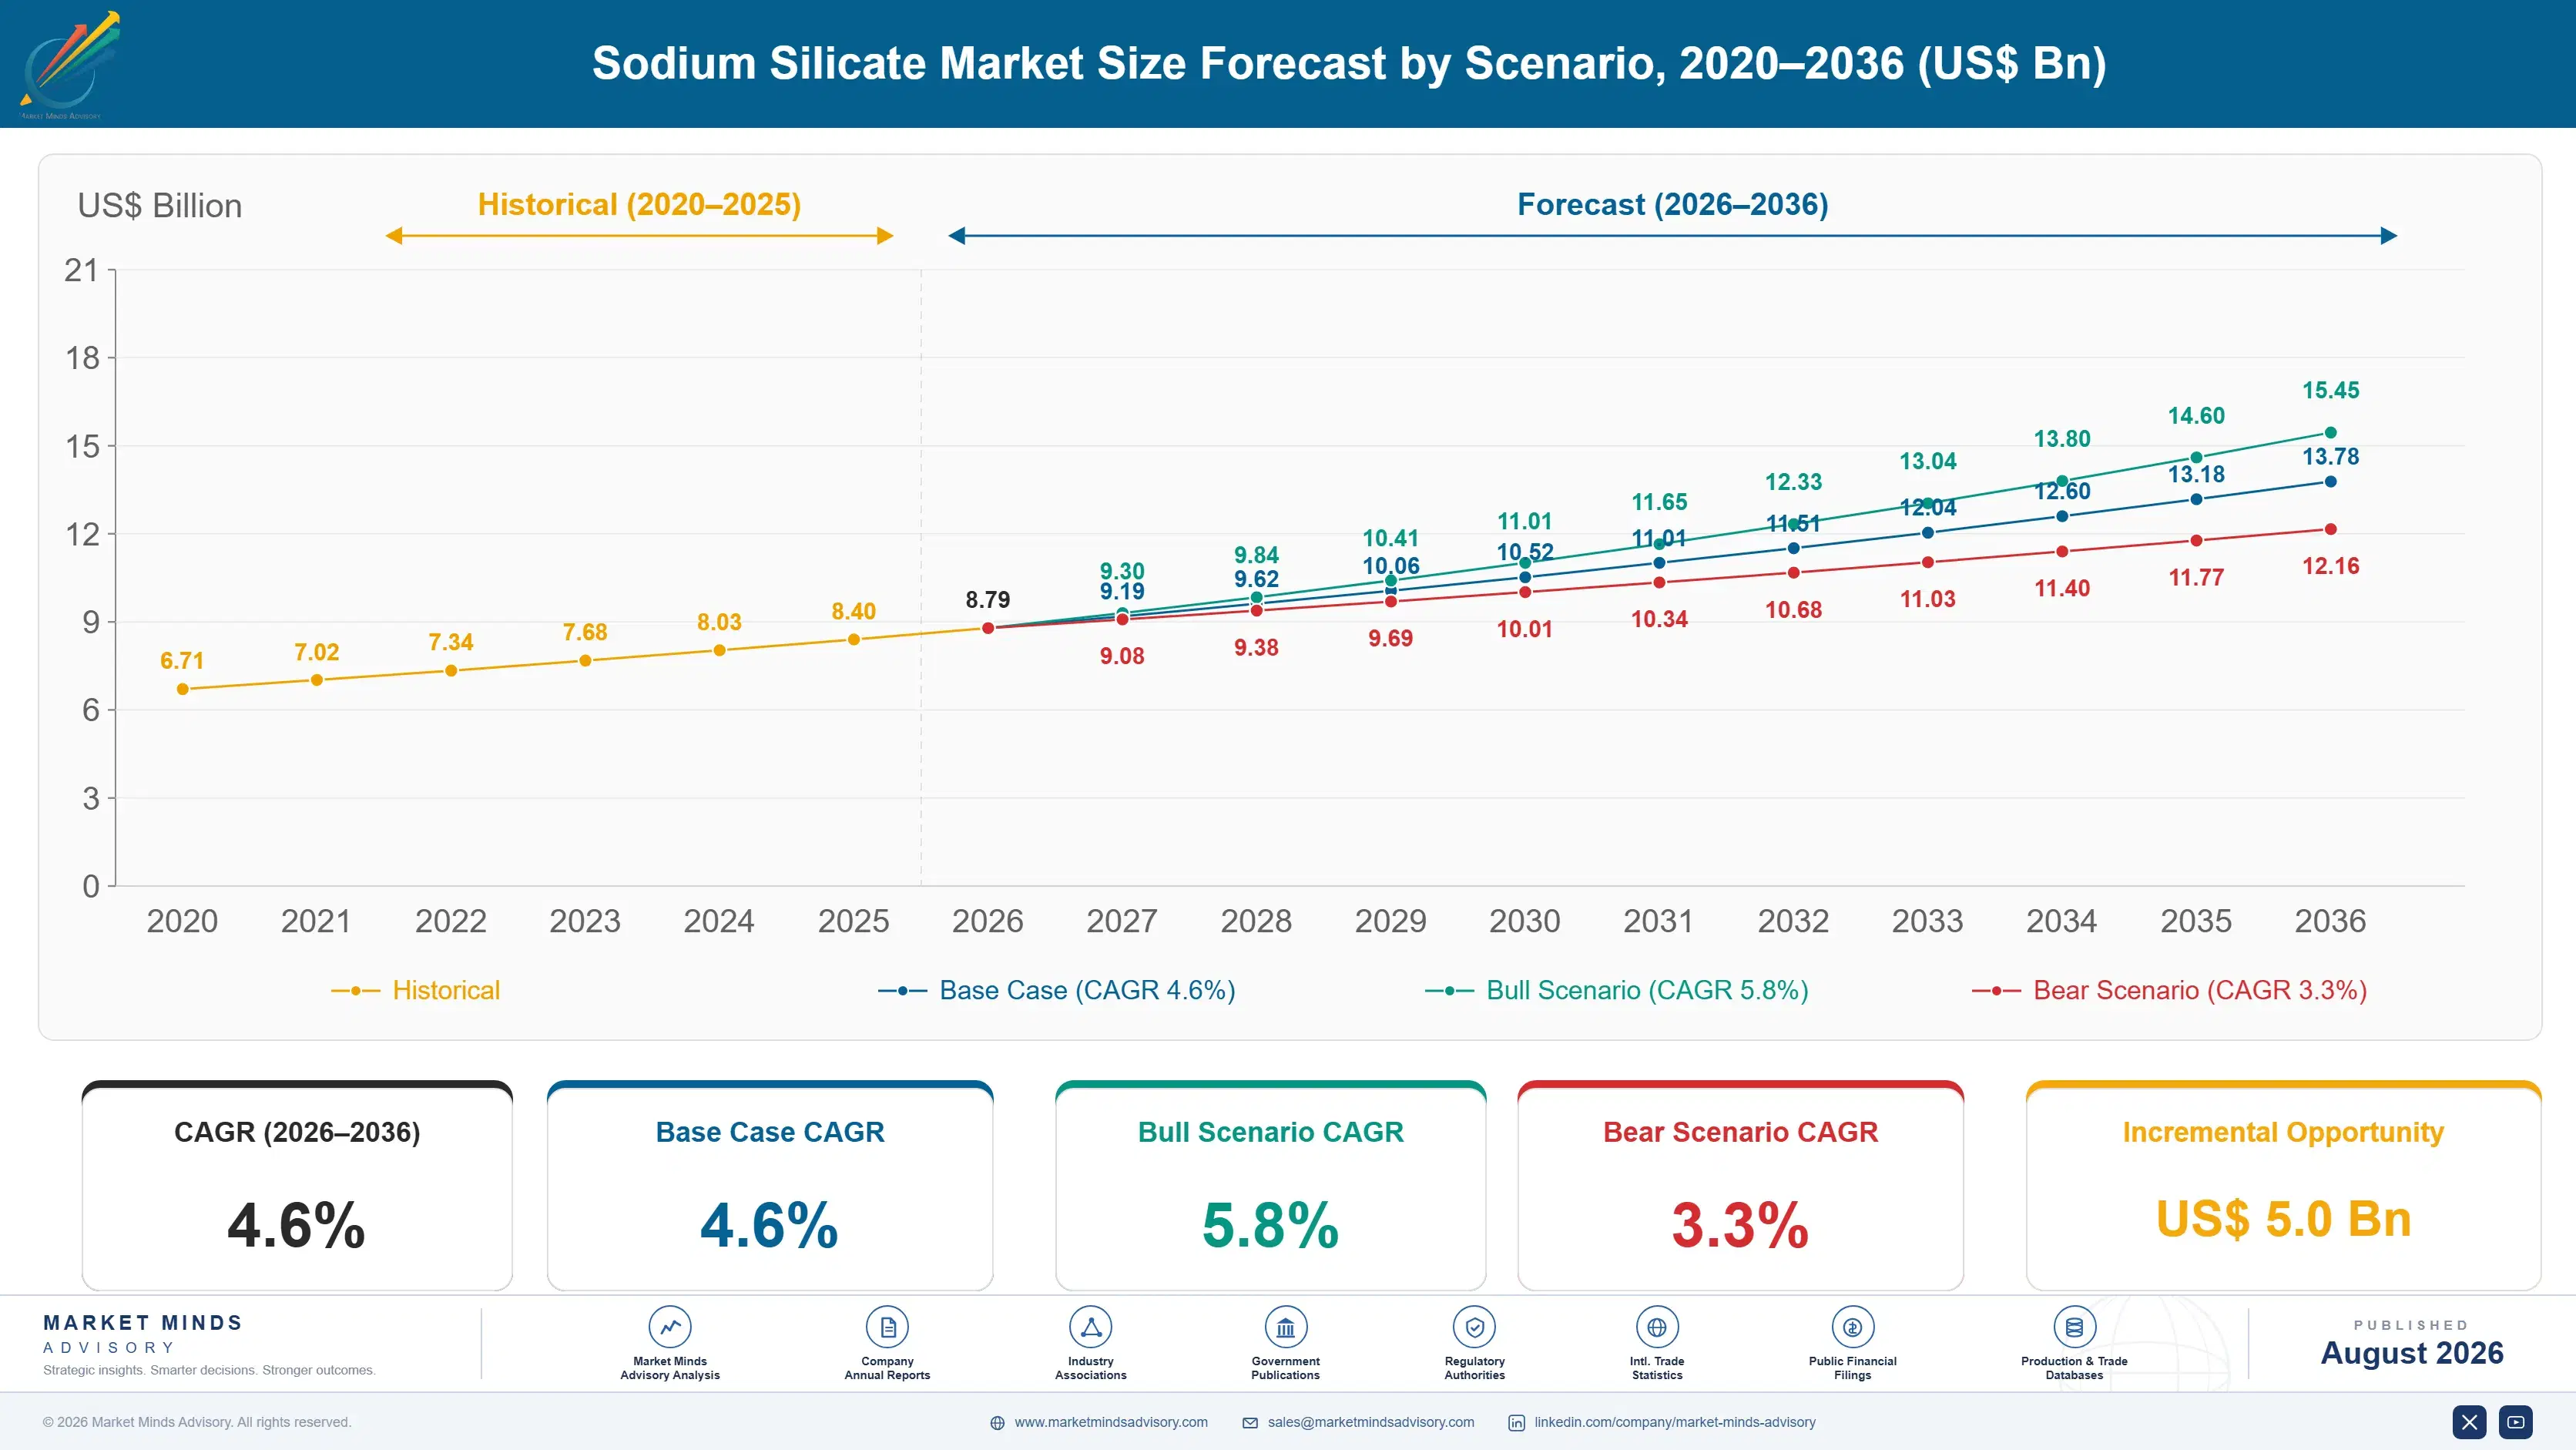
Sodium Silicate Market Forecast Scenarios

sodium-silicate-market-trends-size-forecast-scenario-1787311162387
Growth of 3.4% across 2020 to 2025 was held back at both ends by inputs rather than by demand. Detergent and construction consumption held through 2020 and recovered normally afterwards, while soda ash pricing moved sharply and European furnace energy costs through 2022 reached levels that made silicate production briefly uneconomic. Several European furnaces curtailed or closed, which tightened regional supply without any change in underlying consumption.
The base case at 4.6% rests on three mechanisms. Precipitated silica demand keeps rising with silica-reinforced tyre production, since rolling resistance regulation and electric vehicle range requirements both favour silica over carbon black in modern tread compounds. Zeolite catalyst manufacture keeps expanding with refining, petrochemical and detergent builder demand across Asia. And powder grades keep taking applications that liquid supply cannot reach, because removing water removes the freight constraint entirely.
The bull case at 5.8% turns on silica tyre adoption accelerating faster than currently modelled, since every point of tread compound conversion pulls silicate demand through a supply chain that is already regionally tight. The bear case at 3.3% turns on detergent reformulation. Continued substitution of silicate builders by polycarboxylates and enzymes would remove volume from the largest single application here.

Sodium silicate: commodity solution feeding specialty chains

This market has an awkward relationship with the value it creates. Sodium silicate is a bulk solution priced accordingly, and it is also the essential feedstock for precipitated silica going into tyre tread and for the zeolite catalysts that refineries and detergent makers consume. Those downstream businesses earn several times what silicate itself realises per tonne, and most silicate producers never participate in any of that value.
TOP FIVE CONCENTRATION24%Share of global silicate production capacity held collectively
RAW MATERIAL COST SHARE43% of COGSPortion of delivered cost from soda ash and sand
FURNACE ENERGY SHARE26% of COGSPortion of cost consumed melting glass in the furnace
DETERGENT APPLICATION SHARE27% of volumeLargest single application by consumed silicate tonnage globally
ECONOMIC DELIVERY RADIUS350 kmDistance beyond which shipping aqueous solution stops working
SOLUTION WATER CONTENT62%Portion of a delivered tanker load that is water
Cost structure sits squarely in raw material and in the furnace itself. Soda ash and silica sand together carry roughly 43% of the delivered cost, and furnace energy adds a further 26% on top of that, which makes this an energy-intensive commodity whose regional competitiveness moves with gas pricing rather than with anything a plant manager actually controls. Both inputs price on their own logic.
Freight then compounds the problem considerably. Liquid silicate is 62% water by weight and stops travelling economically beyond roughly 350 kilometres, which is why the top five hold under a quarter of global capacity and why regional furnace operators survive perfectly comfortably against much larger competitors sitting two countries away. Geography does most of the competitive work here.
"Silicate producers describe themselves as commodity chemical companies and then wonder why the returns look like commodity chemical returns. The ones earning properly either sit inside a tyre silica chain or have worked out how to sell something other than water in a tanker."
Director, Inorganic and Specialty Chemicals Practice · MMA Chemicals and Materia

Market Trends

Silica tyre reinforcement pulling silicate demand through the chain

Precipitated silica has been displacing carbon black in tyre tread compounds because it delivers lower rolling resistance at equivalent wet grip, which matters more as fuel economy regulation tightens and as electric vehicle range becomes a competitive specification. Every tonne of precipitated silica consumes several tonnes of sodium silicate, which pulls demand through a chain most silicate producers never see directly. Silica producers integrate backward where they can, since silicate freight economics make captive supply considerably cheaper. Merchant silicate producers near a silica plant hold a genuinely valuable position and often have not priced it that way.
Market Impact: Consumes 27% of global silicate vol
Powder grades removing the freight constraint on liquid supply

Liquid silicate is 62% water and stops travelling economically beyond roughly 350 kilometres, which caps every producer's addressable market at a circle drawn around the furnace. Spray-dried powder and solid grades remove that water and therefore that constraint, reaching detergent formulators, construction applications and export markets that solution supply cannot serve at any price. Drying costs energy and capital, so the economics only work where the freight saved exceeds the water removed. Producers who have made that calculation properly are growing well ahead of the market while liquid-only competitors defend shrinking territories.
Market Impact: Grows 7.4% annually across India

Market Opportunities and Growth Drivers

Detergent and cleaning formulation sustaining the largest volume application

Sodium silicate serves as a builder, alkalinity source and corrosion inhibitor in laundry powders, automatic dishwashing formulations and industrial cleaning products, and it protects aluminium and glazed surfaces in ways that alternatives do not match cheaply. Detergent applications account for 27% of global silicate volume, more than any other single use. Powder detergent formulation across South Asia, Southeast Asia and Africa keeps growing with formal retail and washing machine penetration, while developed market liquid formulations use considerably less silicate per wash. That divergence makes the growth genuinely regional rather than global.
Market Impact: Carries 26% of delivered silicate c

Zeolite catalyst manufacture expanding with refining and petrochemical capacity

Zeolite catalysts for fluid catalytic cracking, hydrocracking and petrochemical processes are synthesised from sodium silicate and aluminate, and catalyst manufacture has followed refining capacity toward Asia and the Gulf over the past two decades. Detergent builder zeolite consumes substantial further volume in regions where phosphate replacement drove that formulation route. Catalyst producers site plants near silicate supply for the same freight reasons everybody else does, which creates regional demand concentrations. Indian catalyst and silicate demand grows at 7.4% annually as refining and petrochemical capacity keeps commissioning right across the country.
Market Impact: Removes 27% application share gradu

Market Restraints and Challenges

Furnace energy intensity exposing producers to regional gas pricing

Melting soda ash and sand into silicate glass consumes substantial energy, accounting for roughly 26% of delivered cost, and no process improvement has meaningfully changed that because the fusion temperature is set by chemistry. The root cause is thermodynamic rather than industrial, which is why decades of furnace development have trimmed rather than transformed the figure. Commercially this makes regional gas pricing a first-order competitive variable that operating discipline cannot overcome. Producers are responding with hydrothermal digestion routes that avoid fusion entirely, waste heat recovery, oxy-fuel firing and electric boosting on existing furnaces.
Market Impact: Consumes 3 tonnes silicate per tonn

Detergent reformulation steadily reducing silicate content per wash

Liquid detergent formulations use considerably less sodium silicate than powders do, and developed markets have shifted decisively toward liquids and compact unit doses over two decades. The root cause is consumer preference and machine design rather than any silicate performance issue, which means no reformulation work recovers the volume. Commercially this erodes the largest single application in developed markets while emerging market powder demand grows. Producers are responding by following powder detergent growth into South Asia and Africa, and by developing silicate positions in construction, catalyst and water treatment applications instead.
Market Impact: Grows 6.9% annually through 2036
3 additional market trends, 2 additional growth drivers, and 4 additional restraints and challenges are covered in the full report. Contact sales@marketmindsadvisory.com to access the complete intelligence.

Segment CAGR and Growth Architecture

Segmentation follows product form and modulus, the ratio of silica to soda that governs solubility, gel behaviour, alkalinity and therefore which application a grade can serve at all. Six classes cover the whole market, running from low modulus liquid through neutral and high modulus solutions to solid cullet, spray-dried powder and specialty low-iron grades.
sodium-silicate-market-trends-market-share-analysis-1787311162930

Sodium Silicate Powder and Spray-Dried Grades

Expanding at 6.9% annually, a full 1.50 times the market rate, because removing the water removes the freight constraint that caps every liquid producer's addressable radius at roughly 350 kilometres. Detergent formulators buying powder can source from anywhere at all, construction and soil stabilisation applications need a dry product, and export markets become genuinely reachable for the first time. Drying costs both energy and capital, so the economics only work where the freight saved genuinely exceeds the cost of removing that water first. Producers who have run that calculation properly are growing well ahead of the market, while liquid-only competitors defend a steadily shrinking territory drawn around their own furnace.
CAGR 6.9%

Specialty and Low-Iron Grades

Growing at 6.2% annually on grades where the iron, aluminium and heavy metal content are all held far below ordinary industrial specification, because the downstream silica or catalyst product carries every impurity through into its own performance. Precipitated silica for tyre tread, silica gel for chromatography and zeolite catalysts for refining all specify a silicate purity that standard furnace production simply cannot deliver reliably. Sand selection and furnace practice together govern achievable purity rather than any post-treatment step at all. Realised pricing runs well above technical grade and the qualified supplier field stays genuinely narrow, since a single sand source can determine whether a plant qualifies for the specification at all.
CAGR 6.2%
Full segment breakdown across 6 segments available in the complete report.

Regional Architecture and Country Demand Map

Sodium silicate plants have to sit inside a delivery radius of roughly 350 kilometres from each of the customers they serve, so the geographic picture simply reflects where detergent, silica, catalyst and construction demand happen to cluster rather than any pattern of international trade at all.

East Asia

Thirty-one percent of global value here, comfortably the largest regional share, because Chinese detergent manufacture, precipitated silica production for tyres and zeolite catalyst plants together consume silicate at a scale that no other region comes close to approaching at present. Note: this exceeds the standard regional band because silicate consumption here follows detergent and tyre silica manufacture, both of which are concentrated in China to a degree no general chemical measure would capture. Japanese and Korean producers hold specialty and low-iron grade positions serving genuinely demanding catalyst and electronics customers across the region. Growth of 5.5% runs above the global rate, supported by silica tyre adoption and by catalyst manufacture expanding together.
Share: 31% | CAGR: 5.5% (2026 to 2036)

North America

Twenty-two percent of global value here, weighted heavily toward detergent and cleaning formulation, precipitated silica production, catalyst manufacture, and a substantial construction and soil stabilisation position alongside them. Advantaged natural gas gives furnace operators here a delivered cost position that European competitors simply cannot approach, which matters a great deal in a business where melting energy alone carries fully a quarter of the delivered cost. Ecovyst and Occidental between them hold the largest domestic positions, operating multiple plants placed carefully inside a number of separate regional freight radii. Growth of 4.0% here reflects a mature detergent demand base alongside silica and catalyst applications that keep expanding steadily with each passing year.
Share: 22% | CAGR: 4.0% (2026 to 2036)
Regional intelligence for 5 additional markets available in the complete report: Western Europe, South Asia and Pacific, Latin America, Middle East and Africa, Eastern Europe. Contact sales@marketmindsadvisory.com.
sodium-silicate-market-trends-country-cagr-analysis-1787311163468

Where sodium silicate margin genuinely sits

Four commercial positions separate producers earning specialty economics from those hauling water around a circle drawn on a map. Each one of them rests on something that furnace capacity alone cannot deliver: purity nobody else reaches, a position inside a downstream silica chain, a melting route avoiding gas exposure, or else plant geography that competitors cannot replicate.

Sell modulus and purity rather than tonnes of solution

Most silicate is sold on solids content and delivered price, which puts a producer alongside every other furnace inside the freight radius and nothing else. Producers holding tight modulus control and low iron, aluminium and heavy metal specification realise roughly 28% above technical grade pricing, because the downstream silica or catalyst product carries every impurity straight through into its own performance. Achieving it depends on sand selection and furnace practice rather than any post-treatment. Most producers never test their own product against downstream performance and consequently cannot sell against it.
Market Impact: Realises roughly 28% above technica

Take a position inside the downstream silica chain

Precipitated silica for tyre tread consumes roughly three tonnes of sodium silicate per tonne produced, and the silica business earns several times what the silicate does per tonne delivered into it. Producers integrating forward into precipitated silica, or contracting long-term into a silica plant inside their freight radius, capture roughly 2 times the value per tonne of silicate they would otherwise realise. The capital for a silica plant is meaningful but the contract position costs nothing. Most silicate producers watch that value leave their gate every day without ever negotiating for a share of it.
Market Impact: Captures roughly 2 times the value

Move melting away from gas-fired furnace fusion

Furnace energy carries roughly 26% of delivered cost and the gap between advantaged and European gas pricing has exceeded the entire conversion margin on silicate. Producers running hydrothermal digestion, oxy-fuel firing or electrically boosted furnaces hold roughly 24% lower delivered cost than conventional gas-fired fusion competitors, and that gap decides who keeps operating through an energy spike. Hydrothermal digestion routes avoid the fusion step entirely for suitable product grades. Several European furnaces closed permanently in 2022 rather than idling, which is what an unmanaged energy exposure looks like in practice.
Market Impact: Holds roughly 24% lower delivered s

Occupy the delivery radius before a competitor does

Liquid silicate is 62% water and stops travelling economically beyond roughly 350 kilometres, which makes plant location the most consequential decision available and one nobody revisits afterwards. Producers established inside a detergent, silica or catalyst cluster hold roughly 20% delivered cost advantage over anybody shipping from outside it, whatever their relative furnace efficiency happens to be. Greenfield capacity inside a growing cluster is worth considerably more than incremental capacity in a mature one. Several producers have kept expanding capacity where demand is flat while conceding faster growing clusters entirely to others.
Market Impact: Holds roughly 20% delivered cost ad

Who Controls the Margin Pool

Concentration is remarkably low, with the top five holding just 24% of global sodium silicate production capacity, the basis on which every participant here is assessed. Ecovyst and Occidental lead through multiple plants positioned inside separate freight radii rather than through any technology advantage, while the remaining field spans European specialty houses, Asian volume producers, captive furnaces feeding silica and catalyst plants, and a long tail of regional operators.
Competition currently runs on delivered cost inside a radius, furnace energy position and grade purity rather than on chemistry, which is entirely settled. Regional operators compete successfully against far larger producers on freight alone, provided their energy position holds. Purity capability has become a genuine differentiator as downstream silica and catalyst customers have tightened specifications.

Emerging pressure comes from two directions at once. Downstream silica and catalyst producers keep integrating backward into captive silicate supply, which removes merchant volume permanently from regions where it happens. And powder capability is redrawing the competitive map, since a producer who can ship dry competes across radii that liquid supply never reached and takes volume from operators who assumed geography protected them.
sodium-silicate-market-trends-company-positioning-matrix-1787311163998

Competitive Moat and Risk Dimensions

ECOVYST

Moat: Plant network and downstream position

Multiple silicate plants placed inside separate customer clusters give Ecovyst delivered cost positions that cannot be replicated without building comparable capacity, and its catalyst and specialty silica businesses capture value downstream that most silicate producers watch leave the gate. That combination of geography and forward position is the most defensible arrangement available in this market.
ECOVYST

Risk: Detergent volume erosion exposure

Detergent applications carry the largest single share of silicate volume and are eroding steadily in developed markets as liquid and unit dose formulations displace powders, which no reformulation work recovers. Plants sited around detergent formulators face a demand base declining in their own radius while the growth happens in emerging markets they cannot reach economically.
OCCIDENTAL CHEMICAL

Moat: Advantaged energy and integration

Access to advantaged North American natural gas alongside integrated chlor-alkali and soda ash positions gives Occidental a delivered cost structure European competitors cannot approach, in a business where melting energy and soda ash together carry the majority of cost. Neither advantage can be engineered around by a competitor sitting on different energy geography.
OCCIDENTAL CHEMICAL

Risk: Limited specialty grade position

A position weighted toward bulk industrial grades leaves the company exposed as growth concentrates in low-iron specialty material and in powder grades that travel beyond the freight radius. Both require capability rather than capacity, and building purity and drying positions demands investment quite different from the scale and energy advantages the business currently rests upon.

Players Tracked

Prominent Players

Ecovyst
Occidental Chemical
CIECH Group
Silmaco
Nippon Chemical Industrial

Other Key Players

Tokuyama
Evonik
W. R. Grace
National Silicates
IQE Group
Qingdao Haiwan Group
Zhejiang Kanghexin Chemical
Shandong Xindadi Industrial
Captain Industries
Kiran Global Chem
Sinchem Silica Gel
C&C Silicates
Silicatos y Derivados
Amtrade International
BASF

Recent Developments

JANUARY 2025

Tyre silica producer integrates backward into silicate supply

A precipitated silica producer commissioned its own captive sodium silicate capacity alongside an existing tyre reinforcement silica plant, removing merchant purchase entirely thereby capturing a margin it had previously paid away on roughly three tonnes of silicate consumed for every tonne of silica actually produced.
Signal: Backward integration is now permanently re
MAY 2025

Producer commissions powder capacity to escape freight limits

A silicate producer commissioned new spray-drying capacity aimed squarely at detergent formulators and construction customers sitting well beyond its existing liquid delivery radius, on the basis that the freight saved on the removed water comfortably exceeded the energy cost of drying that water out beforehand.
Signal: Powder capability is now redrawing the com
SEPTEMBER 2025

European furnace closure follows sustained energy cost divergence

A European silicate producer permanently closed furnace capacity at one of its European sites, citing gas costs that no longer supported continued operation against imported solid grades and regionally advantaged supply, and confirming that the capacity would not restart even if energy prices subsequently eased.
Signal: Furnace energy geography is now permanentl

Soda ash, sand and furnace energy

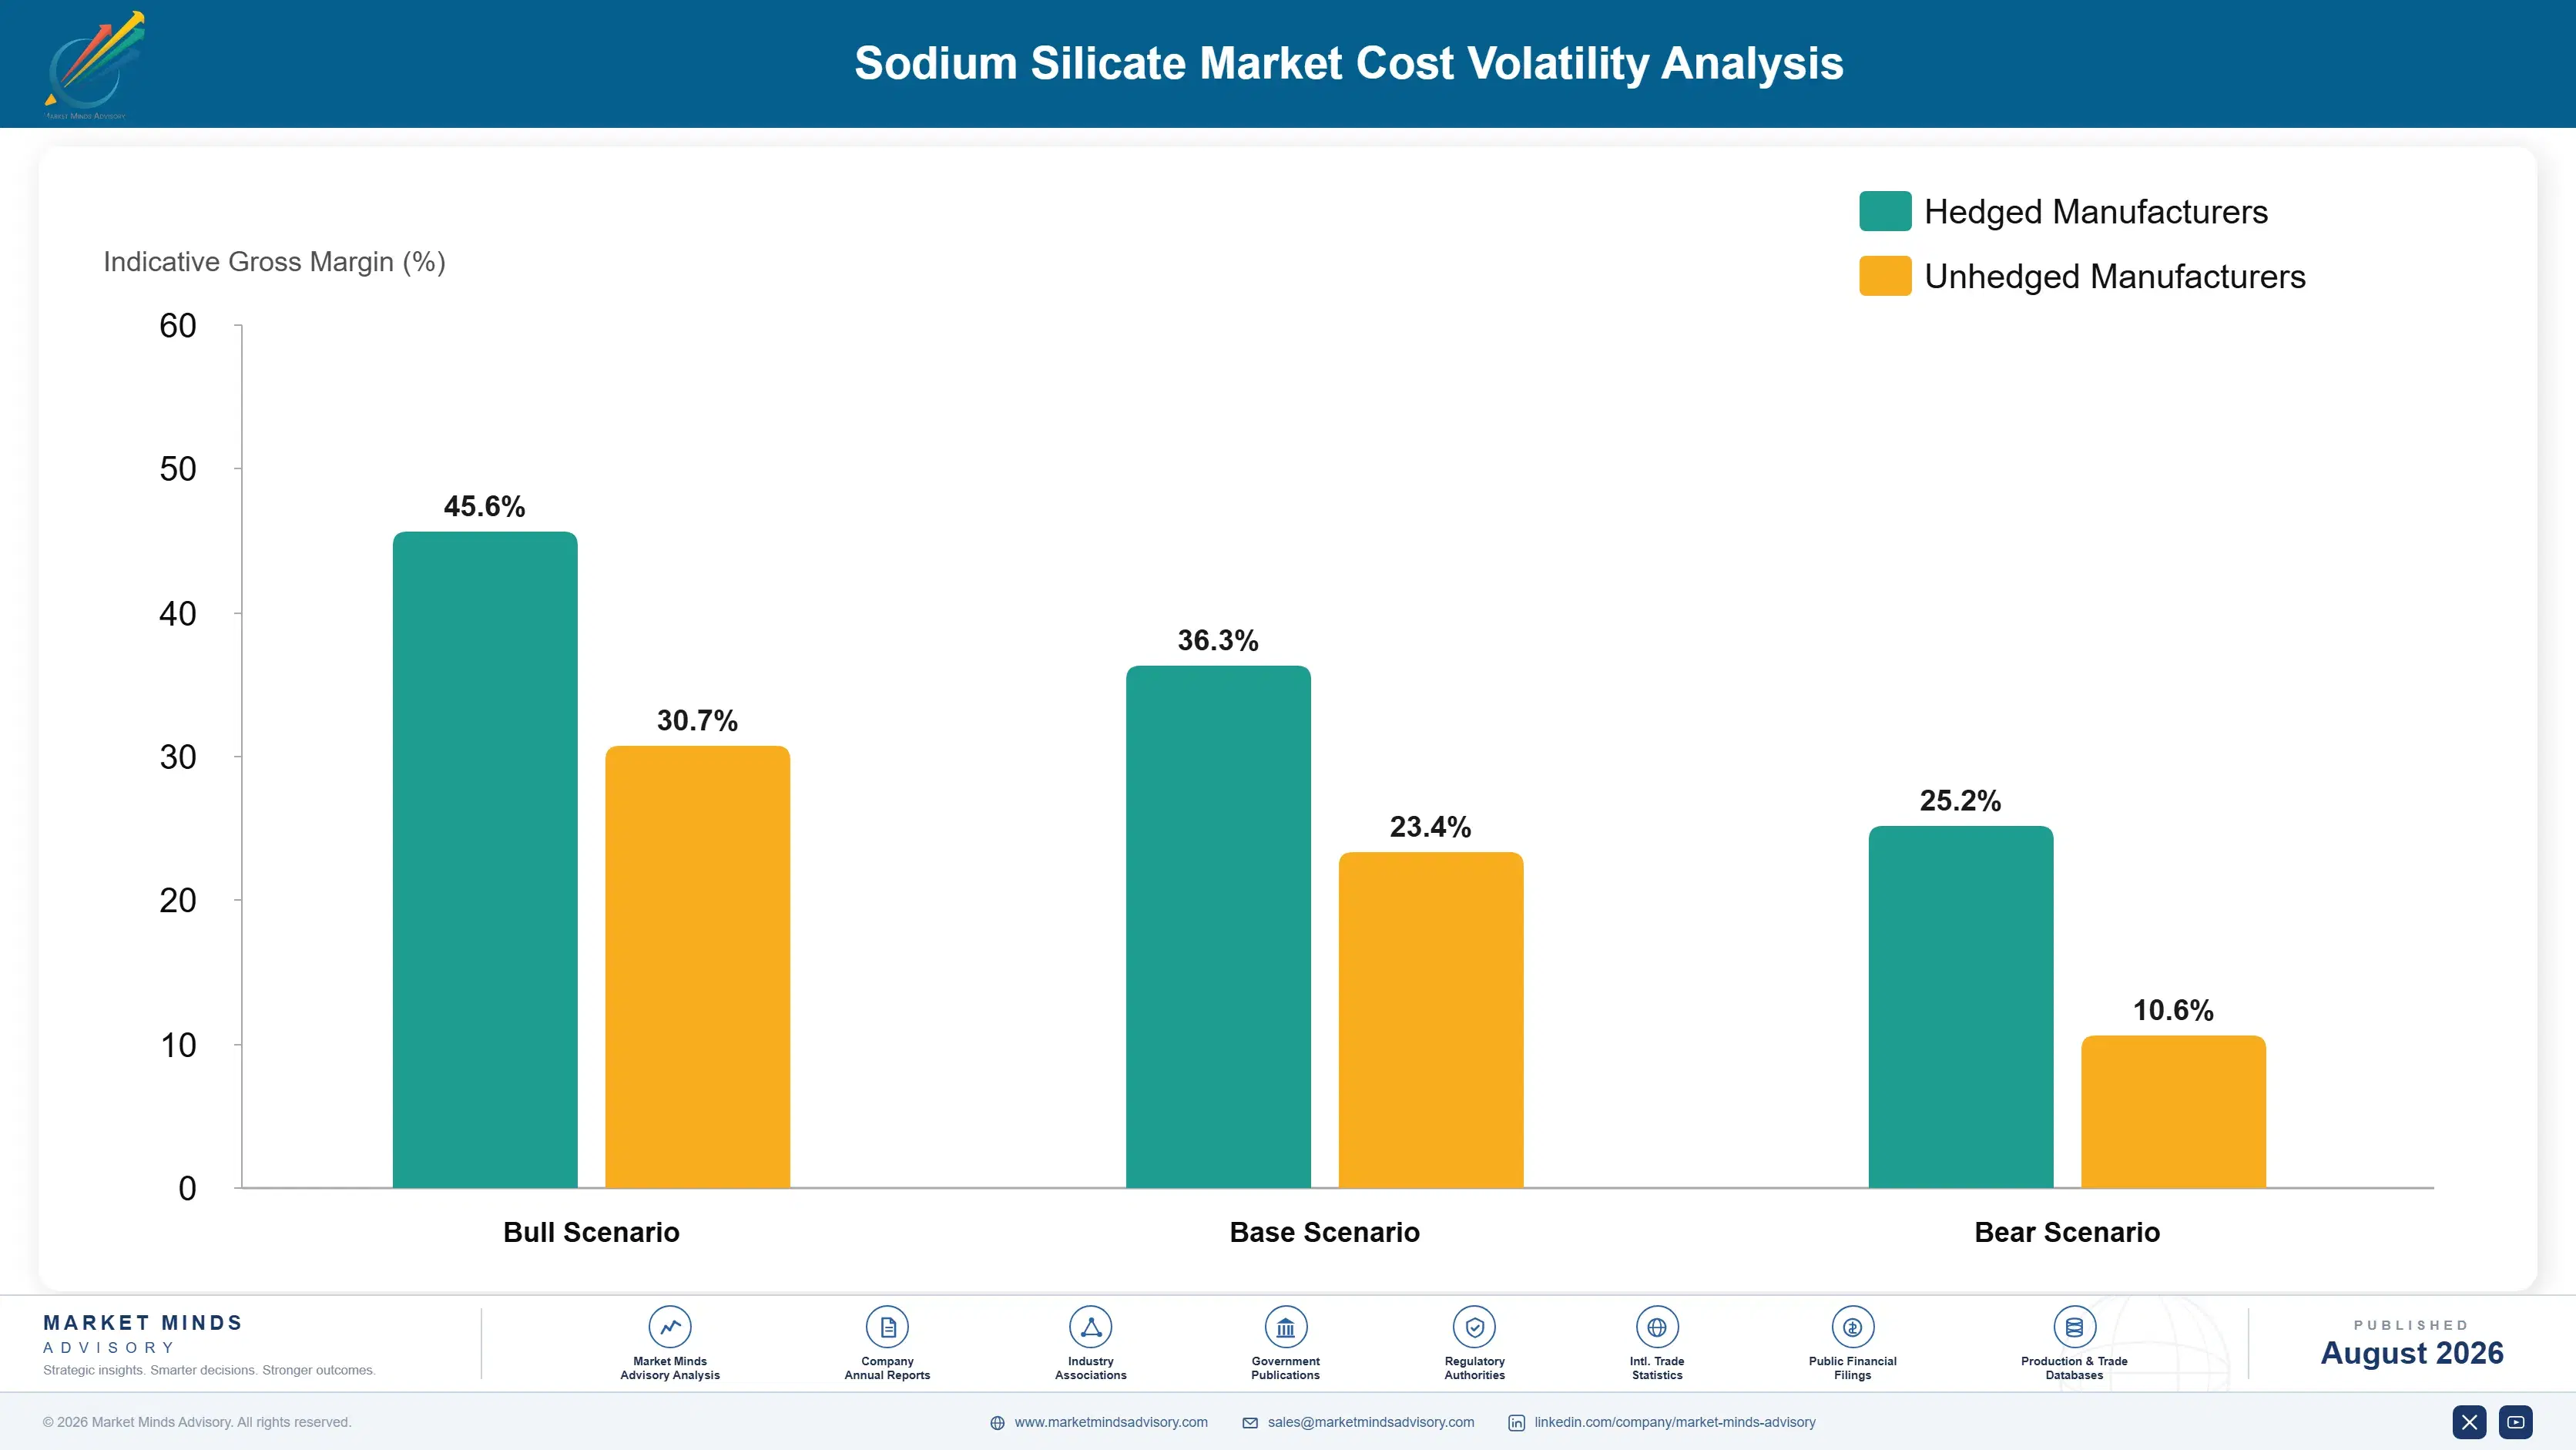
Soda ash and silica sand together account for roughly 43% of delivered cost, with soda ash carrying most of that and sand contributing quality more than cost. Furnace energy adds about 26%, overwhelmingly gas in fusion routes. Dissolution and filtration utilities contribute 8%, labour and maintenance 9%, packaging 5%, with freight and working capital carrying the remaining 9%.
Energy and soda ash both moved sharply through the history. European industrial gas prices through 2022 reached levels the IEA documented as unprecedented, which pushed silicate furnaces below cash cost and closed several permanently. Soda ash pricing moved on its own supply dynamics across the same period. Ecovyst Annual Report 2023 recorded raw material and energy cost pressure across its operations, and CIECH Annual Report 2022 noted energy cost pressure across its silicate and soda businesses.

The competitive disadvantage mechanism runs through energy geography and plant location rather than through operating efficiency. Producers on exposed European gas cannot close a gap that reached several multiples during the spike itself. Those without powder capability are confined to a 350 kilometre circle whatever the furnace efficiency. European liquid-only producers typically carry both limitations, which is why capacity has closed there while additions concentrated elsewhere.
sodium-silicate-market-trends-cost-volatility-analysis-1787311164199

Contract gas supply or move melting off fusion entirely

Furnace energy carries roughly a quarter of delivered cost, and 2022 demonstrated that an unmanaged gas position can exceed the entire conversion margin on a tonne of silicate. Multi-year contracting, oxy-fuel conversion or hydrothermal digestion for suitable grades each remove that exposure, and the choice between them is a siting and grade question rather than a technology preference.

Add drying capacity to escape the delivery radius

Liquid silicate is nearly two thirds water and stops travelling beyond roughly 350 kilometres, which caps the addressable market at a circle nobody can widen by selling harder. Spray-drying capital converts that hard geographic boundary into an ordinary cost line, and it reaches detergent, construction and export customers that solution supply cannot serve at any price.

Qualify sand sources against downstream purity requirements

Iron, aluminium and heavy metal content in silicate carries straight through into precipitated silica and zeolite catalyst performance, and sand selection governs that more than furnace practice does. Qualifying alternative sand sources against those downstream specifications rather than against bulk chemistry opens premium grades that ordinary industrial production simply cannot supply reliably at all.

Portfolio Architecture for Margin Defence

Margin architecture separates by purity and physical form rather than by furnace scale, which is not at all how most silicate producers organise their own internal reporting. Standard liquid grades sold on solids content earn whatever the nearest competing furnace allows, because the chemistry is identical everywhere and delivered cost inside the radius decides every award.
Value climbs where a downstream product carries the silicate specification through into its own performance. Higher modulus and controlled specification liquids defend modest premiums through consistency in gel time and alkalinity. Low-iron specialty grades for precipitated silica, chromatography gel and refining catalysts sit far higher, since sand selection and furnace practice govern achievable purity and very few operations reach it reliably.

The highest value pools concentrate where specialty purity meets a powder or solid form, because that combination escapes both the commodity pricing and the freight constraint at once. Those pools are modest in tonnage and quite disproportionate in realised margin. The commercial tension is that bulk liquid volume keeps furnaces loaded, which the energy economics absolutely require, while funding almost none of the purity or drying capability above it.

Volume / Commodity-Adjacent Tier

Standard low and neutral modulus liquid silicate supplied on solids content into detergent, pulp and paper and general industrial duty, where chemistry is identical between producers and delivered cost inside the radius decides everything.
Gross Margin: 14-22%

Premium / Certified Tier

High modulus liquids, solid cullet and controlled specification grades supplied into construction, foundry and catalyst precursor duty. Modulus consistency and gel behaviour defend pricing here. The ten-point range reflects bulk supply against specification-controlled positions.
Gross Margin: 24-34%

Sustainability / Regulatory / Next-Generation Tier

Low-iron specialty grades and spray-dried powders serving precipitated silica, chromatography and refining catalyst manufacture beyond conventional freight radii. Purity capability and form advantage defend pricing strongly. The thirteen-point range reflects established specialty grades against emerging powder economics.
Gross Margin: 36-49%
sodium-silicate-market-trends-portfolio-architecture-1787311164714

High-value Sub-segments and Strategic Watch-out

Low-iron specialty grades for downstream silica

High value and genuinely high growth together here, because impurities carry straight through into precipitated silica and catalyst performance, and sand selection determines whether a plant can qualify at all rather than merely competing on price. Realised margin here reflects that qualification barrier very directly.
Gross Margin: 36-49%

Spray-dried powder for extended delivery reach

Strong realised value on the fastest growth found anywhere here, because removing water removes the freight constraint entirely and reaches detergent, construction and export customers that liquid supply cannot serve at any price at all. Drying capital simply converts geography into an ordinary cost line.
Gross Margin: 32-44%

Standard liquid silicate within the freight radius

The volume core of this entire silicate market here, keeping the melting furnaces properly loaded while earning whatever the nearest competing operation permits on chemistry that is identical absolutely everywhere. Necessary for the basic furnace energy economics, but this tier funds nothing whatsoever above itself.
Gross Margin: 14-22%

Backward integration exposure across merchant volume

The strategic watch-out running right across the whole of this silicate business here, given that downstream silica and catalyst producers now keep building their own captive silicate capacity instead and that any merchant volume removed in this way never returns to the market at all.
Gross Margin: 10-36%

How sodium silicate demand behaves

Demand is continuous, geographically captive and increasingly split between users who care about purity and users who care only about solids content. A detergent formulator or paper mill buys on delivered cost from whichever furnace inside its radius quotes best, and switches without consequence. A precipitated silica or catalyst producer buys on impurity profile, because everything in the silicate carries through into a product specified downstream by somebody else.
Stickiness tracks that split precisely. Bulk liquid supply is loosest, substituted between deliveries on price with nothing beyond a purchase order involved. Controlled modulus grades for construction and foundry duty sit tighter, because gel time and set behaviour are tuned into a customer's process. Low-iron specialty supply is stickiest of all, since requalifying a silicate source means revalidating the downstream product against its own specifications.

The buyer profile splits between formulators and chemical manufacturers in ways that defeat a single commercial model. Detergent, paper and construction formulators buy through procurement on delivered price and reliability, often from whoever is nearest. Silica, catalyst and specialty chemical manufacturers evaluate impurity data through technical functions long before commercial discussion opens, and increasingly decide to build captive capacity instead of buying.
sodium-silicate-market-trends-end-use-penetration-index-1787311165214

What we would actually do here

These are among the four positions where our research anticipates prominent divergence between winners and laggards over the coming forecast period. Each is grounded in the demand model, the regulatory perimeter, and the announced capacity pipeline.
01 / PURITY SPECIFICATION SELLING

Sell what the downstream product actually needs

Most silicate is sold on solids content and delivered price, which places a producer alongside every other furnace inside the freight radius and nothing else whatsoever. Producers holding tight modulus control and low iron, aluminium and heavy metal specification realise roughly 28% above technical grade pricing, because impurities carry straight through into downstream silica and catalyst performance. Achieving it depends on sand selection and furnace practice rather than post-treatment, and most producers never test their product against downstream performance at all.
02 / DOWNSTREAM SILICA INTEGRATION

Stop watching the value leave your own gate

Precipitated silica for tyre tread consumes roughly three tonnes of sodium silicate per tonne produced, and that silica business earns several times what the silicate realises per tonne delivered into it. Producers integrating forward, or contracting long-term into a silica plant inside their freight radius, capture roughly 2 times the value per tonne they would otherwise realise. The plant capital is meaningful but a contract position costs nothing at all, and most producers have never negotiated for any share of it.
03 / MELTING ROUTE CONVERSION

Get the furnace off exposed gas before the next spike

Furnace energy carries roughly 26% of delivered silicate cost, and the gap between advantaged and European gas pricing has comfortably exceeded the entire conversion margin available on a single tonne of silicate. Producers running hydrothermal digestion, oxy-fuel firing or electrically boosted furnaces hold roughly 24% lower delivered cost than their conventional fusion competitors do. Several European furnaces closed permanently through 2022 rather than idling through it, which is precisely what an unmanaged energy exposure looks like when it finally arrives.
04 / DELIVERY RADIUS CONTROL

Put the next furnace where the cluster is growing

Liquid silicate is 62% water and stops travelling economically beyond roughly 350 kilometres, which makes plant location the single most consequential commercial decision available here and one that nobody ever revisits afterwards. Producers already established inside a detergent, silica or catalyst cluster hold roughly 20% delivered cost advantage over anybody shipping in from outside it entirely. Several producers have kept expanding capacity where demand is flat while conceding the faster growing clusters entirely to whoever happened to arrive there first.

Engagement Snapshot From the Field

A live engagement with an industry participant carrying material or product regulatory and market exposure ahead of a defining policy shift, showing how our research translates into a defensible multi-year portfolio strategy.
MARKET MINDS ADVISORY · CLIENT ENGAGEMENT SUMMARY
Sodium Silicate Producer Strategic Portfolio Review and Transition Roadmap 2026·Investment Scenario on Sodium Silicate Exposure Evaluation 2025-26
CLIENT PROFILE
A regional sodium silicate producer operating two gas-fired furnaces in Western Europe, supplying detergent formulators, paper mills, construction chemical companies and a small catalyst customer within conventional delivery radii. Silicate revenue approached EUR 96 million annually (client-reported, unverified by MMA), roughly eighty-five percent of it standard liquid grades sold on solids content against competing furnace quotations.
STRATEGIC CHALLENGE
Margins had not recovered since the energy spike and management attributed the shortfall to imported solid grades rather than to its own gas position. A large detergent customer had reduced volume as it shifted toward liquid formulations. Specialty and catalyst opportunities were being lost without anybody establishing why they were lost.
MMA APPROACH
We rebuilt delivered economics by customer distance and by furnace energy contract rather than at company level, tested achievable product purity against downstream silica and catalyst specifications using actual impurity data, and reconstructed seven lost specialty enquiries through interviews with customer technical functions rather than the purchasing contacts the client normally dealt with.
KEY FINDINGS
  1. Margin shortfall traced almost entirely to the unhedged gas position at both furnaces rather than to imported product, whose landed cost had barely moved across the period.
  2. Iron content on the existing sand source excluded the client from every precipitated silica specification examined, and nobody had tested an alternative sand source at all.
  3. Six of seven lost specialty enquiries had failed on impurity documentation rather than on delivered price, availability or modulus consistency in any respect.
  4. No powder or solid capability existed at either site, confining the whole business to a radius where detergent demand was declining fastest of all applications.
CLIENT PROFILE
A regional sodium silicate producer operating two gas-fired furnaces in Western Europe, supplying detergent formulators, paper mills, construction chemical companies and a small catalyst customer within conventional delivery radii. Silicate revenue approached EUR 96 million annually (client-reported, unverified by MMA), roughly eighty-five percent of it standard liquid grades sold on solids content against competing furnace quotations.
STRATEGIC CHALLENGE
Margins had not recovered since the energy spike and management attributed the shortfall to imported solid grades rather than to its own gas position. A large detergent customer had reduced volume as it shifted toward liquid formulations. Specialty and catalyst opportunities were being lost without anybody establishing why they were lost.
MMA APPROACH
We rebuilt delivered economics by customer distance and by furnace energy contract rather than at company level, tested achievable product purity against downstream silica and catalyst specifications using actual impurity data, and reconstructed seven lost specialty enquiries through interviews with customer technical functions rather than the purchasing contacts the client normally dealt with.
KEY FINDINGS
  1. Margin shortfall traced almost entirely to the unhedged gas position at both furnaces rather than to imported product, whose landed cost had barely moved across the period.
  2. Iron content on the existing sand source excluded the client from every precipitated silica specification examined, and nobody had tested an alternative sand source at all.
  3. Six of seven lost specialty enquiries had failed on impurity documentation rather than on delivered price, availability or modulus consistency in any respect.
  4. No powder or solid capability existed at either site, confining the whole business to a radius where detergent demand was declining fastest of all applications.
RECOMMENDED STRATEGY
Phase 1: Phase one: contract gas supply on multi-year terms at both furnaces and evaluate oxy-fuel conversion at the larger operation immediately. Phase 2: Phase two: qualify an alternative low-iron sand source and then test achievable purity properly against precipitated silica and catalyst specifications. Phase 3: Phase three: commission spray-drying capacity at the larger site to reach construction and export customers well beyond the current liquid delivery radius entirely.
OUTCOME
The client contracted gas supply on multi-year terms and qualified a low-iron sand source at the larger furnace. Two specialty grade qualifications were underway within nine months, and realised margin improved by 19% (client-reported, unverified by MMA) against the prior year on broadly comparable silicate tonnage shipped.

Frequently Asked Questions

Foundational context covering the market sizes, CAGR, scope, country, region and competition that inform every finding below. This section is provided to cover basics and most often pre-purchase conversations, answered from the MMA Primary Research Dataset.

What is the current size of the Sodium Silicate Market?

The market is valued at USD 8.4 billion in 2025, rising to USD 8.79 billion in 2026. Sizing covers silicate sold or transferred to industrial users and formulators at realised delivered price.

How large will the Sodium Silicate Market be by 2036?

The market reaches USD 13.78 billion by 2036, an increase of USD 4.99 billion across the forecast period. That represents an expansion multiple of 1.57 times the 2026 base.

What is the CAGR for the Sodium Silicate Market 2026 to 2036?

The base case CAGR is 4.6% across 2026 to 2036. The bull case reaches 5.8% on faster silica tyre adoption, while the bear case sits at 3.3% under continued detergent reformulation.

Which segment is growing fastest?

Powder and spray-dried grades grow fastest at 6.9%, a full 1.50 times the market rate. Removing water removes the freight constraint that caps every liquid producer's addressable radius.

Who are the major companies in the Sodium Silicate Market?

Ecovyst, Occidental Chemical, CIECH Group, Silmaco and Nippon Chemical Industrial lead on capacity, holding just 24% collectively. The remaining field is largely regional furnace operators.

Which country is growing fastest?

India grows fastest at 7.4%, driven by powder detergent consumption rising with washing machine penetration alongside refining and petrochemical catalyst manufacture that keeps expanding quickly.

Report Segmentation Architecture

The full report scope spans multiple orthogonal segmentation dimensions, with cross-tabulated demand data provided for each dimension pair. Coverage extends further to regional breakdowns, trend trajectories, and the competitive detail needed to support segment-level decision-making.

By Product Form and Modulus Class

  • Low Modulus Liquid Silicate
  • Neutral Modulus Liquid Silicate
  • High Modulus Liquid Silicate
  • Solid Cullet and Lump Silicate
  • Powder and Spray-Dried Grades
  • Specialty and Low-Iron Grades

By End-Use Industry

  • Detergents and Cleaning Products
  • Precipitated Silica and Silica Gel
  • Catalysts and Molecular Sieves
  • Pulp, Paper and Bleaching
  • Construction and Soil Stabilisation
  • Foundry Binders and Water Treatment

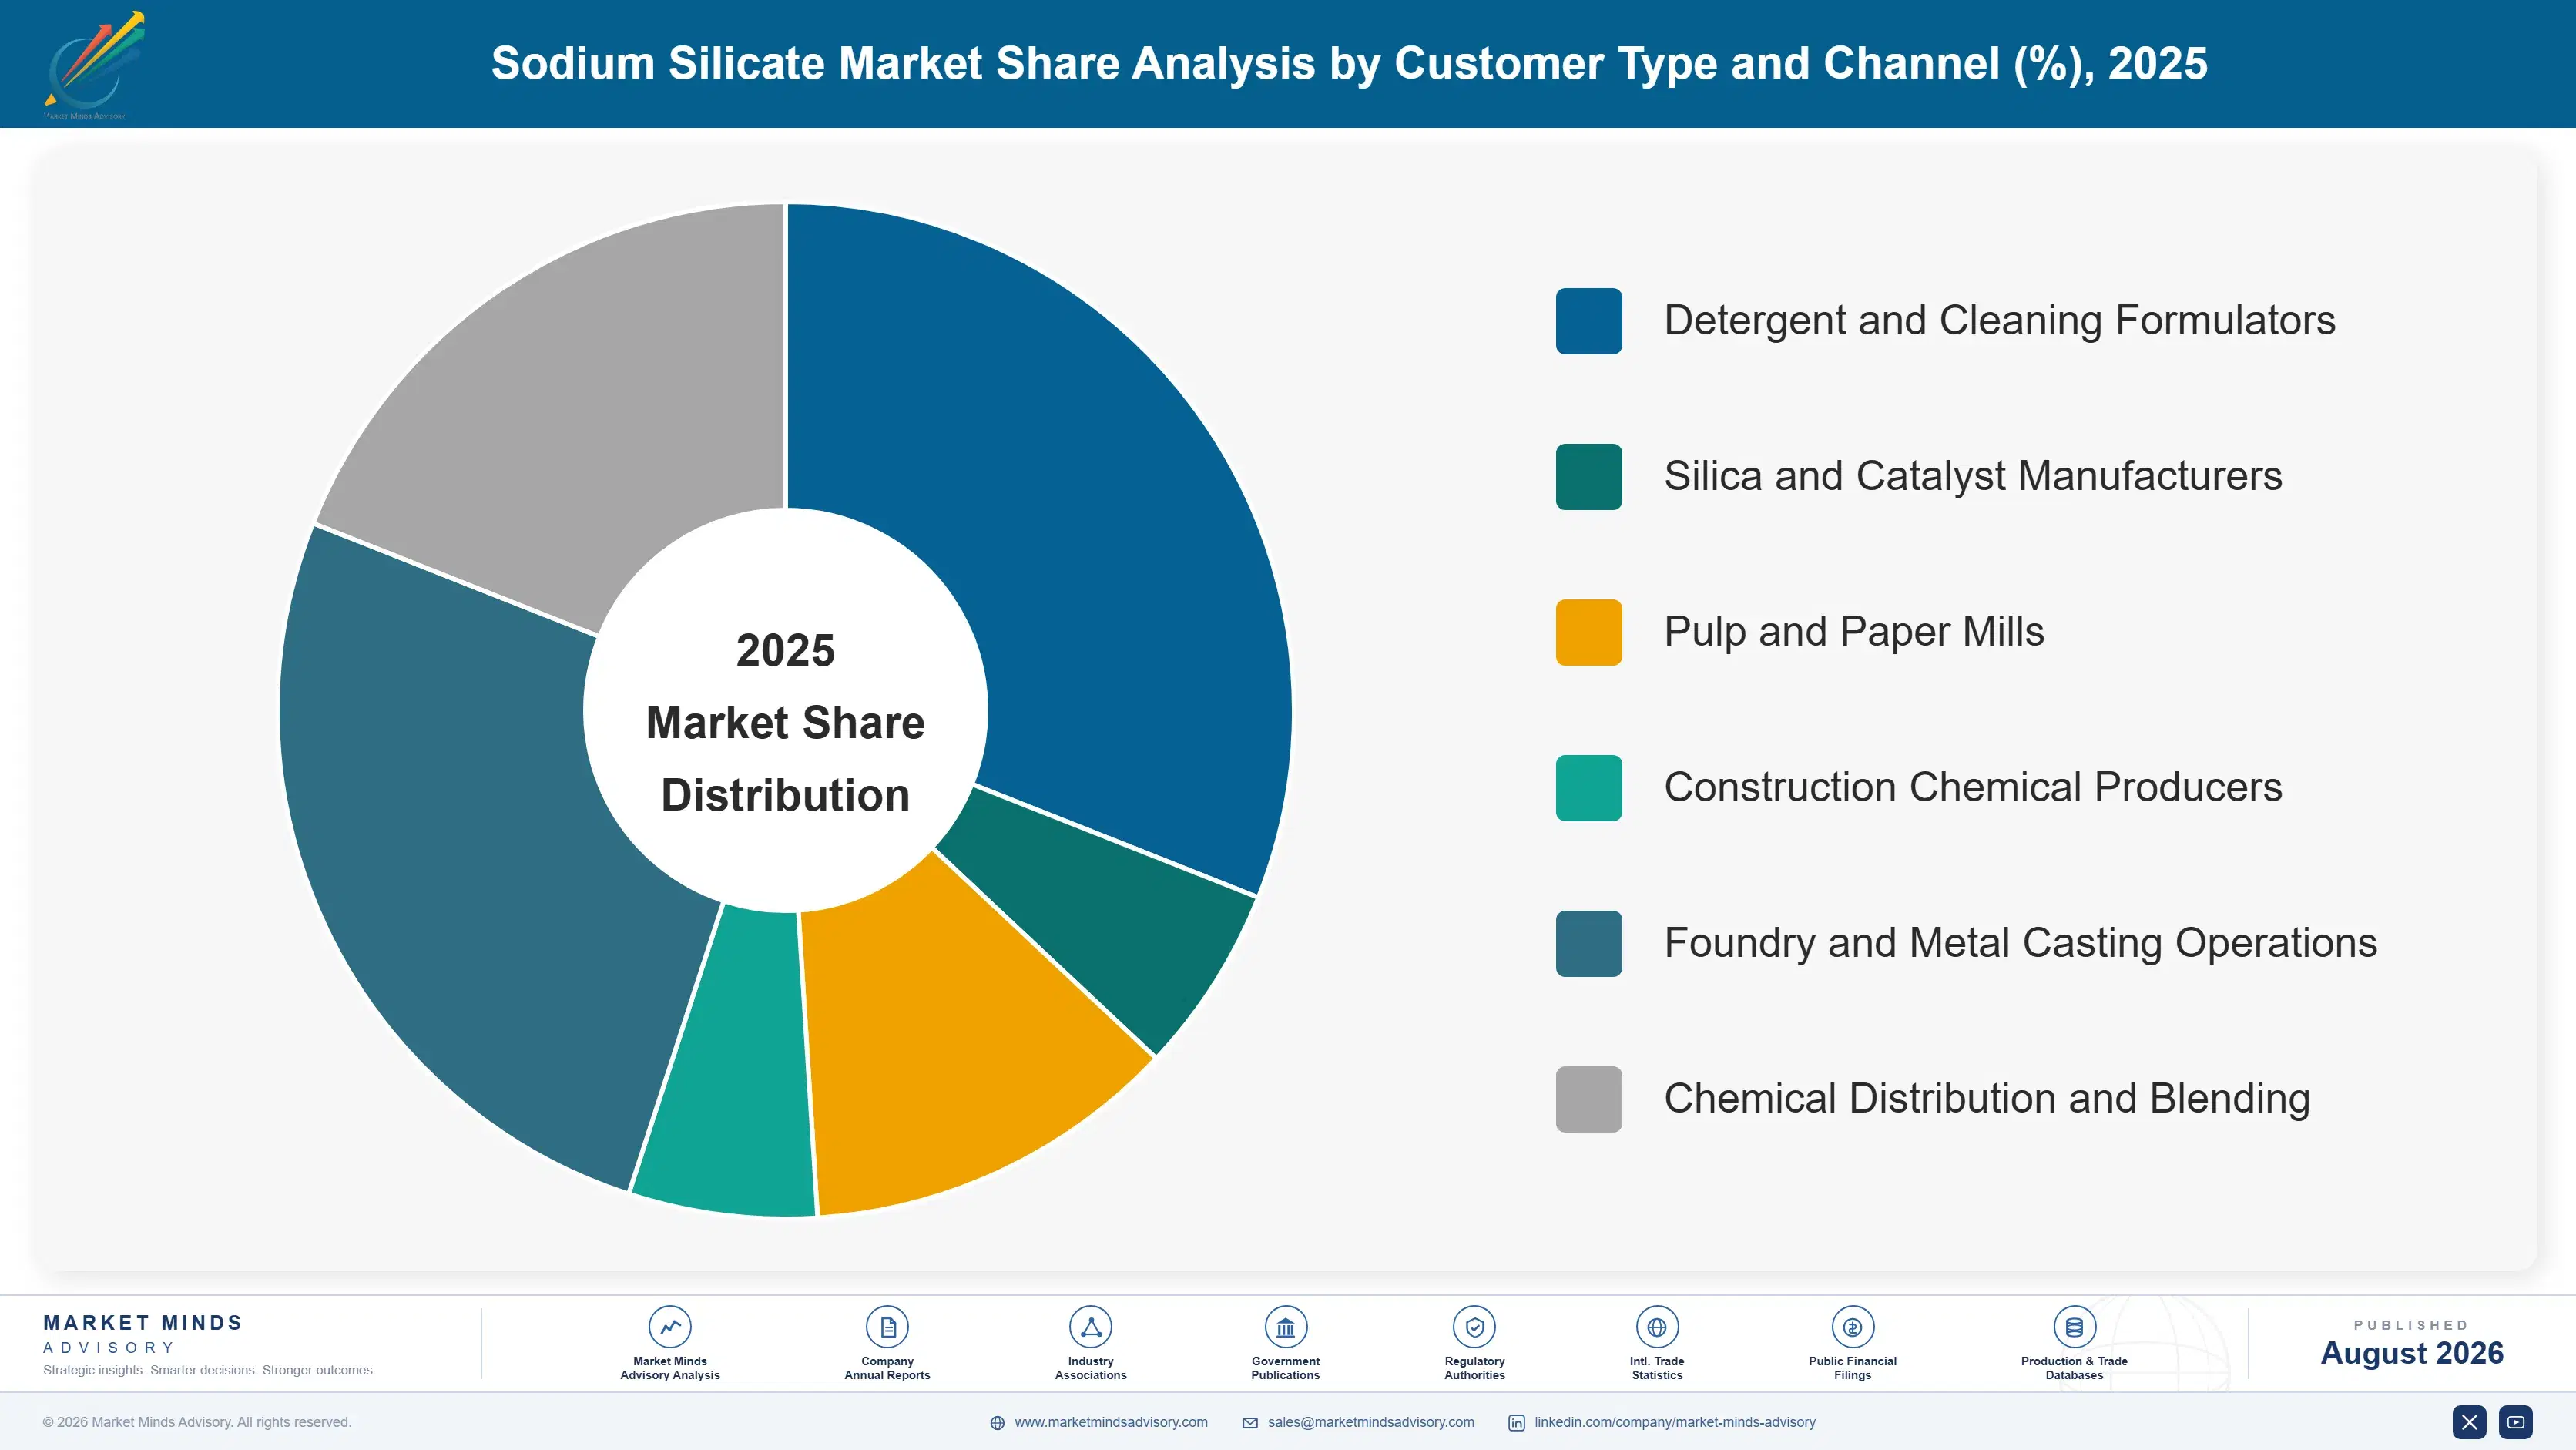
By Customer Type and Channel

  • Detergent and Cleaning Formulators
  • Silica and Catalyst Manufacturers
  • Pulp and Paper Mills
  • Construction Chemical Producers
  • Foundry and Metal Casting Operations
  • Chemical Distribution and Blending

By Region

  • North America
  • Western Europe
  • East Asia
  • South Asia and Pacific
  • Latin America
  • Middle East and Africa
  • Eastern Europe

Scope, Methodology, and Coverage

Every figure in this report is reproducible from documented input assumptions. The scope below maps the historical period, the forecast horizon, the segmentation dimensions, and the countries covered, alongside the underlying primary and qualitative methodology.
Historical Period
2020 to 2025
Forecast Period
2026 to 2036
Base Year
2025 (USD billions; MMA Primary Research Dataset, August 2026)
Market Definition
The market comprises sodium silicate produced by furnace fusion or hydrothermal digestion, spanning low modulus liquid, neutral modulus liquid, high modulus liquid, solid cullet and lump, powder and spray-dried grades, and specialty low-iron classes. Sizing captures silicate revenue at realised delivered price across detergents and cleaning products, precipitated silica and silica gel manufacture, catalysts and molecular sieves, pulp, paper and bleaching, construction and soil stabilisation, and foundry binder and water treatment applications, including captive transfers valued at market equivalent. Potassium and lithium silicates, precipitated silica and silica gel produced downstream, zeolite catalysts and molecular sieves as finished products, colloidal silica sols, and silicate-containing formulated products all fall outside scope.
Quantitative Units
USD billions (current prices); silicate shipped annually in millions of tonnes on a solids basis; USD per tonne at realised delivered price
Segmentation Dimensions
By Product Form and Modulus Class; By End-Use Industry; By Customer Type and Channel; By Region
Regions Covered
North America, Western Europe, East Asia, South Asia and Pacific, Latin America, Middle East and Africa, Eastern Europe
Countries Covered
USA, Canada, Mexico, UK, Germany, France, Belgium, Netherlands, Italy, Spain, Poland, Czech Republic, Romania, Turkey, China, Japan, South Korea, Taiwan, India, Singapore, Malaysia, Thailand, Vietnam, Indonesia, Australia, Brazil, Argentina, Colombia, Chile, Saudi Arabia, UAE, Egypt, Morocco, Nigeria, South Africa, and additional markets relevant to this sector
Key Companies Profiled
Ecovyst, Occidental Chemical, CIECH Group, Silmaco, Nippon Chemical Industrial, Tokuyama, Evonik, W. R. Grace, National Silicates, IQE Group, Qingdao Haiwan Group, Zhejiang Kanghexin Chemical, Shandong Xindadi Industrial, Captain Industries, Kiran Global Chem, Sinchem Silica Gel, C&C Silicates, Silicatos y Derivados, Amtrade International, BASF.
Quantitative Methodology
Primary survey, n=3,800 respondents, Q4 2025, six countries; demand-side model with trade association cross-validation
Qualitative Methodology
47 expert interviews, Q4 2025; applied to validate demand model assumptions, identify emerging dynamics, and assess competitive positioning
Report Format
PDF and XLSX data workbook (Word format preview document)
Publisher
Market Minds Advisory
Report Code
MMA-2026-CHM-634
Published
August 2026
Contact
sales@marketmindsadvisory.com | www.marketmindsadvisory.com

Purchase the full Sodium Silicate Market Report (2026 to 2036).

The full report sizes the sodium silicate market across six product forms and modulus classes, six end-use industries, six customer channels and seven regions, with annual forecasts to 2036 in revenue and tonnage shipped. It rebuilds delivered economics by customer distance and by furnace energy contract rather than at company level, which is the analysis that establishes where each plant is genuinely competitive. Twenty participants are assessed on a consistent production capacity basis, with downstream silica and catalyst positions mapped separately from furnace capacity. Backward integration by downstream producers is quantified region by region.
Six product forms and modulus classes sized and forecast
Delivered economics rebuilt by customer distance and energy contract
Twenty participants assessed on consistent production capacity basis
Downstream silica and catalyst positions mapped separately from furnaces
Backward integration by downstream producers quantified region by region
Achievable purity mapped against downstream qualification requirements throughout

Built For The People Who Decide

From boardroom strategy to bench-side execution, this report is read cover-to-cover by leaders shaping the next decade of their industry, turning demand scenarios, market dynamics and valuation benchmarks into decisions.
CXOs/ Presidents/ VPs/ Managers
M&A and Corporate Development
Strategy Teams and R&D Heads
Procurement and Product Directors
Regulatory and Compliance Leaders
Investor Relations and Equity Analysts