Market Minds Advisory
Sodium Bicarbonate Market

Sodium Bicarbonate Market: A Commodity Whose Best Growth Destroys the Product

The fastest growing use injects it into hot flue gas where it is consumed entirely, and demand for that comes from emissions regulation rather than from anything a producer does.

Lead Analyst

Bilal Shaikh

Published

September 2026

Make Smarter Decisions with Customized Research Insights

Request a free sample report and evaluate market opportunities, growth trends, and competitive dynamics relevant to your business needs.

2025 MARKET VALUE$1.7BMarket Size 2025
2036 FORECAST VALUE$2.8BBase Case , 2026 to 2036
CAGR 2026 TO 20364.6 %Bull 5.8% / Bear 3.4%
INCREMENTAL OPPORTUNITY$1.0BNet 10- year value creation
EXPANSION MULTIPLE1.57x2036 value over 2026 base
Strategic Levers
M&A Pipeline
Regional Outlook
Country Rankings
Competitive Intelligence
Segmental Deep-dive
Call-Us : 91 93563 13602

Executive Snapshot and Market Trajectory

The fastest growing application destroys the product entirely. Dry sorbent injection blows bicarbonate into hot flue gas where it decomposes and neutralises acid gases, removing around 96% of them, and demand comes from emissions regulation rather than from anything a producer can influence.
Two production routes make the same molecule on different economics. The Solvay route builds it from soda ash and carbon dioxide, while mined trona and nahcolite deposits deliver it with roughly 42% less process energy. That split is unusual for a commodity chemical and it decides who competes on cost in which market. Energy price movements therefore reorder competitive positions across the industry without any change in customer demand at all.
Freight settles the rest. Bicarbonate is bulky and cheap, so delivered cost rises steeply beyond around 800 kilometres and production stays regional however global the customers are. The top five hold 48%, India grows fastest at 8.0%, and dialysis grade is the quiet high-value niche most producers treat as an afterthought. Plant siting therefore decides which customers a producer can reach at all, which settles most competitive questions before anybody sits down to discuss price.
Market Definition
Sodium bicarbonate supplied across purity grades and applications, covering technical and industrial grade, flue gas treatment grade, food grade, feed grade, pharmaceutical and dialysis grade, and personal care and detergent grade. Measured at producer selling value across synthetic and mined production routes. Excludes soda ash sold as such, other sodium chemicals, finished consumer baking products, and dialysis concentrate solutions sold as prepared medical products.
Base Year Value
$1.7B in 2025 (MMA Primary Research Dataset, August 2026)
Forecast Period
2026 to 2036, eleven discrete annual values
CAGR
4.6% base case. Bull 5.8%. Bear 3.4%.
Fastest Growth Segment
Flue Gas Treatment Grade: 6.9% CAGR
Fastest Growth Country
India: 8.0% CAGR
Fastest Growth Region
South Asia and Pacific: 6.6% CAGR
Largest Region
Western Europe: 26% of 2025 global value
Market Leaders
Solvay, Tata Chemicals, Sisecam Resources, Church and Dwight, Natural Soda. Source: MMA Primary Research Dataset, July 2026.
Primary Survey
n=3,800 procurement and R&D decision-makers, Q4 2025, six countries
Methodology
Demand-side build-up, cross-validated against public data, 47 expert interviews

Sodium Bicarbonate Market Forecast Scenarios

sodium-bicarbonate-market-trends-size-forecast-scenario-1787595214716
Growth ran near 3.8% between 2020 and 2025, with traditional food, feed and industrial applications essentially flat while flue gas treatment expanded steadily on tightening emissions rules. Energy costs moved sharply across the period and affected the synthetic Solvay route considerably more than mined production, which shifted relative cost positions between producers in ways that had nothing to do with demand.
Base case 4.6% rests on three mechanisms. Dry sorbent injection grows at 6.9% as industrial emissions regulation tightens across waste incineration, cement, glass and biomass combustion in markets that had not previously required acid gas control. Dialysis grade expands with treated patient populations that rise steadily regardless of economic conditions. And Indian industrial and food demand grows fastest anywhere at 8.0% from a modernising base. Regulatory tracking predicts that demand considerably better than industrial statistics do.
The bull case at 5.8% assumes emissions regulation extending into industrial sectors currently outside acid gas control requirements, which would add demand independent of any economic cycle. The bear case at 3.4% is sustained high energy costs damaging synthetic production economics severely enough that regional supply tightens and customers substitute toward alternative sorbents where technically possible.

Consumed by Its Own Best Application

The application growing fastest here consumes the product completely and irreversibly. Dry sorbent injection blows finely milled bicarbonate into hot flue gas, where it decomposes into sodium carbonate and reacts with sulphur dioxide and hydrogen chloride, removing around 96% of acid gases. Nothing is recovered and the residue goes to disposal. Demand for it is created by emissions regulation, which means a producer's best growth depends entirely on what regulators decide.
TOP FIVE CONCENTRATION48%Freight economics keep production regional and the field wide
FREIGHT ECONOMIC RADIUS800 kmDistance beyond which delivered cost becomes commercially uncompetitive
ACID GAS REMOVAL96%Removal achieved by dry sorbent injection in flue gas
DIALYSIS USE PER PATIENT180 kgAnnual consumption treating a single patient on dialysis
MINED ROUTE ENERGY SAVING42%Process energy avoided against the synthetic production route
BULK DENSITY0.9Density that makes long distance shipping uneconomic for anybody
Two quite different production routes make the identical molecule. The Solvay process builds bicarbonate from soda ash and carbon dioxide with substantial energy input, while mined trona and nahcolite deposits in Wyoming and Colorado deliver it with roughly 42% less process energy and a correspondingly better carbon position. That split is unusual for a commodity chemical, and it means energy price movements reorder competitive positions without any change in demand.
Freight decides the rest of the commercial picture. Bulk density near 0.9 makes bicarbonate expensive to ship relative to its value, and delivered cost becomes uncompetitive beyond around 800 kilometres. Production therefore stays regional whatever the customer's footprint looks like, and concentration sits at only 48% after decades in which consolidation might have been expected to progress further.
"Producers spend their time defending baking soda volumes and the growth is in a scrubbing application where the customer only exists because an inspector requires it. Follow the emissions rules rather than the food industry and you will know where the next plant needs to go."
Director, Inorganic Chemicals and Emissions Control Practice · MMA Chemicals and Materials Practice · August 2026

Market Trends

Emissions regulation creating demand producers cannot influence

Dry sorbent injection removes around 96% of acid gases from flue gas and consumes the bicarbonate entirely in doing so, which makes it an unusually attractive application from a producer's point of view. Demand arrives when regulation requires acid gas control at waste incineration, cement, glass or biomass combustion plants, and it disappears if a plant closes or switches technology. Following regulatory development therefore predicts demand considerably better than following any industrial output statistic does. Volumes per plant are substantial and consumption is continuous once milling specification and delivery logistics have been settled properly with the operator.
Market Impact: Uses 180 kilograms per patient
Energy costs reordering positions between production routes

The synthetic Solvay route consumes roughly 42% more process energy than mined trona and nahcolite production, which means industrial energy price movements change relative cost positions without anything happening to demand at all. European synthetic producers felt that acutely through recent energy volatility while American mined producers did not. Carbon accounting adds a second dimension, since the mined route carries a materially lower embedded footprint that some customers have begun asking about. Customers in food and consumer applications have begun requesting embedded carbon data for their own reporting, which turns a cost advantage into a commercial one.
Market Impact: Indian demand growing at 8.0%

Market Opportunities and Growth Drivers

Dialysis populations consuming bicarbonate at predictable volume

Haemodialysis consumes around 180 kilograms of bicarbonate per patient annually, and treated patient populations rise steadily with diabetes and hypertension prevalence regardless of economic conditions. Pharmacopoeia purity requirements and qualification into concentrate manufacture make this a genuinely sticky application rather than a commodity supply. Most producers treat it as an afterthought within a technical grade business, which leaves an unusually defensible niche underdeveloped by nearly everybody serving it. Concentrate manufacturers will not requalify a bicarbonate supplier casually, so the position holds for years once it is properly established and documented.
Market Impact: Uneconomic beyond 800 kilometres

Indian industrial and food demand modernising from a low base

India grows fastest anywhere at 8.0%, with industrial, food and pharmaceutical demand all expanding as manufacturing modernises and packaged food penetration rises across urban markets. Domestic production capacity is substantial and expanding, which matters because freight economics make imported bicarbonate uncompetitive beyond a limited radius. Emissions regulation is beginning to require acid gas control at industrial plants, which would open dry sorbent demand from a base of essentially nothing. Packaged food penetration is the second force, and it lifts food grade demand steadily across urban markets that had previously bought very little of it.
Market Impact: Carries 42% more energy cost

Market Restraints and Challenges

Freight economics confining producers to regional markets

Bulk density near 0.9 makes bicarbonate expensive to move relative to its value, and delivered cost becomes uncompetitive beyond roughly 800 kilometres from a plant. The root cause is physical rather than commercial and no efficiency improvement changes it. Commercially it caps how large any producer can become and explains why concentration sits at just 48% after decades of possible consolidation. Regional plant investment is the only route to growth, and it requires demand to justify it locally first. Freight rate movements change the radius but never remove it entirely.
Market Impact: Removes 96% of acid gases

Synthetic route energy exposure damaging producer economics

The Solvay process consumes around 42% more process energy than mined production, which leaves synthetic producers exposed to industrial energy prices that mined operations largely avoid. The root cause is chemistry rather than plant efficiency, since building the molecule requires energy that digging it up does not. Commercially it reorders cost positions whenever energy moves, without any change in demand. Energy contracting and cogeneration are mitigations that reduce rather than remove the underlying gap. Route diversification into mined material is the only real answer available. Nothing else reduces the exposure by any meaningful margin at all.
Market Impact: Saves 42% of process energy
4 additional market trends, 3 additional growth drivers, and 2 additional restraints and challenges are covered in the full report. Contact sales@marketmindsadvisory.com to access the complete intelligence.

Segment CAGR and Growth Architecture

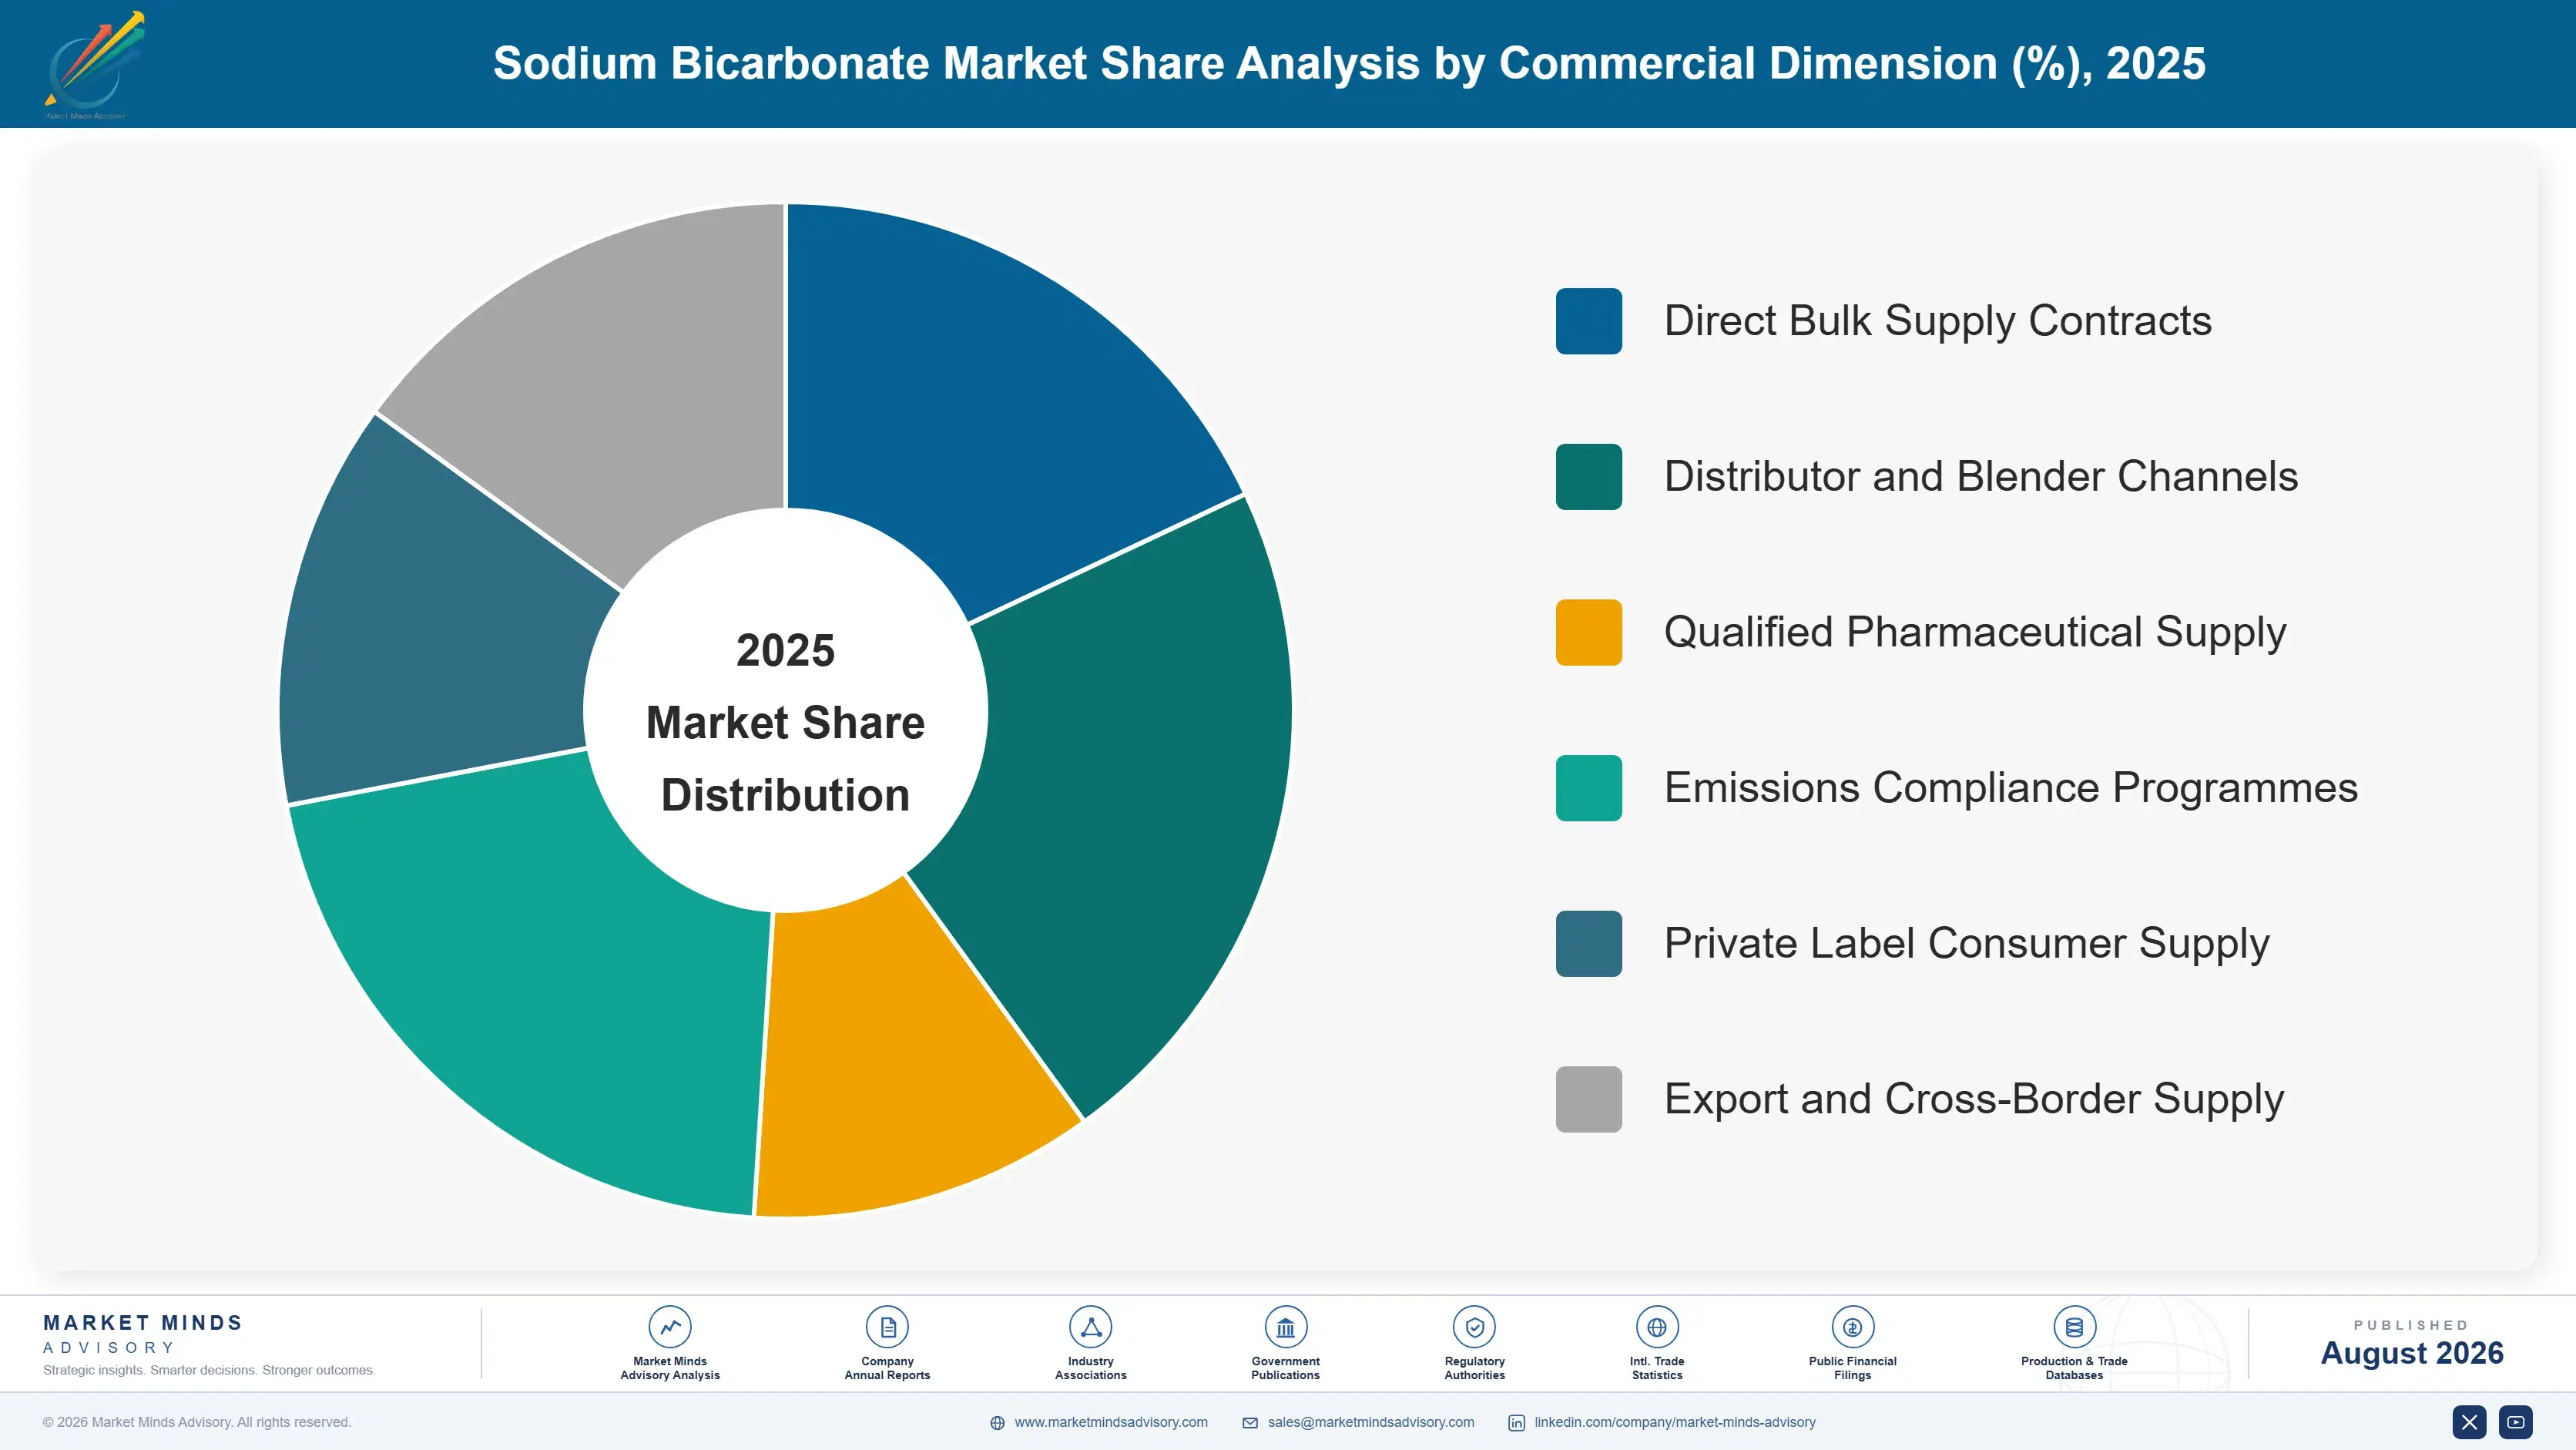
Six segments are split by purity grade, because grade determines the purification and handling required, the qualification a customer imposes and the price a producer can realistically ask. Particle size and packaging variants sit inside each grade rather than beside them. End-use industry and channel are handled in the framework instead. Production route sits in the cost discussion instead.
sodium-bicarbonate-market-trends-market-share-analysis-1787595215246

Flue Gas Treatment Grade

Growing at 6.9%, half again the market rate of 4.6%, this grade is milled to a controlled fine particle size so it decomposes rapidly in hot flue gas and presents maximum surface area to acid gases, removing around 96% of them. Demand is created by emissions regulation at waste incineration, cement, glass and biomass plants rather than by any industrial output measure, which makes regulatory tracking the useful forecasting tool. Volumes per plant are substantial and consumption is continuous, and the customer relationship is genuinely durable once milling specification and delivery logistics are established. Regulatory tracking rather than industrial output data is what identifies the next customer here. Very few producers work that way.
CAGR 6.9%

Pharmaceutical and Dialysis Grade

At 5.8% dialysis consumes around 180 kilograms per patient annually and treated populations rise steadily with diabetes and hypertension prevalence, regardless of economic conditions or industrial cycles. Pharmacopoeia purity and qualification into concentrate manufacture make the position genuinely sticky, since a dialysis concentrate producer will not requalify a bicarbonate supplier casually. Most producers treat this as a minor line within technical grade operations, which leaves a defensible and higher value niche considerably underdeveloped relative to what the qualification barrier would support. Pharmacopoeia documentation and batch consistency decide supply here, and delivered price arguments carry remarkably little weight in the conversation once a producer has been qualified into a concentrate manufacturing operation.
CAGR 5.8%
Full segment breakdown across 6 segments available in the complete report.

Regional Architecture and Country Demand Map

Western Europe holds 26% of value on emissions regulation driving dry sorbent demand and on established synthetic production. North America follows at 24% on mined trona capacity, with East Asia also at 24% on industrial demand. South Asia and Pacific grows fastest of all the regions.

North America

Mined trona and nahcolite deposits in Wyoming and Colorado give producers here a process energy advantage of roughly 42% against synthetic routes, which is a permanent geological position rather than an operating achievement. Dry sorbent injection demand is well established at waste incineration and industrial combustion plants under long standing air quality rules. Food and personal care demand is mature and stable. Freight economics keep production close to demand despite the mining concentration. Growth of 3.8% reflects mature applications rather than any capacity constraint. Dialysis grade demand is the largest anywhere given treated patient numbers, and it is served by a small group of qualified producers. Switching is rare in that application.
Share: 24% | CAGR: 3.8% (2026 to 2036)

Western Europe

Emissions regulation across waste incineration, cement and industrial combustion is stricter than anywhere and has made dry sorbent injection routine rather than exceptional, which drives the fastest growing part of regional demand. Synthetic Solvay production dominates supply and carries the energy exposure that comes with it, which recent industrial energy volatility exposed severely. Food and pharmaceutical demand is mature and well served. Carbon accounting is beginning to favour mined material where freight permits. Growth at 3.2% runs below the base case. Regional demand remains the largest of any region on emissions control volume, and dialysis grade consumption is substantial across national health systems that treat large patient populations. That demand is genuinely durable.
Share: 26% | CAGR: 3.2% (2026 to 2036)
Regional intelligence for 5 additional markets available in the complete report: East Asia, South Asia and Pacific, Latin America, Middle East and Africa, Eastern Europe. Contact sales@marketmindsadvisory.com.
sodium-bicarbonate-market-trends-country-cagr-analysis-1787595215769

Four Moves Inside Eight Hundred Kilometres

Freight caps every ambition in this business at roughly 800 kilometres from a plant, which means growth comes from what you sell inside that radius rather than from reaching further. The fastest growing application is created by regulators, and the highest value one is being ignored by nearly everybody. Both facts should shape where effort goes next.

Track emissions regulation rather than industrial output

Dry sorbent demand appears when a regulator requires acid gas control at a waste incineration, cement, glass or biomass plant, and it grows at 6.9% on that basis rather than on any production statistic. Following regulatory development identifies where demand will appear before the plant operator has begun looking for a supplier. Producers watching industrial output data are watching a variable that does not predict this demand at all. Compliance deadlines are published well in advance, which gives a prepared producer a year or more of warning that nobody else appears to be using.
Market Impact: Captures dry sorbent growth running at 6.9% annually

Develop the dialysis position everybody treats as minor

Haemodialysis consumes around 180 kilograms per patient annually with pharmacopoeia purity and qualification into concentrate manufacture, which makes the position genuinely sticky once established. Treated populations rise steadily regardless of industrial cycles. Most producers run it as a small line inside a technical grade business and never pursue it properly, which leaves a defensible higher value niche underdeveloped relative to what the qualification barrier would comfortably support. Treated populations rise steadily with chronic disease prevalence, so the volume is genuinely predictable rather than cyclical, and margins reach into the high thirties.
Market Impact: Reaches 180 kilograms consumed per dialysis patient annually

Site capacity against the eight hundred kilometre radius

Delivered cost becomes uncompetitive beyond roughly 800 kilometres, which makes plant siting the single most consequential decision in this business and explains why concentration sits at only 48%. Growth requires new capacity near demand rather than better logistics from existing plants. Mapping demand growth against existing plant radii identifies where a competitor is exposed and where a new plant would find customers already waiting for a closer supplier. That analysis is cheap to run and it identifies opportunities that no amount of commercial effort from an existing plant could ever reach.
Market Impact: Serves demand inside an 800 kilometre freight radius

Price the carbon position where customers are asking

Mined production carries roughly 42% less process energy and a materially lower embedded carbon footprint than the synthetic route, and some customers have begun asking about it in food and consumer applications. That difference is real, documented and currently given away for nothing by producers who hold it. Pricing it explicitly reaches sustainability functions rather than procurement, which is a different conversation with a different budget behind it entirely. Documenting the position properly costs very little and competitors on the synthetic route cannot answer it with any amount of operating improvement.
Market Impact: Prices a 42% process energy advantage that competitors lack

Who Controls the Margin Pool

Participation is measured on annual sodium bicarbonate production volume, and the top five hold 48%. Concentration is limited by freight economics rather than by any technical barrier, since production is well understood and delivered cost caps how far any plant can reach. Solvay and Tata Chemicals lead through multiple plants positioned near demand rather than through any single large facility. The gap to challengers is plant siting rather than capability.
Competition runs on three fronts. Plant location decides which customers are reachable at all, which settles most competitive questions before price is discussed. Production route decides energy exposure, and that difference reorders cost positions whenever industrial energy prices move. Grade qualification decides access to dialysis and pharmaceutical applications where switching is genuinely difficult.

Pressure ahead comes from energy costs weighing on synthetic producers and from emissions regulation opening demand in markets without local capacity. Solvay has restructured European soda ash and bicarbonate operations in response to energy costs. Expect regional capacity investment rather than acquisitions. Rankings shift as emissions rules spread and as energy positions favour mined production. Concentration is unlikely to move much in either direction over the forecast period.
sodium-bicarbonate-market-trends-company-positioning-matrix-1787595216289

Competitive Moat and Risk Dimensions

SOLVAY

Moat: Plant network positioned near demand

Multiple production sites located close to European and other demand centres solve the freight problem that caps every competitor, since delivered cost rather than production cost decides who can serve a customer at all. That network took decades to build and cannot be replicated quickly by anybody arriving with a single efficient plant somewhere convenient.
SOLVAY

Risk: Synthetic route energy exposure

The Solvay process consumes roughly 42% more energy than mined production, which leaves the company exposed to European industrial energy prices that mined producers elsewhere entirely avoid. That gap is chemical rather than operational, so no plant efficiency programme closes it, and recent energy volatility demonstrated how quickly it damages competitive position.
TATA CHEMICALS

Moat: Mined and synthetic route breadth

Holding both mined trona operations and synthetic production across different geographies spreads energy exposure that single-route producers carry in full, and it positions the company on the favourable side of the cost curve wherever mined material can reach. Geographic breadth also addresses the freight constraint that limits everybody in this product.
TATA CHEMICALS

Risk: Regional demand cycle exposure

Freight economics mean each plant depends on demand within its own radius rather than on global consumption, so a regional industrial downturn cannot be offset by strength elsewhere. That is an inherent feature of the product rather than a management failure, and it makes plant siting decisions unusually difficult to reverse afterwards.

Players Tracked

Prominent Players

Solvay
Tata Chemicals
Sisecam Resources
Church and Dwight
Natural Soda

Other Key Players

Genesis Alkali
Novacarb
Tosoh
AGC
Shandong Haihua
Sisecam Chemicals
GHCL
DCW Limited
Nirma
Soda Sanayii
Bunge
Natrium Products
Kazan Soda Elektrik
Oriental Chemical Industries
Hubei Yihua

Recent Developments

MARCH 2026

Emissions rules extend acid gas control to further industrial sectors

Emissions regulation extended acid gas control requirements to additional industrial combustion sectors, creating dry sorbent injection demand at plants that had never previously required it. Producers with capacity within economic freight distance of those plants captured the resulting volume. Contracted volumes followed the compliance deadline closely.
Signal: Demand appears exactly where regulators decide, and only producers already positioned nearby can realistically serve it
OCTOBER 2025

Energy costs prompt European synthetic capacity restructuring

Sustained European industrial energy costs prompted restructuring of synthetic soda ash and bicarbonate capacity, with the energy intensity of the Solvay route making some sites uneconomic against alternatives. Mined producers elsewhere faced no comparable pressure across the same period. Relative cost positions moved without any demand change.
Signal: The energy gap between production routes is chemical rather than operational and cannot be closed by efficiency work
JANUARY 2026

Dialysis concentrate maker consolidates bicarbonate supply on qualification

A dialysis concentrate manufacturer consolidated bicarbonate supply onto fewer qualified producers, citing pharmacopoeia compliance documentation and batch consistency rather than delivered price. Producers treating the application as a minor technical grade line were not among those retained. Documentation depth decided the outcome rather than commercial terms.
Signal: Qualification rather than price decides dialysis supply, and most producers never pursue it seriously enough to matter

Soda Ash, Energy and Freight

Soda ash accounts for roughly 41% of synthetic production cost and is itself produced by energy intensive routes, which compounds the exposure. Process energy carries about 23% for synthetic production and considerably less for mined operations. Carbon dioxide supply, packaging and handling take around 14%. Outbound freight absorbs the balance and rises steeply with distance, which is why plant siting dominates delivered cost in this product.
European industrial energy costs rose sharply through 2022 and remained elevated, per IEA reporting for the period, which affected both soda ash input cost and direct process energy for synthetic producers simultaneously. Mined producers faced no comparable movement. That divergence reordered relative cost positions across the industry without any change in customer demand, which is unusual and was genuinely painful for European operations. The gap has not closed since.

Exposure divides on production route and on plant location. A synthetic producer carries soda ash and energy exposure across roughly two thirds of cost, while a mined operation carries mining, milling and freight instead. Location matters more than either, since freight beyond around 800 kilometres makes any cost advantage irrelevant to a customer who cannot economically receive the material at all.
sodium-bicarbonate-market-trends-cost-volatility-analysis-1787595216486

Contract energy and soda ash on multi-year indexed terms

Soda ash and process energy together carry around two thirds of synthetic production cost and both moved sharply during the last energy cycle. Multi-year contracting with indexation smooths an exposure that no operating improvement addresses. Producers buying at spot through that period lost cost position against mined competitors who faced nothing comparable at all.

Site new capacity by demand radius rather than input proximity

Freight beyond roughly 800 kilometres makes any production cost advantage irrelevant, since the customer simply cannot receive the material economically. Siting near demand beats siting near inputs almost every time in this product. Mapping demand growth against existing plant radii shows where a new plant would find customers already waiting for a closer supplier than they currently have.

Document embedded carbon where the route advantage exists

Mined production carries roughly 42% less process energy and a correspondingly lower embedded footprint, and customers have begun requesting that data for their own reporting. Documenting it properly costs little and reaches sustainability functions rather than procurement. Producers holding the advantage and not documenting it are giving away a differentiator that competitors cannot replicate.

Portfolio Architecture for Margin Defence

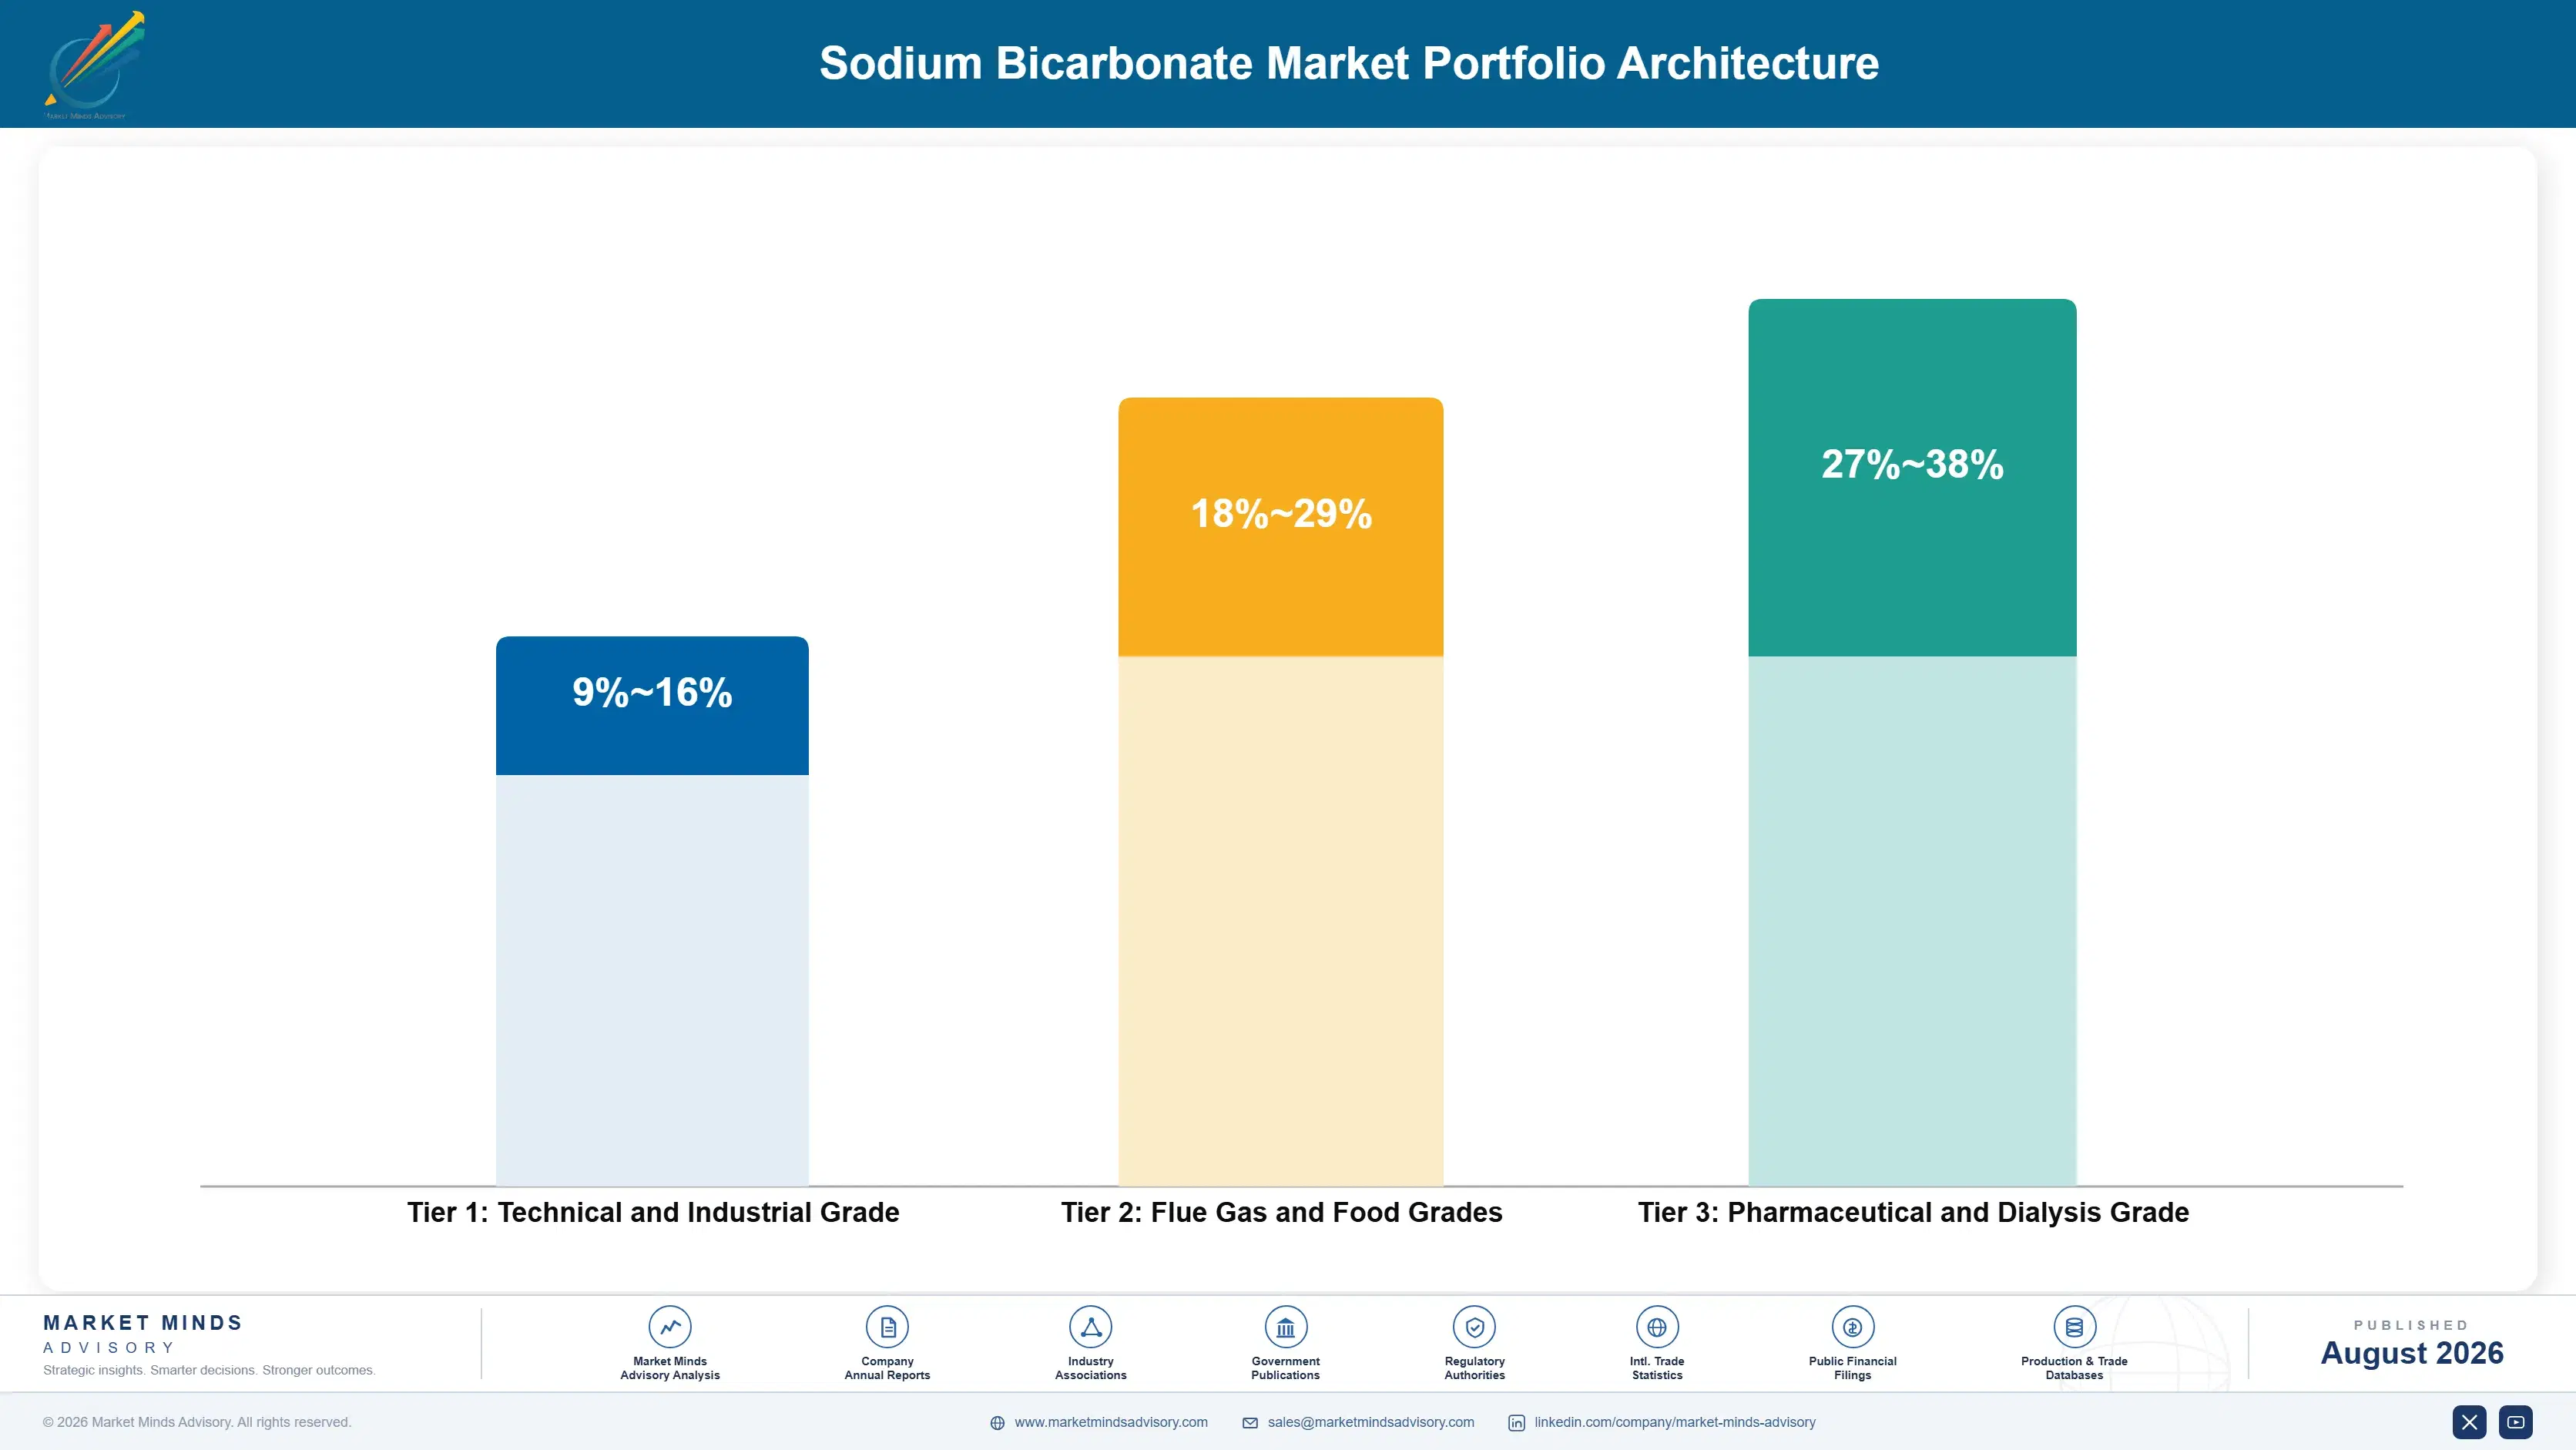
Margin here follows qualification and application rather than production route, since the molecule is identical and buyers cannot detect where it came from. Technical and industrial grade earns margins in the high single digits to mid teens, because any producer within freight range can supply it and customers compare delivered price directly against a common specification. That is a genuinely commoditised position.
Flue gas treatment and food grades do better in the high teens to high twenties, because particle size control and food safety documentation both require capability beyond basic production, and the customer relationships are considerably stickier once delivery logistics and specification are established properly. Neither grade is hard to make, but both take time to qualify into, and that delay is what protects the margin.

Pharmaceutical and dialysis grade holds the strongest position, reaching into the high thirties, because pharmacopoeia compliance and qualification into concentrate manufacture create switching costs that delivered price never overcomes. Those margins reflect documentation and qualification rather than any difference in the chemistry, and most producers have never pursued them. It remains the most defensible position in the business and the least contested.

Technical and Industrial Grade

Standard grade supplied against common specifications within freight range. The seven point range reflects production route and plant location rather than any product difference customers could detect at all. Delivered price decides every award.
Gross Margin: 9-16%

Flue Gas and Food Grades

Milled sorbent and food safety certified material requiring capability beyond basic production. The eleven point range reflects particle size control, documentation depth and how established the delivery logistics are. Qualification takes time rather than capital.
Gross Margin: 18-29%

Pharmaceutical and Dialysis Grade

Pharmacopoeia compliant material qualified into dialysis concentrate and pharmaceutical manufacture. The eleven point range reflects qualification depth and documentation rather than any difference in the chemistry supplied. Switching happens very rarely indeed here.
Gross Margin: 27-38%
sodium-bicarbonate-market-trends-portfolio-architecture-1787595216977

High-value Sub-segments and Strategic Watch-out

Pharmaceutical and Dialysis Grade

High value and growing at 5.8% on treated patient populations that rise regardless of economic conditions. Qualification into concentrate manufacture creates switching costs that delivered price arguments never manage to overcome. Most producers run it as a minor line and never pursue the qualification properly.
Gross Margin: 29-38%

Flue Gas Treatment Grade

High value and the fastest growth at 6.9%, created entirely by emissions regulation rather than by any industrial output measure. Volumes per plant are substantial and the consumption is continuous once established. Regulatory tracking rather than industrial output identifies where the next customer will appear.
Gross Margin: 20-30%

Technical and Industrial Grade

The volume core, where any producer within freight range supplies an identical specification and customers compare delivered price directly. Plant location rather than production efficiency decides who can even quote. Margins are thin and there is no realistic route to differentiating the material itself. Location decides everything.
Gross Margin: 9-16%

Synthetic Route Energy Exposure

The strategic watch-out. The Solvay process carries roughly 42% more process energy than mined production, and the range reflects how far a producer has hedged or diversified that route cost gap. Energy contracting reduces the exposure without ever removing it. The exposure is chemical rather than operational.
Gross Margin: 4-24%

Regulators and Radii

Demand here is created by three quite separate forces. Emissions regulation creates dry sorbent volume at specific plants on specific compliance dates, which is entirely predictable if a producer follows rulemaking rather than industrial output. Dialysis populations grow steadily with chronic disease prevalence. Food, feed and industrial applications track their own end markets and have been broadly flat for years.
Stickiness follows qualification and logistics rather than any commercial arrangement. A dialysis concentrate manufacturer will not requalify a bicarbonate supplier casually, and a dry sorbent customer with established milling specification and delivery logistics has little reason to change. Technical grade switches on delivered price at every renewal, since the material is genuinely identical and freight decides who can compete.

The deciding function varies sharply by application. Environmental and compliance managers specify dry sorbent supply against regulatory requirements. Quality and regulatory affairs decide pharmaceutical qualification. Procurement handles technical grade against delivered cost. A producer addressing the wrong function for the grade is wasting effort, and it happens more often than it should. Sales teams organised by geography rather than by purity grade tend to make this particular mistake most consistently of all.
sodium-bicarbonate-market-trends-end-use-penetration-index-1787595217464

Where We Would Focus Effort

These are among the four positions where our research anticipates prominent divergence between winners and laggards over the coming forecast period. Each is grounded in the demand model, the regulatory perimeter, and the announced capacity pipeline.
01 / REGULATORY DEMAND TRACKING

Follow the rulemaking, not the output data

Dry sorbent injection demand appears when a regulator requires acid gas control at a waste incineration, cement, glass or biomass combustion plant, and it grows at 6.9% against a market rate of 4.6% on exactly that basis. Following regulatory development identifies where demand will arrive before the plant operator has even started looking for a supplier to serve it. Producers watching industrial output statistics are watching a variable that does not predict this demand at all, and they consistently miss where new volume is appearing.
02 / DIALYSIS POSITION DEVELOPMENT

The best niche nobody bothers to pursue

Haemodialysis consumes around 180 kilograms of bicarbonate per patient annually at pharmacopoeia purity, qualified into concentrate manufacture in a way that makes switching genuinely difficult once established. Treated populations rise steadily with chronic disease prevalence regardless of industrial cycles or economic conditions. Most producers run this as a small line inside a technical grade business and never pursue it properly, which leaves a defensible higher value position considerably underdeveloped across the whole industry, despite a qualification barrier that would comfortably support far stronger margins.
03 / PLANT SITING DISCIPLINE

Delivered cost beyond the radius is irrelevant

Delivered cost becomes uncompetitive beyond roughly 800 kilometres from a plant, which makes siting the single most consequential decision in this business and explains why concentration sits at only 48% after decades. Growth therefore requires new capacity positioned near demand rather than better logistics from existing plants somewhere else. Mapping demand growth against competitor plant radii identifies exactly where a new plant would find customers already waiting for a closer supplier than the one they currently have to accept on delivered cost grounds.
04 / CARBON ADVANTAGE PRICING

You are giving away a real differentiator

Mined production carries roughly 42% less process energy and a materially lower embedded carbon footprint than the synthetic route, and customers have started requesting that data for their own scope three reporting requirements. The difference is real, documented and currently handed over for nothing by the producers who actually hold it. Pricing it explicitly reaches sustainability functions rather than procurement, which is a genuinely different conversation with a different budget behind it, and one that procurement teams almost never control or even see.

Engagement Snapshot From the Field

A live engagement with an industry participant carrying material or product regulatory and market exposure ahead of a defining policy shift, showing how our research translates into a defensible multi-year portfolio strategy.
MARKET MINDS ADVISORY · CLIENT ENGAGEMENT SUMMARY
Sodium Bicarbonate Producer Strategic Portfolio Review and Transition Roadmap 2026·Investment Scenario on Sodium Bicarbonate Exposure Evaluation 2025-26
CLIENT PROFILE
A European sodium bicarbonate producer operating two synthetic plants supplying industrial, food and feed customers across five countries, at annual revenue near 84 million euros (client-reported, unverified by MMA). Dialysis grade was produced as a minor line, dry sorbent supply was opportunistic, and energy exposure had never been hedged systematically. Management had never separated route economics from operating performance.
STRATEGIC CHALLENGE
Energy cost increases had compressed margins severely across two years while mined competitors appeared unaffected, and management were considering closing the smaller plant. The board wanted to understand whether the problem was plant efficiency, route economics or portfolio mix before committing to a closure. Two plants were under review and the timeline was short.
MMA APPROACH
MMA separated energy exposure from operating performance across both plants, mapped demand growth against plant freight radii and competitor positions, sized dry sorbent demand appearing under forthcoming emissions rules, and assessed dialysis qualification requirements against the client's existing capability. Interviews with 47 experts covered inorganic chemical production, emissions control and dialysis concentrate manufacture.
KEY FINDINGS
  1. Margin compression was almost entirely route economics rather than plant efficiency, since both plants ran comparably well against synthetic industry benchmarks throughout the period.
  2. Forthcoming emissions rules would create substantial dry sorbent demand within the smaller plant's freight radius, which the closure analysis had not considered at all.
  3. Dialysis grade qualification was achievable within existing capability and reached demand growing independently of the industrial cycles damaging the rest of the portfolio.
  4. No competitor plant sat within economic freight distance of the demand the smaller plant could serve, which made its location considerably more valuable than its current utilisation suggested.
CLIENT PROFILE
A European sodium bicarbonate producer operating two synthetic plants supplying industrial, food and feed customers across five countries, at annual revenue near 84 million euros (client-reported, unverified by MMA). Dialysis grade was produced as a minor line, dry sorbent supply was opportunistic, and energy exposure had never been hedged systematically. Management had never separated route economics from operating performance.
STRATEGIC CHALLENGE
Energy cost increases had compressed margins severely across two years while mined competitors appeared unaffected, and management were considering closing the smaller plant. The board wanted to understand whether the problem was plant efficiency, route economics or portfolio mix before committing to a closure. Two plants were under review and the timeline was short.
MMA APPROACH
MMA separated energy exposure from operating performance across both plants, mapped demand growth against plant freight radii and competitor positions, sized dry sorbent demand appearing under forthcoming emissions rules, and assessed dialysis qualification requirements against the client's existing capability. Interviews with 47 experts covered inorganic chemical production, emissions control and dialysis concentrate manufacture.
KEY FINDINGS
  1. Margin compression was almost entirely route economics rather than plant efficiency, since both plants ran comparably well against synthetic industry benchmarks throughout the period.
  2. Forthcoming emissions rules would create substantial dry sorbent demand within the smaller plant's freight radius, which the closure analysis had not considered at all.
  3. Dialysis grade qualification was achievable within existing capability and reached demand growing independently of the industrial cycles damaging the rest of the portfolio.
  4. No competitor plant sat within economic freight distance of the demand the smaller plant could serve, which made its location considerably more valuable than its current utilisation suggested.
RECOMMENDED STRATEGY
Phase 1: Phase one: retain the smaller plant, since forthcoming emissions demand within its freight radius makes the location valuable regardless of current utilisation. Phase 2: Phase two: pursue dialysis grade qualification properly, reaching demand that rises independently of the industrial cycles compressing the rest of the business. Phase 3: Phase three: hedge energy and soda ash exposure systematically, since route economics rather than operating performance caused the margin compression.
OUTCOME
The producer retained both plants and began dialysis qualification during 2026, reporting dry sorbent enquiries arriving ahead of the emissions compliance date (client-reported, unverified by MMA). Energy exposure was hedged on multi-year terms, and margin volatility fell substantially thereafter. Dialysis grade reached first qualified supply during the following year.

Frequently Asked Questions

Foundational context covering the market sizes, CAGR, scope, country, region and competition that inform every finding below. This section is provided to cover basics and most often pre-purchase conversations, answered from the MMA Primary Research Dataset.

What is the current size of the Sodium Bicarbonate Market?

MMA sizes it at USD 1.68 billion in 2025, rising to USD 1.76 billion in 2026. The figure covers sodium bicarbonate across purity grades at producer selling value from both production routes.

How large will the Sodium Bicarbonate Market be by 2036?

USD 2.76 billion by 2036, an incremental USD 1.00 billion over the 2026 base and an expansion multiple of 1.57 times. Flue gas treatment accounts for a disproportionate share.

What is the CAGR for the Sodium Bicarbonate Market 2026 to 2036?

4.6% in the base case, with a bull case at 5.8% and a bear case at 3.4%. The spread turns on emissions regulation spreading and on energy costs affecting synthetic production.

Which segment is growing fastest?

Flue gas treatment grade at 6.9%, half again the market rate of 4.6%. Dry sorbent injection removes around 96% of acid gases and consumes the product entirely.

Who are the major companies in the Sodium Bicarbonate Market?

Solvay, Tata Chemicals, Sisecam Resources, Church and Dwight and Natural Soda lead on production volume. Fifteen further participants are profiled in the full report on that basis.

Which country is growing fastest?

India at 8.0%, with industrial, food and pharmaceutical demand all expanding as manufacturing modernises and packaged food penetration rises across urban markets. Domestic capacity is expanding to meet it.

Report Segmentation Architecture

The full report scope spans multiple orthogonal segmentation dimensions, with cross-tabulated demand data provided for each dimension pair. Coverage extends further to regional breakdowns, trend trajectories, and the competitive detail needed to support segment-level decision-making.

By Purity Grade

  • Technical and Industrial Grade
  • Flue Gas Treatment Grade
  • Food Grade
  • Feed Grade
  • Pharmaceutical and Dialysis Grade
  • Personal Care and Detergent Grade

By End-Use Industry

  • Industrial Emissions Control
  • Food and Beverage Manufacture
  • Animal Feed Production
  • Pharmaceutical and Dialysis
  • Personal Care and Detergents
  • Chemical and Water Treatment

By Commercial Dimension

  • Direct Bulk Supply Contracts
  • Distributor and Blender Channels
  • Qualified Pharmaceutical Supply
  • Emissions Compliance Programmes
  • Private Label Consumer Supply
  • Export and Cross-Border Supply

By Region

  • North America
  • Western Europe
  • East Asia
  • South Asia and Pacific
  • Latin America
  • Middle East and Africa
  • Eastern Europe

Scope, Methodology, and Coverage

Every figure in this report is reproducible from documented input assumptions. The scope below maps the historical period, the forecast horizon, the segmentation dimensions, and the countries covered, alongside the underlying primary and qualitative methodology.
Historical Period
2020 to 2025
Forecast Period
2026 to 2036
Base Year
2025 (USD billions; MMA Primary Research Dataset, August 2026)
Market Definition
Sodium bicarbonate supplied across purity grades and applications, covering technical and industrial grade, flue gas treatment grade, food grade, feed grade, pharmaceutical and dialysis grade, and personal care and detergent grade. Measured at producer selling value across both synthetic and mined production routes. Soda ash sold as such, other sodium chemicals, finished consumer baking products, and dialysis concentrate solutions sold as prepared medical products are excluded from scope.
Quantitative Units
USD billions (current prices); million tonnes produced; USD per tonne by purity grade
Segmentation Dimensions
Purity grade; end-use industry; commercial dimension; region
Regions Covered
North America, Western Europe, East Asia, South Asia and Pacific, Latin America, Middle East and Africa, Eastern Europe
Countries Covered
United States, Canada, Mexico, Germany, France, Italy, Spain, Netherlands, China, Japan, South Korea, India, Indonesia, Australia, Brazil, Argentina, Turkey, South Africa, Poland, Bulgaria
Key Companies Profiled
Solvay, Tata Chemicals, Sisecam Resources, Church and Dwight, Natural Soda, Genesis Alkali, Novacarb, Tosoh, AGC, Shandong Haihua, Sisecam Chemicals, GHCL, DCW Limited, Nirma, Soda Sanayii, Bunge, Natrium Products, Kazan Soda Elektrik, Oriental Chemical Industries, Hubei Yihua
Quantitative Methodology
Primary survey, n=3,800 respondents, Q4 2025, six countries; demand-side model with trade association cross-validation
Qualitative Methodology
47 expert interviews, Q4 2025; applied to validate demand model assumptions, identify emerging dynamics, and assess competitive positioning
Report Format
PDF and XLSX data workbook (Word format preview document)
Publisher
Market Minds Advisory
Report Code
MMA-2026-CHM-137
Published
August 2026
Contact
sales@marketmindsadvisory.com | www.marketmindsadvisory.com

Purchase the full Sodium Bicarbonate Market Report (2026 to 2036).

The full report forecasts dry sorbent demand from regulatory development rather than from industrial output, because that is the only variable that actually predicts it. It sizes all six purity grades independently through 2036, maps plant freight radii against demand growth to identify where capacity is genuinely needed, and separates synthetic from mined route economics under energy price scenarios. Regional chapters cover all seven regions with emissions regulation status assessed alongside production capacity. Competitive profiling covers 20 participants on a single production volume basis. Dialysis qualification requirements are assessed separately.
Six purity grades sized independently through 2036
Dry sorbent demand forecast from regulatory development directly
Plant freight radii mapped against demand growth by region
Synthetic and mined route economics separated under energy scenarios
Twenty participants profiled on one consistent volume basis
Dialysis qualification requirements assessed across producer capability

Built For The People Who Decide

From boardroom strategy to bench-side execution, this report is read cover-to-cover by leaders shaping the next decade of their industry, turning demand scenarios, market dynamics and valuation benchmarks into decisions.
CXOs/ Presidents/ VPs/ Managers
M&A and Corporate Development
Strategy Teams and R&D Heads
Procurement and Product Directors
Regulatory and Compliance Leaders
Investor Relations and Equity Analysts