Market Minds Advisory
Soda Ash Market

Soda Ash Market: Natural versus synthetic cost divergence, glass demand and lithium carbonate pull

Two production routes compete for the same customers with entirely different cost structures and carbon footprints, and the gap between them widens every time energy prices or carbon pricing move in any direction.

Lead Analyst

Bilal Shaikh

Published

September 2026

Make Smarter Decisions with Customized Research Insights

Request a free sample report and evaluate market opportunities, growth trends, and competitive dynamics relevant to your business needs.

2025 MARKET VALUE$22.6BMarket Size 2025
2036 FORECAST VALUE$37.5BBase Case , 2026 to 2036
CAGR 2026 TO 20364.7 %Bull 5.9% / Bear 3.4%
INCREMENTAL OPPORTUNITY$13.8BNet 10- year value creation
EXPANSION MULTIPLE1.58x2036 value over 2026 base
Strategic Levers
M&A Pipeline
Regional Outlook
Country Rankings
Competitive Intelligence
Segmental Deep-dive
Call-Us : 91 93563 13602

Executive Snapshot and Market Trajectory

Soda ash is one product made two entirely different ways, and the gap between them has stopped being a footnote. Natural trona production uses roughly half the energy of the synthetic route and emits far less carbon dioxide, which is now a market access question rather than an accounting one.
Growth concentrates in battery and lithium processing grade, expanding at 7.1%, where lithium carbonate conversion consumes soda ash in quantities that barely registered a decade ago and where impurity limits exceed what ordinary glass grade supply can reliably meet. East Asia holds 33% of value, the largest regional share, because Chinese flat and container glass manufacture consumes more soda ash than any other market and because domestic synthetic capacity was built alongside it.
The supplier base is moderately concentrated, with the top five holding 39% of production capacity, and it divides between natural trona producers, synthetic Solvay operators and Chinese producers running both routes at scale. Competition runs on production route economics rather than on product, which is chemically identical everywhere. Carbon pricing is the force now steadily widening a cost gap that was already substantial to begin with.
Market Definition
Soda ash comprises sodium carbonate produced by natural trona or nahcolite processing and by the synthetic ammonia-soda route, spanning dense glass grade, light industrial grade, battery and lithium processing grade, detergent grade, chemical intermediate grade, and refined and specialty grades. Sizing covers soda ash sold or transferred to industrial users at realised delivered price. Sodium bicarbonate produced as a separate product, caustic soda and other alkalis, sodium silicate and downstream sodium chemicals, calcium chloride co-product, and glass or lithium products themselves all fall outside scope.
Base Year Value
$22.6B in 2025 (MMA Primary Research Dataset, August 2026)
Forecast Period
2026 to 2036, eleven discrete annual values
CAGR
4.7% base case. Bull 5.9%. Bear 3.4%.
Fastest Growth Segment
Battery and Lithium Processing Grade: 7.1% CAGR
Fastest Growth Country
India: 7.0% CAGR
Fastest Growth Region
South Asia and Pacific: 7.0% CAGR
Largest Region
East Asia: 33% of 2025 global value
Market Leaders
Solvay, Ciner Resources, Tata Chemicals, Genesis Energy and Shandong Haihua lead on soda ash production capacity across natural and synthetic routes. Source: MMA Primary Research Dataset, July 2026.
Primary Survey
n=3,800 procurement and R&D decision-makers, Q4 2025, six countries
Methodology
Demand-side build-up, cross-validated against public data, 47 expert interviews

Soda Ash Market Forecast Scenarios

soda-ash-market-trends-size-forecast-scenario-1787311156339
Growth of 3.5% across 2020 to 2025 covered a violent redrawing of the regional cost map. Glass demand collapsed through 2020 and recovered from 2021, while European energy prices through 2022 pushed synthetic Solvay operations below cash cost and closed several permanently. Chinese capacity additions arrived across the same window, and Turkish natural trona expansion changed the seaborne trade balance considerably more than anybody had modelled.
The base case at 4.7% rests on three mechanisms. Flat glass demand keeps growing with construction and with solar module manufacture, which consumes soda ash at a rate photovoltaic capacity additions have made material. Lithium carbonate conversion consumes soda ash in volumes that were negligible a decade ago and are now a distinct grade requirement. And container glass demand keeps rising across emerging markets as formal retail and packaged beverage consumption expand together.
The bull case at 5.9% turns on solar glass and lithium conversion capacity commissioning faster than currently modelled, since both pull soda ash through supply chains that are already regionally tight. The bear case at 3.4% turns on glass substitution. Continued container glass lightweighting and displacement by polyethylene terephthalate and aluminium would remove volume from the largest application this market has.

Soda ash: two production routes, one identical product

One product, two production routes, and a cost gap that keeps widening. Natural trona processing consumes roughly 48% less energy per tonne than the synthetic ammonia-soda route and emits far less carbon dioxide, because it starts from a mineral already most of the way to sodium carbonate rather than manufacturing the compound from salt and limestone. That is chemistry, not operating practice.
TOP FIVE CONCENTRATION39%Share of global soda ash production capacity held collectively
NATURAL ROUTE ENERGY ADVANTAGE48% lowerEnergy consumed against the synthetic ammonia soda route
GLASS APPLICATION SHARE54% of volumeLargest single application by consumed soda ash tonnage
SYNTHETIC ROUTE CARBON INTENSITY1.2 t CO2/tEmissions generated producing each tonne by that route
NATURAL CAPACITY SHARE29%Portion of global capacity using trona or nahcolite
ECONOMIC DELIVERY RADIUS2,000 kmDistance beyond which delivered dense grade economics weaken
That difference used to be a regional curiosity and has now become a hard competitive fact. Synthetic operations carry around 1.2 tonnes of carbon dioxide per tonne produced, which sits inside European emissions trading and increasingly inside border adjustment calculations, while natural producers in the United States and Turkey face nothing comparable at all and hold a delivered cost advantage even after paying ocean freight.
Demand divides by how demanding the glass is. Flat, container and specialty glass together take 54% of volume and buy dense grade on delivered cost. Lithium processing, refined chemical and battery applications sit in a different world entirely, where impurity limits rather than delivered price govern the specification, and where the qualified supplier field narrows very sharply indeed.
"Everybody in this industry knows the natural route is cheaper and most synthetic operators still model their future as though carbon pricing will stay where it is. It will not, and the plants that survive the next decade are being chosen right now by policy rather than by anybody's cost programme."
Director, Inorganic Chemicals and Industrial Minerals Practice · MMA Chemicals a

Market Trends

Carbon pricing widening the natural against synthetic cost divergence

Synthetic ammonia-soda production emits roughly 1.2 tonnes of carbon dioxide per tonne of soda ash, most of it process emissions from limestone calcination that no fuel switch removes. Natural trona processing emits a fraction of that because the mineral is already most of the way to sodium carbonate. European emissions trading has already priced part of that difference and border adjustment extends it to imports, which converts a long-standing cost gap into a market access question. Synthetic operators facing full carbon cost are being priced out of exactly the markets their plants were built to serve.
Market Impact: Adds demand across 54% glass share
Lithium carbonate conversion creating a distinct grade requirement

Converting lithium sulphate or chloride solutions into battery grade lithium carbonate consumes soda ash directly, at volumes that barely registered a decade ago and now support dedicated grade specifications. Impurity limits on calcium, magnesium, sulphate and chloride exceed anything glass manufacture requires, because every contaminant carries through into cathode material performance. Conversion plants site near lithium resources rather than near soda ash producers, which creates awkward logistics and unusually strong pricing for anybody qualified nearby. Very few producers anywhere have built the refining capability that battery grade specification actually demands of them.
Market Impact: Grows 7.0% annually across India

Market Opportunities and Growth Drivers

Solar module manufacture consuming flat glass at rising volumes

Photovoltaic module production requires low-iron flat glass on both front and back sheets in modern bifacial designs, and every gigawatt of module capacity consumes soda ash through that glass at a rate the industry only began tracking recently. Solar glass capacity has been commissioned largely in China alongside module manufacture, which concentrates the demand geographically. Flat glass applications now account for a substantial share of the 54% that glass takes overall. Module capacity additions therefore translate into soda ash demand with a lag of roughly a year through the glass supply chain.
Market Impact: Consumes 48% more energy per tonne

Container glass demand rising with emerging market formal retail

Packaged beverage, food and pharmaceutical container glass consumption keeps rising across South Asia, Southeast Asia and Africa as formal retail distribution and cold chain expand, and glass retains the applications where barrier properties and consumer preference both favour it over the alternatives. Container glass furnaces are long-lived assets consuming soda ash continuously once commissioned, which makes that demand unusually predictable across whole decades. Indian container and flat glass capacity additions drive soda ash demand at 7.0% annually. That growth partly offsets the developed market lightweighting and packaging substitution happening elsewhere.
Market Impact: Erodes 54% largest application shar

Market Restraints and Challenges

Synthetic route carbon and energy exposure threatening plant viability

The ammonia-soda route consumes roughly twice the energy of natural processing and generates process carbon dioxide from limestone calcination that no efficiency measure removes. The root cause is stoichiometric rather than operational, which is why more than a century of process development has not closed the gap with trona. Commercially this leaves synthetic operators facing full carbon cost unable to compete against natural producers even after ocean freight. Participants are responding with carbon capture pilots, calcium chloride co-product valorisation, energy efficiency programmes and in several cases permanent closure of the least competitive plants.
Market Impact: Emits 1.2 tonnes carbon per tonne

Container glass lightweighting and substitution eroding the largest application

Container glass has been lightweighted steadily for decades and continues losing applications to polyethylene terephthalate and aluminium, both of which cost less to transport and break less often in distribution. The root cause is packaging economics rather than any glass performance issue, which means no glass industry response recovers the lost volume. Commercially this erodes the largest single soda ash application in developed markets even as emerging market consumption grows. Producers are responding by following container glass growth into emerging markets and by developing lithium, chemical and specialty grade positions instead.
Market Impact: Grows 7.1% annually through 2036
2 additional market trends, 4 additional growth drivers, and 3 additional restraints and challenges are covered in the full report. Contact sales@marketmindsadvisory.com to access the complete intelligence.

Segment CAGR and Growth Architecture

Segmentation follows the grade and purity class, because bulk density, impurity limits and refining requirements determine which application a product can serve, what qualification it needs and what price it commands. Six grades cover the whole market, running from dense glass grade through light industrial and detergent classes to the battery, chemical and refined specialty specifications.
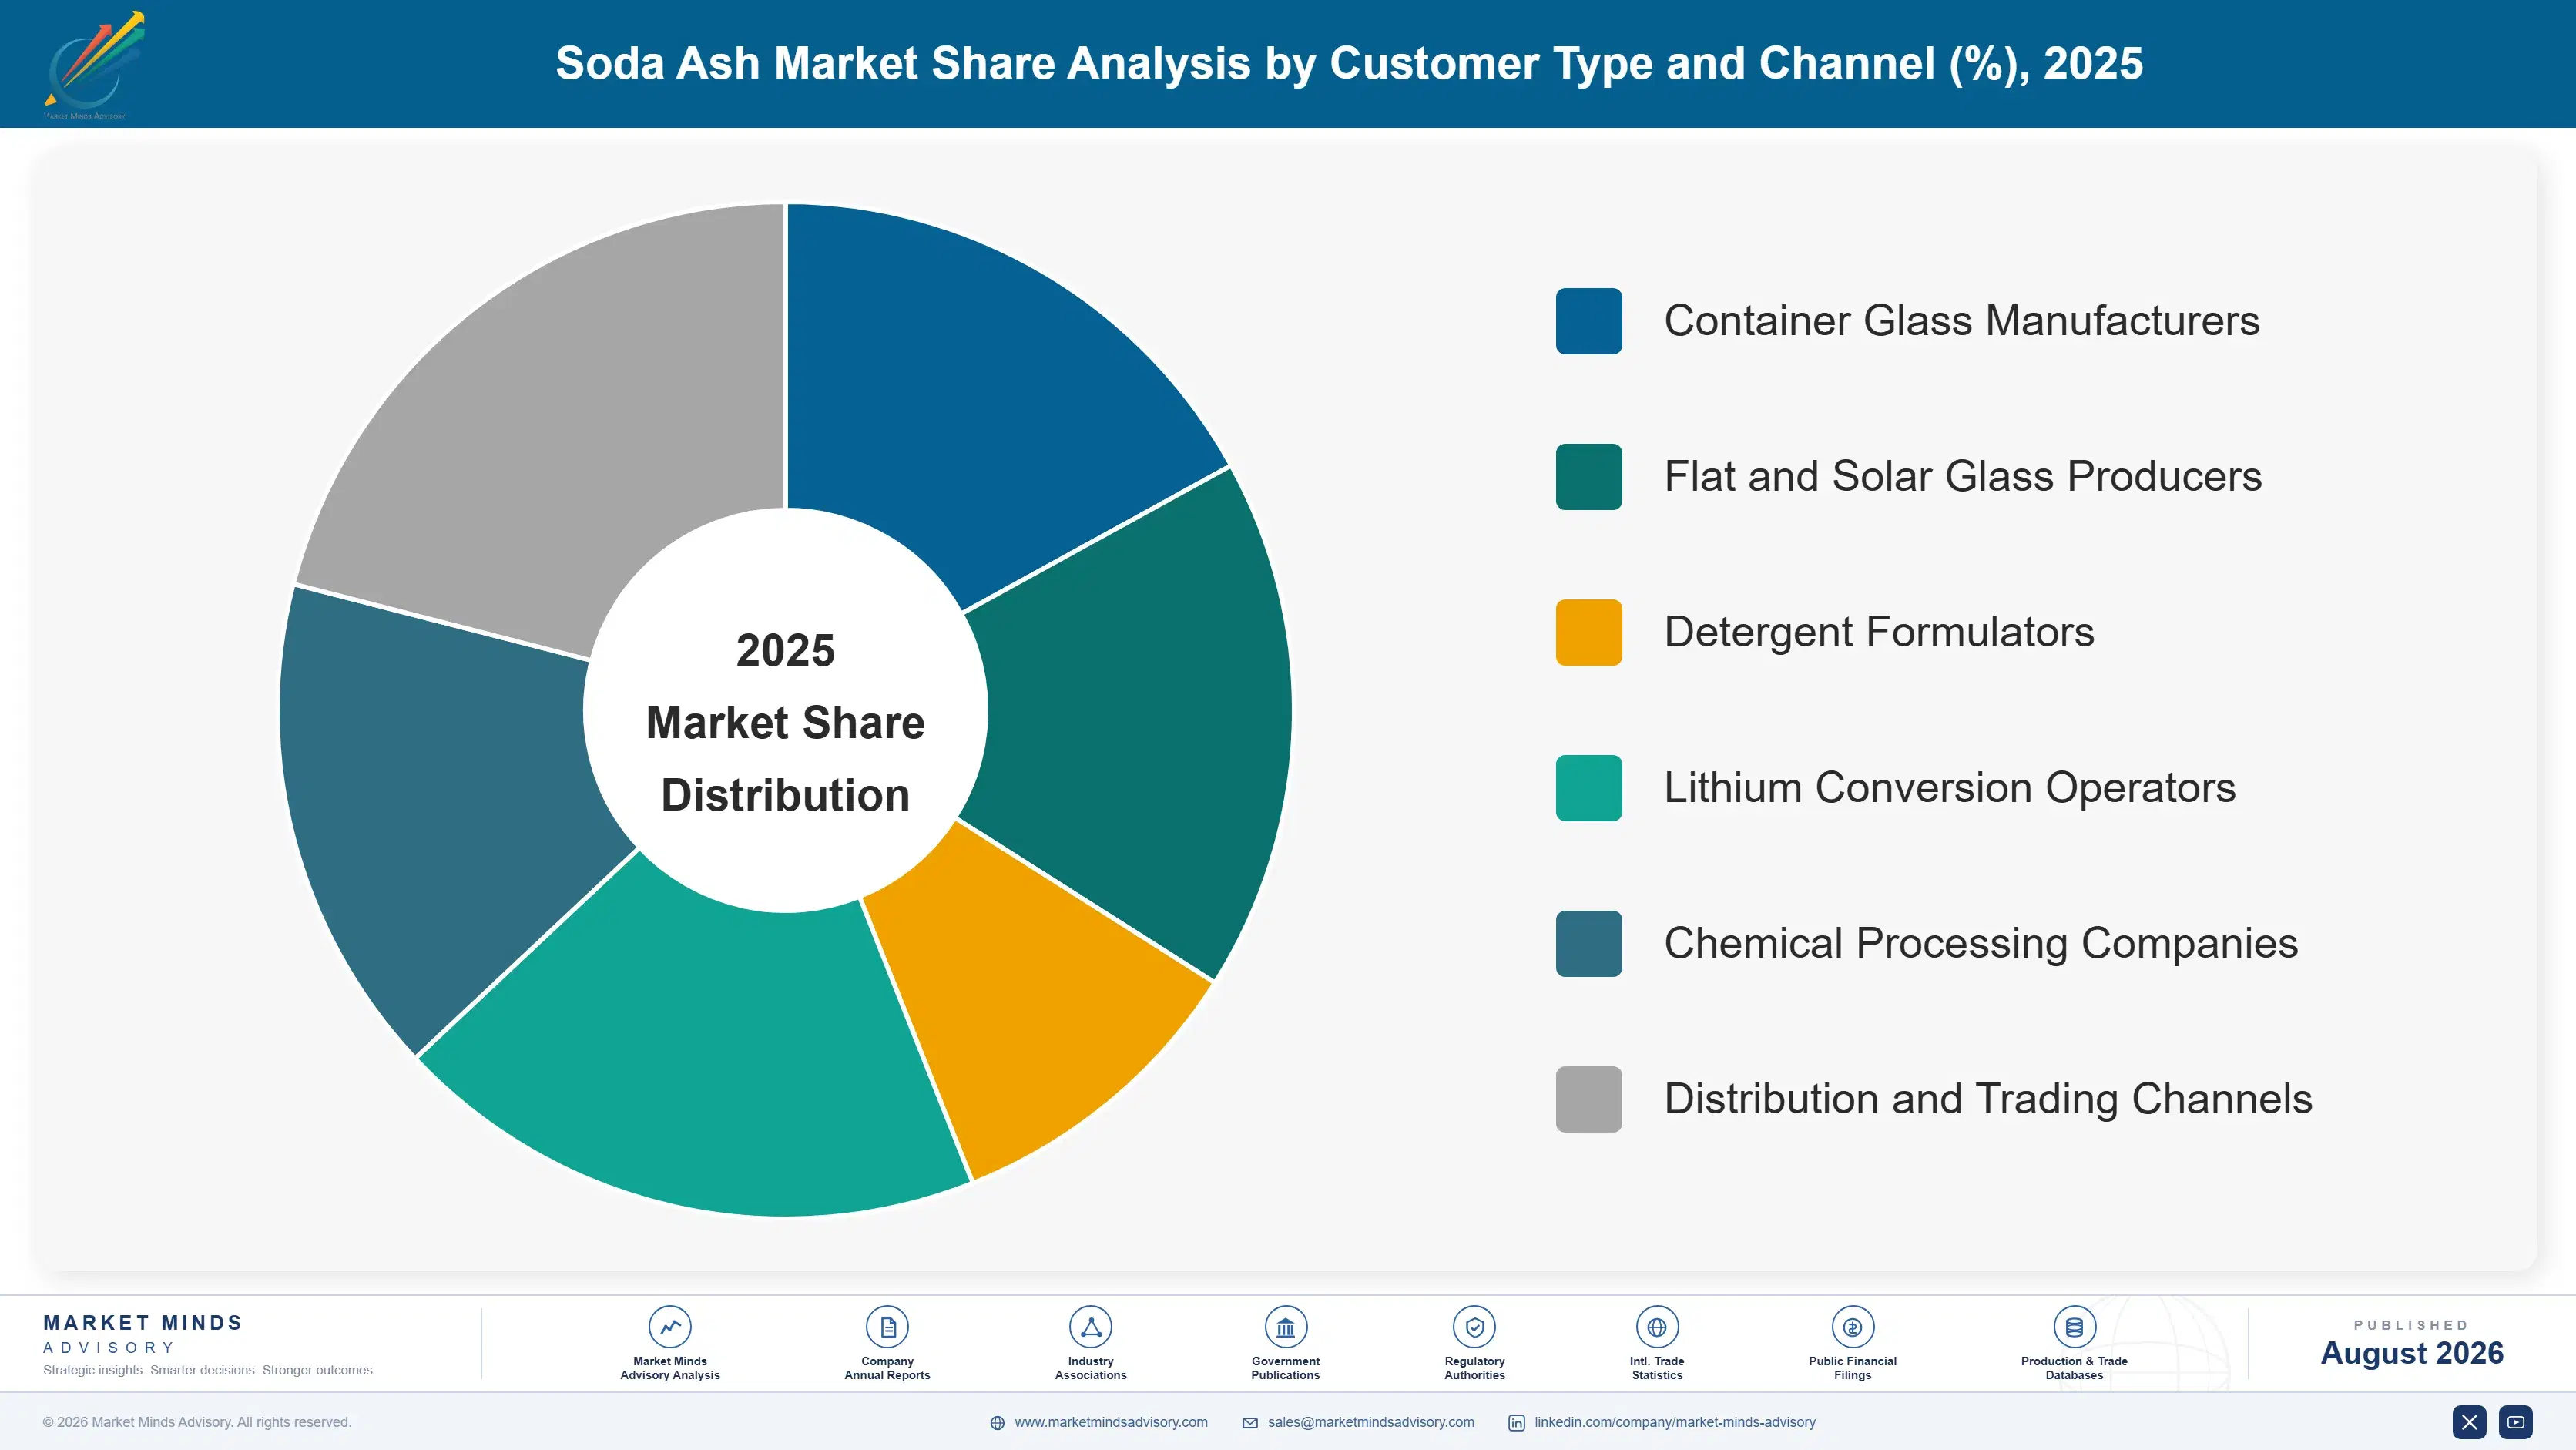
soda-ash-market-trends-market-share-analysis-1787311156937

Battery and Lithium Processing Grade

Expanding at 7.1%, a full 1.51 times the market rate, on material meeting calcium, magnesium, sulphate and chloride limits that exceed anything glass manufacture has ever required, because every contaminant carries straight through into the lithium carbonate and then into cathode performance itself. Lithium conversion plants site near the resource rather than near soda ash capacity, which creates genuinely awkward logistics and unusually strong pricing for any qualified producer that happens to sit nearby. Volumes here were negligible a decade ago and now support dedicated grade specifications and formal qualification programmes. Very few producers have built the refining capability the specification actually demands, which is exactly what keeps the qualified field so narrow.
CAGR 7.1%

Refined and Specialty Grades

Growing at 6.3% annually on refined material serving the pharmaceutical, food, water treatment and specialty chemical applications where the heavy metal limits, particle size distribution and documented manufacturing practice all govern selection rather than delivered cost alone. Sodium bicarbonate producers, pharmaceutical formulators and food processors between them all specify grades that ordinary glass supply simply cannot meet at all without additional refining steps applied first. Realised pricing runs well above dense glass grade, reflecting both the additional refining cost involved and a qualified supplier field that stays genuinely narrow everywhere. Demand here simply tracks pharmaceutical, food processing and water treatment activity rather than following any glass or construction cycle whatsoever.
CAGR 6.3%
Full segment breakdown across 6 segments available in the complete report.

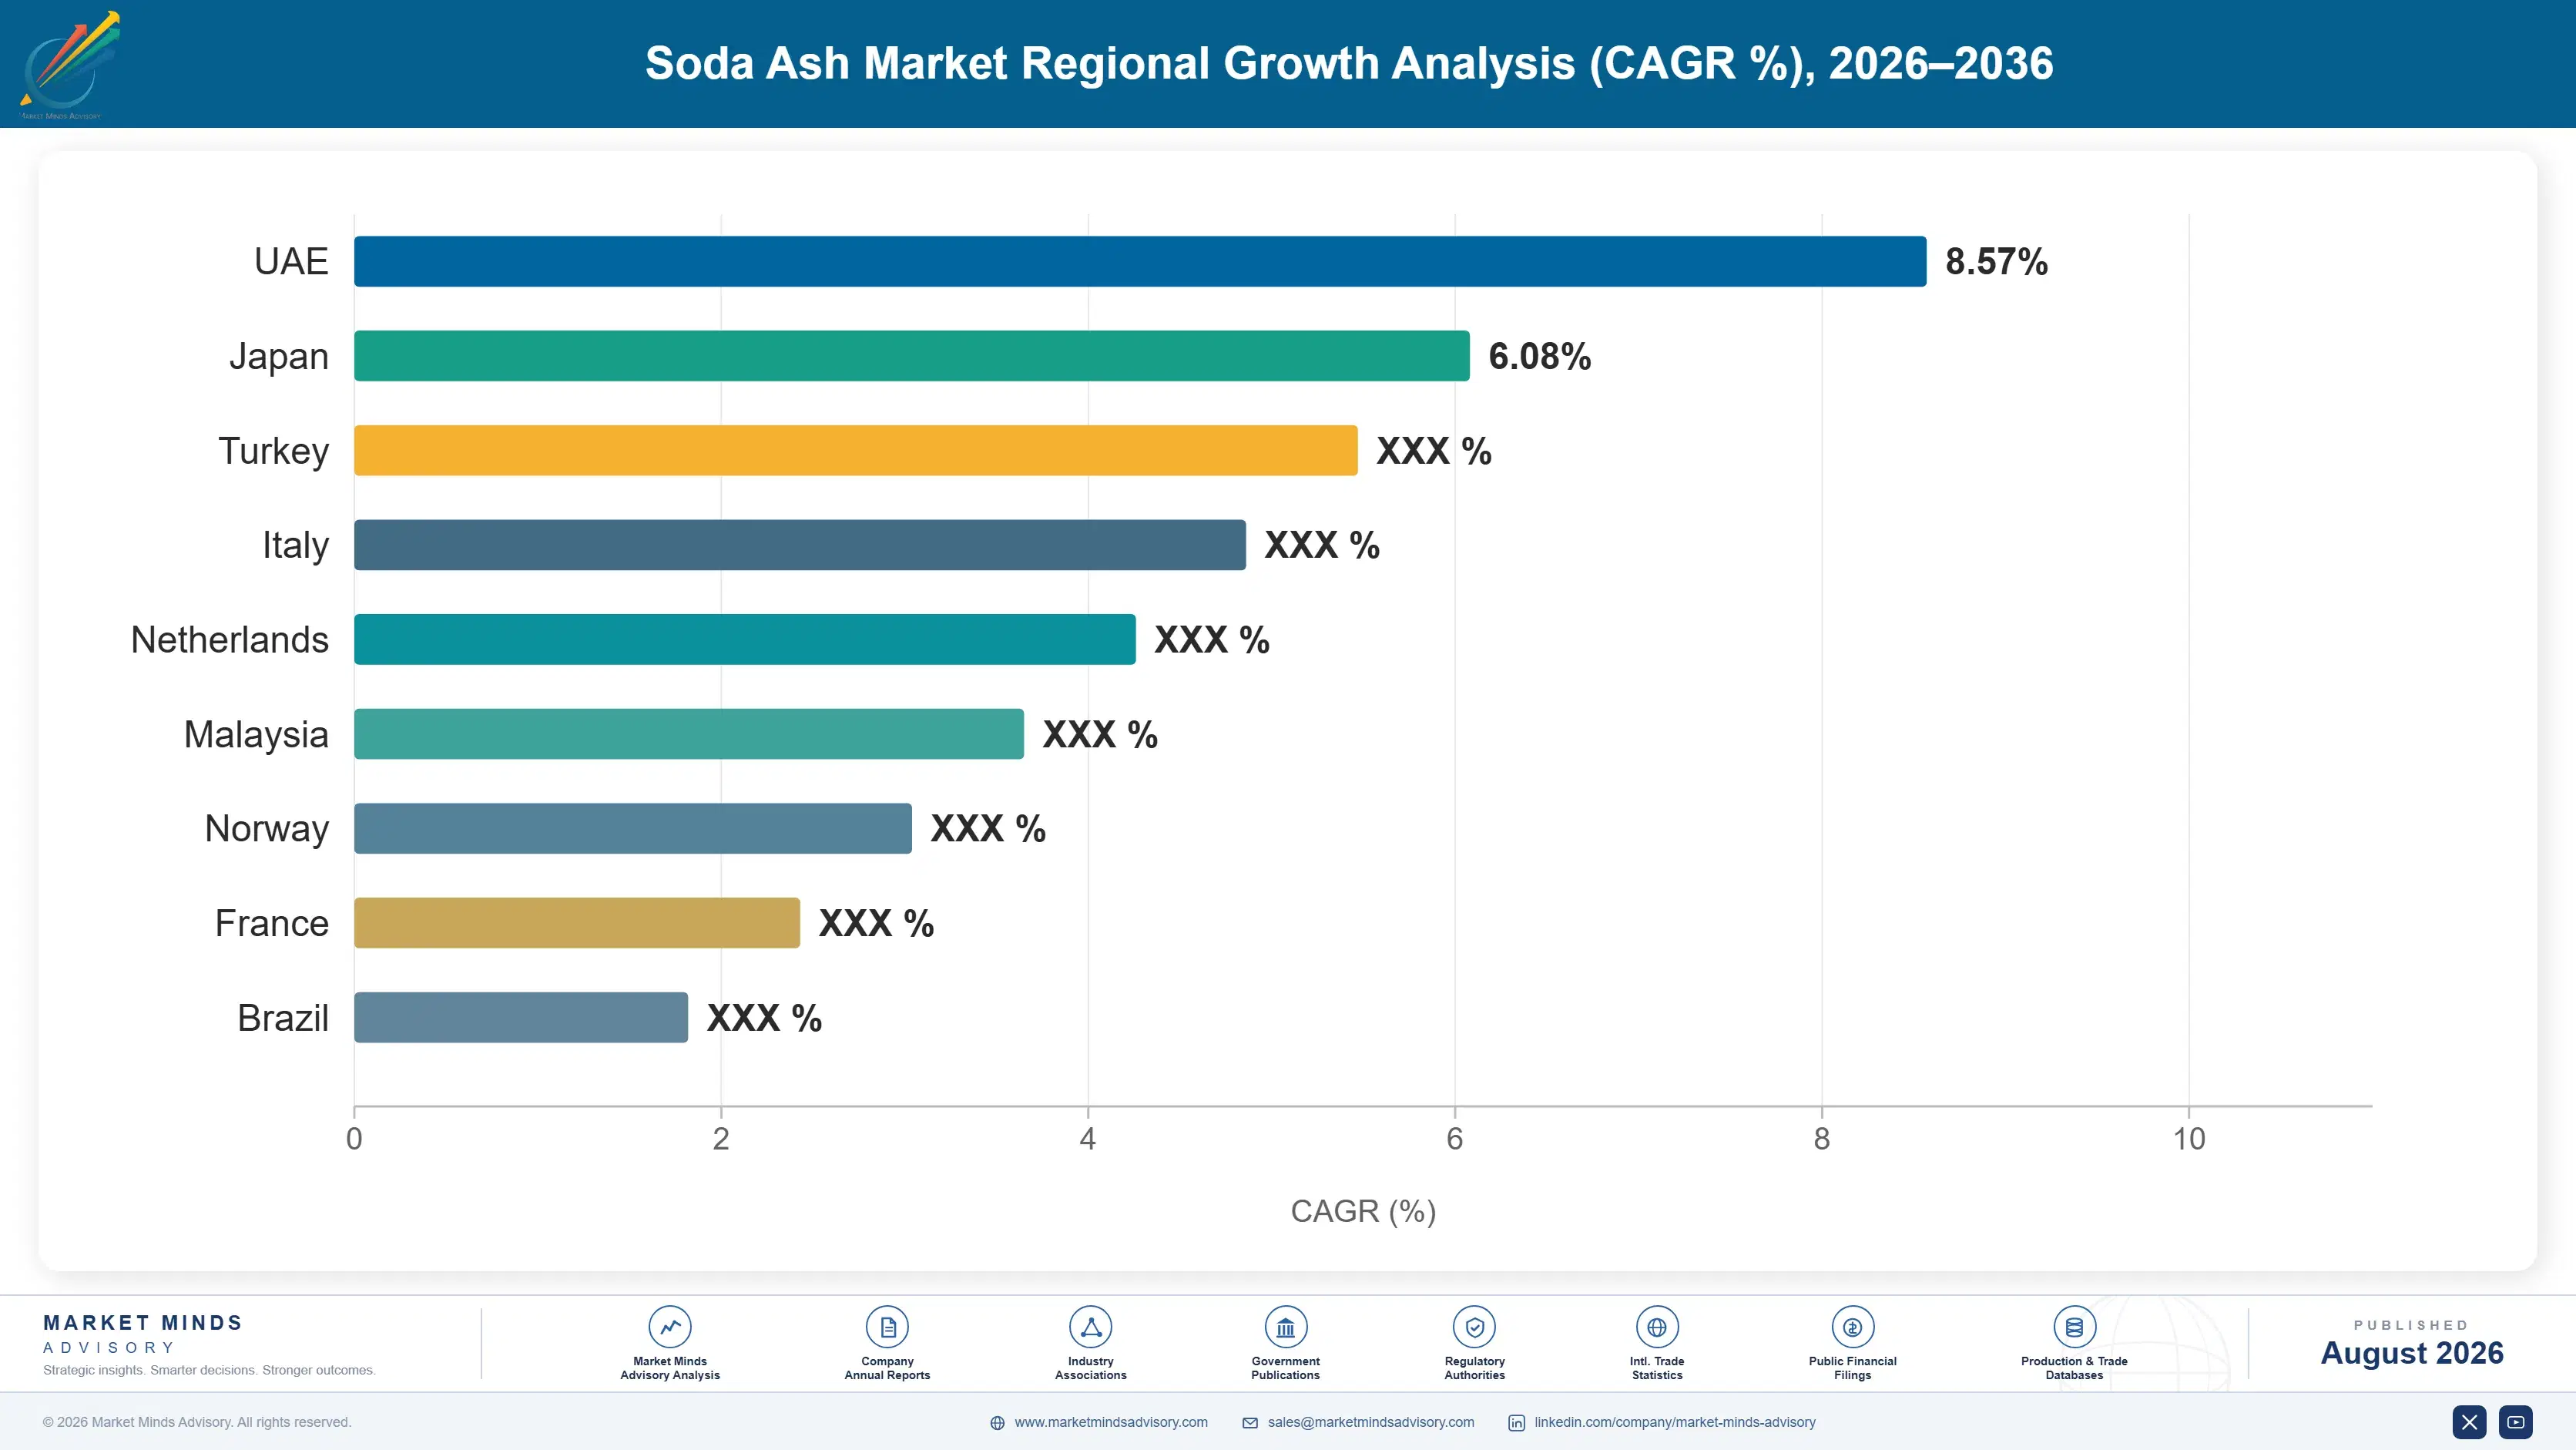
Regional Architecture and Country Demand Map

Soda ash production tends to sit wherever trona deposits, or salt and limestone, happen to coincide with genuinely cheap energy, while the consumption sits squarely at glass furnaces, and the seaborne trade connecting the two is unusually large for a bulk chemical of this particular kind.

East Asia

Thirty-three percent of global value here, comfortably the largest regional share, because Chinese flat, container and solar glass manufacture consumes more soda ash than any other market and because substantial domestic synthetic capacity was built directly alongside it. Note: this exceeds the standard regional band because glass manufacture, and solar glass manufacture in particular, is concentrated in China to a degree that no general chemical demand measure would capture. Chinese producers operate both synthetic and natural routes, with domestic nahcolite and trona resources supporting a steadily growing natural share. Growth of 5.6% here runs above the global rate, supported by solar glass capacity additions and by lithium conversion demand together.
Share: 33% | CAGR: 5.6% (2026 to 2036)

North America

Twenty-four percent of global value here, anchored firmly by Wyoming trona which is comfortably the largest natural soda ash resource anywhere in the world and gives producers here a cost and carbon position that nobody else can approach. Domestic glass demand is entirely mature here, so a very large share of the output is exported into the seaborne trade where the natural route cost advantage holds comfortably even after paying freight. Genesis Energy, Ciner and Solvay all operate genuinely substantial Wyoming trona capacity alongside one another there. Growth of 4.1% here reflects steady domestic glass consumption alongside export volumes that keep expanding as synthetic capacity closes elsewhere in the world.
Share: 24% | CAGR: 4.1% (2026 to 2036)
Regional intelligence for 5 additional markets available in the complete report: Western Europe, South Asia and Pacific, Latin America, Middle East and Africa, Eastern Europe. Contact sales@marketmindsadvisory.com.
soda-ash-market-trends-country-cagr-analysis-1787311157499

Where soda ash margin actually survives

Four commercial positions separate producers earning something durable from those selling an identical chemical against a delivered price. Each one of them rests on something that capacity alone cannot deliver: a mineral resource, refining capability nobody else bothered to build, contract terms that price carbon properly, or a qualified position sitting beside a lithium conversion plant.

Price the carbon differential rather than absorbing it

Natural trona production emits a fraction of the 1.2 tonnes of carbon dioxide per tonne that synthetic operations generate, and European emissions trading plus border adjustment now put a real price on that difference. Natural producers pricing their carbon position explicitly, rather than competing on delivered cost and letting the customer keep the benefit, realise roughly 16% above competitors quoting on tonnage alone. The evidence required is verified emissions data that most producers already report anyway. Almost nobody presents it as a commercial argument during an actual glass supply negotiation.
Market Impact: Realises roughly 16% above tonnage-

Build refining capability for lithium and specialty grades

Battery and lithium processing grade demands calcium, magnesium, sulphate and chloride limits that no glass grade production actually meets, because every contaminant carries through into cathode material performance downstream. Producers building refining capability realise roughly 2 times dense glass grade pricing on that volume, and the qualified supplier field stays genuinely narrow because very few producers have bothered. The capital required is refining and analytical capability rather than any additional production capacity. Lithium conversion capacity keeps being commissioned regardless of whether qualified soda ash supply exists anywhere nearby at all.
Market Impact: Realises roughly 2 times dense glas

Contract glass furnace supply on multi-decade horizons

A container or flat glass furnace runs for twelve to fifteen years between rebuilds and consumes soda ash continuously throughout, which makes each one a genuinely long annuity rather than a recurring tender. Producers contracting furnace campaigns rather than annual volumes capture roughly 4 times the lifetime value of those bidding each year against competitors. The negotiation happens at rebuild or commissioning and not afterwards. Most producers treat glass supply as an annual commodity relationship and consequently never engage at the one moment when the decision is genuinely being made.
Market Impact: Captures roughly 4 times the furnac

Site qualified supply beside lithium conversion capacity

Lithium conversion plants are built near the resource in Chile, Argentina, Australia and China rather than near soda ash capacity, which creates long logistics chains for a bulk chemical they consume continuously. Producers holding qualified battery grade supply inside a conversion cluster hold roughly 25% delivered cost advantage over distant suppliers shipping exactly the same specification. The advantage compounds over time, because qualification takes months and conversion operators strongly dislike changing a validated input. Very few producers have positioned themselves deliberately around where lithium conversion capacity is actually being built.
Market Impact: Holds roughly 25% delivered cost ad

Who Controls the Margin Pool

Concentration is moderate, with the top five holding 39% of global soda ash production capacity, the basis on which every participant here is assessed. Solvay and Ciner lead from opposite ends of the route divide, one built on synthetic capacity across Europe and the other on Turkish and Wyoming trona, while the remaining field spans Chinese producers operating both routes, Indian synthetic capacity and a long tail of regional operators.
Competition currently runs on production route economics, carbon position and freight reach rather than on product, which is chemically identical whatever the route. Natural producers compete against synthetic operators on delivered cost even after ocean freight, and that gap widens with every carbon price increase. Refining capability for lithium and specialty grades has become a genuine differentiator rather than a niche.

Emerging pressure comes from two directions at once. Turkish natural capacity keeps expanding and reaches European and Asian glass markets directly, which pressures synthetic operators in exactly the regions they were built to serve. And carbon border adjustment extends the carbon cost to imports as well as domestic production, which means the rankings that matter increasingly reflect resource geology rather than any commercial action a synthetic operator can take.
soda-ash-market-trends-company-positioning-matrix-1787311158025

Competitive Moat and Risk Dimensions

SOLVAY

Moat: Technology heritage and customer depth

More than a century of ammonia-soda operation has given Solvay process knowledge, glass customer relationships and technical service depth across multiple regions that a new entrant could not assemble. Those relationships hold volume attached through furnace campaigns measured in decades rather than annual tenders, which matters considerably in a market where the product itself is identical between suppliers.
SOLVAY

Risk: Synthetic route carbon exposure

Synthetic production generates roughly 1.2 tonnes of carbon dioxide per tonne from limestone calcination that no process improvement removes, and European emissions trading prices that directly while border adjustment extends it to imports. A portfolio weighted toward the synthetic route faces a cost gap widening with every carbon price increase and no technical route to closing it.
CINER RESOURCES

Moat: Trona resource and cost position

Access to Turkish and Wyoming trona gives Ciner a resource position that determines both cost and carbon intensity in ways no operating improvement matches, since the mineral starts most of the way to sodium carbonate already. That advantage holds against synthetic competitors even after ocean freight, and it widens rather than narrows as carbon pricing extends across more jurisdictions.
CINER RESOURCES

Risk: Glass demand concentration exposure

Volume weighted heavily toward glass manufacture ties Ciner to container lightweighting and packaging substitution trends that no soda ash producer influences, alongside flat glass demand moving with construction cycles. Diversification into lithium, chemical and refined specialty grades requires refining capability rather than resource access, which is a quite different investment from the one the position currently rests on.

Players Tracked

Prominent Players

Solvay
Ciner Resources
Tata Chemicals
Genesis Energy
Shandong Haihua

Other Key Players

Sisecam
Genesis Alkali
Nirma
GHCL
Tangshan Sanyou
Hubei Yihua
Qinghai Salt Lake Industry
DCW
Novacarb
Ciech Soda Polska
Bulgarian Soda
Magadi Soda
Oriental Chemical Industries
American Natural Soda Ash
Searles Valley Minerals

Recent Developments

FEBRUARY 2025

European synthetic capacity closes under carbon and energy pressure

A European soda ash producer permanently closed synthetic ammonia-soda capacity at one site, citing combined energy and emissions trading costs that no longer supported continued operation against imported natural material, and confirming that the plant would not be restarted even if energy prices subsequently eased again.
Signal: Carbon pricing is now closing synthetic so
JUNE 2025

Lithium converter qualifies dedicated battery grade soda ash supply

A lithium carbonate converter completed full qualification of a dedicated battery grade soda ash specification with calcium, magnesium and sulphate limits set well beyond any glass manufacturing requirements, having previously established that ordinary industrial grade supply carried contaminants straight through into finished cathode material performance.
Signal: Battery grade qualification is now creatin
OCTOBER 2025

Turkish natural capacity expansion redirects seaborne trade flows

Additional Turkish natural trona capacity reached full commercial operation through the course of the year and displaced synthetic material right across both the European and Asian glass markets, confirming that the delivered cost advantage of natural production holds up comfortably even across genuinely substantial ocean freight distances.
Signal: Natural route economics now travel conside

Energy, limestone and route economics

Cost structure differs fundamentally between the two routes, and that difference is the whole story. Synthetic production carries brine, limestone and ammonia at roughly 31% of delivered cost with energy adding 34%, while natural production carries mining and haulage at around 26% with calcination energy near 18%. Freight and working capital add roughly 15% to both, with labour and maintenance making up the balance.
Energy was the defining exposure of recent history and fell almost entirely on one route. European industrial gas and electricity prices through 2022 reached levels the IEA documented as unprecedented, which pushed synthetic operations below cash cost while natural producers were barely touched. Solvay Annual Report 2022 recorded energy cost pressure across its soda ash operations, and Tata Chemicals Annual Report 2023 noted energy and input cost movement across its operations.

The competitive disadvantage mechanism runs entirely through production route and resource access alone. Synthetic operators cannot close an energy and carbon gap set by chemistry rather than operating practice, whatever efficiency programme they choose to run. Those without refining capability are also excluded from the specialty grades where growth concentrates. European synthetic producers frequently carry both limitations, which is why capacity has closed there.
soda-ash-market-trends-cost-volatility-analysis-1787311158220

Value calcium chloride co-product rather than treating it as waste

Synthetic production generates calcium chloride in substantial quantity and many operators still treat disposal as a cost rather than developing the de-icing, dust control and oilfield markets that consume it. Properly valorising that co-product recovers a meaningful share of the route's cost disadvantage and it requires commercial development effort rather than any process capital investment at all.

Build refining capability before lithium grades are contracted

Battery and specialty grades demand impurity limits that no glass grade production meets, and qualification takes months that nobody has once a conversion plant is commissioning. Building refining and analytical capability in advance costs a fraction of production capacity and opens the only part of this market where the product is not identical between suppliers.

Contract freight capacity for extended natural route reach

Natural production holds a delivered cost advantage that survives ocean freight, but only if the freight itself is secured on terms that do not erode it during tight shipping markets. Contracting vessel capacity on multi-year terms converts a resource advantage into a delivered one and it costs nothing at all beyond ordinary commercial planning discipline.

Portfolio Architecture for Margin Defence

Margin architecture separates by production route and refining capability rather than by product, which is unusual for a chemical that is identical whoever makes it. Dense glass grade sold into container and flat glass furnaces earns whatever delivered cost competition allows, because every producer supplies exactly the same sodium carbonate and every buyer knows it perfectly well.
Value climbs wherever refining capability or carbon position limits the qualified field. Detergent and chemical intermediate grades defend modest premiums through consistency and particle characteristics that formulators tune around. Battery, refined and specialty grades sit far higher, since impurity limits, documentation and formal qualification exclude ordinary glass grade production entirely, regardless of what delivered price it offers.

The highest value pools concentrate where battery grade refining meets a low-carbon production route, because European and increasingly Asian customers now require both and very few operations offer either. Those pools are modest in tonnage against total output and quite disproportionate in realised margin. The commercial tension is that dense glass volume keeps plants loaded, which the scale economics genuinely require, while contributing almost nothing toward the refining capability above it.

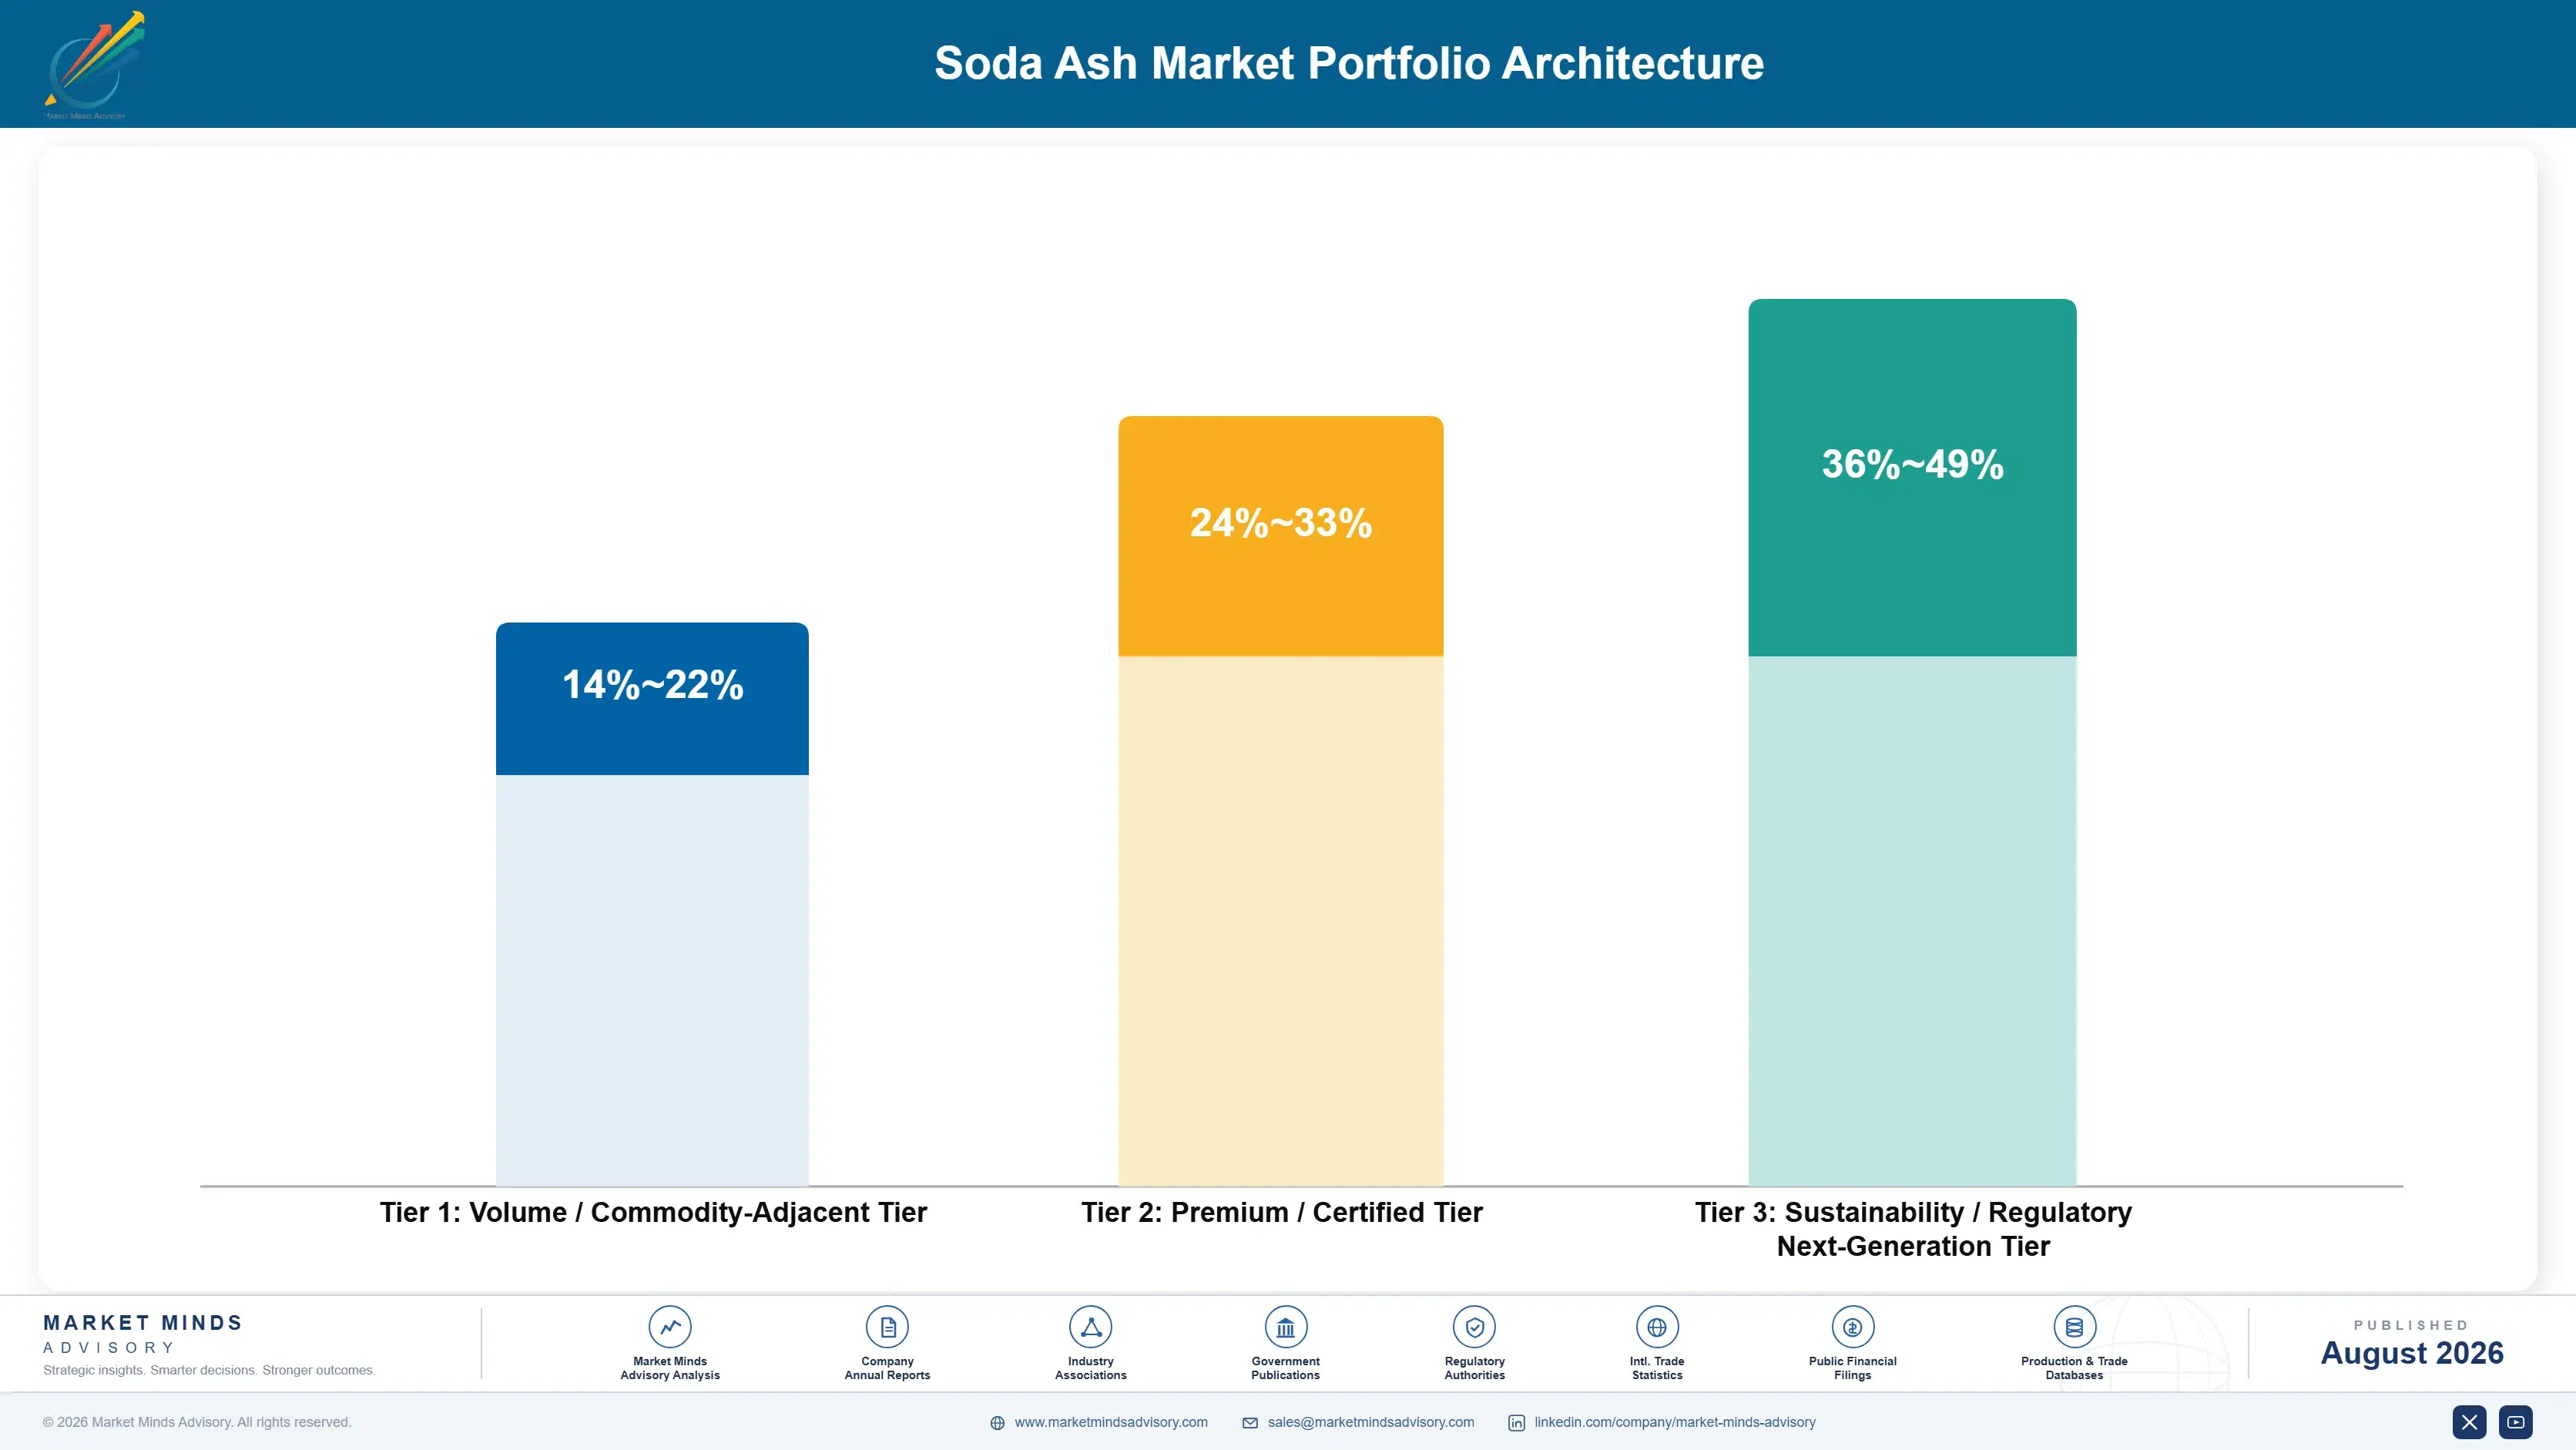
Volume / Commodity-Adjacent Tier

Dense and light glass grade soda ash supplied into container, flat and specialty glass furnaces, where the product is chemically identical between producers and delivered cost including freight decides nearly every award.
Gross Margin: 14-22%

Premium / Certified Tier

Detergent and chemical intermediate grades supplied against particle size, bulk density and consistency specifications. Handling characteristics and reliability defend pricing here. The nine-point range reflects bulk supply against specification-controlled positions.
Gross Margin: 24-33%

Sustainability / Regulatory / Next-Generation Tier

Battery and lithium processing grade, refined pharmaceutical and food grades, and verified low-carbon natural route material. Refining capability and carbon position defend pricing strongly. The thirteen-point range reflects established specialty grades against emerging battery grade economics.
Gross Margin: 36-49%
soda-ash-market-trends-portfolio-architecture-1787311158723

High-value Sub-segments and Strategic Watch-out

Battery and lithium processing grade supply

High value and genuinely high growth together here in this segment, because impurity limits carry straight through into cathode material performance and remarkably few producers have built the refining capability that the specification genuinely demands of them. Realised margin here reflects that supplier narrowness very directly indeed.
Gross Margin: 36-49%

Verified low-carbon natural route material

Strong realised value on genuinely emerging underlying growth, because border adjustment now prices the route difference entirely explicitly and synthetic producers have no technical path to matching a carbon position set by mineral chemistry itself. Border adjustment now prices that route difference entirely explicitly for buyers.
Gross Margin: 32-44%

Dense glass grade furnace supply

The volume core of this entire soda ash market, keeping production properly loaded while earning whatever delivered cost competition permits on a chemical that is identical between every single producer. Necessary for the basic plant scale economics, but this tier funds nothing whatsoever above itself.
Gross Margin: 14-22%

Synthetic route carbon exposure across the portfolio

The strategic watch-out running right across the whole of this soda ash business today, given that the process emissions arising from limestone calcination simply cannot ever be engineered away and that carbon pricing keeps extending steadily across more and more jurisdictions with each passing year.
Gross Margin: 8-32%

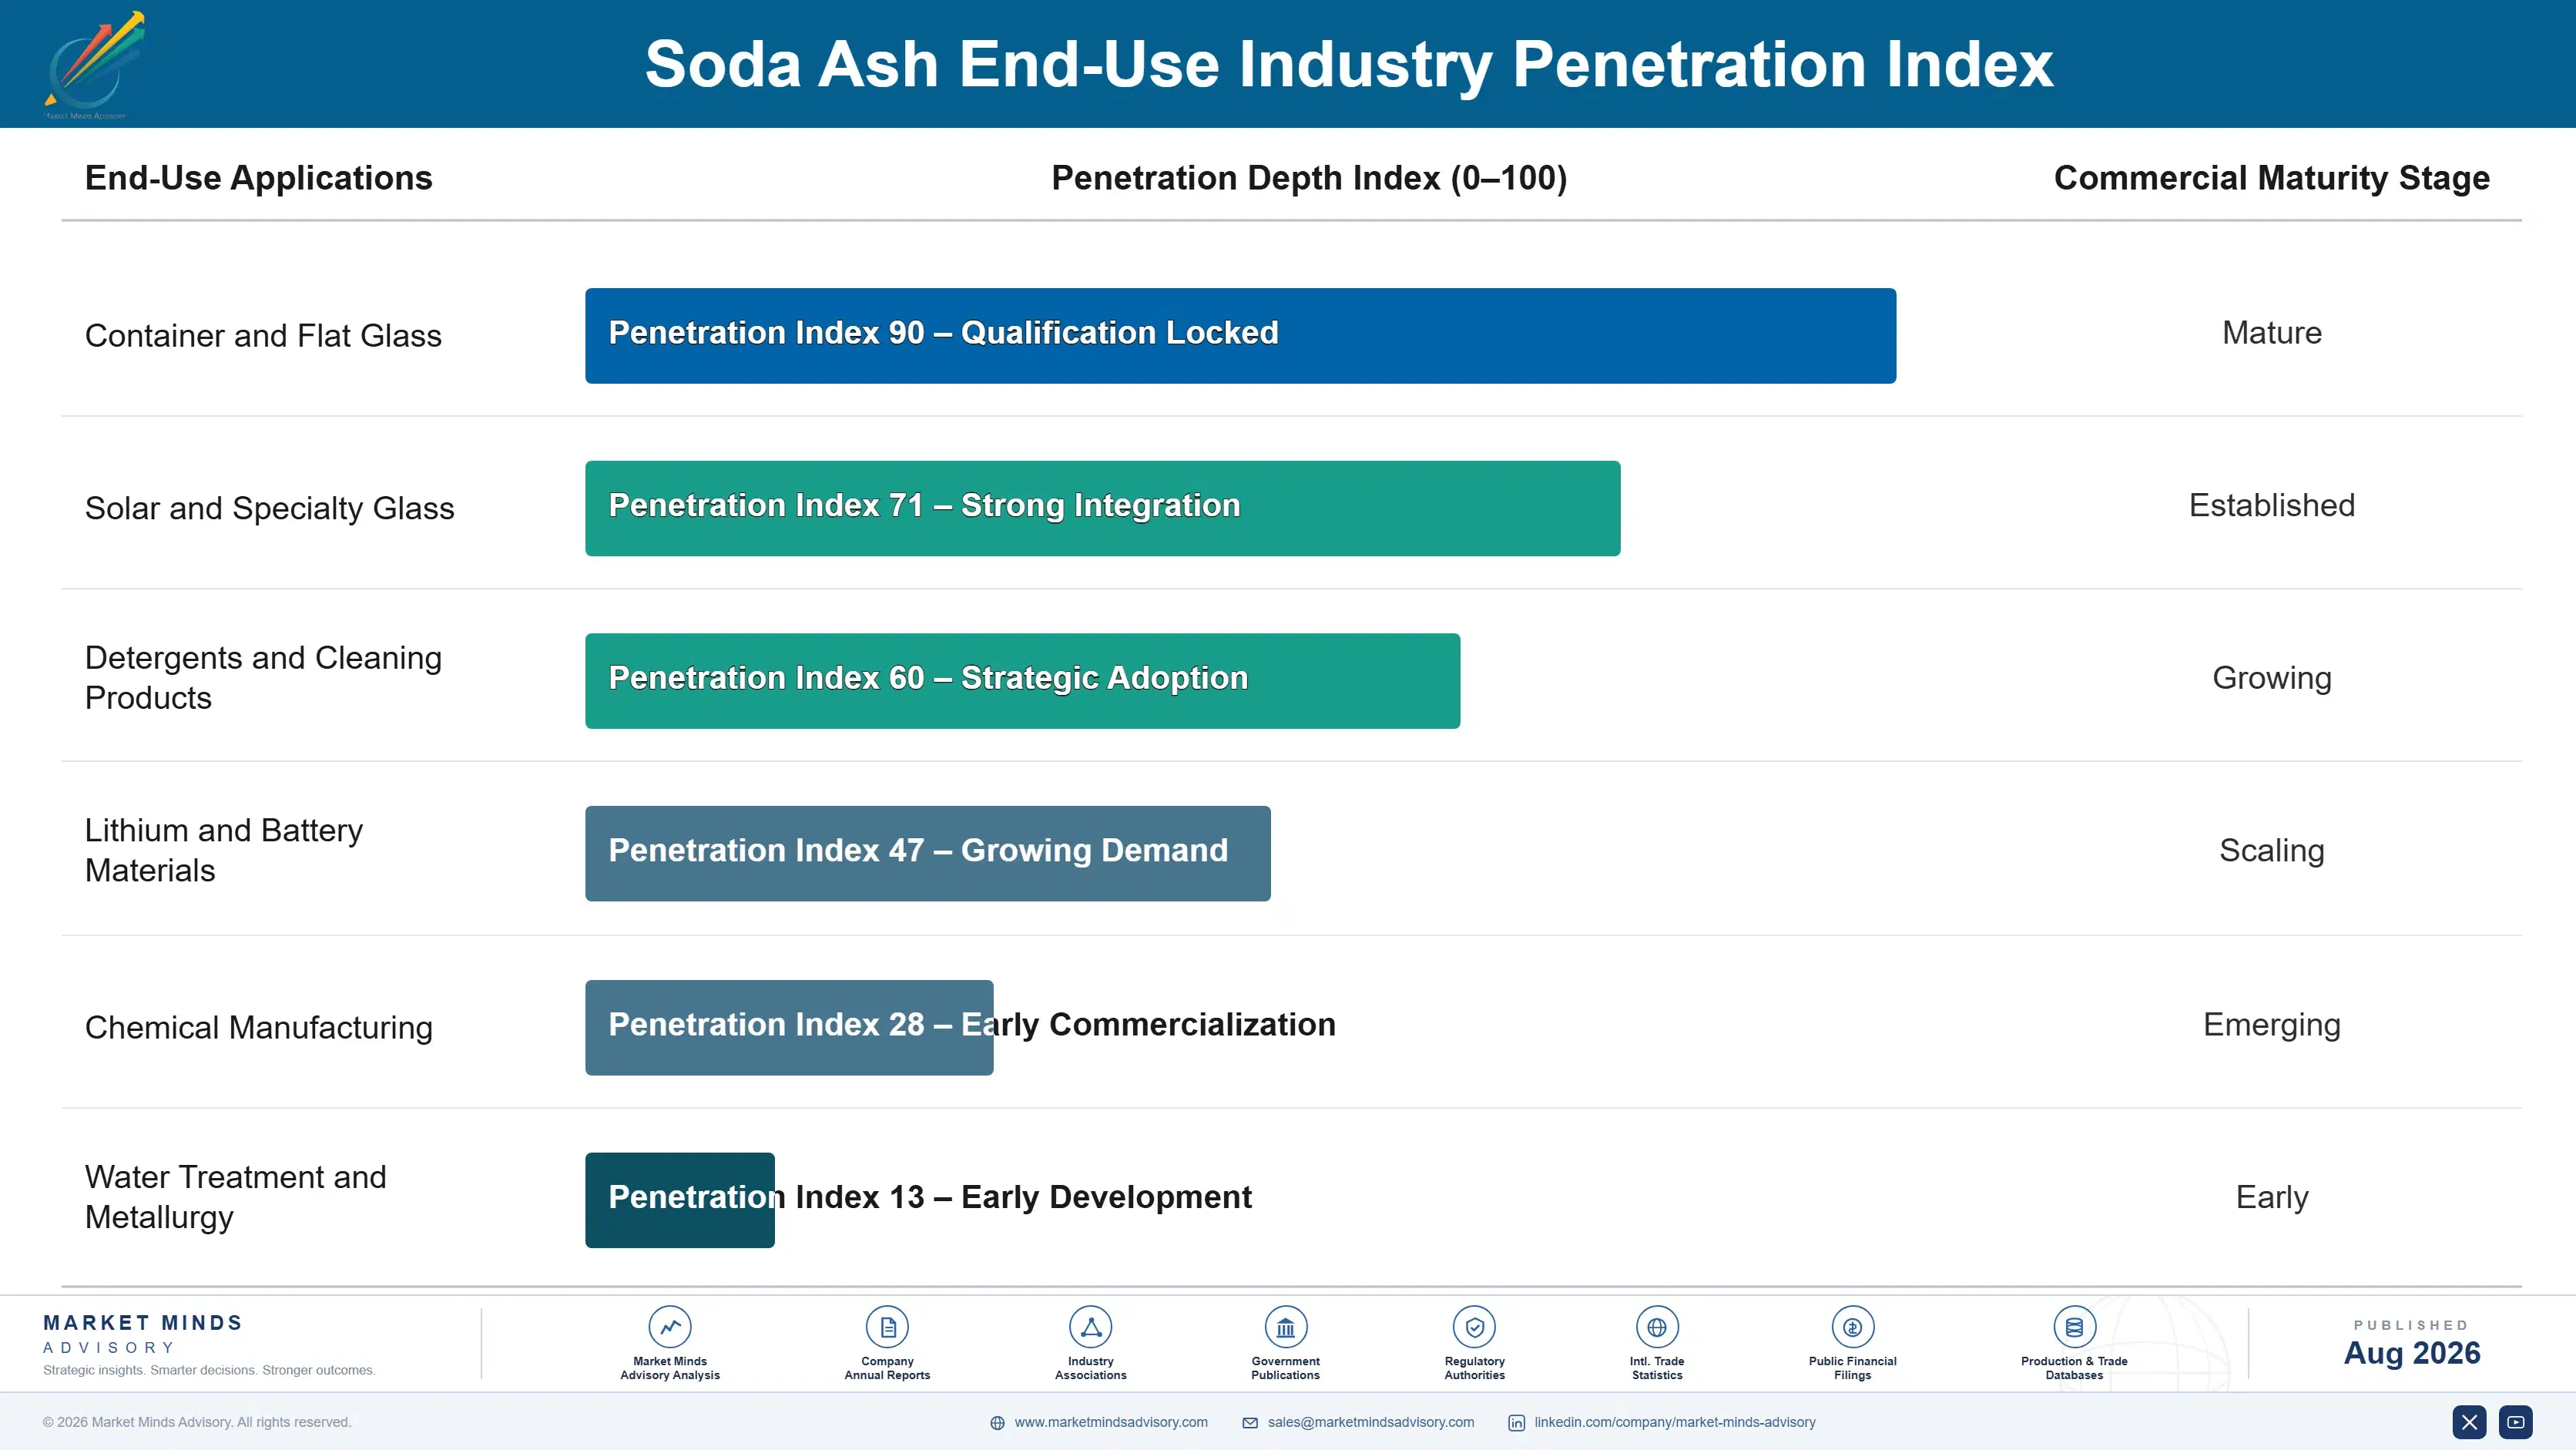
How soda ash demand actually behaves

Demand is continuous, long-dated and largely determined by assets commissioned years earlier. A container or flat glass furnace runs twelve to fifteen years between rebuilds and consumes soda ash every hour it operates, which makes each furnace a genuine annuity rather than a recurring purchase. That predictability is genuinely unusual and most producers underuse it, treating glass supply as an annual tender rather than a campaign-length relationship.
Stickiness tracks the qualification burden rather than the chemistry, which is identical everywhere. Dense glass grade is loosest, substituted between shipments on delivered cost with no consequence at all. Detergent and chemical intermediate grades sit tighter, because particle characteristics and handling behaviour get tuned into a customer's process. Battery and refined specialty grades are stickiest of all, since a converter validating an input against cathode performance will not casually revalidate.

The buyer profile splits between glassmakers and chemical processors in ways that defeat a single commercial model. Glass manufacturers buy centrally on delivered cost across multiple furnaces and negotiate against freight-adjusted alternatives. Lithium converters, pharmaceutical formulators and specialty chemical producers evaluate impurity data through technical functions long before any commercial discussion, and change supplier only when something has genuinely gone wrong.
soda-ash-market-trends-end-use-penetration-index-1787311159213

What we would actually do here

These are among the four positions where our research anticipates prominent divergence between winners and laggards over the coming forecast period. Each is grounded in the demand model, the regulatory perimeter, and the announced capacity pipeline.
01 / CARBON DIFFERENTIAL PRICING

Charge for the emissions you do not produce

Natural trona production emits a fraction of the 1.2 tonnes of carbon dioxide per tonne that synthetic operations generate, and emissions trading plus border adjustment now put a genuine price on that difference. Natural producers pricing their carbon position explicitly, rather than competing on delivered cost and handing the benefit to the customer, realise roughly 16% above competitors quoting on tonnage alone. The evidence needed is verified emissions data that most producers already report and that almost none of them present commercially.
02 / BATTERY GRADE REFINING CAPABILITY

Build the refining nobody else has bothered with

Battery and lithium processing grade demands calcium, magnesium, sulphate and chloride limits that no glass grade production meets, because every contaminant carries through into cathode material performance downstream. Producers building that refining capability realise roughly 2 times dense glass grade pricing on the volume, and the qualified field stays genuinely narrow indeed. The capital is refining and analytical rather than additional production capacity, and lithium conversion capacity keeps being commissioned whether or not any qualified soda ash supply exists nearby.
03 / FURNACE CAMPAIGN CONTRACTING

Negotiate at the rebuild, not the annual tender

A container or flat glass furnace runs twelve to fifteen years between rebuilds and consumes soda ash continuously throughout, which makes each one a long annuity rather than a recurring purchase decision. Producers contracting furnace campaigns rather than annual volumes capture roughly 4 times the lifetime value of those bidding each year against competitors. The negotiation happens at rebuild or at commissioning, and most producers simply never engage at the one moment when that decision is genuinely being made at all.
04 / LITHIUM CLUSTER POSITIONING

Put qualified supply where conversion is being built

Lithium conversion plants get built near the resource in Chile, Argentina, Australia and China rather than anywhere near soda ash capacity, which creates genuinely long logistics chains for a bulk chemical that gets consumed continuously. Producers holding qualified battery grade supply inside a conversion cluster hold roughly 25% delivered cost advantage over distant suppliers shipping exactly identical specification. The advantage compounds steadily over time, because qualification takes many months and conversion operators strongly dislike revalidating an input that already works properly.

Engagement Snapshot From the Field

A live engagement with an industry participant carrying material or product regulatory and market exposure ahead of a defining policy shift, showing how our research translates into a defensible multi-year portfolio strategy.
MARKET MINDS ADVISORY · CLIENT ENGAGEMENT SUMMARY
Soda Ash Producer Strategic Portfolio Review and Transition Roadmap 2026·Investment Scenario on Soda Ash Exposure Evaluation 2025-26
CLIENT PROFILE
A synthetic soda ash producer operating two ammonia-soda plants in Europe, supplying container and flat glass manufacturers, detergent formulators and chemical processors across the region alongside a small refined grade business. Soda ash revenue approached EUR 410 million annually (client-reported, unverified by MMA), roughly seventy-five percent of it dense glass grade sold on annual contracts at delivered cost.
STRATEGIC CHALLENGE
Margins had not recovered since the energy spike and emissions trading costs were rising each year, while management planned efficiency investment at both plants. Imported natural material had taken volume from two large glass customers. No refined or battery grade capability existed anywhere in the business despite nearby lithium conversion projects.
MMA APPROACH
We modelled route cost positions against natural producers across a full carbon price trajectory rather than at current levels, quantified calcium chloride co-product value against current disposal practice, and reconstructed the two lost glass accounts through interviews with glassmaker procurement and furnace engineering rather than the commercial contacts the client normally dealt with.
KEY FINDINGS
  1. Efficiency investment at both plants would recover roughly a fifth of the route cost gap against natural producers, and none of the process emissions carbon exposure at all.
  2. Calcium chloride was being disposed of at cost while regional de-icing and dust control demand would have absorbed the entire output at positive value.
  3. Both lost glass accounts had been decided at furnace rebuild rather than at annual tender, and the client had not been engaged in either rebuild discussion.
  4. No refining or battery grade capability existed despite two lithium conversion projects being commissioned within economic delivery distance of the smaller plant.
CLIENT PROFILE
A synthetic soda ash producer operating two ammonia-soda plants in Europe, supplying container and flat glass manufacturers, detergent formulators and chemical processors across the region alongside a small refined grade business. Soda ash revenue approached EUR 410 million annually (client-reported, unverified by MMA), roughly seventy-five percent of it dense glass grade sold on annual contracts at delivered cost.
STRATEGIC CHALLENGE
Margins had not recovered since the energy spike and emissions trading costs were rising each year, while management planned efficiency investment at both plants. Imported natural material had taken volume from two large glass customers. No refined or battery grade capability existed anywhere in the business despite nearby lithium conversion projects.
MMA APPROACH
We modelled route cost positions against natural producers across a full carbon price trajectory rather than at current levels, quantified calcium chloride co-product value against current disposal practice, and reconstructed the two lost glass accounts through interviews with glassmaker procurement and furnace engineering rather than the commercial contacts the client normally dealt with.
KEY FINDINGS
  1. Efficiency investment at both plants would recover roughly a fifth of the route cost gap against natural producers, and none of the process emissions carbon exposure at all.
  2. Calcium chloride was being disposed of at cost while regional de-icing and dust control demand would have absorbed the entire output at positive value.
  3. Both lost glass accounts had been decided at furnace rebuild rather than at annual tender, and the client had not been engaged in either rebuild discussion.
  4. No refining or battery grade capability existed despite two lithium conversion projects being commissioned within economic delivery distance of the smaller plant.
RECOMMENDED STRATEGY
Phase 1: Phase one: develop calcium chloride co-product markets and redirect efficiency capital toward the co-product recovery rather than incremental energy savings. Phase 2: Phase two: engage the four largest regional glass customers at furnace rebuild planning stage rather than waiting for annual tender processes. Phase 3: Phase three: build refining and analytical capability at the smaller plant and pursue battery grade qualification with both nearby lithium conversion projects.
OUTCOME
The client redirected capital toward co-product valorisation and refining capability. Calcium chloride moved from a disposal cost to a positive contribution within nine months, and realised margin improved by 15% (client-reported, unverified by MMA) against the prior year on broadly comparable soda ash tonnage shipped.

Frequently Asked Questions

Foundational context covering the market sizes, CAGR, scope, country, region and competition that inform every finding below. This section is provided to cover basics and most often pre-purchase conversations, answered from the MMA Primary Research Dataset.

What is the current size of the Soda Ash Market?

The market is valued at USD 22.6 billion in 2025, rising to USD 23.66 billion in 2026. Sizing covers soda ash sold or transferred to industrial users at realised delivered price.

How large will the Soda Ash Market be by 2036?

The market reaches USD 37.45 billion by 2036, an increase of USD 13.79 billion across the forecast period. That represents an expansion multiple of 1.58 times the 2026 base.

What is the CAGR for the Soda Ash Market 2026 to 2036?

The base case CAGR is 4.7% across 2026 to 2036. The bull case reaches 5.9% on faster solar glass and lithium commissioning, while the bear case sits at 3.4% under glass substitution.

Which segment is growing fastest?

Battery and lithium processing grade grows fastest at 7.1%, a full 1.51 times the market rate. Impurity limits there exceed anything glass manufacture has ever required from a supplier.

Who are the major companies in the Soda Ash Market?

Solvay, Ciner Resources, Tata Chemicals, Genesis Energy and Shandong Haihua lead on production capacity, holding 39% collectively. The field divides between natural and synthetic route operators.

Which country is growing fastest?

India grows fastest at 7.0%, driven by container and flat glass capacity additions running ahead of anywhere else alongside detergent formulation and a developing lithium conversion sector.

Report Segmentation Architecture

The full report scope spans multiple orthogonal segmentation dimensions, with cross-tabulated demand data provided for each dimension pair. Coverage extends further to regional breakdowns, trend trajectories, and the competitive detail needed to support segment-level decision-making.

By Grade and Purity Class

  • Dense Glass Grade
  • Light Industrial Grade
  • Battery and Lithium Processing Grade
  • Detergent Grade
  • Chemical Intermediate Grade
  • Refined and Specialty Grades

By End-Use Industry

  • Container and Flat Glass
  • Solar and Specialty Glass
  • Detergents and Cleaning Products
  • Lithium and Battery Materials
  • Chemical Manufacturing
  • Water Treatment and Metallurgy

By Customer Type and Channel

  • Container Glass Manufacturers
  • Flat and Solar Glass Producers
  • Detergent Formulators
  • Lithium Conversion Operators
  • Chemical Processing Companies
  • Distribution and Trading Channels

By Region

  • North America
  • Western Europe
  • East Asia
  • South Asia and Pacific
  • Latin America
  • Middle East and Africa
  • Eastern Europe

Scope, Methodology, and Coverage

Every figure in this report is reproducible from documented input assumptions. The scope below maps the historical period, the forecast horizon, the segmentation dimensions, and the countries covered, alongside the underlying primary and qualitative methodology.
Historical Period
2020 to 2025
Forecast Period
2026 to 2036
Base Year
2025 (USD billions; MMA Primary Research Dataset, August 2026)
Market Definition
The market comprises sodium carbonate produced by natural trona and nahcolite processing and by the synthetic ammonia-soda route, spanning dense glass grade, light industrial grade, battery and lithium processing grade, detergent grade, chemical intermediate grade, and refined and specialty grades. Sizing captures soda ash revenue at realised delivered price across container and flat glass, solar and specialty glass, detergents and cleaning products, lithium and battery materials, chemical manufacturing, and water treatment and metallurgy applications, including captive transfers valued at market equivalent. Sodium bicarbonate produced as a separate product, caustic soda and other alkalis, sodium silicate and downstream sodium chemicals, calcium chloride co-product, and finished glass or lithium products all fall outside scope.
Quantitative Units
USD billions (current prices); soda ash shipped annually in millions of tonnes; USD per tonne at realised delivered price
Segmentation Dimensions
By Grade and Purity Class; By End-Use Industry; By Customer Type and Channel; By Region
Regions Covered
North America, Western Europe, East Asia, South Asia and Pacific, Latin America, Middle East and Africa, Eastern Europe
Countries Covered
USA, Canada, Mexico, UK, Germany, France, Italy, Spain, Netherlands, Belgium, Poland, Bulgaria, Romania, Turkey, China, Japan, South Korea, Taiwan, India, Singapore, Malaysia, Thailand, Vietnam, Indonesia, Australia, Brazil, Argentina, Chile, Colombia, Saudi Arabia, UAE, Egypt, Kenya, Nigeria, South Africa, and additional markets relevant to this sector
Key Companies Profiled
Solvay, Ciner Resources, Tata Chemicals, Genesis Energy, Shandong Haihua, Sisecam, Genesis Alkali, Nirma, GHCL, Tangshan Sanyou, Hubei Yihua, Qinghai Salt Lake Industry, DCW, Novacarb, Ciech Soda Polska, Bulgarian Soda, Magadi Soda, Oriental Chemical Industries, American Natural Soda Ash, Searles Valley Minerals.
Quantitative Methodology
Primary survey, n=3,800 respondents, Q4 2025, six countries; demand-side model with trade association cross-validation
Qualitative Methodology
47 expert interviews, Q4 2025; applied to validate demand model assumptions, identify emerging dynamics, and assess competitive positioning
Report Format
PDF and XLSX data workbook (Word format preview document)
Publisher
Market Minds Advisory
Report Code
MMA-2026-CHM-641
Published
August 2026
Contact
sales@marketmindsadvisory.com | www.marketmindsadvisory.com

Purchase the full Soda Ash Market Report (2026 to 2036).

The full report sizes the soda ash market across six grade and purity classes, six end-use industries, six customer channels and seven regions, with annual forecasts to 2036 in revenue and tonnage shipped. It models natural and synthetic route cost positions across a full carbon price trajectory rather than at current levels, which is the analysis that establishes which capacity survives the next decade. Twenty participants are assessed on a consistent production capacity basis, with route and carbon positions mapped separately from installed capacity. Battery grade refining capability is identified producer by producer.
Six grade and purity classes sized and forecast annually
Route cost positions modelled across full carbon price trajectories
Twenty participants assessed on consistent production capacity basis
Route and carbon positions mapped separately from installed capacity
Battery grade refining capability identified producer by producer throughout
Glass furnace campaign timing mapped across major consuming regions

Built For The People Who Decide

From boardroom strategy to bench-side execution, this report is read cover-to-cover by leaders shaping the next decade of their industry, turning demand scenarios, market dynamics and valuation benchmarks into decisions.
CXOs/ Presidents/ VPs/ Managers
M&A and Corporate Development
Strategy Teams and R&D Heads
Procurement and Product Directors
Regulatory and Compliance Leaders
Investor Relations and Equity Analysts