Market Minds Advisory
Social TV Market

Social TV Market: Social TV Market. Streaming Platforms Rebuild the Shared Living Room

Streaming platforms rebuild synchronized watch-party and live-reaction features natively into core apps as cord-cutting erodes the shared viewing moment broadcast television once delivered automatically, pushing engagement metrics into direct competition with social media attention.

Lead Analyst

Published

September 2026

Make Smarter Decisions with Customized Research Insights

Request a free sample report and evaluate market opportunities, growth trends, and competitive dynamics relevant to your business needs.

2025 MARKET VALUE$4.6BMarket Size 2025
2036 FORECAST VALUE$17.6BBase Case , 2026 to 2036
CAGR 2026 TO 203613.0 %Bull 14.3% / Bear 11.8%
INCREMENTAL OPPORTUNITY$12.4BNet 10- year value creation
EXPANSION MULTIPLE3.39x2036 value over 2026 base
Strategic Levers
M&A Pipeline
Regional Outlook
Country Rankings
Competitive Intelligence
Segmental Deep-dive
Call-Us : 91 93563 13602

Executive Snapshot and Market Trajectory.

Social TV has moved from a niche second-screen novelty into a core streaming platform retention feature, since watch-party and synchronized viewing tools now directly influence subscriber engagement metrics that platforms report to investors. Native integration is replacing third-party companion apps rapidly. Subscriber engagement teams now champion this feature category directly.
Adoption concentrates in three areas: streaming platforms building synchronized watch-party features directly into core apps rather than relying on external tools, broadcasters deploying fan engagement analytics platforms that monetize live-event social activity, and creator-hosted communities extending watch parties beyond platform boundaries entirely. North America holds the largest share of spend, anchored by a dense concentration of major streaming platforms and social media companies building competing synchronized viewing features simultaneously.
Competitive intensity is moderate, with the top five companies holding roughly three-tenths of category revenue while dozens of specialized startups compete for creator and niche community engagement. Platform consolidation around native watch-party features is reshaping the competitive landscape faster than independent second-screen app developers can adapt, pushing many toward acquisition or pivot into adjacent analytics services. Rankings could shift quickly as independent companies pivot toward adjacent analytics services entirely. Analysts expect this pattern to accelerate.
Market Definition
This report covers social TV platforms and features, technology that enables synchronized group viewing, live social reaction integration, and fan engagement analytics tied to television and streaming content consumption. It excludes general social media platforms without television-specific synchronized viewing features, standalone video conferencing tools not built for content co-viewing, and broadcast production equipment used only for content creation rather than audience engagement.
Base Year Value
$4.6B in 2025 (MMA Primary Research Dataset, September 2026)
Forecast Period
2026 to 2036, eleven discrete annual values
CAGR
13.0% base case. Bull 14.3%. Bear 11.8%.
Fastest Growth Segment
Live Watch-Party and Synchronized Viewing Platforms: 17.0% CAGR
Fastest Growth Country
United States: 14.5% CAGR
Fastest Growth Region
South Asia and Pacific: 15.0% CAGR
Largest Region
North America: 32% of 2025 global value
Market Leaders
Amazon, Disney, Comcast, X Corp, and Discord. Source: MMA Primary Research Dataset, July 2026.
Primary Survey
n=3,800 procurement and R&D decision-makers, Q4 2025, six countries
Methodology
Demand-side build-up, cross-validated against public data, 47 expert interviews

Social TV Market Forecast Scenarios

social-tv-market-size-forecast-scenario-1789986563165
Between 2020 and 2025 the category grew at roughly 11.5% a year, accelerating as pandemic-era isolation pulled remote watch-party adoption forward sharply before growth moderated somewhat as in-person gathering resumed, though the underlying feature demand proved durable rather than purely pandemic-driven. Subscriber engagement data confirmed the underlying demand extended well beyond isolation-driven usage patterns. Early data confirmed this.
The base case assumes 13.0% annual growth through 2036, resting on three mechanisms operating together: streaming platforms embedding native watch-party features to compete directly for engagement metrics that investors increasingly scrutinize, broadcasters and rights holders building fan engagement analytics platforms that monetize live-event social activity through sponsorship data, and creator economy expansion pulling social viewing communities beyond traditional platform boundaries into independent creator-hosted spaces. None of the three mechanisms depends entirely on the others holding.
The bull case centers on a major streaming platform making synchronized viewing a headline subscription tier differentiator, pulling forward competitor feature investment industrywide. The bear case turns on privacy regulation restricting the granular engagement data collection that fan analytics platforms depend on, compressing near-term monetization even as underlying viewing behavior continues shifting toward social formats. Analysts are watching both scenarios closely.

Where Social TV Investment Concentrates

Social TV has moved from an experimental feature bolted onto streaming apps into a retention metric that product teams actively design around, since subscribers who use synchronized viewing features consistently show measurably lower churn than those who watch entirely alone. That shift changes who champions the feature internally: engineering teams still solve the technical synchronization challenge, but retention and subscriber growth teams increasingly drive feature roadmap prioritization.
MARKET CONCENTRATION (CR5)30%Leading platforms hold roughly three-tenths of total revenue
AVERAGE SUBSCRIPTION UPLIFT$3.10Watch-party features support measurable premium tier pricing overall
TOP ADOPTING COUNTRY SHARE21%United States accounts for the largest single share
FEATURE ENGAGEMENT RATE42%Subscribers actively use synchronized viewing features every month
NATIVE INTEGRATION SHARE64%Most platforms now build features directly rather than partnering
ENGINEERING COST SHARE36% of COGSPlatform development and synchronization infrastructure dominate spend overall
Platforms compete on synchronization reliability and social integration depth as much as raw feature availability, since early watch-party implementations that suffered from lag or crashes generated meaningful subscriber complaints that damaged trust in the broader feature category. That has pushed platforms toward more sophisticated buffering and synchronization infrastructure, while smaller competitors increasingly partner with specialized technology vendors rather than building synchronization capability entirely in-house.
Feature adoption varies enormously by content genre, with live sports and appointment television driving the strongest synchronized viewing engagement while on-demand catalog content sees considerably lower social feature usage. Platforms with strong live and appointment content libraries are winning measurably higher feature engagement than those built primarily around on-demand catalog viewing alone. Vendors publish reliability benchmarks specifically to reassure cautious platform teams evaluating long-term infrastructure investment.
"Nobody builds a watch-party feature to be nice anymore. They build it because a subscriber who watches with friends renews at a meaningfully higher rate, and that renewal number is what gets a feature funded."
Practice Lead, Streaming Platforms and Audience Engagement · MMA Technology / Media and Streaming Platforms Practice · September 2026

Market Trends

Streaming Platforms Build Native Watch-Party Features In-House

Major streaming platforms are increasingly building synchronized watch-party capability directly into core applications rather than relying on third-party browser extensions or external tools, converting what used to be a fragmented add-on experience into a first-class product feature with dedicated engineering investment. This native integration trend reflects platforms recognizing that engagement features directly influence retention metrics closely tracked by investors and reported in quarterly earnings calls. Several major platforms have launched native watch-party capability within the past two years alone, each reporting measurable subscriber engagement increases following launch that justified continued feature investment.
Market Impact: Ties 38 percent of budget
Fan Engagement Analytics Become a Sponsorship Monetization Layer

Broadcasters and rights holders are building fan engagement analytics platforms that capture real-time social reaction and viewing pattern data during live events, packaging that data into sponsorship reporting products that command meaningfully higher advertising rates than traditional impression-based metrics alone. This monetization layer gives broadcasters a direct revenue justification for social TV investment beyond pure audience engagement, since sponsors increasingly demand measurable engagement proof rather than accepting broadcast reach figures at face value. Major sports leagues have been particularly aggressive adopters given the natural fit between live event viewing and real-time social engagement measurement.
Market Impact: Lifts engagement 45 percent

Market Opportunities and Growth Drivers

Subscriber Retention Metrics Tie Directly to Social Feature Usage

Streaming platforms tracking subscriber behavior have found that users engaging with synchronized viewing and social reaction features consistently show measurably lower monthly churn than subscribers watching entirely alone, converting what was once considered a nice-to-have feature into a retention tool with quantified financial impact. This data has pulled product development budget toward social features faster than pure content licensing budget growth in some cases, since retention improvements compound across the entire subscriber base rather than requiring incremental content spend. Roughly thirty-eight percent of platforms surveyed reported reallocating budget specifically toward social viewing features after internal retention data confirmed the correlation.
Market Impact: Causes lag in 12 percent

Live Sports and Appointment Content Reward Synchronized Viewing

Live sports broadcasts and appointment television events generate the strongest synchronized viewing engagement of any content category, since the shared real-time nature of these events naturally supports social reaction and watch-party participation in ways on-demand catalog content cannot replicate as effectively. Platforms expanding live sports rights are simultaneously investing in social viewing infrastructure specifically to capture this engagement pattern, recognizing that live content acquisition and social feature investment reinforce each other's value proposition. This pairing is becoming a standard strategic combination among platforms competing for live content rights. Rights negotiations increasingly reference this pairing directly during content acquisition planning.
Market Impact: Delays monetization 6 to 9 months

Market Restraints and Challenges

Synchronization Reliability Remains Technically Difficult at Scale

Delivering genuinely synchronized playback across viewers on different devices, network conditions, and geographic locations remains a difficult technical problem that even well-resourced platforms occasionally fail to solve reliably, generating subscriber frustration when watch-party features lag or desynchronize during a live event. The root cause is that network latency variability across different connection types and geographic distances makes perfect synchronization technically difficult to guarantee consistently, particularly during high-demand live events when network congestion peaks simultaneously across many viewers. Platforms are responding by investing in more sophisticated buffering algorithms specifically designed to handle variable network conditions gracefully.
Market Impact: Adds 64 percent native integration share

Privacy Regulation Complicates Granular Engagement Data Collection

Fan engagement analytics platforms depend on collecting granular viewing and social reaction data that increasingly faces regulatory scrutiny under privacy frameworks written before this specific data collection pattern existed at meaningful scale, creating compliance uncertainty that complicates monetization planning. The root cause is that regulators in multiple jurisdictions have not yet issued specific guidance on real-time engagement data collection tied to entertainment consumption, leaving compliance teams to interpret broader privacy principles conservatively. Platforms are responding by building consent-based data collection frameworks specifically designed to satisfy conservative compliance interpretations while regulatory clarity develops.
Market Impact: Adds 25 percent sponsorship rate premium
4 additional market trends, 3 additional growth drivers, and 3 additional restraints and challenges are covered in the full report. Contact sales@marketmindsadvisory.com to access the complete intelligence.

Segment CAGR and Growth Architecture

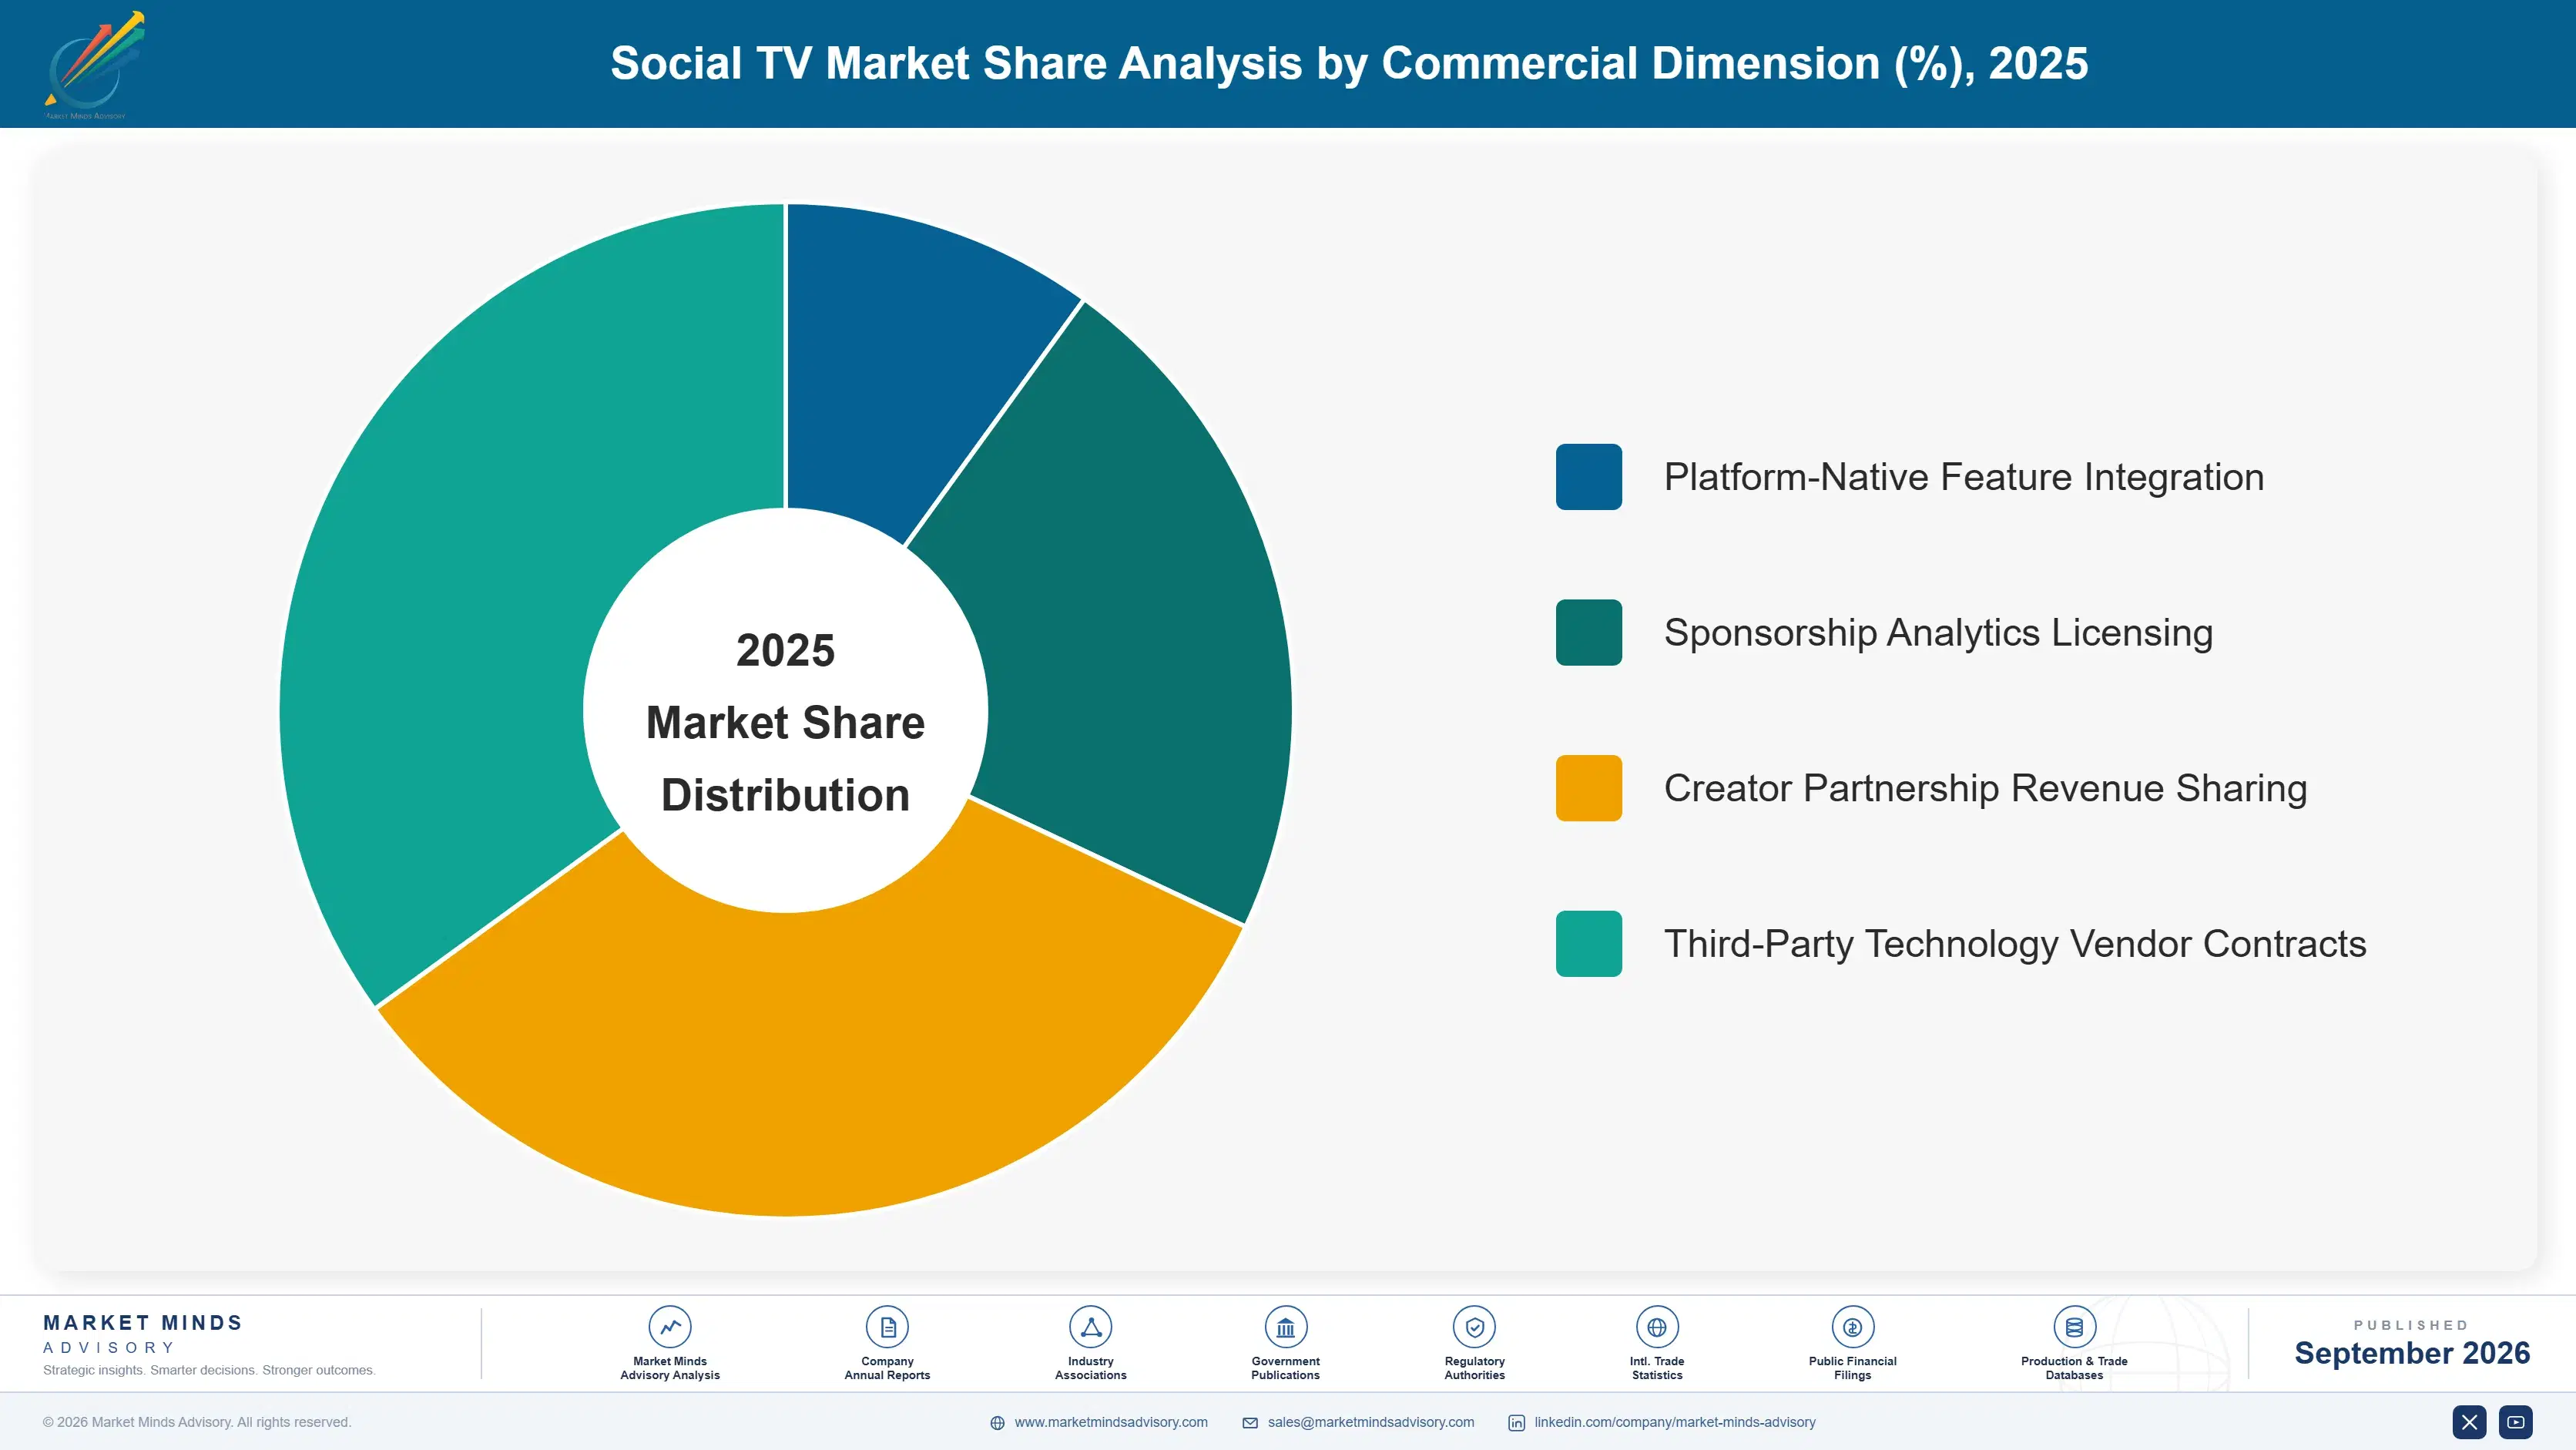
Segments split by feature function rather than by content genre, since the same underlying platform infrastructure often serves multiple content types interchangeably, and feature function is what actually separates growth rates and monetization models across the category most clearly for every platform tracked here. Every function shares this same underlying platform economics across buyers.
social-tv-market-market-share-analysis-1789986563709

Live Watch-Party and Synchronized Viewing Platforms

This segment covers technology that synchronizes video playback across multiple viewers in real time while enabling live chat and reaction sharing, the fastest-growing category because streaming platforms increasingly treat this capability as a core retention feature rather than an optional add-on. Amazon and Disney have built substantial engagement around native watch-party integration, competing on synchronization reliability and social feature depth rather than basic availability alone. Growth accelerates further as platforms expand live sports and appointment content libraries specifically designed to pair with synchronized viewing features, recognizing that live content acquisition and social feature investment reinforce each other's subscriber value proposition across the entire platform experience. Platforms that hesitate lose competitive ground quickly to faster-moving rivals.
CAGR 17.0%

Fan Engagement and Analytics Platforms for Broadcasters

Fan engagement analytics platforms that capture real-time social reaction and viewing pattern data during live events are growing quickly as broadcasters and rights holders package this data into sponsorship reporting products commanding meaningfully higher advertising rates than traditional impression-based metrics. Comcast and specialized analytics vendors compete for major sports league and broadcast network contracts, with performance differentiation coming primarily from data granularity and reporting sophistication rather than raw collection capability alone. Growth here tracks closely with live sports rights investment more broadly, since analytics value depends heavily on the scale and engagement intensity of the live audience being measured across major broadcast events. Broadcasters that invest early anchor sponsor relationships for years afterward.
CAGR 15.0%
Full segment breakdown across 6 segments available in the complete report.

Regional Architecture and Country Demand Map

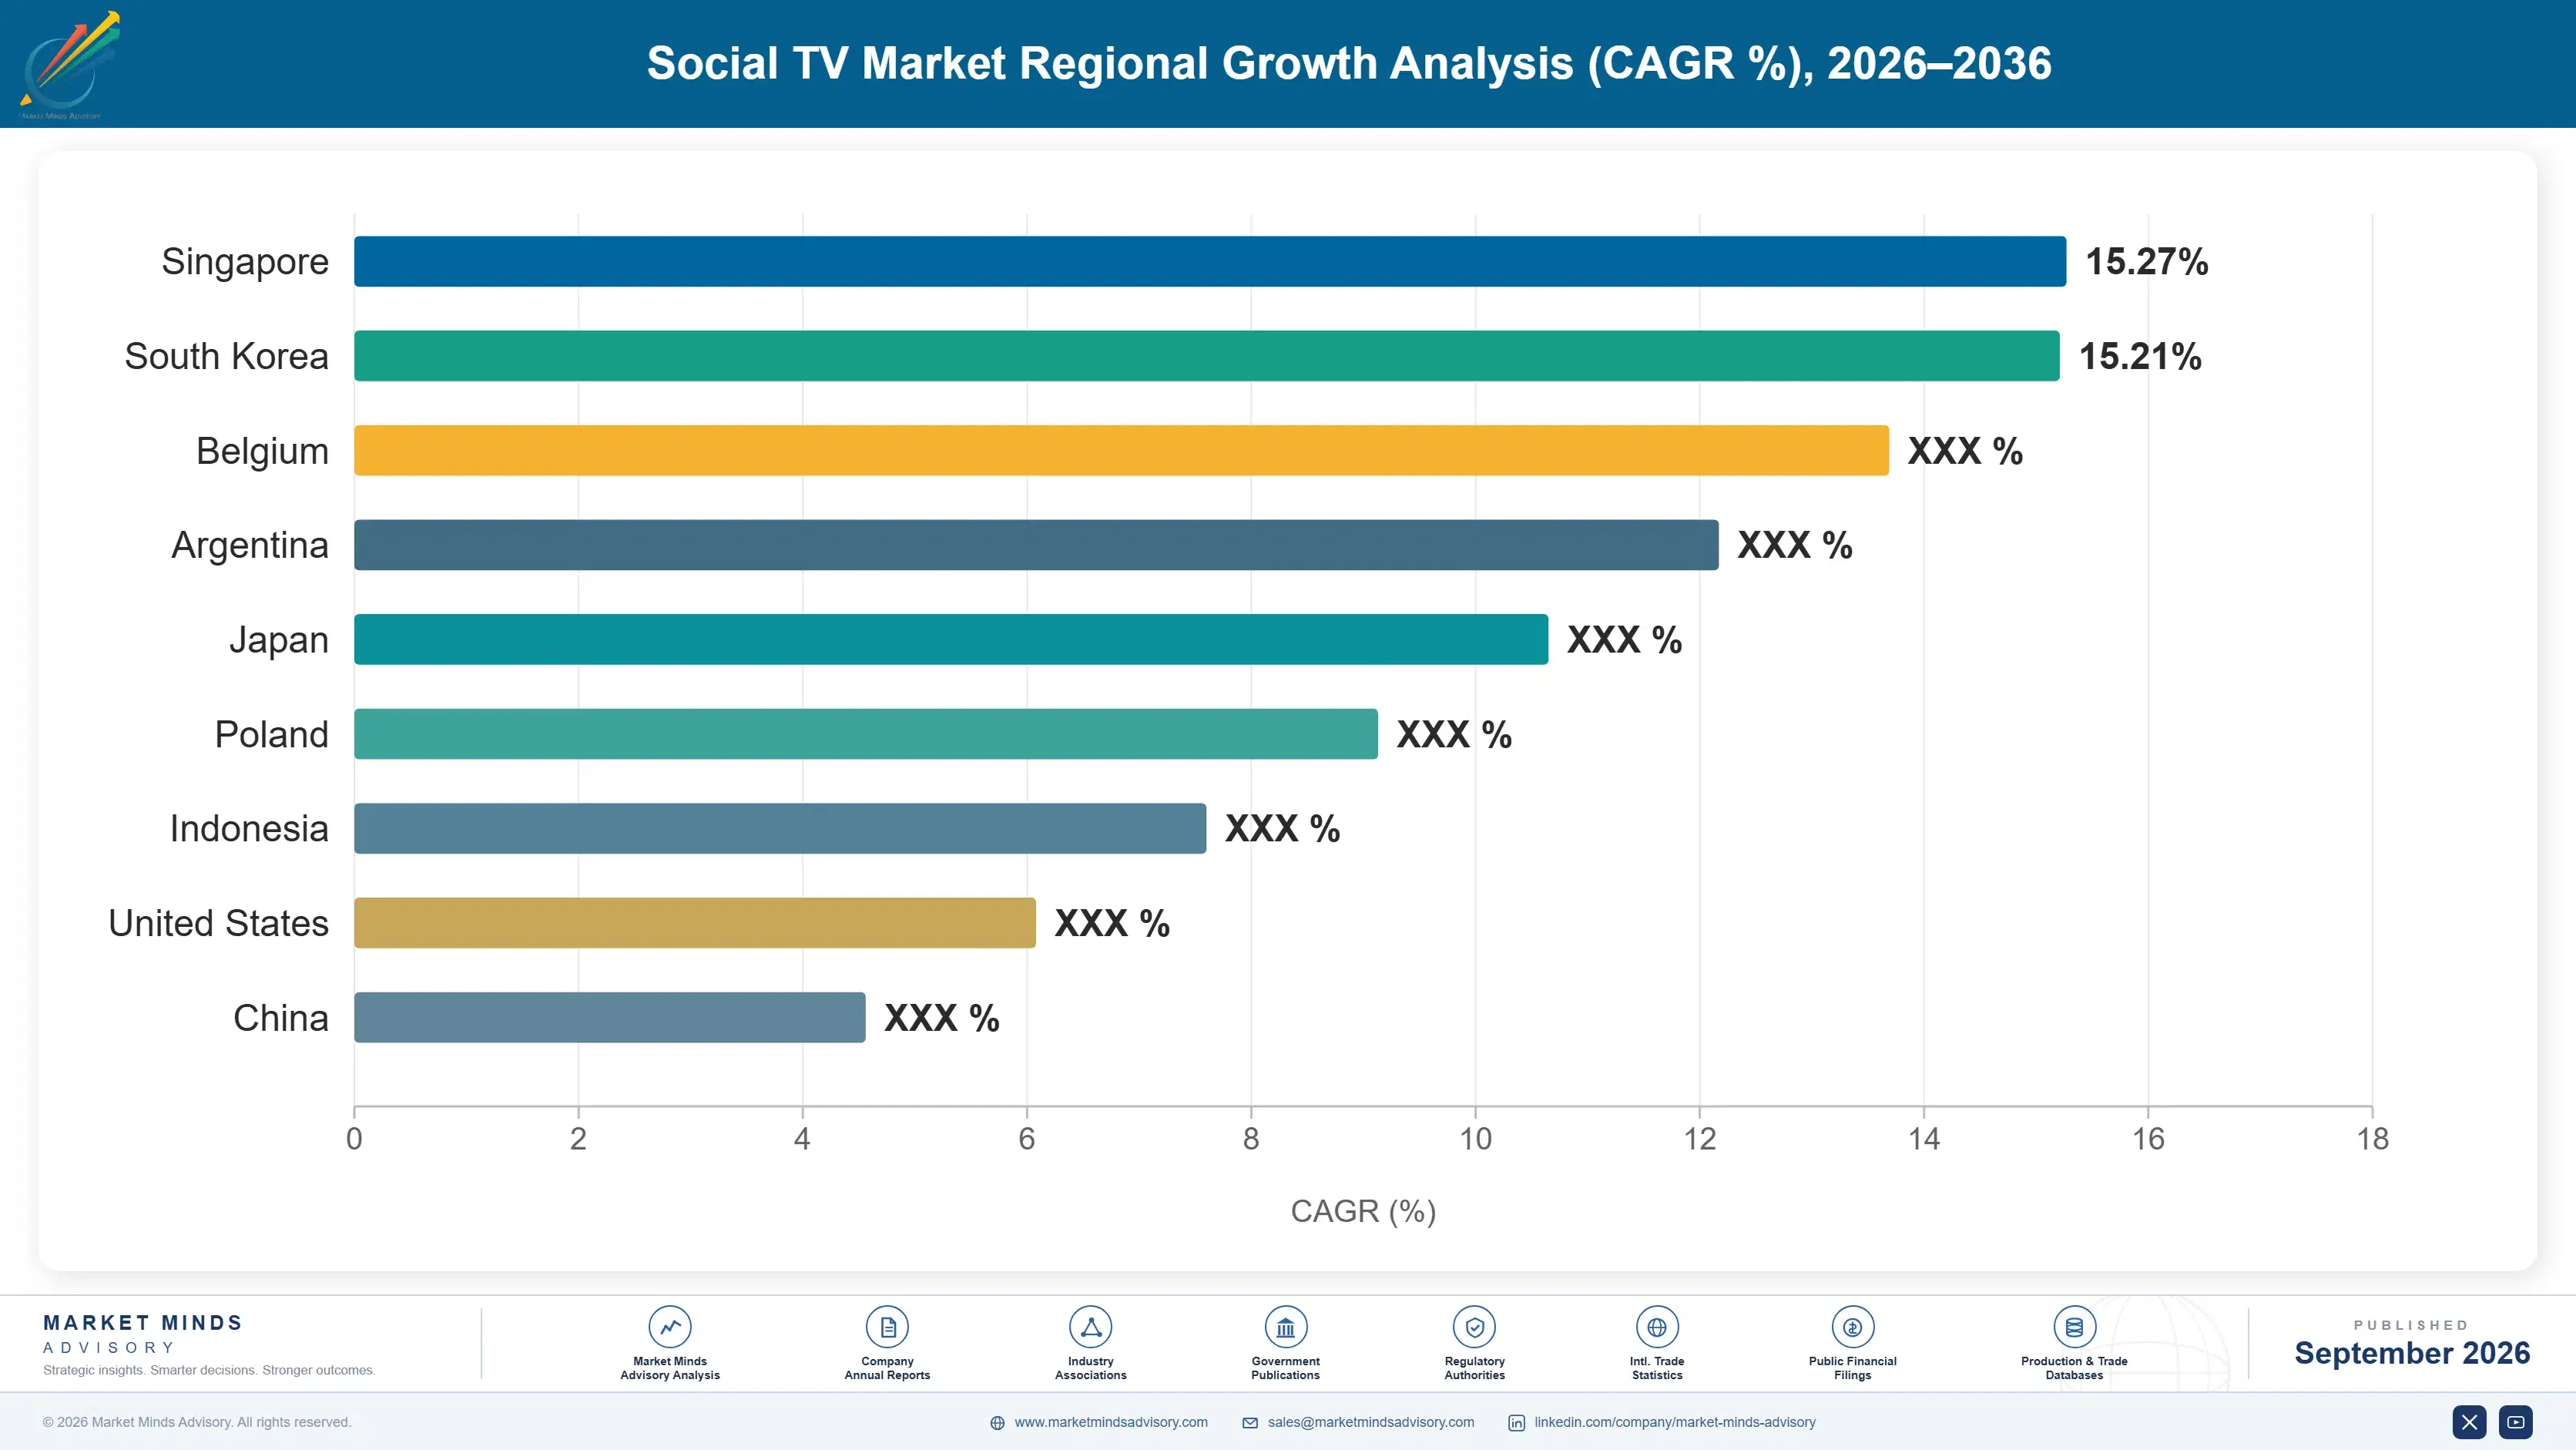
North America holds the largest share on the strength of a dense concentration of major streaming and social media platforms, while East Asia and Western Europe follow as native watch-party features expand across more platforms worldwide over the coming decade, narrowing the current gap steadily.

North America

A dense concentration of major streaming platforms and social media companies headquartered in the United States gives the region first access to newly launched watch-party and social viewing features months before they reach international markets, sustaining a durable adoption lead. Live sports broadcasting, deeply embedded in American entertainment culture, provides an especially strong content pairing for synchronized viewing features that platforms actively promote around major sporting calendars. Canadian streaming subscribers are following a similar adoption trajectory roughly a product cycle behind their American counterparts. Advertising and sponsorship revenue tied to fan engagement analytics concentrates heavily in this region given the scale of major professional sports league media rights deals. Streaming platforms increasingly compete for the same live sports rights packages.
Share: 32% | CAGR: 14.0% (2026 to 2036)

Western Europe

Football broadcasting across England, Germany, and Spain provides a natural content pairing for synchronized viewing features, with major streaming and broadcast platforms increasingly building social engagement tools specifically around match-day viewing experiences. Data protection requirements under European privacy law push platforms toward more conservative consent-based engagement data collection than some other regions require, adding compliance complexity to fan analytics monetization. Regional streaming platforms are adopting native watch-party features somewhat more cautiously than American counterparts given smaller subscriber bases relative to development investment required. Growth trails North America because feature investment here typically follows proven American platform successes rather than leading innovation. Regulators across the continent increasingly compare compliance frameworks before finalizing product launches.
Share: 22% | CAGR: 11.5% (2026 to 2036)
Regional intelligence for 5 additional markets available in the complete report: East Asia, South Asia and Pacific, Latin America, Middle East and Africa, Eastern Europe. Contact sales@marketmindsadvisory.com.
social-tv-market-country-cagr-analysis-1789986564247

Where Social TV Margins Actually Build

Margin expansion concentrates around fan analytics monetization and premium subscription tiers rather than the base watch-party feature itself, since sponsorship data products and retention-driven pricing carry far higher margin than the underlying synchronization technology alone once a platform is deployed. Vendors ignoring this shift lose margin steadily to faster-moving rivals across the entire category.

Sponsorship Analytics Packages Sold to Advertisers

Platforms are packaging fan engagement data into premium sponsorship reporting products that command meaningfully higher advertising rates than traditional impression-based metrics alone, giving sponsors measurable engagement proof their own marketing teams increasingly demand before committing budget. This premium tier now commands roughly 25% more advertising value than comparable traditional sponsorship packages lacking equivalent engagement reporting depth. Platforms that build detailed reporting dashboards directly into their analytics products are capturing a larger share of this premium pricing available in the market. This pricing structure is becoming standard among platforms evaluating monetization strategy.
Market Impact: Adds a strong 25 percent sponsorship rate premium

Premium Subscription Tiers Tied to Social Feature Access

Platforms are gating advanced watch-party capabilities, including larger group sizes and enhanced social features, behind premium subscription tiers that command meaningfully higher monthly pricing than base subscriptions offering only basic playback access. Subscribers who upgrade specifically for social features report satisfaction with the premium tier's 22% price uplift, since the alternative of using third-party tools carries its own friction and reliability cost that platform-native features avoid entirely. This structure is becoming standard among platforms evaluating monetization strategy. Platforms increasingly treat this tier as a core monetization lever. Product teams increasingly design tier structures specifically around this pricing insight.
Market Impact: Adds a strong 22 percent premium tier uplift

Creator Partnership Revenue Sharing for Hosted Communities

Rather than competing directly with creator-hosted watch communities, platforms increasingly partner with popular creators to host official synchronized viewing events, sharing subscription and advertising revenue generated through creator-driven audience participation. This partnership channel now represents close to 28% of new social viewing feature engagement among younger demographics, up sharply from a much smaller share several years ago, as platforms recognize creator audiences bring engagement that platform marketing alone struggles to replicate as effectively. Platform marketing teams increasingly view creator partnerships as essential to broader growth strategy. This trend shows no sign of slowing across the wider industry.
Market Impact: Captures a full 28 percent of younger engagement

Multi-Year Broadcast Rights Bundles With Analytics Included

Platforms and technology vendors are bundling fan engagement analytics capability directly into multi-year broadcast rights and technology licensing agreements, converting what used to be a separate add-on purchase into a standard contract component that generates predictable recurring revenue. Net revenue retention across these bundled contracts averages 124%, since rights holders naturally expand analytics usage as they discover additional sponsorship monetization opportunities the data enables across their broader broadcast portfolio. Rights holders increasingly view bundled analytics as a standard contract expectation. Vendors report this bundling meaningfully strengthens contract renewal rates over time.
Market Impact: Sustains a very strong 124 percent revenue retention

Who Controls the Margin Pool

Five companies control roughly 30% of global social TV revenue, a moderate concentration that leaves considerable room for specialized startups to win individual creator and niche community engagement. Amazon and Disney lead by a meaningful margin over Comcast, X Corp, and Discord, though the gap has narrowed as platform-native features expand across the broader streaming landscape. That gap has held steady.
Current competitive activity plays out across three fronts: streaming platforms racing to build native watch-party capability ahead of rivals, broadcasters and analytics vendors competing for major sports league fan engagement contracts, and creator-hosted community platforms building partnership relationships with major streaming services. All participants are evaluated on a subscription and engagement revenue basis, consistently disclosed across annual reports industrywide.

Specialized creator-hosted community platforms represent the clearest source of emerging pressure on established streaming giants, since these platforms let audiences organize around specific creators rather than platform-defined content libraries alone. Rankings could shift first among younger demographic segments most engaged with creator-driven content, before any comparable threat reaches the broadcast fan analytics tier that still anchors established media companies' revenue base. Media companies are watching this shift closely.
social-tv-market-company-positioning-matrix-1789986564783

Competitive Moat and Risk Dimensions

AMAZON.COM INC

Moat: Deep Prime Video Integration Scale

Amazon integrates watch-party features directly into its massive Prime Video subscriber base, giving it distribution scale that standalone social viewing startups cannot match without years of comparable subscriber acquisition investment. That integrated relationship also lets Amazon bundle social features with broader Prime membership value in ways pure-play competitors cannot replicate.
AMAZON.COM INC

Risk: Feature Prioritization Behind Core Commerce

Social TV features compete for engineering resources against Amazon's much larger core commerce and cloud computing priorities, potentially limiting the pace of social feature innovation relative to competitors who treat social viewing as a primary strategic focus rather than one feature among many corporate priorities.
THE WALT DISNEY COMPANY

Moat: Franchise Content Fan Engagement Depth

Disney's deep catalog of franchise content with passionate existing fan communities gives its social viewing features a natural engagement advantage that platforms without comparable franchise depth cannot replicate quickly. That built-in fan enthusiasm translates into higher organic social feature adoption than platforms relying purely on feature marketing alone.
THE WALT DISNEY COMPANY

Risk: Content Library Breadth Limitations

Disney's content library, while deep in franchise properties, offers less breadth across genres than some competitors, potentially limiting social feature engagement among subscribers seeking content categories outside Disney's core franchise strengths and family-oriented programming focus. Analysts occasionally cite this narrower breadth when comparing subscriber engagement metrics across major streaming rivals.

Players Tracked

Prominent Players

Amazon.com Inc
The Walt Disney Company
Comcast Corporation
X Corp
Discord Inc

Other Key Players

Netflix Inc
Warner Bros Discovery Inc
Paramount Global
Meta Platforms Inc
TikTok Inc
Twitch Interactive Inc
YouTube LLC
Roku Inc
Scener Inc
Teleparty Inc
Kosmi Inc
Watch2Gether GmbH
Grabyo Ltd
Zype Inc
Piksel Inc

Recent Developments

MARCH 2026

Disney Expands GroupWatch to Support Larger Viewing Parties

Disney expanded its GroupWatch synchronized viewing feature to support larger group sizes and enhanced reaction sharing capability, responding to subscriber demand for features comparable to competing platforms that had already expanded group viewing capacity limits. Subscriber feedback had specifically requested these expanded capabilities for several release cycles.
Signal: Signals group size expansion becoming a competitive feature battleground across major platforms broadly this coming year.
OCTOBER 2025

Comcast Acquires Fan Engagement Analytics Startup

Comcast acquired a venture-backed startup specializing in real-time fan engagement analytics for live sports broadcasting, adding sponsorship reporting capability directly into its existing broadcast platform rather than requiring separate vendor integration for analytics products. The acquired team continues developing new analytics capability for future broadcast platform releases.
Signal: Signals broadcasters consolidating adjacent analytics capability through direct acquisition rather than a much slower partnership deal.
MAY 2026

Discord Signs Partnership Agreement With Major Streaming Platform

Discord signed a partnership agreement with a major streaming platform to enable official creator-hosted watch parties directly within Discord communities, sharing subscription referral revenue generated through the partnership arrangement. The partnership expands both companies' reach into younger demographic audiences increasingly active on each platform. Both companies expect meaningful growth.
Signal: Signals creator community platforms becoming central to the entire streaming distribution strategy across the wider industry.

What Drives Social TV Platform Cost

Engineering and synchronization infrastructure account for roughly 36% of platform delivery cost, sourced primarily from internal development teams and cloud infrastructure providers whose global data center footprint determines achievable playback synchronization latency for geographically distributed viewers. Content delivery network capacity makes up a further meaningful share of ongoing cost, particularly during high-demand live events. Assembly and quality testing labor add a further meaningful share of total cost.
Cloud compute and content delivery network pricing rose meaningfully during 2024 as broader streaming video demand growth competed for the same infrastructure capacity that social viewing features depend on, a trend documented in several major cloud provider annual reports for that fiscal year. Platforms running dense synchronized viewing infrastructure absorbed several quarters of margin compression before renegotiating volume-based hosting contracts that partially offset the increase.

Platforms operating their own content delivery infrastructure, namely the largest streaming services, weathered the cost spike better than smaller platforms who rent third-party delivery capacity at retail pricing and had far less negotiating leverage during the shortage. That gap in cost exposure is pushing smaller platforms toward multi-vendor sourcing strategies that reduce dependence on any single infrastructure provider's pricing decisions.
social-tv-market-cost-volatility-analysis-1789986564989

Multi-Vendor Content Delivery Sourcing Contracts

Several platforms have signed sourcing agreements spanning multiple content delivery network providers rather than depending on a single vendor, trading some operational simplicity for meaningfully better unit pricing and reduced exposure to any single provider's future price increases during peak demand. This reduces exposure to allocation constraints during periods of high demand competition industrywide.

Edge Caching to Reduce Core Synchronization Load

Engineering teams are pushing more synchronization logic to lightweight edge nodes rather than routing every playback coordination check back to centralized servers, meaningfully reducing core infrastructure load per viewing session while also improving latency for geographically distant viewers. Engineering teams report meaningfully improved latency without sacrificing synchronization reliability at all. Latency improvements benefit every distant viewer.

Committed-Capacity Contracts for Predictable Live Event Load

Platforms are negotiating committed-capacity contracts that guarantee infrastructure availability during scheduled major live events, trading some flexibility for meaningfully improved reliability during the highest-demand viewing moments when synchronization failures carry the greatest reputational cost. Vendors value the predictability these arrangements provide during peak live event demand. Suppliers increasingly favor these committed arrangements over ad hoc capacity purchases.

Portfolio Architecture for Margin Defence

Portfolio economics split into three tiers running from basic synchronized playback through certified premium social features to next-generation analytics and creator partnership offerings carrying the richest margin. Volume tier features compete on basic availability against free third-party alternatives, while premium and next-generation tiers retain pricing power tied to reliability and measured subscriber retention impact built up over multiple product cycles. That gap has held steady for years despite challenger investment.
The tension between volume and premium tiers shows up clearest among mid-tier platforms, who want flagship-level synchronization reliability and analytics capability at a fraction of flagship development cost and are increasingly served by third-party technology vendors offering white-label social viewing infrastructure. Platforms manage that tension by keeping the richest analytics and partnership features exclusive to premium tiers for as long as commercially possible. Platforms who misjudge this trade-off risk losing volume within a single renewal cycle.

High-value margin pools concentrate in fan analytics monetization and creator partnership revenue sharing, both of which the top five companies currently capture disproportionately relative to their base feature availability alone. Smaller platforms instead compete on niche community specialization where leaders choose not to invest.

Volume / Commodity-Adjacent Tier

Basic synchronized playback and chat features competing against free third-party browser extensions and standalone tools. Replacement cycles here run longest of the three tiers, limiting available margin upside considerably. Margins remain thin here.
Gross Margin: 18-26%

Premium / Certified Tier

Reliable native watch-party features with enhanced reaction sharing and larger group capacity trusted across major streaming platforms. This tier anchors most platform profitability during any given fiscal year currently. Buyers value this tier highly.
Gross Margin: 38-46%

Sustainability / Regulatory / Next-Generation Tier

Fan engagement analytics, sponsorship data packages, and creator partnership revenue sharing commanding the richest margin available. Adoption here is still climbing steeply among large broadcast buyers each year. Growth here stays strong.
Gross Margin: 48-56%
social-tv-market-portfolio-architecture-1789986565518

High-value Sub-segments and Strategic Watch-out

Fan Engagement Analytics for Live Sports Broadcasting

This segment combines strong growth with the richest margin in the category, since engagement data already collected for platform purposes requires little incremental cost to package into sponsorship reporting products. Vendor research budgets increasingly prioritize this segment over generic engagement features. This priority shows no sign of shifting soon.
Gross Margin: 48-56%

Creator Partnership Revenue Sharing Programs

Creator partnership programs carry strong margin and steady growth tied directly to expanding creator economy engagement among younger demographic segments increasingly valued by advertisers. Advertisers increasingly expect this reach bundled as standard rather than premium. Advertisers increasingly compete for access to this younger demographic segment directly.
Gross Margin: 40-48%

Basic Synchronized Playback and Chat Features

The largest usage volume remains basic synchronized playback bundled into standard subscriptions, where growth is moderate and monetization is thin, but scale remains commercially essential. Platforms rarely walk away from this tier despite its comparatively thinner margin. Scale remains essential to funding development elsewhere entirely.
Gross Margin: 18-26%

Legacy Second-Screen Companion App Contracts

Standalone second-screen companion apps carry decent margin today but face a shrinking addressable base as native in-app features increasingly replace the need for separate companion applications. Platforms are gradually sunsetting these apps as remaining native features complete rollout. Revenue should decline gradually rather than collapse suddenly over time.
Gross Margin: 24-32%

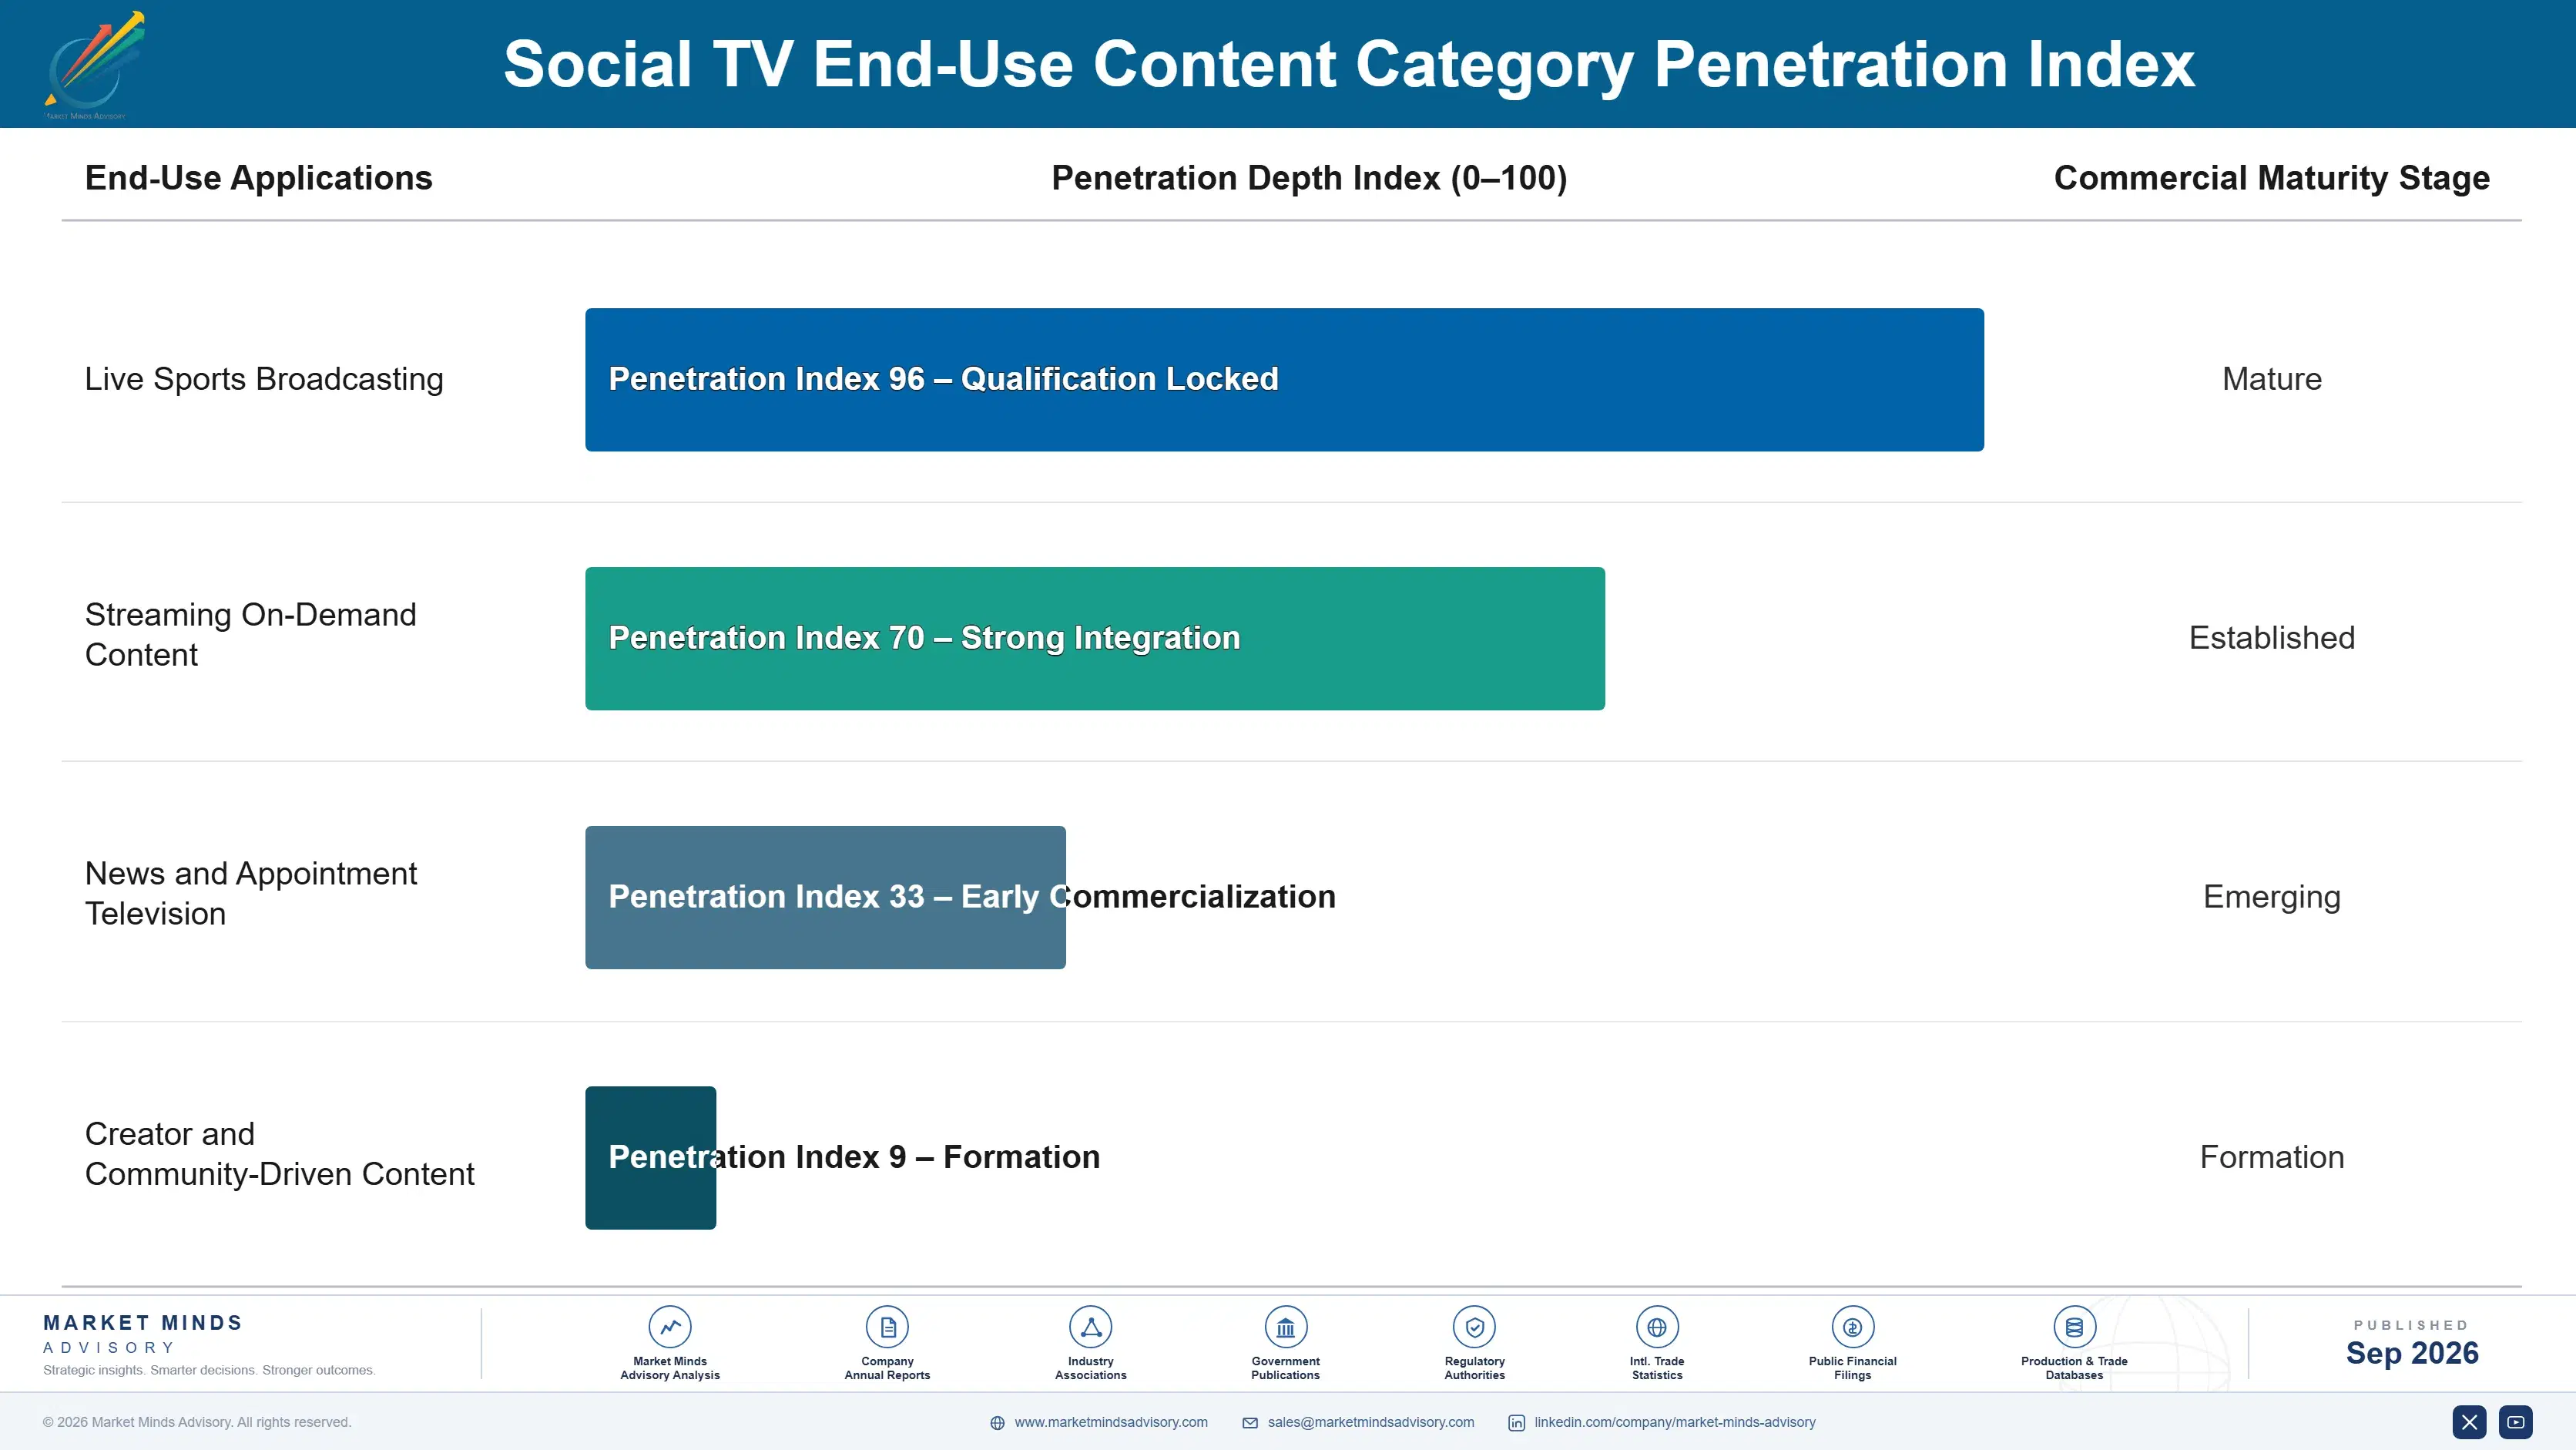
Why Social TV Features Compound

Social TV features behave like annuity assets rather than one-time product launches, since fan analytics monetization, premium subscription tiers, and creator partnership revenue sharing all generate ongoing revenue against a single initial feature investment for years afterward. Platforms treating watch-party capability as a one-time launch cede lifetime value to rivals building recurring monetization layers. Vendors ignoring this compounding potential lose ground to better-instrumented rivals over time.
Adoption depth varies sharply by content type. Live sports and appointment television viewers integrate social features into weekly viewing routines with dedicated engagement patterns, producing deep, sticky usage that survives individual product update cycles. On-demand catalog viewers, by contrast, engage with social features more sporadically around specific popular releases, making that usage segment less predictable and less monetizable through sustained sponsorship analytics products. Vendors courting sports broadcast accounts increasingly design tools around that stickier engagement pattern.

A generational shift is also underway as younger viewers who grew up with social media-native content consumption expect synchronized social viewing as a baseline platform feature rather than a premium upgrade, skipping the solitary-viewing default that older viewer generations still often assume applies to television consumption.
social-tv-market-end-use-penetration-index-1789986566044

Where To Place Social TV Bets

These are among the four positions where our research anticipates prominent divergence between winners and laggards over the coming forecast period. Each is grounded in the demand model, the regulatory perimeter, and the announced capacity pipeline.
01 / NATIVE INTEGRATION PRIORITY

Build synchronized watch-party features natively before third-party tools capture the category

Platforms still relying on third-party watch-party tools are leaving durable retention value on the table while leaders build native synchronization capability that measurably improves subscriber churn metrics tracked closely by investors. The window to build comparable native capability is narrowing as subscriber expectations shift toward built-in social features rather than accepting external tool friction as a normal viewing experience. Smaller platforms should prioritize native integration now, even at meaningful engineering cost, rather than risk permanent retention disadvantage against faster-moving rivals over time.
02 / FAN ANALYTICS MONETIZATION

Build sponsorship-ready engagement analytics ahead of broadcast rights renewal cycles

Broadcasters and rights holders without sophisticated fan engagement analytics capability are leaving sponsorship revenue on the table while competitors package granular engagement data into premium reporting products that command meaningfully higher advertising rates. Building this capability before major rights renewal negotiations gives rights holders a stronger negotiating position and a clearer revenue story to present to prospective sponsors and media partners. Companies that invest in analytics capability now will capture disproportionate sponsorship revenue as rights renewal cycles approach across their broader broadcast portfolio.
03 / CREATOR PARTNERSHIP DEVELOPMENT

Build formal creator partnership programs before community platforms capture younger audiences

Creator-hosted watch communities are capturing meaningful engagement among younger demographic segments that platforms without formal creator partnership programs risk losing entirely to independent community platforms. Building partnership infrastructure requires investment in revenue sharing systems and creator relationship management beyond typical platform feature development, but the audience access it provides meaningfully offsets that cost given how difficult younger audiences are to reach through platform marketing alone. Platforms that invest now will retain younger subscriber share and build durable engagement advantages that compound over multiple renewal cycles.
04 / SYNCHRONIZATION INFRASTRUCTURE INVESTMENT

Invest in reliable synchronization infrastructure before reputation damage from lag incidents spreads

Synchronization failures during high-visibility live events generate outsized subscriber frustration and social media criticism relative to their technical scope, making infrastructure reliability investment disproportionately valuable compared to its direct engineering cost. Platforms that experience visible synchronization failures during major live events risk lasting reputation damage that undermines broader feature adoption even after the technical issue is resolved. Platforms should invest in redundant infrastructure and graceful degradation capability well before major live events rather than reacting after a visible failure damages subscriber trust.

Engagement Snapshot From the Field

A live engagement with an industry participant carrying material or product regulatory and market exposure ahead of a defining policy shift, showing how our research translates into a defensible multi-year portfolio strategy.
MARKET MINDS ADVISORY · CLIENT ENGAGEMENT SUMMARY
Social TV Producer Strategic Portfolio Review and Transition Roadmap 2026·Investment Scenario on Social TV Exposure Evaluation 2025-26
CLIENT PROFILE
The client operates a mid-sized regional sports broadcasting network covering professional and collegiate athletics across a single large national market, running traditional broadcast operations without dedicated fan engagement analytics capability despite growing sponsor requests for measurable digital engagement data. Competing networks with analytics platforms had begun winning sponsorship deals the client previously held. Leadership had grown increasingly concerned about the pace of sponsorship losses.
STRATEGIC CHALLENGE
Management needed to decide whether to build fan engagement analytics capability internally or partner with a specialized technology vendor, while also evaluating how quickly the capability needed to launch given upcoming sponsorship renewal negotiations that would benefit considerably from demonstrable engagement data. Board members had grown increasingly impatient with the pace of prior internal discussions.
MMA APPROACH
MMA benchmarked comparative build-versus-partner economics for fan engagement analytics against sponsor renewal timelines and vendor capability data gathered through primary interviews with peer regional sports networks. The engagement modeled revenue impact under each approach against the client's compressed sponsorship renewal timeline requirements. The analysis also weighed vendor reputation and integration speed against internal build timelines.
KEY FINDINGS
  1. Partnering with an established analytics vendor launched capability considerably faster than internal development would have allowed., exceeding what the client's leadership team had initially projected
  2. Sponsors responded favorably to the new engagement data during renewal discussions, supporting meaningfully higher rate proposals than prior contracts., a meaningful factor in securing the renewed sponsorship commitment
  3. Internal development would have required specialized engineering hires the client's budget could not support alongside broadcast operations., a constraint the client's board had not fully appreciated beforehand
  4. Competing networks that delayed similar analytics investment faced measurably weaker sponsorship renewal outcomes that season., a gap the client specifically wanted to avoid repeating
CLIENT PROFILE
The client operates a mid-sized regional sports broadcasting network covering professional and collegiate athletics across a single large national market, running traditional broadcast operations without dedicated fan engagement analytics capability despite growing sponsor requests for measurable digital engagement data. Competing networks with analytics platforms had begun winning sponsorship deals the client previously held. Leadership had grown increasingly concerned about the pace of sponsorship losses.
STRATEGIC CHALLENGE
Management needed to decide whether to build fan engagement analytics capability internally or partner with a specialized technology vendor, while also evaluating how quickly the capability needed to launch given upcoming sponsorship renewal negotiations that would benefit considerably from demonstrable engagement data. Board members had grown increasingly impatient with the pace of prior internal discussions.
MMA APPROACH
MMA benchmarked comparative build-versus-partner economics for fan engagement analytics against sponsor renewal timelines and vendor capability data gathered through primary interviews with peer regional sports networks. The engagement modeled revenue impact under each approach against the client's compressed sponsorship renewal timeline requirements. The analysis also weighed vendor reputation and integration speed against internal build timelines.
KEY FINDINGS
  1. Partnering with an established analytics vendor launched capability considerably faster than internal development would have allowed., exceeding what the client's leadership team had initially projected
  2. Sponsors responded favorably to the new engagement data during renewal discussions, supporting meaningfully higher rate proposals than prior contracts., a meaningful factor in securing the renewed sponsorship commitment
  3. Internal development would have required specialized engineering hires the client's budget could not support alongside broadcast operations., a constraint the client's board had not fully appreciated beforehand
  4. Competing networks that delayed similar analytics investment faced measurably weaker sponsorship renewal outcomes that season., a gap the client specifically wanted to avoid repeating
RECOMMENDED STRATEGY
Phase 1: Phase 1 (Months 1 to 2): Select and onboard a fan engagement analytics vendor ahead of the sponsorship renewal window. Phase 2: Phase 2 (Months 3 to 5): Deploy analytics capability across major broadcast events to build a credible data track record for sponsors. Phase 3: Phase 3 (Months 6 to 8): Present engagement data directly in sponsorship renewal negotiations with prospective partners., ahead of the following season's renewal cycle
OUTCOME
Within eight months the client reported completing sponsorship renewals at meaningfully higher rates than the prior contract cycle, alongside winning back a sponsor relationship lost to a competing network (client-reported, unverified by MMA), attributing both improvements to the new engagement analytics capability and its vendor partner's reporting depth.

Frequently Asked Questions

Foundational context covering the market sizes, CAGR, scope, country, region and competition that inform every finding below. This section is provided to cover basics and most often pre-purchase conversations, answered from the MMA Primary Research Dataset.

What is the current size of the Social TV Market?

The market is valued at 4.6 billion dollars in 2025. It is projected to reach 5.2 billion dollars in 2026 as native platform integration accelerates.

How large will the Social TV Market be by 2036?

The market is projected to reach roughly 17.6 billion dollars by 2036. That represents more than three times the 2026 value over the ten-year forecast window.

What is the CAGR for the Social TV Market 2026 to 2036?

The base case CAGR is 13.0% annually through 2036. Bull and bear scenarios range from 11.8% to 14.3% depending on feature adoption pace and privacy regulation developments.

Which segment is growing fastest?

Live watch-party and synchronized viewing platforms lead at a 17.0% CAGR, well ahead of every other segment. That pace is roughly 1.31 times the overall market's average growth rate.

Who are the major companies in the Social TV Market?

Amazon, Disney, Comcast, X Corp, and Discord lead the category by revenue, together holding roughly thirty percent of total global category revenue across every segment.

Which country is growing fastest?

The United States leads country-level growth at a 14.5% CAGR, ahead of every other national market tracked. Dense streaming and social media platform concentration drives that pace.

Report Segmentation Architecture

The full report scope spans multiple orthogonal segmentation dimensions, with cross-tabulated demand data provided for each dimension pair. Coverage extends further to regional breakdowns, trend trajectories, and the competitive detail needed to support segment-level decision-making.

By Feature Function Type

  • Live Watch-Party and Synchronized Viewing Platforms
  • Fan Engagement and Analytics Platforms for Broadcasters
  • Second-Screen Companion Apps
  • Social Media Live-Reaction Integration Tools
  • Interactive Polling and Voting Overlay Systems
  • Creator-Hosted Social Viewing Communities

By End-Use Content Category

  • Live Sports Broadcasting
  • Streaming On-Demand Content
  • News and Appointment Television
  • Creator and Community-Driven Content

By Commercial Dimension

  • Platform-Native Feature Integration
  • Sponsorship Analytics Licensing
  • Creator Partnership Revenue Sharing
  • Third-Party Technology Vendor Contracts

By Region

  • North America
  • Western Europe
  • East Asia
  • South Asia and Pacific
  • Latin America
  • Middle East and Africa
  • Eastern Europe

Scope, Methodology, and Coverage

Every figure in this report is reproducible from documented input assumptions. The scope below maps the historical period, the forecast horizon, the segmentation dimensions, and the countries covered, alongside the underlying primary and qualitative methodology.
Historical Period
2020 to 2025
Forecast Period
2026 to 2036
Base Year
2025 (USD billions; MMA Primary Research Dataset, September 2026)
Market Definition
This report covers social TV platforms and features, technology that enables synchronized group viewing, live social reaction integration, and fan engagement analytics tied to television and streaming content consumption. It excludes general social media platforms without television-specific synchronized viewing features, standalone video conferencing tools not built for content co-viewing, and broadcast production equipment used only for content creation rather than audience engagement.
Quantitative Units
USD billions (current prices); active feature user counts where applicable
Segmentation Dimensions
By Feature Function Type; By End-Use Content Category; By Commercial Dimension; By Region
Regions Covered
North America, Western Europe, East Asia, South Asia and Pacific, Latin America, Middle East and Africa, Eastern Europe
Countries Covered
USA, China, Germany, France, UK, Japan, South Korea, India, Australia, Canada, Brazil, Mexico, Indonesia, Vietnam, Thailand, Malaysia, UAE, Saudi Arabia, South Africa, Nigeria, Turkey, Poland, Netherlands, Italy, Spain, Sweden, Switzerland, Argentina, Colombia, Singapore, and additional markets relevant to this sector
Key Companies Profiled
Amazon.com Inc, The Walt Disney Company, Comcast Corporation, X Corp, Discord Inc, Netflix Inc, Warner Bros Discovery Inc, Paramount Global, Meta Platforms Inc, TikTok Inc, Twitch Interactive Inc, YouTube LLC, Roku Inc, Scener Inc, Teleparty Inc, Kosmi Inc, Watch2Gether GmbH, Grabyo Ltd, Zype Inc, Piksel Inc
Quantitative Methodology
Primary survey, n=3,800 respondents, Q4 2025, six countries; demand-side model with trade association cross-validation
Qualitative Methodology
47 expert interviews, Q4 2025; applied to validate demand model assumptions, identify emerging dynamics, and assess competitive positioning
Report Format
PDF and XLSX data workbook (Word format preview document)
Publisher
Market Minds Advisory
Report Code
MMA-2026-TEC-600
Published
September 2026
Contact
sales@marketmindsadvisory.com | www.marketmindsadvisory.com

Purchase the full Social TV Market Report (2026 to 2036).

The full report delivers a complete quantitative and qualitative assessment of the social TV market through 2036, including segment-level sizing across all six feature function categories and country-level detail across thirty markets. It profiles twenty companies with comparative positioning on synchronization reliability, fan analytics depth, and creator partnership programs. Analysts also model three forecast scenarios against feature adoption pace and privacy regulation developments. Buyers receive the underlying data tables, primary survey results from 3,800 respondents, and 47 expert interviews supporting every forecast assumption in the report.
Segment-level sizing across six feature function categories
Country-level data across thirty covered markets
Comparative competitive profiles of twenty companies
Primary survey results from 3,800 respondents
Expert interview transcripts from 47 professionals
Five-year revenue lever and margin analysis

Built For The People Who Decide

From boardroom strategy to bench-side execution, this report is read cover-to-cover by leaders shaping the next decade of their industry, turning demand scenarios, market dynamics and valuation benchmarks into decisions.
CXOs/ Presidents/ VPs/ Managers
M&A and Corporate Development
Strategy Teams and R&D Heads
Procurement and Product Directors
Regulatory and Compliance Leaders
Investor Relations and Equity Analysts