Market Minds Advisory
Social Media Engagement Applications Market

Social Media Engagement Applications Market: Social Media Engagement Applications Market: Application Classes, Platform Dependency and Budget Migration 2026 to 2036

Every company in this market builds on interfaces owned by somebody else, who can change the price or close the door without warning. In 2023 one of them did exactly that.

Lead Analyst

Published

September 2026

Make Smarter Decisions with Customized Research Insights

Request a free sample report and evaluate market opportunities, growth trends, and competitive dynamics relevant to your business needs.

2025 MARKET VALUE$8.6BMarket Size 2025
2036 FORECAST VALUE$28.2BBase Case , 2026 to 2036
CAGR 2026 TO 203611.4 %Bull 12.6% / Bear 10.2%
INCREMENTAL OPPORTUNITY$18.6BNet 10- year value creation
EXPANSION MULTIPLE2.94x2036 value over 2026 base
Strategic Levers
M&A Pipeline
Regional Outlook
Country Rankings
Competitive Intelligence
Segmental Deep-dive
Call-Us : 91 93563 13602

Executive Snapshot and Market Trajectory.

Social engagement software is a business built entirely on other people's plumbing. Six platforms control the interfaces every vendor depends on, set the terms, and revise them when it suits. That single dependency explains more about this market's economics than any product comparison ever will, and it always has.
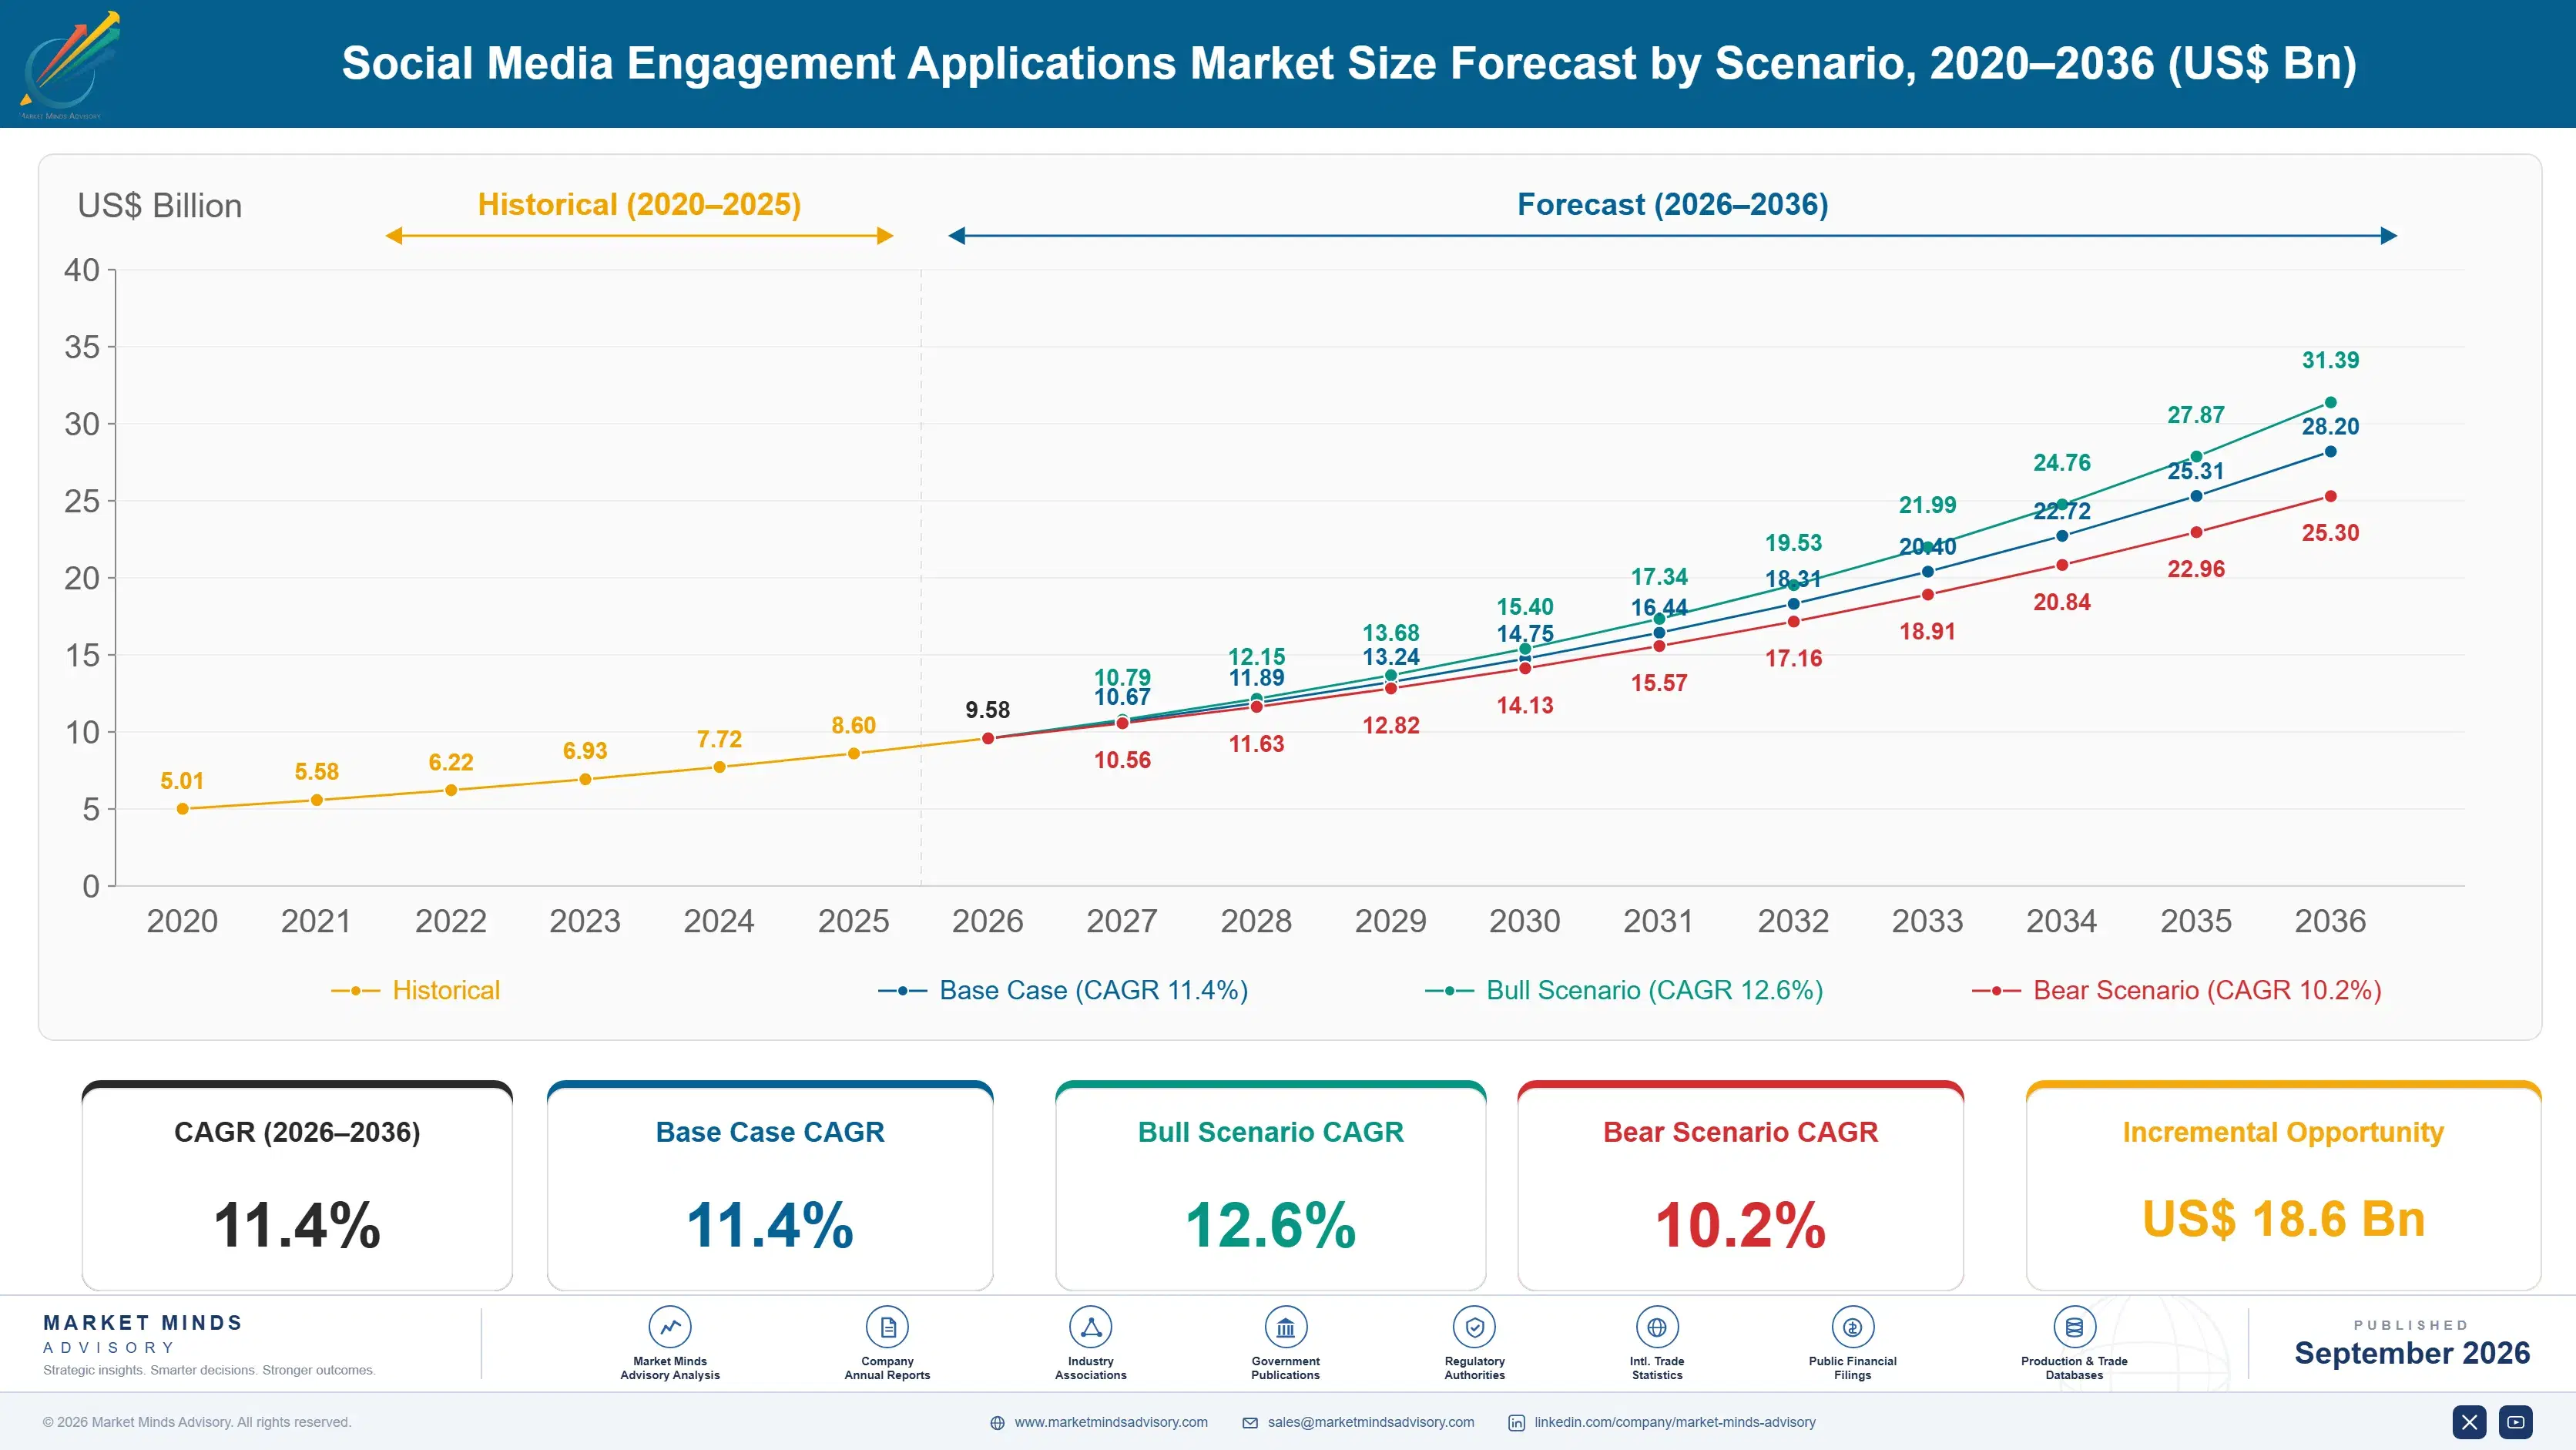
The market reaches USD 9.58 billion in 2026 and USD 28.19 billion by 2036, a 2.94 times expansion at 11.4%. Creator and influencer management platforms grow at 17.1%, half again the market rate of 11.4%, as brand budget shifts out of paid media and into people. North America holds 28% of subscription spending on enterprise software budgets, while East Asia holds 26% on activity volume. Indonesia alone grows fastest at 16.8%, on live commerce.
Five vendors hold 32% of subscription revenue, which is fragmented for enterprise software and reflects how easily a point solution can enter. Sprinklr and Salesforce sell suites into large brands with long procurement cycles. Hootsuite and Buffer built on self-service volume. Dozens of creator management specialists arrived in the last five years and most of them will not survive the next API pricing change.
Market Definition
This report covers subscription software used by organisations to publish, monitor, moderate and measure engagement across social platforms: social listening and monitoring, community management and moderation, creator and influencer management, publishing and scheduling suites, social customer care, and social commerce conversion tools. It excludes paid social advertising spend and the media buying platforms that place it, the social networks themselves, general marketing automation, and consumer-facing social applications.
Base Year Value
$8.6B in 2025 (MMA Primary Research Dataset, September 2026)
Forecast Period
2026 to 2036, eleven discrete annual values
CAGR
11.4% base case. Bull 12.6%. Bear 10.2%.
Fastest Growth Segment
Creator and Influencer Management Platforms: 17.1% CAGR
Fastest Growth Country
Indonesia: 16.8% CAGR
Fastest Growth Region
South Asia and Pacific: 13.6% CAGR
Largest Region
North America: 28% of 2025 global value
Market Leaders
Sprinklr, Salesforce, Hootsuite, Adobe and Sprout Social lead on social engagement subscription software revenue. Source: MMA Analysis.
Primary Survey
n=3,800 procurement and R&D decision-makers, Q4 2025, six countries
Methodology
Demand-side build-up, cross-validated against public data, 47 expert interviews

Social Media Engagement Applications Market Forecast Scenarios

social-media-engagement-applications-market-size-forecast-scenario-1789985167962
Between 2020 and 2025 the category compounded at 10.0% through two very different halves. Lockdowns pushed brands onto social channels at speed and vendors grew on almost anything they shipped. Then in 2023 one platform raised interface pricing by orders of magnitude with weeks of notice, several businesses closed, and every buyer started asking vendors a question they had never asked before.
The base case holds 11.4% on three mechanisms. Brand budget keeps moving out of paid placement and into creator relationships, which needs different software and grows creator management at 17.1%. Social commerce is genuinely transactional across Southeast Asia and China, and live selling tooling has no Western equivalent yet. And social customer care keeps absorbing volume from voice and email channels because customers who complain publicly get answered first, which every service organisation has now noticed.
The bull case at 12.6% assumes Western social commerce finally works, which would put transactional tooling in front of brands that currently treat social as awareness only. The bear case at 10.2% is another interface repricing: a platform that closes or charges heavily for access removes product capability overnight, and no vendor here has a defence that survives contact with reality.

Building On Somebody Else's Plumbing

Six platforms matter commercially and every vendor in this market connects to all of them. Those interfaces are not products the platforms sell; they are conveniences the platforms permit, and permission can be revoked, repriced or narrowed at any point with no obligation to anybody. In 2023 one platform demonstrated exactly that, and several vendors closed within months, which nobody in the industry has forgotten.
TOP FIVE CONCENTRATION32%Fragmented across suite vendors and point solution specialists
ANNUAL NET REVENUE RETENTION104%Blended across enterprise and mid-market subscription customer accounts
AVERAGE SEAT PRICEUSD 149Monthly list price per managed user across suites
PLATFORM API DEPENDENCY6 networksSocial platforms whose interfaces every vendor must maintain
ENTERPRISE SALES CYCLE5 monthsEvaluation to contract signature at large brand accounts
CREATOR ROSTER SIZE3400 profilesManaged talent tracked per large consumer brand programme
What that produces is a market where product differentiation is genuinely hard. Every vendor reads the same data through the same pipes, so the difference is workflow, reporting and how a large organisation actually gets work done across dozens of teams. Enterprise buyers pay for that, on sales cycles running 5 months, and self-service buyers do not pay much for anything.
The growth has moved to where the money moved. Brand budget is shifting from paid placement toward creator relationships, which needs software for discovery, contracting, briefing, payment and measurement that nobody built five years ago. Creator management compounds at 17.1%. Social commerce tooling grows on the same logic, though almost entirely in Asian markets where people actually buy things this way.
"Ask any vendor in this category what happens if a platform doubles its interface pricing tomorrow and watch the answer get vague. They all have the same exposure and none of them have a hedge, because there is no hedge available to buy."
Principal Analyst, Marketing and Customer Engagement Software Practice · MMA Technology Practice · September 2026

Market Trends

Brand Budget Moves From Placement To Creator Relationships

A decade ago a consumer brand spent its social budget buying placement and measured impressions. Now a growing share goes to individual creators, which is a completely different operational problem: finding the right people, negotiating terms, briefing them, paying them across jurisdictions and proving what any of it achieved. None of that is what a publishing suite was built to do. Large consumer brands now track rosters running into thousands of profiles and manage them like a supplier base rather than a media buy. Creator and influencer platforms compound at 17.1% against 11.4% for the market on exactly that shift.
Market Impact: Care platforms compound at 12.6%
Asian Social Commerce Is Transactional, Western Is Aspirational

In Indonesia, Thailand and across China, buying something inside a social application is ordinary consumer behaviour rather than a novelty, and live selling sessions move genuine volume through hosts who are part retailer and part entertainer. The tooling that supports that, meaning inventory sync, live session management, order handling and creator commission, has no real Western equivalent because the behaviour does not exist there at comparable scale. Indonesia grows at 16.8%, faster than any other country in this market. Western vendors keep announcing social commerce features into a market that is not buying that way yet.
Market Impact: Duties apply across 27 states

Market Opportunities and Growth Drivers

Public Complaints Get Answered Before Private Ones

A customer who calls a contact centre waits in a queue. A customer who posts the same complaint publicly gets answered within the hour, because the audience is watching and the brand knows it. Every service organisation has worked this out, and the consequence is that social channels absorb contact volume from voice and email at a steady clip. Social customer care platforms compound at 12.6% on that migration. The economics are also better per contact, which is the part finance departments noticed, though the staffing model is entirely different from a traditional contact centre.
Market Impact: Depends on 6 platform interfaces

Regulation Forces Moderation Onto Every Brand Community

The European Union Digital Services Act and comparable rules elsewhere put obligations on anyone operating a public-facing community, not only on the platforms themselves. A brand running a comment section or a customer forum now carries documented duties around illegal content, complaint handling and reporting that it did not carry before. That converts moderation from a reputational nicety into a compliance function with an audit trail, which is a different purchase made by different people with a different budget. Community management tooling has become far less optional than it looked three years ago.
Market Impact: Concentration sits at 32%

Market Restraints and Challenges

Platform Interface Terms Can Change Without Notice

Every product in this category depends on interfaces controlled by 6 platforms that owe vendors nothing and periodically demonstrate it. The root cause is that these interfaces exist to serve the platform's interests rather than to support an industry built on top of them, so access can be repriced, narrowed or withdrawn whenever the calculation changes. The 2023 repricing at one platform closed several businesses within months. Commercially this caps what any vendor can promise a customer. Mitigation runs through multi-platform breadth and through owned-channel data, neither of which removes the exposure and both of which reduce it slightly.
Market Impact: Rosters reach 3400 profiles

Point Solutions Enter Cheaply And Compress Pricing

Building a scheduling tool or a listening dashboard on public interfaces takes a small team and very little capital, which is why this market carries a 32% top five concentration rather than the 60% typical of enterprise software categories. The root cause is that the hard asset, meaning the platform data itself, belongs to somebody else and is equally available to everyone. Commercially this compresses pricing at the low end continuously and forces suite vendors to justify a premium on workflow rather than capability. Mitigation runs through enterprise governance, security review and integration depth, which small entrants cannot fund.
Market Impact: Indonesia compounds at 16.8% yearly
3 additional market trends, 4 additional growth drivers, and 2 additional restraints and challenges are covered in the full report. Contact sales@marketmindsadvisory.com to access the complete intelligence.

Segment CAGR and Growth Architecture

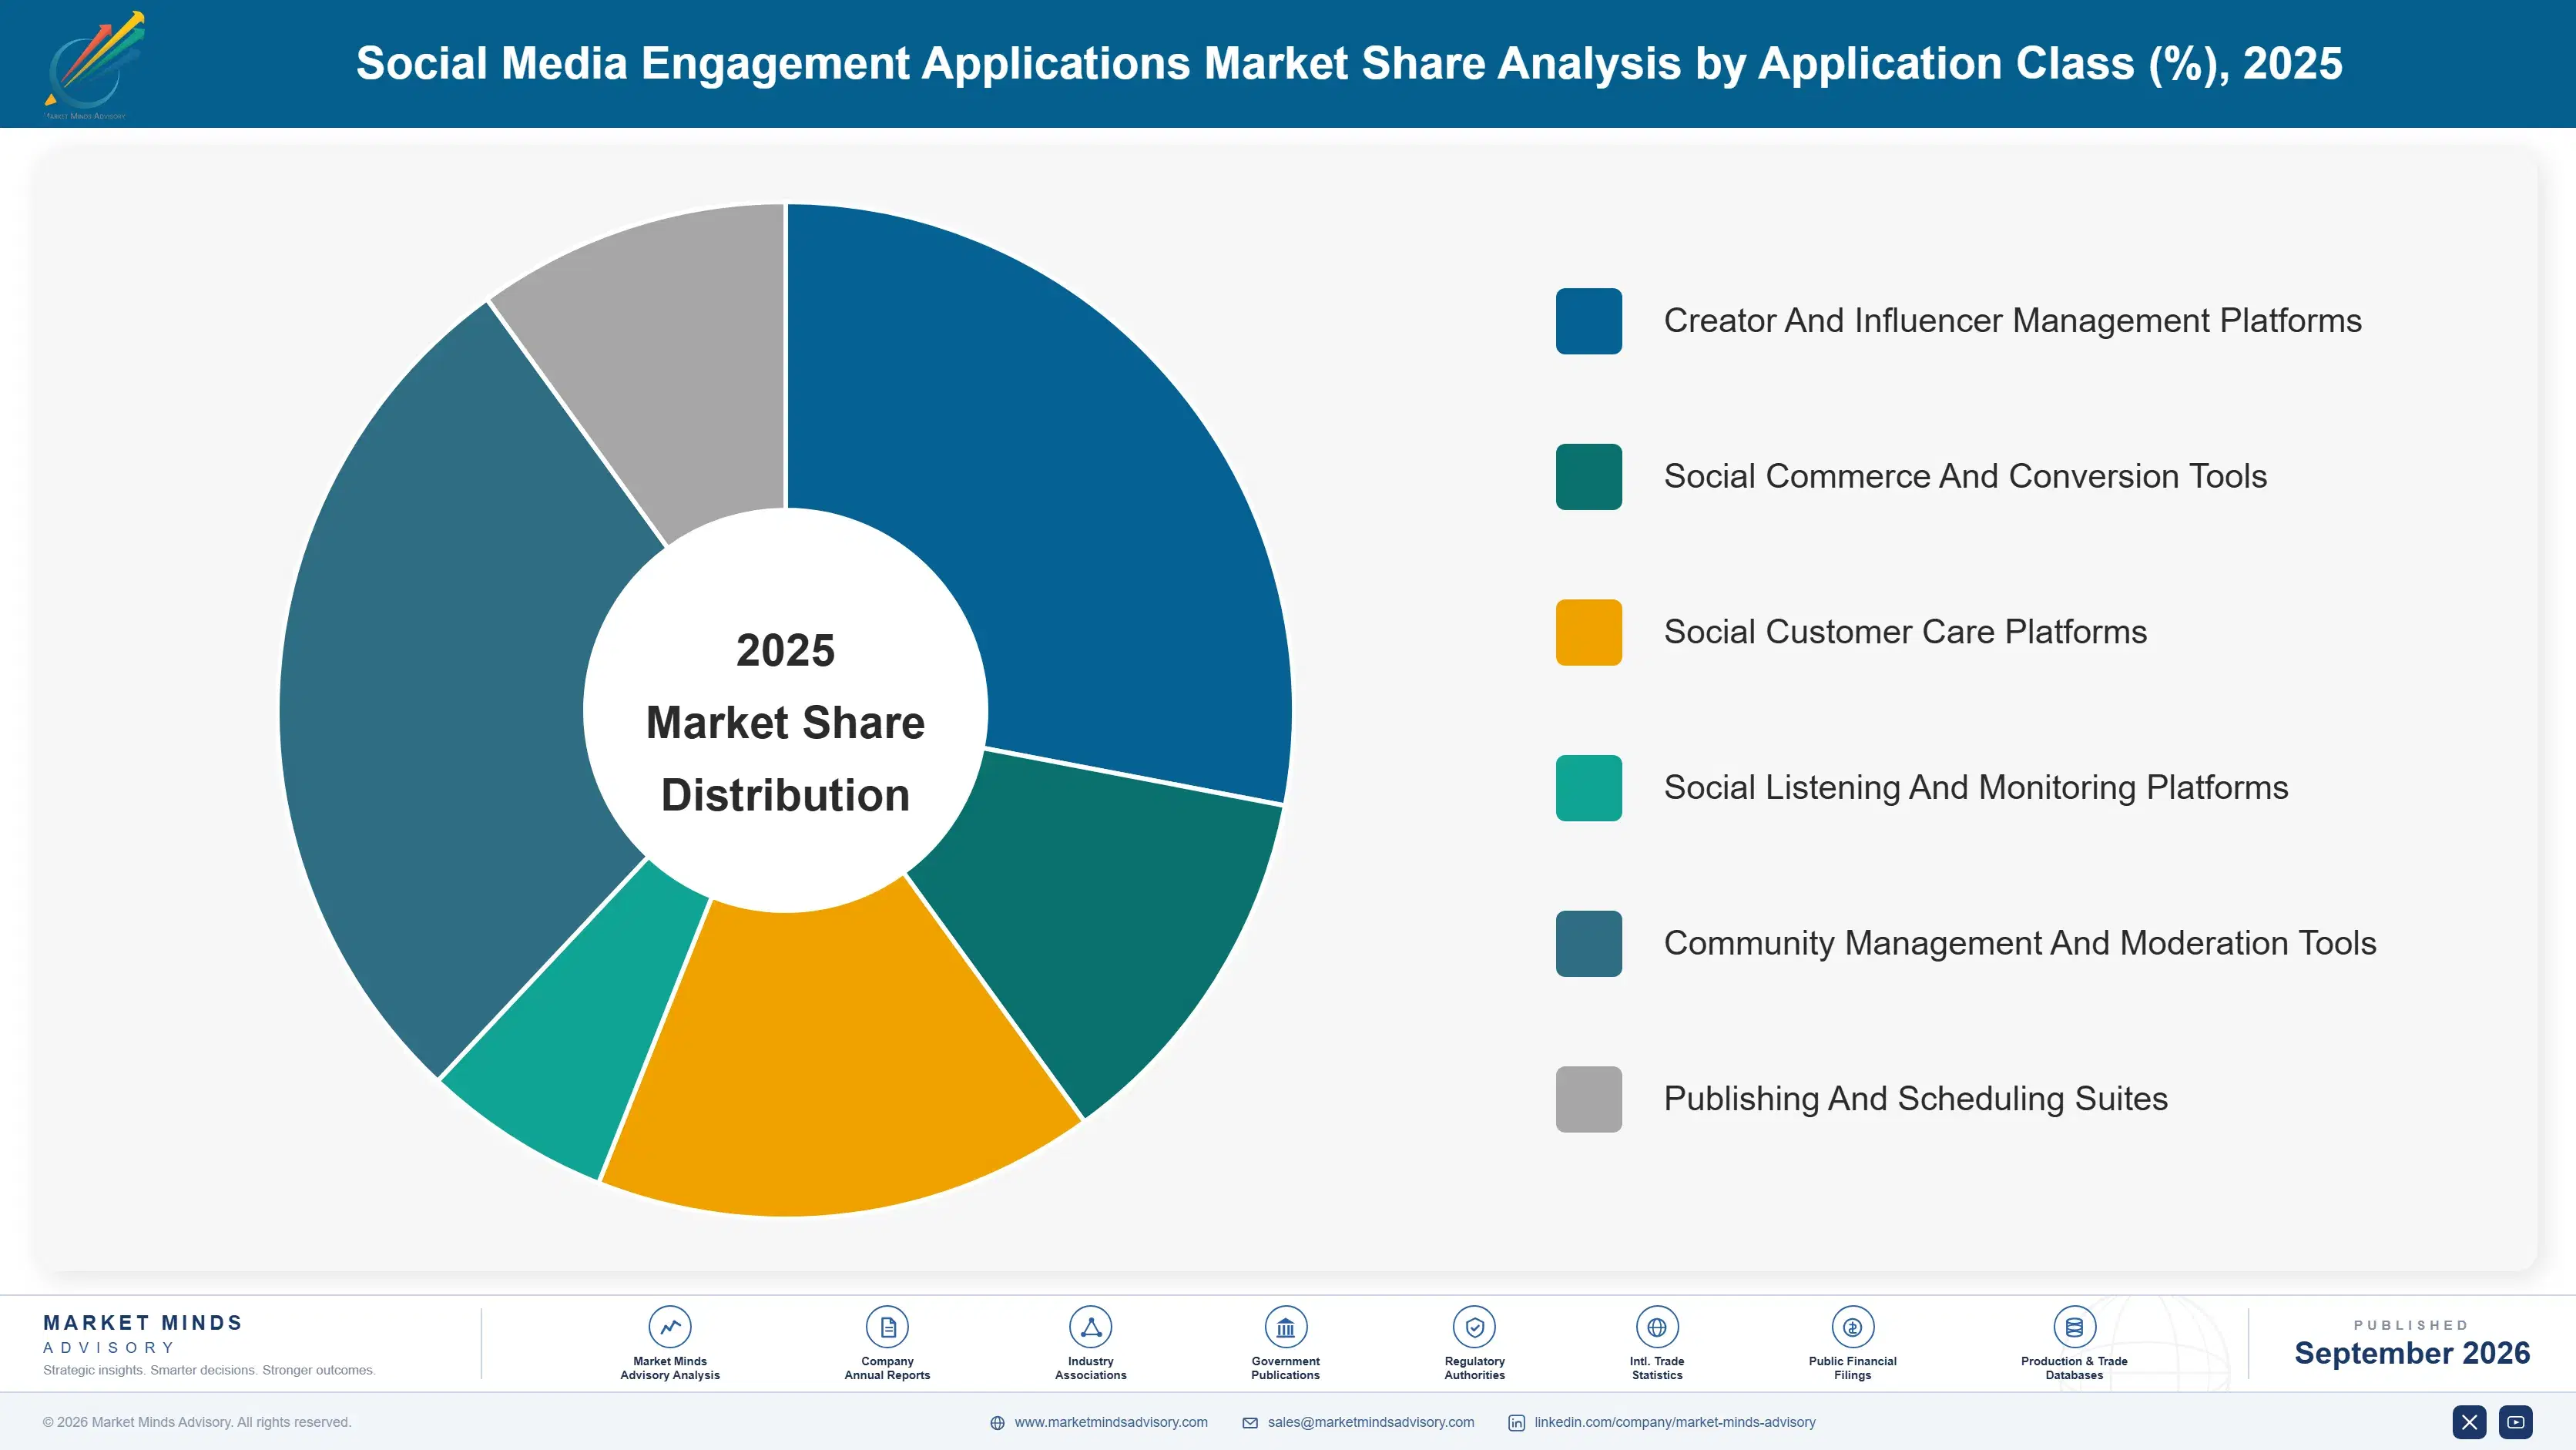
Segmentation follows application class, since the workflow a product supports determines who buys it, which budget pays and what it can charge. Six classes cover the market: creator and influencer management, social commerce and conversion tools, social customer care, social listening and monitoring, community management and moderation, and publishing and scheduling suites. Buyer function and deployment model are separate dimensions.
social-media-engagement-applications-market-market-share-analysis-1789985168506

Creator and Influencer Management Platforms

Creator and influencer platforms grow at 17.1%, half again the market rate of 11.4%, because brand money moved and the old tooling could not follow it. Buying placement was a media transaction; working with several thousand individual creators is a supply chain problem involving discovery, contracting, briefing, cross-border payment, rights management and attribution. Large consumer brands now track rosters running past 3400 profiles and manage them the way procurement manages suppliers. Publishing suites were never designed for any of this, which is why dozens of specialists appeared in five years and why the suite vendors have been acquiring rather than building. Consolidation here is already well underway, and it will take out most of the specialists.
CAGR 17.1%

Social Commerce and Conversion Tools

Social commerce tooling grows at 15.0% and almost all of that growth sits in Asia. Buying inside a social application is ordinary behaviour in Indonesia, Thailand and China, where live selling sessions move real volume through hosts who are half retailer and half entertainer, and the software supporting that handles inventory sync, session management, order routing and creator commission. Western brands buy the same category of product and use it for awareness, because their customers do not buy this way at comparable scale. Indonesia compounds at 16.8%. Vendors built for Western workflows keep entering Asian markets and discovering the product they need is a different product entirely. That lesson keeps getting relearned expensively.
CAGR 15.0%
Full segment breakdown across 6 segments available in the complete report.

Regional Architecture and Country Demand Map

Subscription spending and actual activity sit in different places. North America holds 28% on enterprise software budgets while East Asia holds 26% on transaction volume, and South Asia and Pacific sits above its band at 14% on Indonesian and Indian social commerce. That split runs through everything below.

North America

North America holds 28% of subscription spending, and enterprise software budgets rather than social activity explain it. Large American brands buy suites on procurement cycles running about five months, with security review, legal terms and integration requirements that a self-service product cannot satisfy, and they pay accordingly. Sprinklr, Salesforce, Hootsuite and Sprout Social all built here and sell to that buyer. Creator management is furthest developed here as a commercial discipline, with brands running rosters and paying talent through formal contracting. Growth at 10.6% sits below the global rate because the enterprise base is already well served. Social commerce remains aspirational rather than transactional in this region. Nobody has explained why convincingly.
Share: 28% | CAGR: 10.6% (2026 to 2036)

East Asia

Twenty six percent of spending sits in East Asia, and the behaviour here is genuinely different rather than merely earlier. Chinese consumers buy inside social applications as routine, live selling moves substantial retail volume, and the tooling that supports it evolved for commerce rather than for marketing communication. Domestic vendors serve almost all of that demand on platforms Western software does not connect to at all. Japanese and Korean brands buy Western suites more readily and use them for customer care and listening rather than commerce. Growth at 12.6% sits above the global rate. The Chinese half of this region is effectively a separate market with separate vendors. Most global forecasts ignore that.
Share: 26% | CAGR: 12.6% (2026 to 2036)
Regional intelligence for 5 additional markets available in the complete report: Western Europe, South Asia and Pacific, Latin America, Middle East and Africa, Eastern Europe. Contact sales@marketmindsadvisory.com.
social-media-engagement-applications-market-country-cagr-analysis-1789985169048

How Vendors Survive The Platforms

Nobody in this market owns the asset their product depends on, and a platform can reprice access tomorrow. What a vendor can own is the workflow a large organisation runs on, the data the customer generates itself, and a position in the categories where budget is actually moving. The four levers below cover those.

Own The Workflow, Not The Data Feed

Every vendor reads the same platform data through the same 6 interfaces, so the feed is not a differentiator and never will be. What a large organisation cannot easily replace is the workflow: approval chains across dozens of markets, brand governance, escalation routing, permission structures and the reporting a chief marketing officer takes to a board. That is what sustains enterprise sales cycles running 5 months and the pricing that justifies them. Vendors competing on data breadth are competing on something the platforms give away, and the low end of this market prices accordingly.
Market Impact: The same 6 interfaces serve every competing vendor

Move Budget Into Creator Programme Management

Creator and influencer platforms compound at 17.1% against 11.4% for the market, because brand money left paid placement and the receiving software did not exist. Managing several thousand creators is procurement work rather than media work: discovery, contracting, briefing, cross-border payment, rights and attribution. Large brands now run rosters past 3400 profiles. A publishing suite vendor without this capability is watching its customers spend a growing share of budget somewhere else, and the suite vendors have mostly concluded that acquiring a specialist is faster than building one. That conclusion is probably right.
Market Impact: Creator platforms compound at 17.1% against 11.4% overall

Sell Moderation As A Compliance Requirement

The Digital Services Act put documented duties on anyone operating a public-facing community across all 27 member states, covering illegal content, complaint handling and reporting with an audit trail. That moves moderation tooling out of a marketing budget and into a compliance one, which is a different buyer with a different approval process and considerably less price sensitivity. Vendors still pitching community tools on engagement metrics are talking to the wrong person about the wrong problem. The requirement is evidence a regulator will accept, and remarkably few products in this category produce it well.
Market Impact: Compliance duties now apply across 27 member states

Build For Asian Commerce, Not Western Marketing

Social commerce tooling compounds at 15.0% and almost all of that sits in Asia, where buying inside a social application is ordinary rather than novel. The product required is inventory sync, live session management, order routing and creator commission, which is commerce software wearing a social label. Western vendors keep shipping social commerce features designed for awareness campaigns into markets running actual transactions and losing to domestic products built for the job. Indonesia compounds at 16.8%. Serving this properly means building a different product rather than localising an existing one.
Market Impact: Indonesia alone compounds at 16.8% on live commerce

Who Controls the Margin Pool

Five vendors hold 32% of subscription revenue, fragmented for enterprise software because the underlying data belongs to the platforms and is equally available to everybody. Sprinklr and Salesforce lead on enterprise suite deployments with governance depth. Adobe reaches the same buyers through a broader marketing stack. Hootsuite and Sprout Social built on self-service volume moving upmarket. The leader to fifth gap is narrow. All participants are assessed on subscription software revenue.
Competition runs on workflow depth and governance rather than on data or features, because every vendor reads the same feeds. Enterprise buyers pay for approval chains, permission structures and security review that a small competitor cannot fund. At the self-service end pricing compresses continuously, since building a scheduling tool on public interfaces takes a small team and very little capital.

Rankings shift with acquisitions and with platform decisions. Suite vendors are buying creator management specialists rather than building, which is consolidating a field that had dozens of entrants five years ago. The other variable is entirely outside anybody's control: a platform repricing interface access reshapes this competitive landscape overnight, as happened in 2023, and no vendor holds a defence against it.
social-media-engagement-applications-market-company-positioning-matrix-1789985169577

Competitive Moat and Risk Dimensions

SPRINKLR

Moat: Enterprise Governance Depth

Sprinklr built for organisations running hundreds of accounts across dozens of markets, where approval chains, brand governance and permission structures matter more than any individual feature. That architecture takes years to build and is what a global brand cannot easily replace once it is embedded in daily operations across regions. Small competitors reading the same data cannot answer it.
SPRINKLR

Risk: Platform Interface Dependence

The whole product rests on interfaces controlled by platforms that owe the company nothing, and 2023 showed what happens when one of them reprices access. A pure-play vendor carries that exposure undiluted, where a competitor inside a broader software business absorbs it across other product lines. Nothing in the architecture provides a hedge, because no hedge exists.
SALESFORCE

Moat: Customer Record Integration

Salesforce holds the customer record that social interactions need to attach to, so a complaint arriving through a social channel lands in the same case history as a phone call or an email. Competitors integrate to that record through an interface and Salesforce simply owns it. For social customer care specifically, that difference decides most enterprise selections outright.
SALESFORCE

Risk: Social Remains A Feature

Social engagement is one module inside an enormous platform, and product investment follows revenue rather than category importance. Specialists devoting entire roadmaps to creator management or live commerce ship faster and understand the workflow better. Breadth wins the procurement conversation and loses the evaluation where a practitioner tests whether the product actually does the job.

Players Tracked

Prominent Players

Sprinklr
Salesforce
Hootsuite
Adobe
Sprout Social

Other Key Players

Emplifi
Brandwatch
Talkwalker
Meltwater
Later
Buffer
Khoros
Zoho
HubSpot
Dash Hudson
CreatorIQ
Traackr
Bazaarvoice
Agorapulse
Sendible

Recent Developments

FEBRUARY 2025

Sprinklr Extends Creator Programme Management Across Its Suite

Sprinklr extended creator and influencer programme management functionality across its enterprise suite, an organic product development rather than an acquisition. The work targets brands running rosters of several thousand individual creators as a supplier base, which publishing and scheduling tooling was never designed to handle at that scale.
Signal: The suite vendors are building where the budget went, and the specialists now have real competition.
SEPTEMBER 2024

Emplifi Acquires Creator Management Specialist To Extend Range

Emplifi acquired a creator management specialist to extend its range, an acquisition rather than a partnership or minority investment. The transaction follows a consistent pattern across the category, with suite vendors buying capability in creator programme management instead of building it against specialists that already hold customer relationships.
Signal: Consolidation is running fast enough that most creator management specialists will not remain independent for long.
JUNE 2025

Sprout Social Adds Digital Services Act Compliance Reporting

Sprout Social added moderation audit and complaint handling reporting aligned to European Digital Services Act obligations, an organic product development rather than any transaction. The functionality targets compliance buyers rather than marketing ones, which is a different budget with a different approval process inside the same customer organisations.
Signal: Moderation has become a compliance purchase, which changes who signs and how much the price actually matters.

What This Software Costs To Run

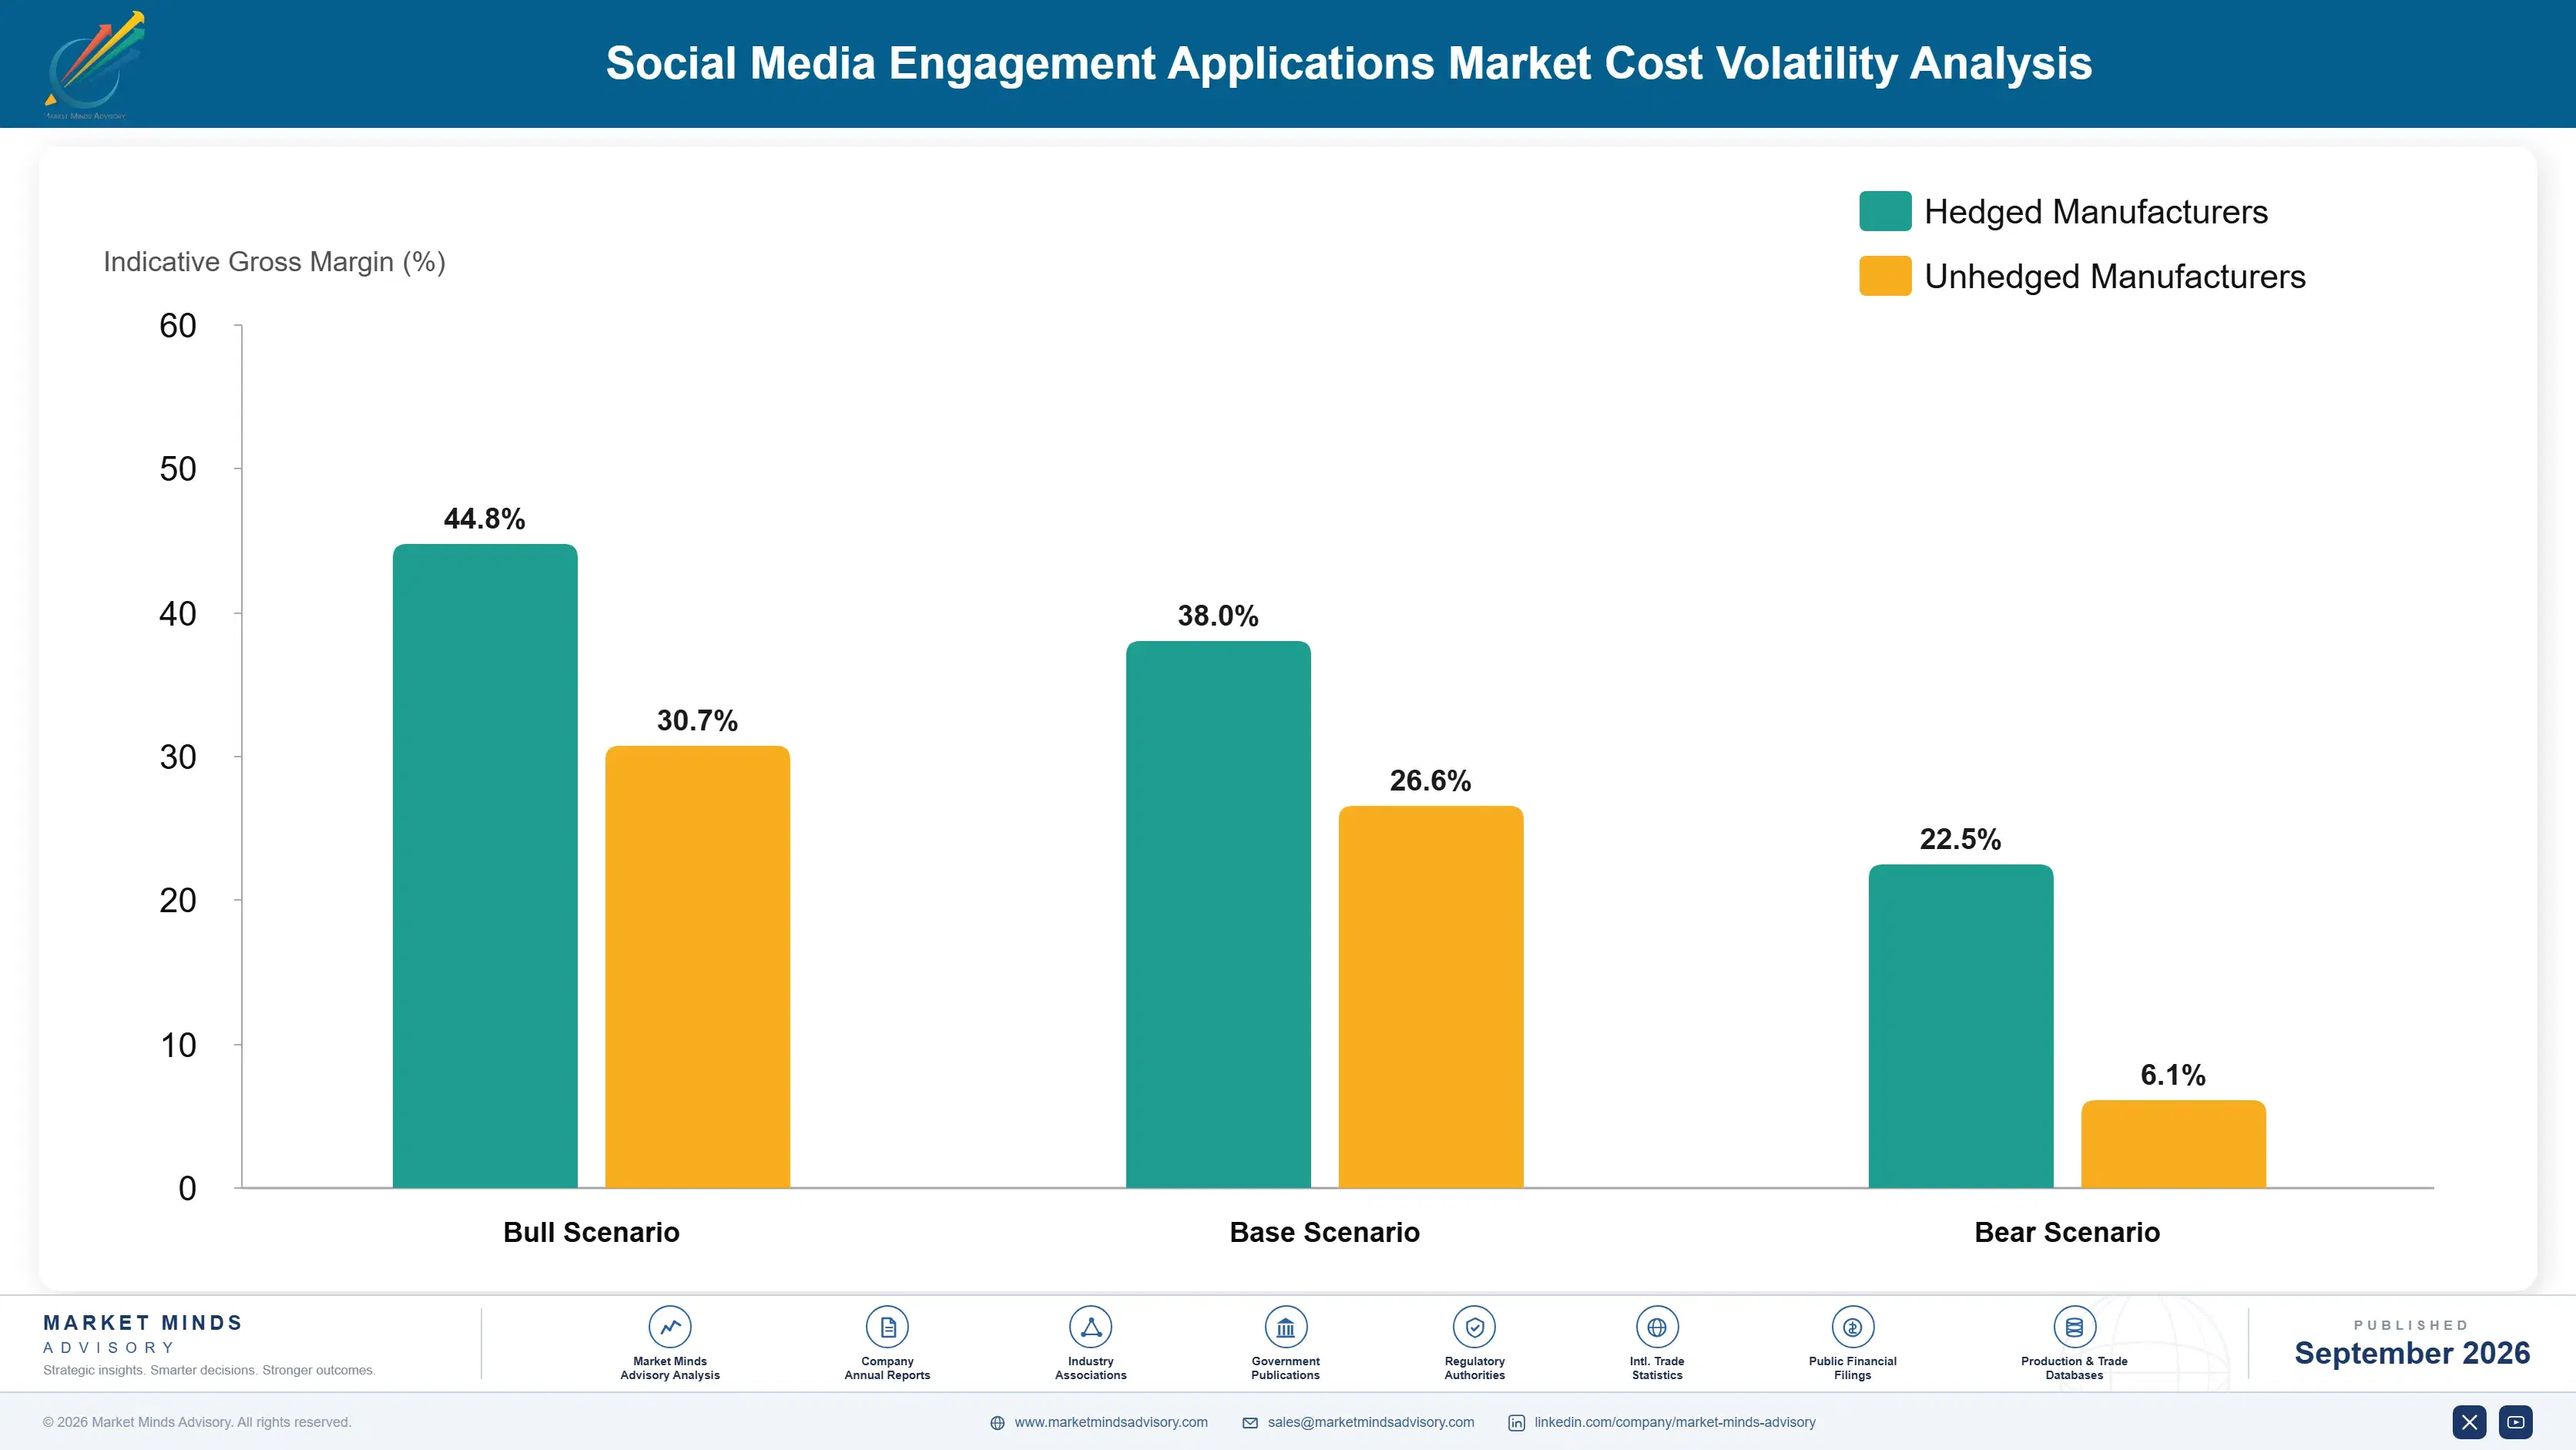
Engineering headcount accounts for roughly 41% of vendor cost, concentrated in North America, Western Europe and increasingly Poland and India. Cloud infrastructure and data storage add about 16%, since listening products retain enormous volumes of historical content. Platform interface fees, which barely existed as a line before 2023, now carry around 9%. Sales and marketing take most of the balance.
Salesforce Annual Report 2024 records engineering headcount and cloud infrastructure as the dominant cost variables across its customer engagement products. Adobe Annual Report 2024 notes comparable pressure alongside data storage growth. The 2023 platform interface repricing added a cost line that had effectively been free, and vendors serving customers on annual contracts absorbed the whole increase for a full year because the contracts did not permit passing it through at all.

The competitive disadvantage mechanism is contract structure rather than cost level. A vendor on multi-year fixed-price agreements carries every interface repricing itself, while one selling annually or with pass-through clauses does not. Scale also matters at the interface tier, since platforms price access in bands and a large vendor pays less per unit than a small one. Neither difference appears in any product comparison a buyer runs.
social-media-engagement-applications-market-cost-volatility-analysis-1789985169774

Write Interface Cost Pass-Through Into Customer Contracts

Platform interface fees now carry around 9% of vendor cost and did not exist as a line before 2023. Vendors on multi-year fixed-price agreements absorbed the entire increase because their contracts gave them no choice. Adding a pass-through clause at renewal is a straightforward negotiation that most vendors still have not attempted. It costs nothing to ask.

Tier Historical Data Storage By Access Frequency

Cloud infrastructure and storage run about 16% of vendor cost, largely because listening products retain years of historical content that customers query occasionally and pay for constantly. Moving older content to cheaper storage tiers with slower retrieval cuts that line substantially without changing what any customer can actually reach. The engineering work is unglamorous and the saving compounds every month.

Distribute Engineering Beyond The Highest Cost Markets

Engineering headcount runs about 41% of vendor cost and concentrating it in San Francisco or London is a decision most vendors made before remote work was normal. Polish, Romanian and Indian engineering centres deliver comparable capability at a materially different cost, which several competitors already exploit. The constraint is coordination overhead across time zones, which is real and manageable.

Portfolio Architecture for Margin Defence

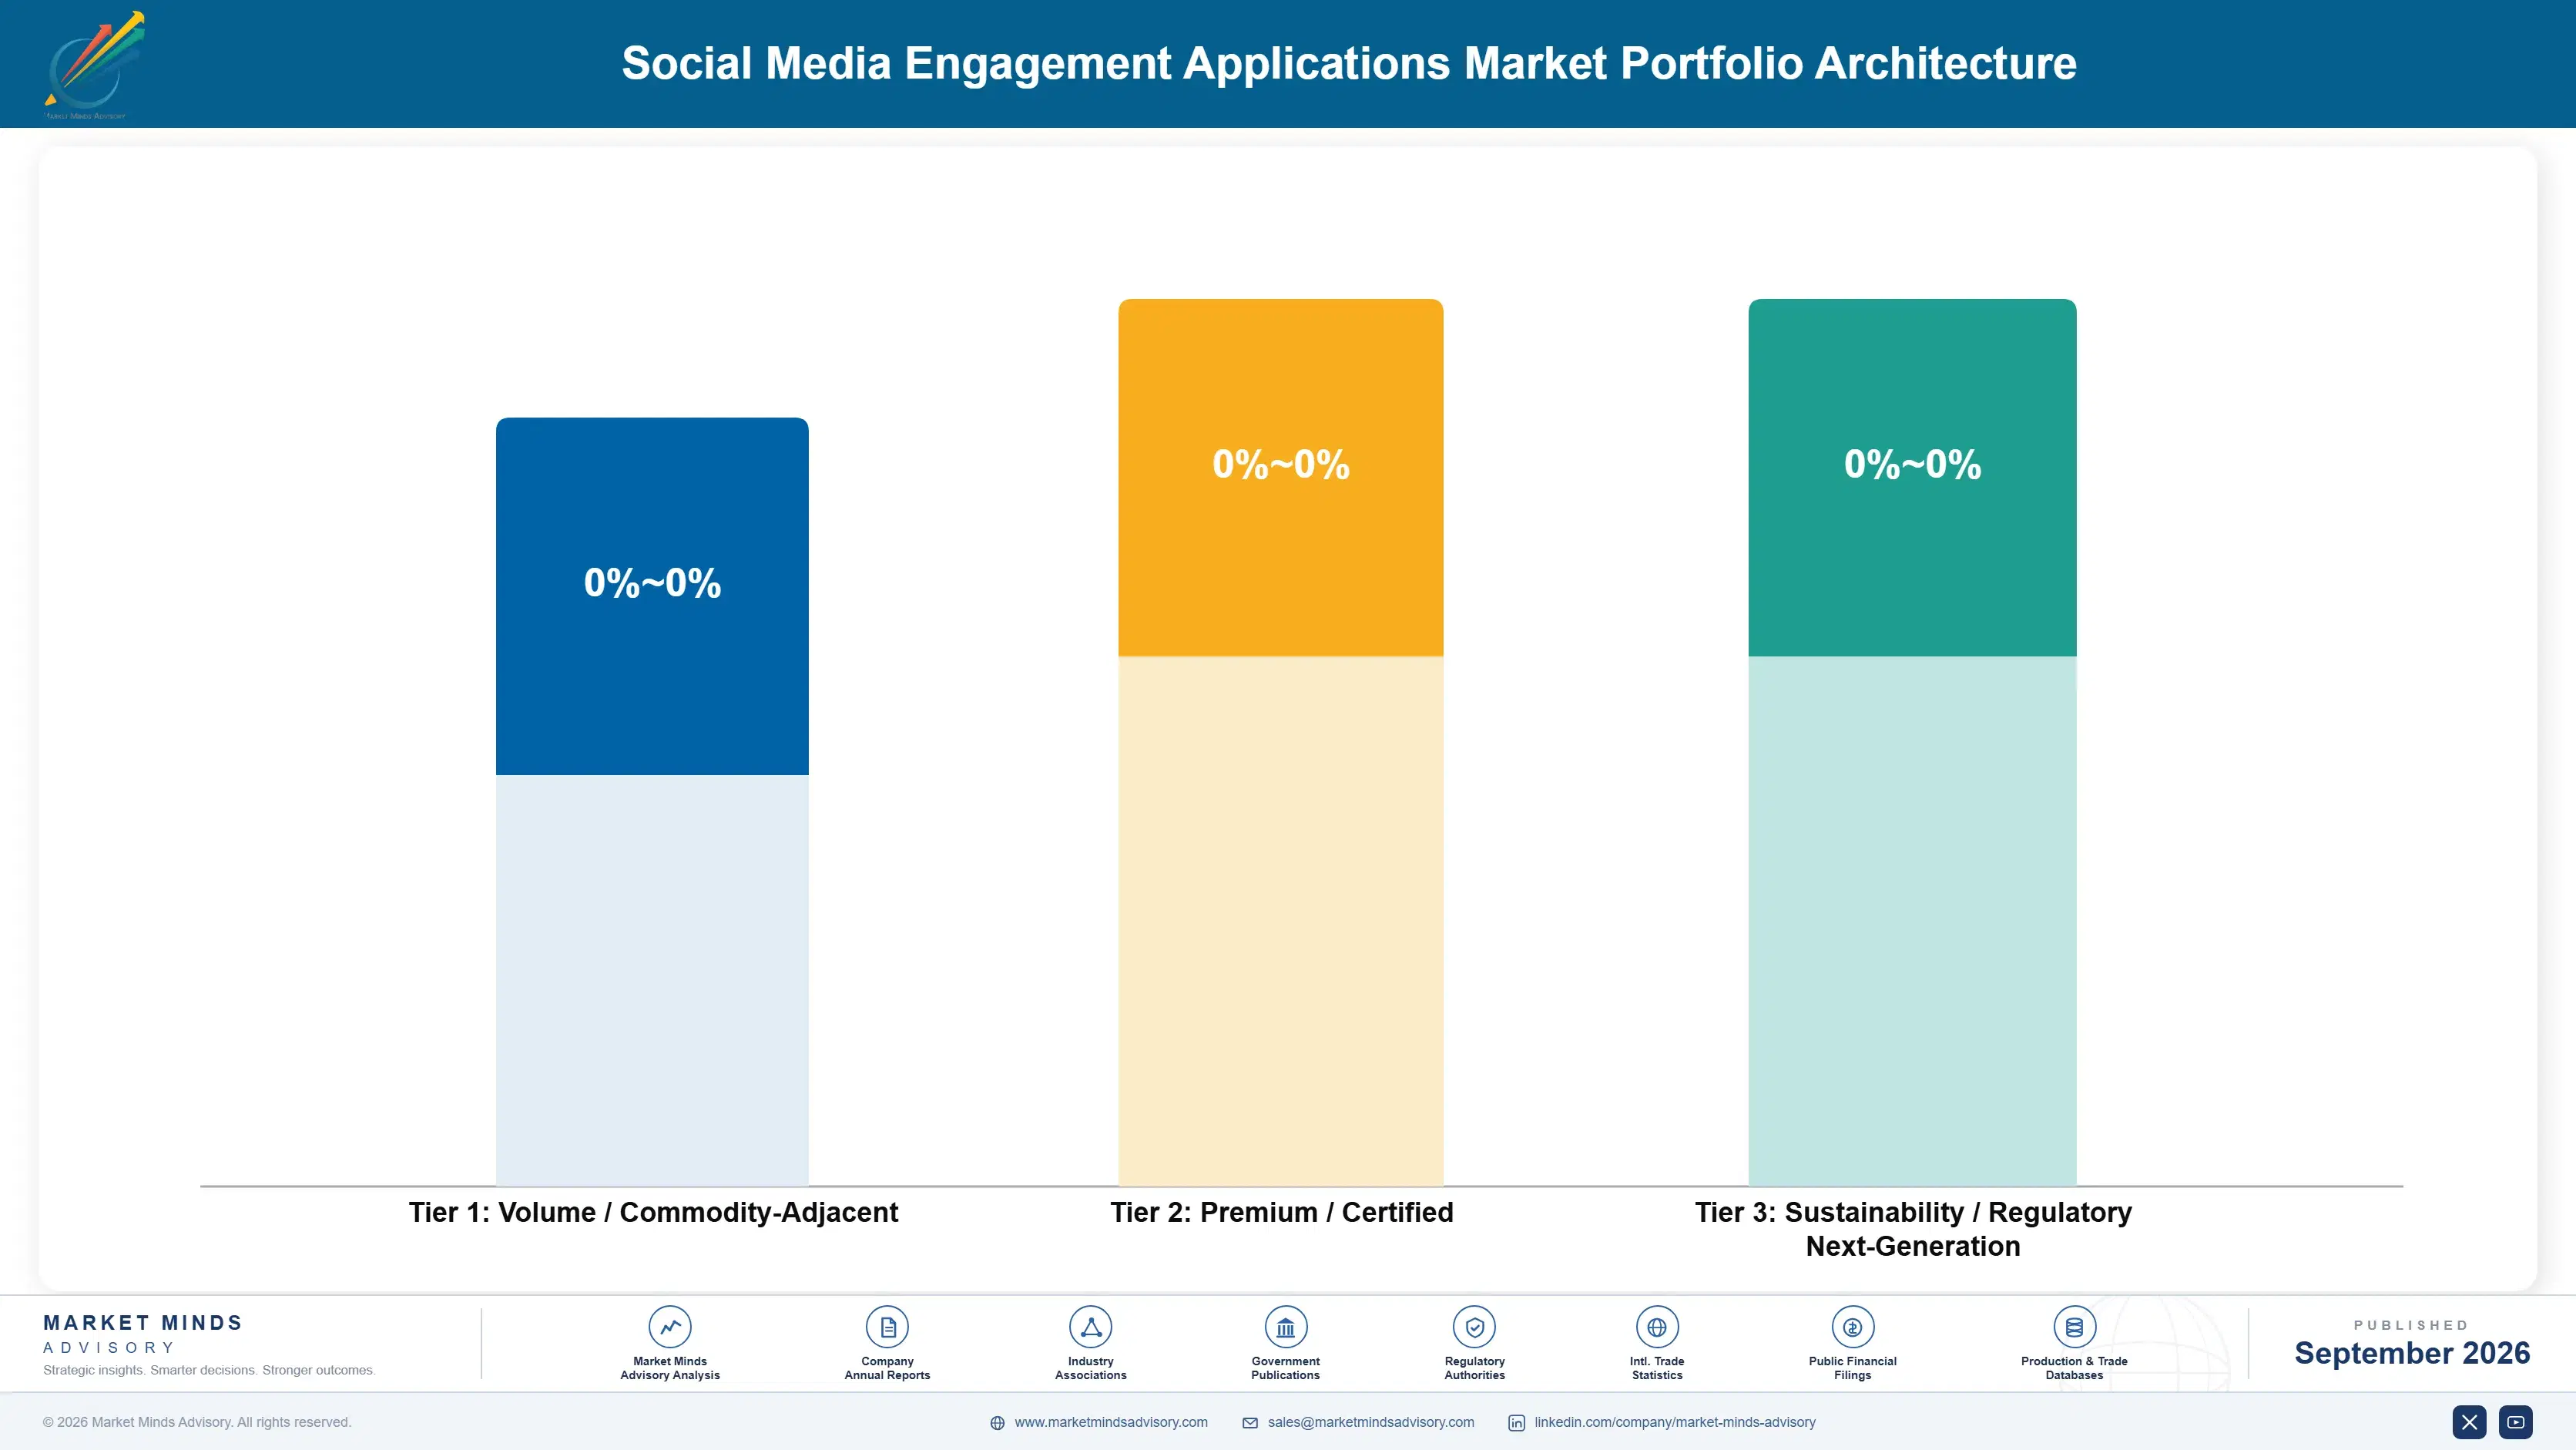
Margin architecture separates on who signs the contract. Publishing and scheduling suites earn least, sold self-service against dozens of near-identical competitors built on the same public interfaces. Listening and community management sit in the middle, where enterprise governance supports pricing. Creator management, social commerce tooling and compliance-grade moderation earn most, because each reaches a budget the marketing team does not control and a buyer who compares on capability rather than seat price.
The volume versus premium tension is a go-to-market problem rather than a product one. The same codebase serves a self-service customer paying monthly and an enterprise deployment on a 5 month sales cycle, but the second requires security review, legal negotiation, implementation and account management that the first cannot fund. Vendors who try to serve both frequently under-resource the enterprise motion and lose deals to specialists.

High-value pools sit in creator programme management and in compliance-grade moderation, and neither is where the incumbents built. Creator management rewards payment infrastructure, contracting and cross-border operations that a marketing tool never needed. Moderation rewards evidence a regulator will accept. Both are being reached by acquisition rather than development, which tells you how far the incumbent products actually are from either.

Volume / Commodity-Adjacent

Publishing and scheduling suites sold self-service against dozens of near-identical competitors built on the same public interfaces. The eight point spread separates vendors with efficient self-service acquisition from those carrying sales cost on small contracts.
Gross Margin: 58% to 66%

Premium / Certified

Social listening, monitoring and community management sold into enterprise accounts where governance depth and security review support pricing. The eight point spread tracks how much of a vendor's book sits under multi-year enterprise agreements.
Gross Margin: 70% to 78%

Sustainability / Regulatory / Next-Generation

Creator programme management, social commerce tooling and compliance-grade moderation, each reaching a budget the marketing team does not control. The ten point spread reflects how differently vendors amortised the payment and compliance infrastructure behind these products.
Gross Margin: 76% to 86%
social-media-engagement-applications-market-portfolio-architecture-1789985170275

High-value Sub-segments and Strategic Watch-out

Creator And Influencer Management Platforms

Grows at 17.1% because brand money left paid placement and needed software that did not exist, covering discovery, contracting, payment and attribution. The ten point spread reflects payment infrastructure depth. Suite vendors are acquiring rather than building, so consolidation here is already well advanced indeed.
Gross Margin: 76% to 86%

Social Commerce And Conversion Tools

Grows at 15.0% with almost all of it in Asia, where buying inside a social application is ordinary rather than novel behaviour. The ten point spread reflects commerce infrastructure depth rather than marketing capability. Western vendors keep shipping the wrong product into these markets repeatedly.
Gross Margin: 76% to 86%

Social Listening And Monitoring Platforms

Grows at 10.8% and carries a large share of enterprise subscription revenue, though every vendor reads identical data through the same 6 platform interfaces. The eight point spread tracks enterprise contract depth rather than any data advantage. Differentiation here is workflow, and it always has been.
Gross Margin: 70% to 78%

Publishing And Scheduling Suites

Grows at 6.2%, slowest of the six classes, because building a scheduler on public interfaces takes a small team and pricing compresses continuously. The eight point spread reflects self-service acquisition efficiency. Vendors keep this business because customers expect a complete product range from a suite.
Gross Margin: 58% to 66%

How These Contracts Renew

The annuity is workflow embedment rather than the subscription itself. Once approval chains, permission structures and reporting formats are built around a product across dozens of markets, replacing it means rebuilding operating process rather than swapping software, and net revenue retention around 104% reflects that stickiness. Self-service customers carry none of it and churn accordingly, which is why the two ends of this market behave like different businesses.
Adoption depth varies by industry in ways that track regulatory and reputational exposure. Consumer brands adopt broadly across every category because social is where their customers are. Financial services and healthcare adopt deeply in moderation and archiving on compliance grounds and shallowly elsewhere. Retail adopts commerce tooling in Asia and awareness tooling in the West. Business-to-business organisations adopt least and buy listening rather than engagement.

The buyer has fragmented rather than moved. A marketing director used to sign for everything in this category. Now creator programmes are signed by procurement, moderation by compliance, and customer care by a service operations leader, each with separate budgets and different evaluation criteria. Vendors organised around a single buyer relationship are calling on one door of three.
social-media-engagement-applications-market-end-use-penetration-index-1789985170770

Where We Would Build

These are among the four positions where our research anticipates prominent divergence between winners and laggards over the coming forecast period. Each is grounded in the demand model, the regulatory perimeter, and the announced capacity pipeline.
01 / WORKFLOW OWNERSHIP PRIORITY

Own The Process, Not The Feed

Every vendor in this category reads the same platform data through the same 6 interfaces, so the feed is not a differentiator and never can become one. What a global organisation cannot easily replace is the workflow built around a product: approval chains across dozens of markets, brand governance, escalation routing and the reporting a chief marketing officer takes to a board. That is what sustains enterprise sales cycles running 5 months and the pricing that goes with them, while vendors competing on data breadth are competing on something free.
02 / CREATOR BUDGET CAPTURE

Follow The Money Out Of Paid Media

Creator and influencer platforms compound at 17.1% against 11.4% for the market, because brand money left paid placement and the software meant to receive it did not exist. Managing several thousand creators is procurement work rather than media work, covering discovery, contracting, briefing, cross-border payment, rights and attribution, and large brands now run rosters past 3400 profiles. A publishing suite vendor without this capability watches its customers spend a growing share of budget elsewhere, which is why the suite vendors have concluded that acquiring a specialist beats building one.
03 / COMPLIANCE BUYER ACCESS

Sell Moderation To Legal, Not Marketing

The Digital Services Act placed documented duties on anyone operating a public-facing community across all 27 member states, covering illegal content, complaint handling and reporting with an audit trail. That moves moderation tooling out of a marketing budget and into a compliance one, which is a different buyer with a different approval process and considerably less price sensitivity than the marketing team ever had. Vendors still pitching community tools on engagement metrics are talking to the wrong person about the wrong problem, and the requirement is evidence a regulator accepts.
04 / ASIAN COMMERCE BUILDING

Build A Commerce Product, Not A Localisation

Social commerce tooling compounds at 15.0% and almost all of that growth sits in Asia, where buying inside a social application is ordinary consumer behaviour rather than a novelty. What those markets require is inventory sync, live session management, order routing and creator commission, which is commerce software wearing a social label rather than a marketing tool with a checkout button. Indonesia compounds at 16.8%, and Western vendors keep localising awareness products into markets running real transactions and losing to domestic software built for the actual job.

Engagement Snapshot From the Field

A live engagement with an industry participant carrying material or product regulatory and market exposure ahead of a defining policy shift, showing how our research translates into a defensible multi-year portfolio strategy.
MARKET MINDS ADVISORY · CLIENT ENGAGEMENT SUMMARY
Social Media Engagement Applications Producer Strategic Portfolio Review and Transition Roadmap 2026·Investment Scenario on Social Media Engagement Applications Exposure Evaluation 2025-26
CLIENT PROFILE
A global consumer goods manufacturer operating across forty markets with more than twenty brand portfolios, each running its own social presence. Software procurement had happened brand by brand over a decade, producing eleven separate contracts with nine vendors and no consolidated view of spend. A group procurement review had flagged the position and nobody could defend or explain it.
STRATEGIC CHALLENGE
Procurement wanted a single vendor and assumed consolidation would cut cost substantially. Brand teams argued that the specialist tools they used for creator programmes and live commerce had no equivalent inside any suite. Neither position had been tested, and a consolidation decision was scheduled for the following quarter regardless of whether anybody had checked the capability gaps.
MMA APPROACH
MMA mapped every contract, seat count and actual usage pattern across the eleven agreements, then tested the capability claims by function rather than by vendor marketing. We modelled a full consolidation against a two-platform structure keeping specialist tooling where suites genuinely could not match it, and drew on 47 expert interviews conducted in Q4 2025 with vendors, agencies and comparable manufacturers.
KEY FINDINGS
  1. Roughly 4 in 10 purchased seats had not been used in ninety days, which was a larger saving than any vendor consolidation would produce (client-reported, unverified by MMA).
  2. The brand teams were right about creator programme management: 2 of the 3 suites shortlisted could not handle cross-border talent payment at the required scale.
  3. Southeast Asian brands were using local commerce tooling that no Western suite replicated, and consolidating them would have removed working live selling capability entirely.
  4. No contract contained a platform interface cost pass-through clause, which left the group carrying repricing exposure it had never priced (client-reported, unverified by MMA).
CLIENT PROFILE
A global consumer goods manufacturer operating across forty markets with more than twenty brand portfolios, each running its own social presence. Software procurement had happened brand by brand over a decade, producing eleven separate contracts with nine vendors and no consolidated view of spend. A group procurement review had flagged the position and nobody could defend or explain it.
STRATEGIC CHALLENGE
Procurement wanted a single vendor and assumed consolidation would cut cost substantially. Brand teams argued that the specialist tools they used for creator programmes and live commerce had no equivalent inside any suite. Neither position had been tested, and a consolidation decision was scheduled for the following quarter regardless of whether anybody had checked the capability gaps.
MMA APPROACH
MMA mapped every contract, seat count and actual usage pattern across the eleven agreements, then tested the capability claims by function rather than by vendor marketing. We modelled a full consolidation against a two-platform structure keeping specialist tooling where suites genuinely could not match it, and drew on 47 expert interviews conducted in Q4 2025 with vendors, agencies and comparable manufacturers.
KEY FINDINGS
  1. Roughly 4 in 10 purchased seats had not been used in ninety days, which was a larger saving than any vendor consolidation would produce (client-reported, unverified by MMA).
  2. The brand teams were right about creator programme management: 2 of the 3 suites shortlisted could not handle cross-border talent payment at the required scale.
  3. Southeast Asian brands were using local commerce tooling that no Western suite replicated, and consolidating them would have removed working live selling capability entirely.
  4. No contract contained a platform interface cost pass-through clause, which left the group carrying repricing exposure it had never priced (client-reported, unverified by MMA).
RECOMMENDED STRATEGY
Phase 1: Phase one: recover unused seats across all eleven agreements before negotiating anything, since that alone exceeds the projected consolidation saving. Phase 2: Phase two: consolidate to two platforms rather than one, keeping creator programme and Southeast Asian commerce tooling where no suite can match it. Phase 3: Phase three: add platform interface cost pass-through language to every renewal, so the group stops carrying an exposure it never agreed to price.
OUTCOME
The group recovered unused seats first and consolidated to two platforms rather than one (client-reported, unverified by MMA). Total software cost fell by more than the original single-vendor proposal had projected, and creator and commerce capability was retained intact. Interface cost pass-through language now appears in every renewal the group signs.

Frequently Asked Questions

Foundational context covering the market sizes, CAGR, scope, country, region and competition that inform every finding below. This section is provided to cover basics and most often pre-purchase conversations, answered from the MMA Primary Research Dataset.

What is the current size of the Social Media Engagement Applications Market?

Global value reaches USD 9.58 billion in 2026, measured as subscription software revenue across all social engagement application classes. The 2025 base is USD 8.6 billion.

How large will the Social Media Engagement Applications Market be by 2036?

Subscription revenue reaches USD 28.19 billion by 2036, an increase of USD 18.61 billion over the forecast period. That represents 2.94 times expansion from the 2026 base.

What is the CAGR for the Social Media Engagement Applications Market 2026 to 2036?

The base case runs at 11.4% annually, with a bull case at 12.6% if Western social commerce finally works and a bear case at 10.2% if a platform reprices interface access again.

Which segment is growing fastest?

Creator and influencer management platforms grow at 17.1%, half again the market rate of 11.4%. Brand budget left paid placement for creator relationships and the receiving software did not exist.

Who are the major companies in the Social Media Engagement Applications Market?

Sprinklr, Salesforce, Hootsuite, Adobe and Sprout Social lead on subscription software revenue, together holding 32%. Emplifi, Brandwatch, Meltwater and Khoros hold meaningful positions below them.

Which country is growing fastest?

Indonesia leads at 16.8%, on live selling that is ordinary consumer behaviour there rather than an experiment. India and Brazil follow some way behind on audience volume.

Report Segmentation Architecture

The full report scope spans multiple orthogonal segmentation dimensions, with cross-tabulated demand data provided for each dimension pair. Coverage extends further to regional breakdowns, trend trajectories, and the competitive detail needed to support segment-level decision-making.

By Application Class

  • Creator And Influencer Management Platforms
  • Social Commerce And Conversion Tools
  • Social Customer Care Platforms
  • Social Listening And Monitoring Platforms
  • Community Management And Moderation Tools
  • Publishing And Scheduling Suites

By End-Use Industry

  • Consumer Goods And Retail
  • Financial Services
  • Media And Entertainment
  • Travel And Hospitality
  • Telecommunications
  • Public Sector And Government

By Commercial Dimension

  • Direct Enterprise Subscription
  • Self-Service Online Purchase
  • Agency Reseller Channel
  • Marketing Technology Partner Supply
  • Platform Marketplace Distribution
  • Managed Service Bundling

By Region

  • North America
  • Western Europe
  • East Asia
  • South Asia and Pacific
  • Latin America
  • Middle East and Africa
  • Eastern Europe

Scope, Methodology, and Coverage

Every figure in this report is reproducible from documented input assumptions. The scope below maps the historical period, the forecast horizon, the segmentation dimensions, and the countries covered, alongside the underlying primary and qualitative methodology.
Historical Period
2020 to 2025
Forecast Period
2026 to 2036
Base Year
2025 (USD billions; MMA Primary Research Dataset, September 2026)
Market Definition
This report covers subscription software used by organisations to publish, monitor, moderate and measure engagement across social platforms: social listening and monitoring, community management and moderation, creator and influencer management, publishing and scheduling suites, social customer care, and social commerce conversion tools. It excludes paid social advertising spend and the media buying platforms that place it, the social networks themselves, general marketing automation, and consumer-facing social applications.
Quantitative Units
USD millions, subscription software revenue basis; managed seats; net revenue retention as a percentage; monthly list price per seat in USD; enterprise sales cycle in months.
Segmentation Dimensions
Application class; end-use industry; commercial channel; geography across seven regions.
Regions Covered
North America, Western Europe, East Asia, South Asia and Pacific, Latin America, Middle East and Africa, Eastern Europe
Countries Covered
United States, Canada, Mexico, Brazil, United Kingdom, Germany, France, Netherlands, Sweden, Poland, Romania, China, Japan, South Korea, India, Indonesia, Thailand, Australia, Saudi Arabia, South Africa.
Key Companies Profiled
Sprinklr, Salesforce, Hootsuite, Adobe, Sprout Social, Emplifi, Brandwatch, Talkwalker, Meltwater, Later, Khoros, Zoho, HubSpot, CreatorIQ, Bazaarvoice.
Quantitative Methodology
Primary survey, n=3,800 respondents, Q4 2025, six countries; demand-side model with trade association cross-validation
Qualitative Methodology
47 expert interviews, Q4 2025; applied to validate demand model assumptions, identify emerging dynamics, and assess competitive positioning
Report Format
PDF and XLSX data workbook (Word format preview document)
Publisher
Market Minds Advisory
Report Code
MMA-2026-TEC-351
Published
September 2026
Contact
sales@marketmindsadvisory.com | www.marketmindsadvisory.com

Purchase the full Social Media Engagement Applications Market Report (2026 to 2036).

This report sizes the global social media engagement applications market from 2026 to 2036 across six application classes, six end-use industries and seven regions. It explains why every vendor depends on interfaces controlled by 6 platforms, and what the 2023 repricing did to the economics of the category. Cost composition is sourced to company annual reports, with engineering headcount at 41% of vendor cost. Regional analysis explains why subscription spending sits in North America while transactional activity sits in Asia. Competitive assessment covers 20 named vendors with four revenue lever analyses and an anonymised platform consolidation engagement.
Platform dependency modelled as the defining category risk
Six application classes sized through to 2036
Vendor cost composition sourced from annual reports
Twenty named vendors assessed on subscription revenue
Four revenue levers with quantified commercial impact
Anonymised platform consolidation engagement included in full

Built For The People Who Decide

From boardroom strategy to bench-side execution, this report is read cover-to-cover by leaders shaping the next decade of their industry, turning demand scenarios, market dynamics and valuation benchmarks into decisions.
CXOs/ Presidents/ VPs/ Managers
M&A and Corporate Development
Strategy Teams and R&D Heads
Procurement and Product Directors
Regulatory and Compliance Leaders
Investor Relations and Equity Analysts