Market Minds Advisory
Social Commerce Market

Social Commerce Market: Social Commerce Market: Enabling Revenue Classes, Production Economics and Regional Divergence 2026 to 2036

Western platforms copied the storefront and missed the point entirely. What works in Asia is a person selling to you live, in a conversation, with payment and delivery inside the same application.

Lead Analyst

Published

September 2026

Make Smarter Decisions with Customized Research Insights

Request a free sample report and evaluate market opportunities, growth trends, and competitive dynamics relevant to your business needs.

2025 MARKET VALUE$22.0BMarket Size 2025
2036 FORECAST VALUE$121.4BBase Case , 2026 to 2036
CAGR 2026 TO 203616.8 %Bull 18.2% / Bear 15.5%
INCREMENTAL OPPORTUNITY$95.7BNet 10- year value creation
EXPANSION MULTIPLE4.72x2036 value over 2026 base
Strategic Levers
M&A Pipeline
Regional Outlook
Country Rankings
Competitive Intelligence
Segmental Deep-dive
Call-Us : 91 93563 13602

Executive Snapshot and Market Trajectory.

This report measures enabling revenue rather than transaction value, since gross merchandise value is a flow and not a market. Western analysis keeps missing that social commerce in Asia is mediated selling rather than shopping on social media. The mediation is precisely the part that never transferred westward at all.
The market reaches USD 25.70 billion in 2026 and USD 121.43 billion by 2036, a 4.72 times expansion at 16.8%. Live commerce production and tooling grows at 25.2%, half again the market rate of 16.8%, because a successful selling operation runs studios and schedules rather than software. East Asia holds 44% of enabling revenue, and Indonesia compounds fastest at 27.6% in a market where mobile is the only channel.
Five firms hold 51% of enabling revenue and four of them are platforms rather than software vendors, which tells you where the value sits. ByteDance, Alibaba, Meta Platforms and Kuaishou operate channels and retain take rates near 6%. Shopify supplies the commerce infrastructure underneath. Independent tooling vendors compete for whatever remains and spend a great deal of time explaining their own margins to everybody. Four of five leaders being platforms tells you where value accumulates.
Market Definition
This report covers revenue earned by businesses enabling commerce through social and messaging channels: live commerce production and tooling, creator and affiliate commerce infrastructure, platform commerce take rate revenue, social channel fulfilment and logistics services, conversational and messaging commerce platforms, and social storefront and catalogue software. It excludes gross merchandise value itself, advertising revenue, conventional e-commerce platforms without social mediation, influencer marketing without transaction, and general payment processing.
Base Year Value
$22.0B in 2025 (MMA Primary Research Dataset, September 2026)
Forecast Period
2026 to 2036, eleven discrete annual values
CAGR
16.8% base case. Bull 18.2%. Bear 15.5%.
Fastest Growth Segment
Live Commerce Production And Tooling: 25.2% CAGR
Fastest Growth Country
Indonesia: 27.6% CAGR
Fastest Growth Region
South Asia and Pacific: 19.0% CAGR
Largest Region
East Asia: 44% of 2025 global value
Market Leaders
ByteDance, Alibaba, Meta Platforms, Shopify and Kuaishou lead on social commerce enabling revenue. Source: MMA Analysis.
Primary Survey
n=3,800 procurement and R&D decision-makers, Q4 2025, six countries
Methodology
Demand-side build-up, cross-validated against public data, 47 expert interviews

Social Commerce Market Forecast Scenarios

social-commerce-market-size-forecast-scenario-1789992008388
Between 2020 and 2025 the category compounded at 15.6%, almost entirely on Asian growth that Western markets never matched. Live commerce became a substantial share of Chinese retail while equivalent Western attempts closed or scaled back, and the divergence widened rather than narrowing. Several Western platforms launched, withdrew and relaunched shopping features across that period without changing the underlying behaviour at all.
The base case holds 16.8% on three mechanisms. Southeast Asian markets are following the Chinese pattern rather than the Western one, with Indonesia compounding at 27.6% on genuinely mobile-only commerce. Creator commerce infrastructure keeps professionalising as the people making sales demand attribution and payment systems that work. And messaging based commerce continues expanding wherever a messaging application already carries payment capability, since the transaction then completes inside the conversation that created it.
The bull case at 18.2% assumes live commerce finds a Western format that works rather than being copied directly from Asian practice. The bear case at 15.5% is return rates: items bought during live sessions come back at around 31%, which reverses a substantial share of reported transaction value and could make the underlying economics unattractive to merchants once properly measured.

Mediated Selling, Not Social Shopping

Western analysis of this market keeps making the same mistake and the regional numbers show it plainly. Social commerce in Asia is not shopping on social media. It is selling mediated by a person, live, in a conversation, with payment and delivery inside the same application. Western platforms replicated the storefront and not the mediation, which is why the behaviour never transferred at anything like comparable scale.
TOP FIVE CONCENTRATION51%Concentrated among platform operators rather than independent software vendors
LIVE COMMERCE RETURN RATE31%Items returned from purchases made during live selling sessions
CREATOR COMMISSION SHARE14%Transaction value paid to whoever actually made the sale
PLATFORM TAKE RATE6%Commission retained by the social platform on completed transactions
LIVE SESSION CONVERSION9%Viewers purchasing during a session at established selling operations
STUDIO SESSIONS PER WEEK38Live selling broadcasts run by a mature commerce operation
Live commerce is a production business that people keep mistaking for a technology one. A mature operation runs around 38 sessions a week from a studio, with hosts who have genuine followings, a merchandising team and a schedule that resembles television shopping far more than it resembles e-commerce. Session conversion reaches around 9%, which no conventional channel approaches, and the tooling contributes far less than the production does.
The returns figure explains why take rate economics diverge so sharply from headline transaction value. Items bought during live sessions come back at around 31%, because the decision was emotional and the product was visible for perhaps thirty seconds. That reverses a substantial share of reported gross merchandise value before anybody earns anything, and very few published figures adjust for it.
"A Western retailer asked me which live commerce platform to buy. The honest answer was that they needed a studio, a schedule and somebody people actually want to watch. The software is the least interesting part of the problem and it is the only part anybody sells."
Director, Digital Commerce and Consumer Platforms Practice · MMA Technology Practice · September 2026

Market Trends

Live Selling Is Television Shopping With Better Targeting

A mature live commerce operation runs around 38 sessions a week from a studio with hosts, producers and a merchandising team working to a schedule, which resembles home shopping television considerably more than it resembles online retail. Conversion during a session reaches around 9% against a fraction of that for conventional browsing. The tooling that vendors sell contributes far less than the production capability does, which is why software margins in this category remain difficult and why retailers who bought platforms without building operations saw nothing happen. Software was never the missing component.
Market Impact: Indonesia compounds at 27.6% annually
Creator Infrastructure Professionalised As Money Grew

When creator commerce meant occasional affiliate links, attribution by spreadsheet and payment by invoice was adequate for everybody involved. Creators now take around 14% of transaction value on sales they generate, and at that scale they demand accurate attribution, timely payment and visibility into what actually converted. Creator and affiliate commerce infrastructure compounds at 22.4% on that professionalisation, and platforms losing creators to competitors over payment delays discovered that the supply side of this market has genuine bargaining power. Attribution accuracy and payment timing now decide where selling volume actually goes, which is not how anybody expected this to develop.
Market Impact: Messaging commerce compounds at 19.6%

Market Opportunities and Growth Drivers

Southeast Asia Is Following Asia Rather Than The West

Indonesian, Vietnamese and Thai commerce developed on mobile with messaging and live video as native behaviours rather than as additions to desktop retail, which means the Chinese pattern transfers there in a way it never transferred to Europe or North America. Indonesia compounds at 27.6%, ahead of every other market, on live and messaging commerce that reaches consumers who never used a desktop storefront at all. Local platforms and creator networks developed alongside that rather than being imported from anywhere else. Local platforms built for those behaviours rather than importing anything from elsewhere entirely.
Market Impact: Around 31% of live sales return

Messaging Commerce Follows Embedded Payment Capability

Conversational commerce grows wherever a messaging application already carries payment capability, because the transaction then completes without leaving the conversation that created the intent. Where payment sits in a separate application the conversion collapses regardless of how good the messaging experience is. Conversational and messaging commerce compounds at 19.6% concentrated almost entirely in markets where that integration exists. The determining factor is payment infrastructure rather than messaging adoption, which several Western platforms discovered expensively after launching without it. Several Western platforms discovered that expensively after launching without any payment integration at all.
Market Impact: Take rates near 6% stayed flat

Market Restraints and Challenges

Return Rates Reverse A Third Of Live Sales

Items purchased during live selling sessions are returned at around 31%, considerably above conventional online retail, because the decision was emotional and the product was visible for a very short time before purchase. The root cause is that live selling works by compressing consideration, which is exactly what produces the conversion and exactly what produces the returns. Commercially this reverses a substantial share of reported transaction value. Mitigation runs through better product presentation, sizing guidance and honest merchant reporting that adjusts for returns. Very few published figures adjust for it anywhere.
Market Impact: Sessions convert at around 9%

Western Adoption Did Not Follow Platform Investment

Western platforms have launched, withdrawn and relaunched shopping features repeatedly across five years without materially changing consumer behaviour in those markets. The root cause is that they replicated the storefront rather than the mediated selling relationship, and a catalogue inside a social application is simply a worse version of a retailer's own site. Commercially this stranded considerable investment. Mitigation runs through creator led selling and messaging commerce rather than through storefront features nobody has ever asked for. A catalogue inside a social application is simply a worse version of the retailer's own site.
Market Impact: Creators take 14% of transaction value
3 additional market trends, 4 additional growth drivers, and 2 additional restraints and challenges are covered in the full report. Contact sales@marketmindsadvisory.com to access the complete intelligence.

Segment CAGR and Growth Architecture

Segmentation follows enabling revenue class, since what a business actually charges for determines whether it scales with transactions, with production or with software seats. Six classes cover the market: live commerce production and tooling, creator and affiliate infrastructure, conversational and messaging commerce, social channel fulfilment, social storefront software, and platform take rate revenue. Merchant category is a separate dimension.
social-commerce-market-market-share-analysis-1789992008955

Live Commerce Production And Tooling

Live commerce production and tooling grows at 25.2%, half again the market rate of 16.8%, and most of that value sits in production rather than in software. A mature operation runs around 38 sessions a week from a studio with hosts, producers and merchandisers working to a broadcast schedule, which is home shopping television with better targeting rather than anything resembling online retail. Session conversion reaches around 9%, far above any conventional channel. Retailers who bought platforms without building the operation behind them saw nothing happen, which is the single most repeated mistake in this whole category. Production capability rather than tooling decides outcomes here entirely. Nobody has found a shortcut around that.
CAGR 25.2%

Creator And Affiliate Commerce Infrastructure

Creator and affiliate commerce infrastructure compounds at 22.4% because the amounts involved outgrew the systems handling them. Creators now take around 14% of transaction value on sales they generate, and at that level they require accurate attribution, prompt payment and genuine visibility into what converted rather than a monthly spreadsheet and an invoice. Platforms that lost creators to competitors over payment delays learned that the supply side here holds real bargaining power. The infrastructure is unglamorous, it decides which platform creators actually promote, and very few operators treat it as a competitive asset. Whoever creators actually promote is where the transactions end up happening. Very few operators treat it as competitive.
CAGR 22.4%
Full segment breakdown across 6 segments available in the complete report.

Regional Architecture and Country Demand Map

East Asia holds 44% of enabling revenue, far beyond any standard band, because live and mediated selling developed there as native mobile behaviour. North America at 15% and Western Europe at 12% both sit below their bands, since the behaviour never transferred at comparable scale.

East Asia

East Asia holds 44% of enabling revenue, far above the 30% band ceiling, because this behaviour originated here and remains a substantially larger share of retail than anywhere else. Chinese live commerce operates at a scale Western observers consistently underestimate, with mature operations running around 38 studio sessions weekly and session conversion near 9%. Alibaba, ByteDance, Kuaishou and Pinduoduo all operate here and compete directly. Korean and Japanese live commerce grew more slowly and now runs at genuine scale. Growth at 17.6% sits above the global rate on continued professionalisation rather than on new adoption. Nothing about the scale here is well understood by Western observers. Competition between the four is direct and intense.
Share: 44% | CAGR: 17.6% (2026 to 2036)

South Asia and Pacific

Growth of 19.0% makes South Asia and Pacific the fastest region on 18% of enabling revenue, far above the 12% band ceiling, and Indonesia compounds at 27.6% within it. Commerce here developed on mobile with messaging and live video as native behaviours rather than as additions to desktop retail, which is why the Chinese pattern transfers and the Western one does not. Indian social selling through messaging and creator networks reaches consumers no conventional storefront serves. Local platforms including Shopee, Tokopedia and Meesho built for these behaviours rather than importing anything. Consumers here reached commerce through messaging rather than through any storefront. Local platforms rather than imports serve them. Nothing here follows the West.
Share: 18% | CAGR: 19.0% (2026 to 2036)
Regional intelligence for 5 additional markets available in the complete report: North America, Western Europe, Latin America, Middle East and Africa, Eastern Europe. Contact sales@marketmindsadvisory.com.
social-commerce-market-country-cagr-analysis-1789992009500

What Actually Generates Revenue Here

The largest enabling revenue in this market sits with platforms rather than software vendors, live selling is a production business that people keep buying software for, and around a third of live purchases come straight back. Each of the four levers below responds to one of those rather than to any argument about consumer intent.

Sell Production Capability, Not Broadcasting Software

A mature live commerce operation runs around 38 sessions a week from a studio with hosts, producers and merchandisers, and session conversion near 9% comes from that operation rather than from the platform carrying it. Retailers who bought tooling without building the capability behind it saw nothing happen at all, which is the most repeated mistake in this category. Vendors selling software into that situation are supplying the least important component and then explaining why results did not follow, which is not a sustainable commercial position. Explaining absent results is not a business.
Market Impact: Sessions convert at 9% on the production capability

Treat Creator Payment As A Competitive Asset

Creators take around 14% of transaction value on sales they generate, and at that level they choose platforms partly on whether attribution is accurate and payment arrives promptly. Platforms have lost creators to competitors over payment delays alone, which is a supply side bargaining power that nobody in this industry anticipated. Creator infrastructure compounds at 22.4% and remains unglamorous work that very few operators fund properly. Whoever the creators promote is where the transactions happen, and creators talk to each other about payment constantly. Creators discuss payment reliability with each other constantly.
Market Impact: Creators earning 14% now choose their own platform

Report Revenue Net Of Returns Honestly

Items bought during live sessions return at around 31%, considerably above conventional retail, because live selling works by compressing consideration and that produces both the conversion and the returns. Gross merchandise value figures that ignore this overstate the economics substantially, and merchants discover the difference after committing. Platforms and vendors reporting net figures build merchant relationships that survive the second quarter, while those quoting gross transaction value are setting up a conversation nobody enjoys having later. Gross figures set up a conversation nobody enjoys having in the second quarter, once the merchant has measured what actually stayed sold.
Market Impact: Returns reverse fully 31% of live session sales

Follow Payment Integration Into Messaging Markets

Conversational commerce compounds at 19.6% and grows only where a messaging application already carries payment capability, since the transaction has to complete without leaving the conversation that created the intent. Where payment sits elsewhere, conversion collapses regardless of experience quality. Indonesia compounds at 27.6% and Brazilian messaging commerce works for exactly this reason. Entering a market without that integration is investing against a behaviour the local infrastructure cannot support, which several Western platforms established expensively. Entering without that integration invests against a behaviour the local infrastructure cannot support, which is an expensive lesson several platforms have now paid for twice.
Market Impact: Messaging commerce compounds at 19.6% where payment exists

Who Controls the Margin Pool

Five firms hold 51% of social commerce enabling revenue and four are platforms rather than software vendors, which indicates where the value in this category actually accumulates. ByteDance, Alibaba, Meta Platforms and Kuaishou operate channels and retain take rates near 6% on completed transactions. Shopify supplies the commerce infrastructure underneath many of them without operating any channel of its own. All participants are assessed on social commerce enabling revenue.
Competition between platforms runs on creator supply rather than on consumer reach, which reverses how these businesses are usually analysed. Creators taking around 14% of transaction value choose where to sell partly on attribution accuracy and payment timing, and transactions follow them. Platforms with larger audiences have lost selling volume to smaller ones over payment reliability, which almost nobody analysing this market predicted would happen at all.

Rankings shift on whether live commerce finds a Western format rather than being copied from Asian practice, since that is the largest unclaimed opportunity in the category. The second pressure is return rates, which merchants are beginning to measure properly and which could make participation unattractive in categories where 31% comes back.
social-commerce-market-company-positioning-matrix-1789992010027

Competitive Moat and Risk Dimensions

BYTEDANCE

Moat: Discovery And Commerce Integration

ByteDance combines content discovery with transaction completion inside one application, so a purchase intent created by a video is satisfied without the user leaving anything. That integration is what separates mediated selling from a catalogue, and replicating it requires both the discovery capability and the commerce infrastructure at once. Very few organisations anywhere hold both to a comparable standard.
BYTEDANCE

Risk: Regulatory Market Access

Operations in several major markets depend on regulatory and political decisions unrelated to commercial performance, and restrictions have been imposed or threatened repeatedly. A commerce business built on a content platform inherits every constraint applied to that platform. No commercial strategy addresses a decision taken entirely on national security grounds elsewhere.
ALIBABA

Moat: Live Commerce Operating Depth

Alibaba built live commerce operations, merchant training and host development over more than a decade, producing operating knowledge about scheduling, merchandising and production no platform acquires by launching a feature. That depth is why Chinese live commerce works at scale where Western imitations did not. It sits in people and practice rather than software.
ALIBABA

Risk: Domestic Market Concentration

The position depends on a single national market where competition from ByteDance, Kuaishou and Pinduoduo is direct and intense across every category. International expansion means exporting a behaviour that has repeatedly failed to transfer to Western consumers regardless of investment. Southeast Asia is the realistic opportunity and local platforms are already established there.

Players Tracked

Prominent Players

ByteDance
Alibaba
Meta Platforms
Shopify
Kuaishou

Other Key Players

Amazon
Pinduoduo
Shopee
Coupang
Meesho
Whatnot
Bambuser
CommentSold
LTK
ShopMy
Klarna
Salesforce
Adobe
BigCommerce
Firework

Recent Developments

MARCH 2025

Whatnot Expands Live Selling Categories Beyond Collectables

Whatnot expanded live selling into additional product categories beyond the collectables that established the platform, an organic expansion rather than an acquisition. Live selling works through host relationships and scheduled sessions rather than catalogue browsing, and category expansion depends on finding hosts that specific audiences actually want to watch.
Signal: Finding the right host matters considerably more than adding any new category to a given platform.
SEPTEMBER 2024

Meta Adjusts Creator Payment Timing Across Commerce Products

Meta Platforms adjusted creator payment timing and attribution reporting across its commerce products, an operational change rather than any transaction. Creators take around 14% of transaction value and choose where to sell partly on whether payment arrives promptly, and platforms have lost selling volume over delays alone.
Signal: The supply side of this market has bargaining power that almost nobody anticipated it would develop.
JUNE 2025

Shopee Expands Live Commerce Operations Across Southeast Asian Markets

Shopee expanded live commerce operations across additional Southeast Asian markets, an organic expansion rather than a partnership or merger. Commerce in these markets developed on mobile with messaging and live video as native behaviours, which is why Asian patterns transfer here and Western ones consistently do not.
Signal: Southeast Asia is following the Chinese model rather than the Western one, and the gap keeps widening.

What Live Selling Costs To Run

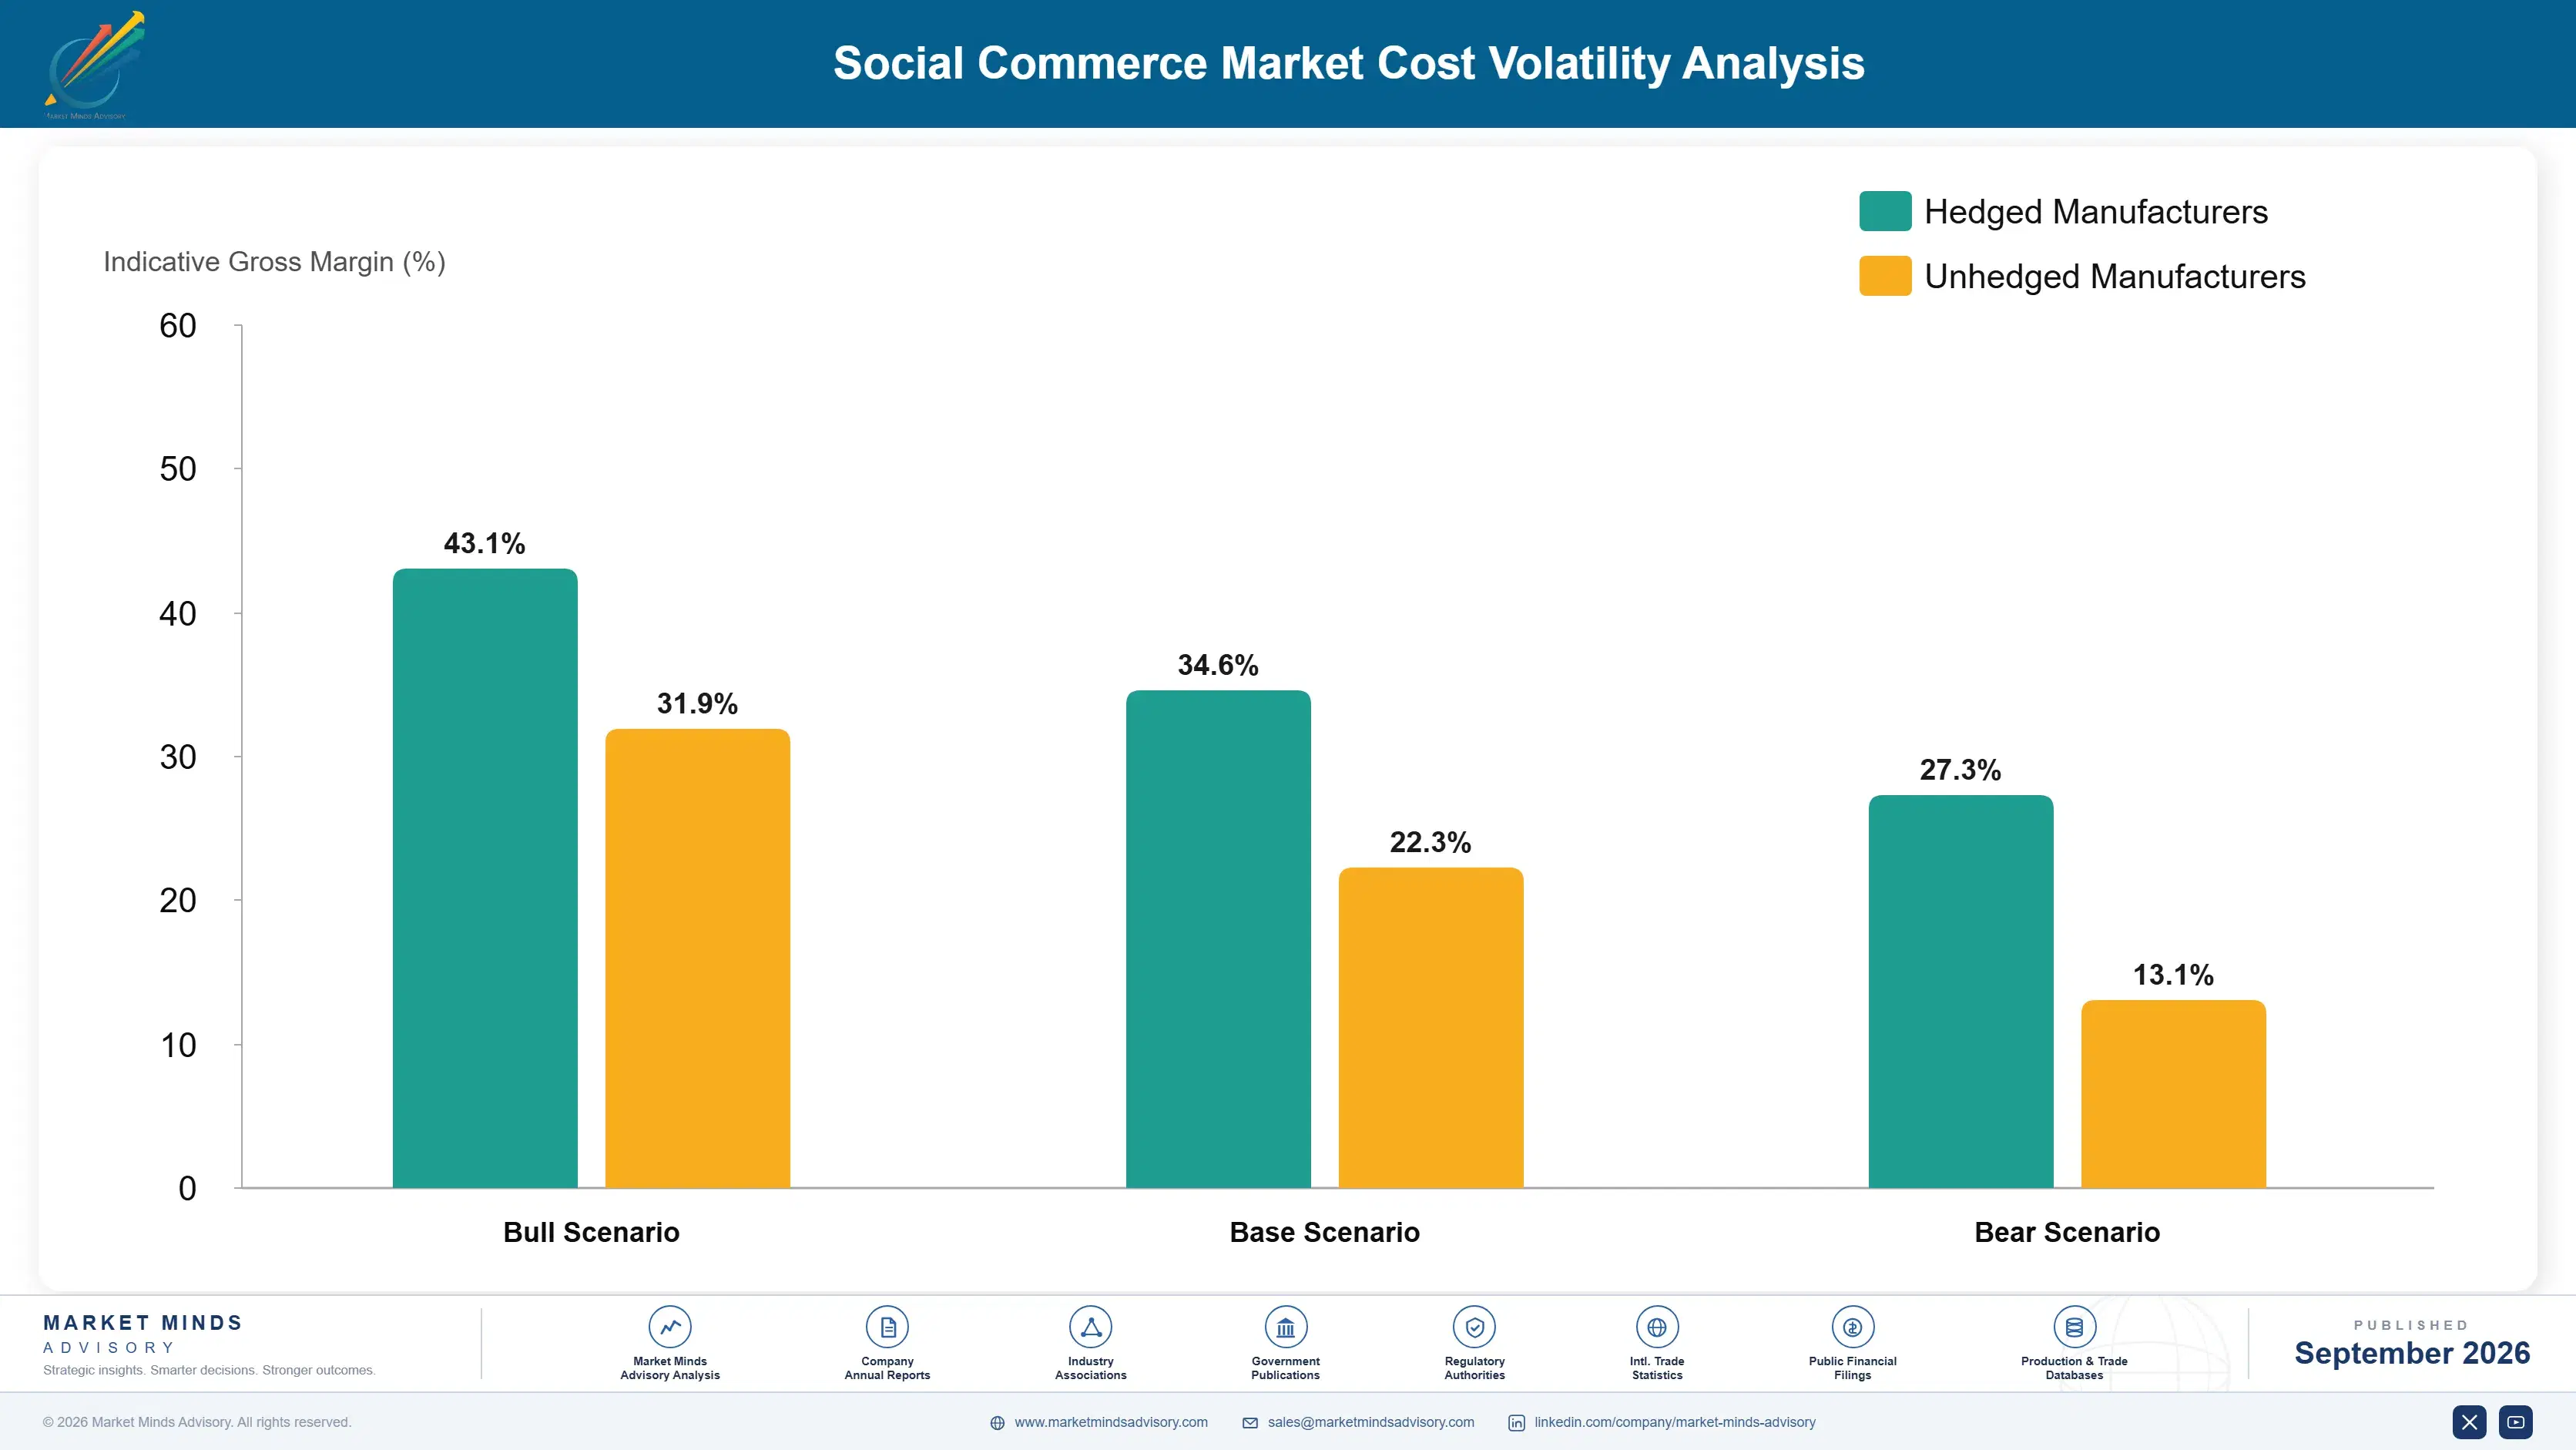
Host and talent cost accounts for roughly 29% of live commerce operating expense, since audiences follow individuals rather than brands and the good ones command accordingly. Studio production including space, equipment and crew carries around 24%. Merchandising and inventory positioning absorb about 18%, and platform fees plus technology take most of the remaining balance across a typical operation.
Returns processing rose as a cost line through 2023 and 2024 as live selling volumes grew and merchants measured the consequences properly for the first time. Alibaba Annual Report 2024 and Shopify Annual Report 2024 both record merchant services and logistics as principal operating variables. Operations that priced products against gross transaction value rather than net of returns absorbed the difference directly, which several discovered only after committing inventory to a schedule.

The competitive disadvantage mechanism is session utilisation rather than any technology cost. Studio and host costs are largely fixed once committed, so an operation running 38 sessions weekly carries far lower cost per session than one running eight. Exposure concentrates among retailers experimenting with live commerce at low volume, which is precisely how most Western attempts were structured before they were abandoned as uneconomic.
social-commerce-market-cost-volatility-analysis-1789992010224

Run Studios At Genuine Broadcast Utilisation

Studio and host costs are largely fixed once committed, and an operation running around 38 sessions weekly carries a fraction of the per session cost that occasional broadcasting does. Retailers experimenting at low volume face economics that cannot work at all. Committing to a real schedule or not starting is the honest choice, and most abandoned attempts never did.

Price Products Against Net Rather Than Gross Sales

Live session returns run around 31%, considerably above conventional retail, and merchants pricing against gross transaction value absorb that difference entirely themselves. Modelling margin against expected net sales before committing inventory to a broadcast schedule changes which products belong in a session at all. Most operations discover this after a quarter of results rather than before their first broadcast.

Develop Hosts Internally Rather Than Renting Reach

Host and talent costs run around 29% of operating expense and established creators price against their following rather than against any conversion they deliver. Developing hosts internally takes months and produces talent whose audience belongs to the operation rather than to an individual who can leave. Retailers renting reach rebuild an audience they never own, repeatedly and expensively.

Portfolio Architecture for Margin Defence

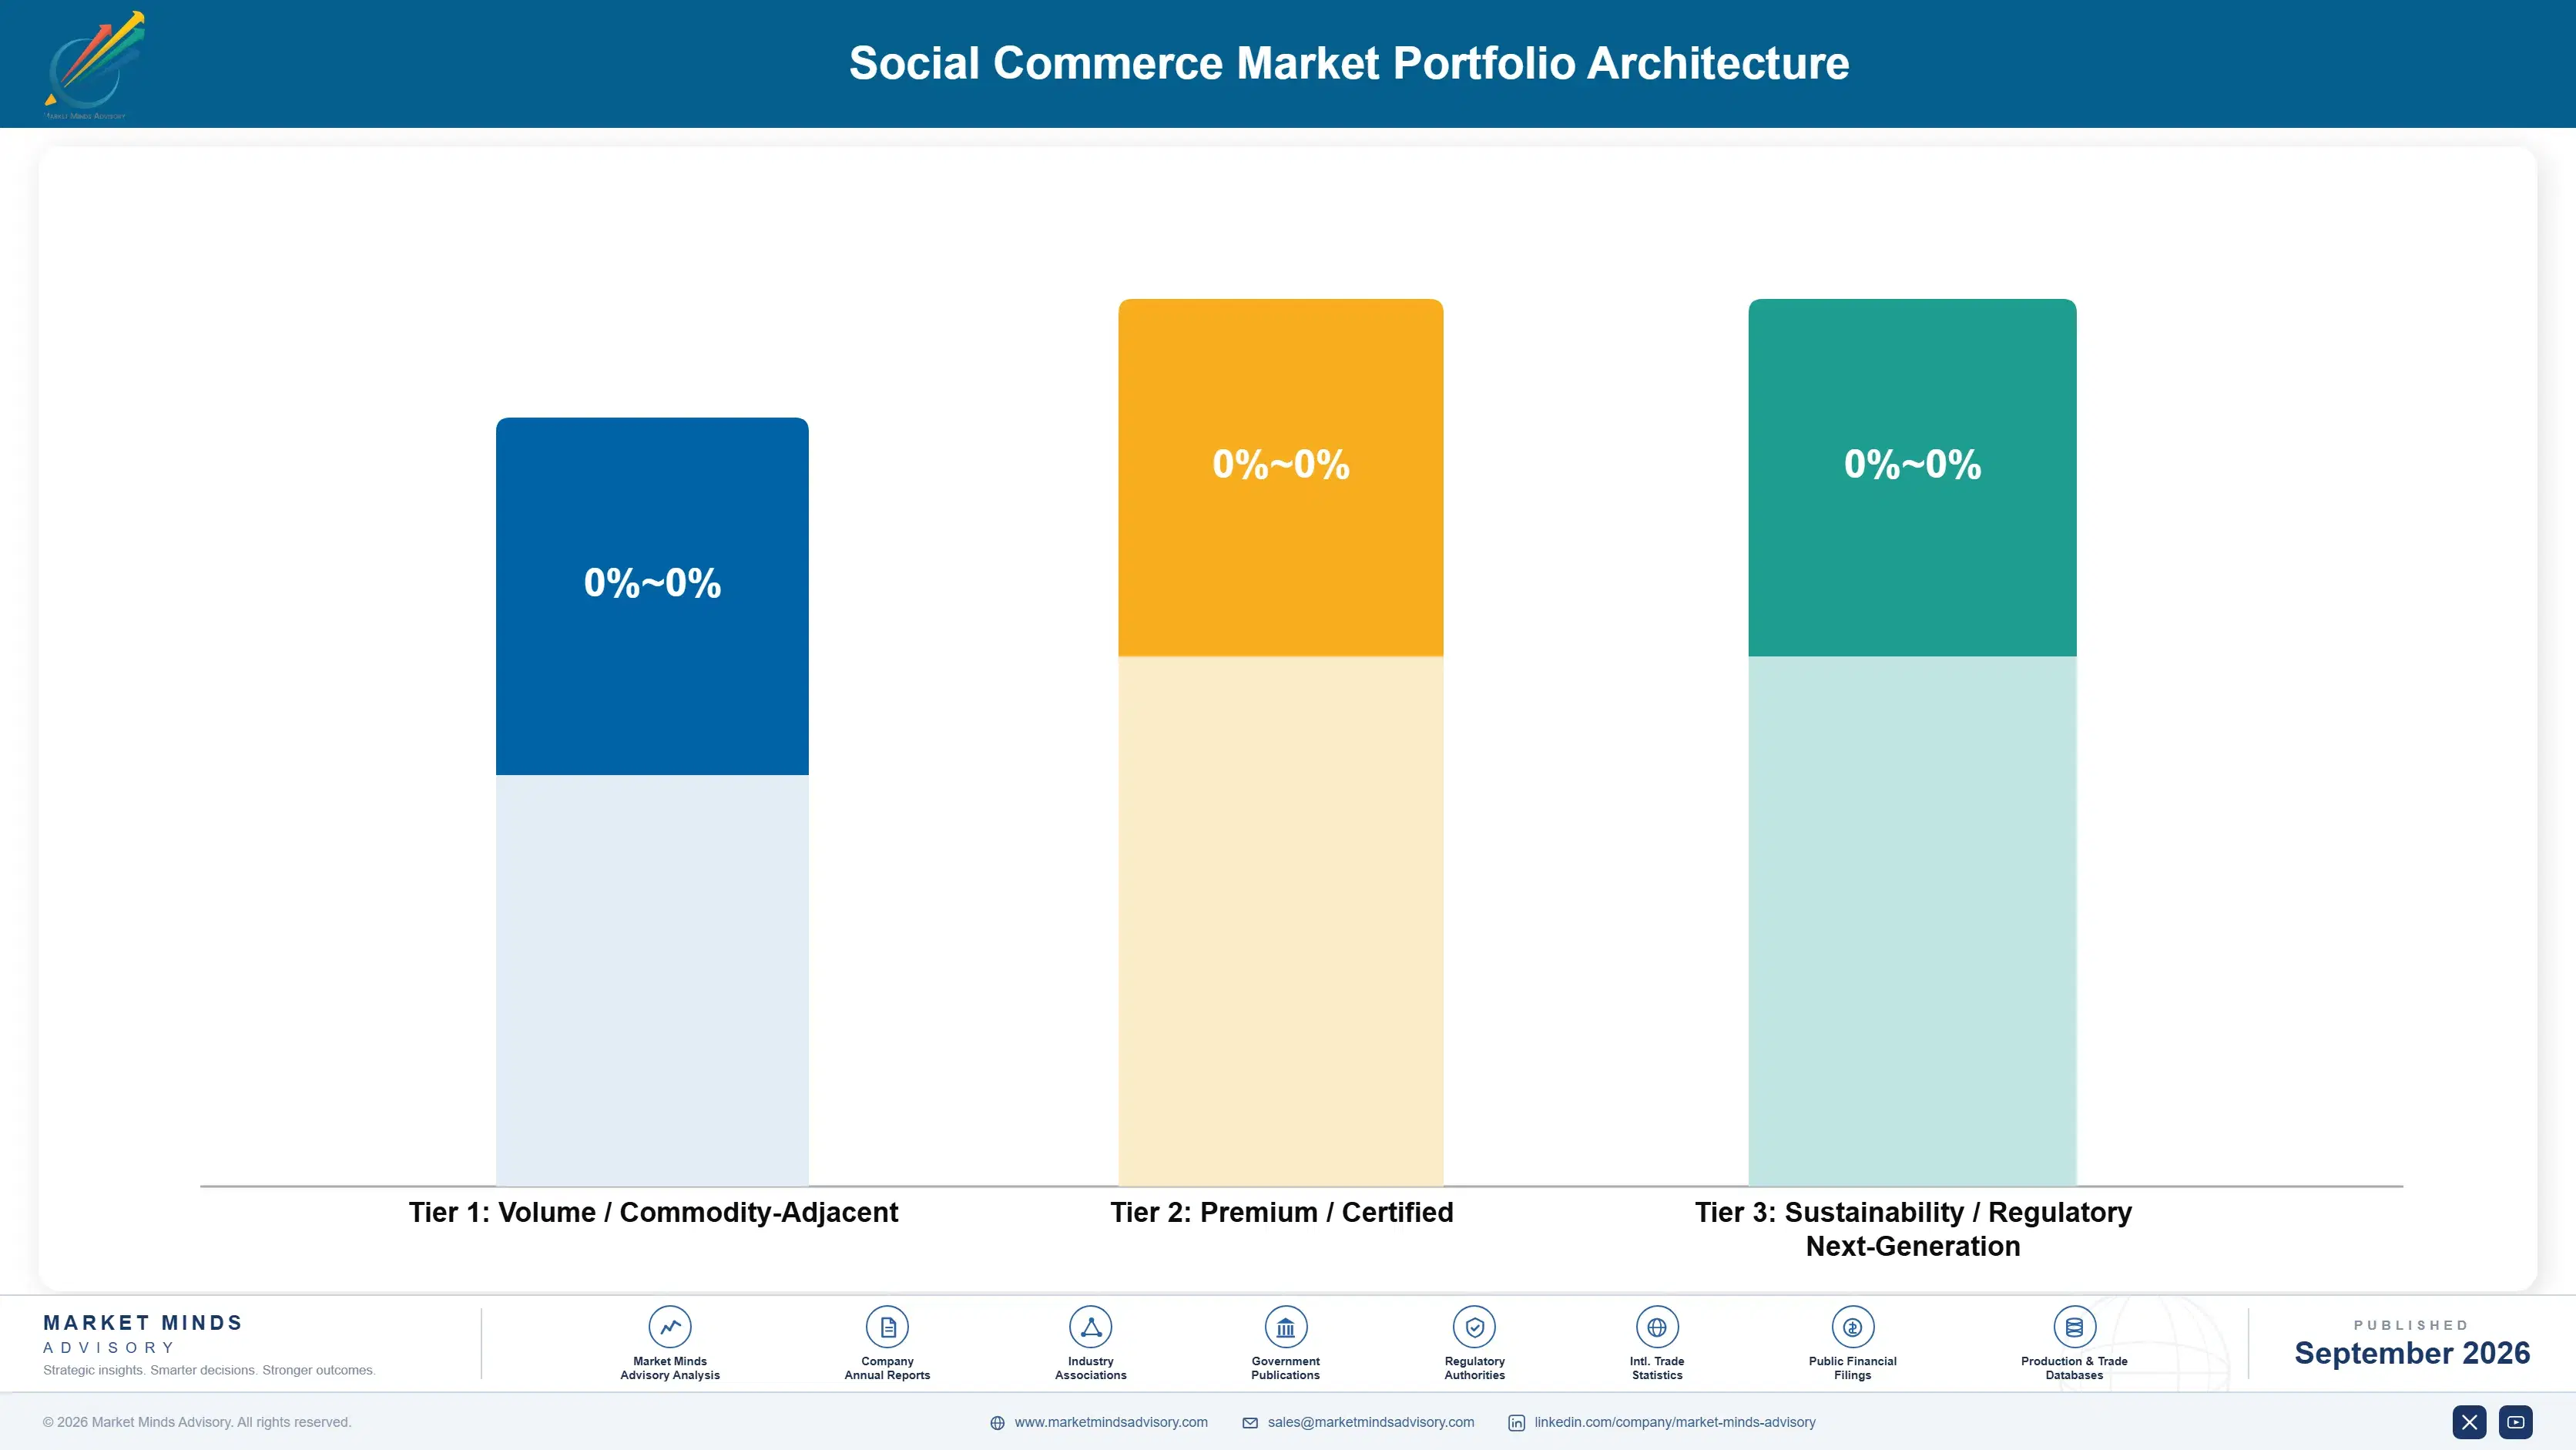
Margin architecture separates on whether the revenue is a take rate or a service fee. Social channel fulfilment and storefront software earn least, since both compete against established logistics and commerce providers offering the same capability without any social framing. Conversational commerce sits in the middle. Platform take rates, creator infrastructure and live commerce production earn most, each for entirely different underlying reasons.
The volume versus premium tension is unusually clear here. Platform take rates near 6% apply to enormous transaction volumes at almost no marginal cost, which is why four of the five leaders are platforms rather than vendors. Production and tooling businesses carry real operating cost per session and cannot scale the same way. Software vendors sitting between the two positions capture neither the volume economics nor the service margin.

High-value pools concentrate in platform take rates and in creator infrastructure, and neither is reachable by building better software. Take rates require operating a channel consumers actually use, which is a decade of accumulated audience. Creator infrastructure requires reliability creators trust with their income, which is reputation rather than technology. Both are positions rather than products, which explains the concentration this category shows.

Volume / Commodity-Adjacent

Social channel fulfilment services and social storefront catalogue software, competing against established logistics and commerce providers offering equivalent capability without social framing. The ten point spread separates providers with genuine scale from those operating small volumes at considerably higher unit cost per order.
Gross Margin: 18% to 28%

Premium / Certified

Conversational and messaging commerce platforms plus live commerce production services, carrying real operating cost per session or per conversation handled. The twelve point spread tracks session and conversation utilisation, since fixed production and staffing costs punish low volume operations severely in both of those businesses.
Gross Margin: 36% to 48%

Sustainability / Regulatory / Next-Generation

Platform take rate revenue and creator commerce infrastructure, one applying near 6% to enormous volume at minimal marginal cost and the other holding a supply side position. The sixteen point spread reflects audience scale and creator trust, neither of which any competitor can build quickly.
Gross Margin: 54% to 70%
social-commerce-market-portfolio-architecture-1789992010731

High-value Sub-segments and Strategic Watch-out

Live Commerce Production And Tooling

Grows at 25.2% on operations running around 38 studio sessions weekly with hosts, producers and merchandising teams behind them. The twelve point spread reflects session utilisation. Retailers who bought software without building the operation behind it saw nothing whatsoever happen. Software was the least important part of it.
Gross Margin: 36% to 48%

Creator And Affiliate Commerce Infrastructure

Grows at 22.4% because creators taking 14% of transaction value now demand accurate attribution and prompt payment for it. The sixteen point spread reflects creator trust. Platforms have lost selling volume to smaller competitors over payment delays alone. Reliability rather than reach decides this. Trust is the whole asset.
Gross Margin: 54% to 70%

Conversational And Messaging Commerce Platforms

Grows at 19.6% wherever a messaging application already carries payment, so the transaction completes without leaving the conversation. The twelve point spread reflects conversation volume. Payment infrastructure rather than messaging adoption determines whether this works anywhere. The wallet has to be in the application already.
Gross Margin: 36% to 48%

Platform Commerce Take Rate Revenue

Grows at 11.2%, slowest of the six classes, on take rates near 6% that competitive pressure keeps from rising anywhere. The sixteen point spread reflects audience scale. Enormous volume at minimal marginal cost is why four of five leaders are platforms. Competitive pressure keeps take rates from rising.
Gross Margin: 54% to 70%

What Holds Merchants And Creators

The annuity is the audience rather than any contract, and it does not belong to the merchant. A retailer building live commerce on a platform develops host followings, session histories and repeat viewership that live inside that platform and cannot be exported anywhere. Moving means rebuilding the audience from nothing while a competitor keeps broadcasting. That switching cost is why take rates near 6% have held despite constant merchant complaint.
Depth varies by who owns the following. A retailer with internally developed hosts owns the relationship and can move it partly. A retailer renting established creators owns nothing at all, and the creator leaves with the audience whenever a better arrangement appears elsewhere. Creators taking around 14% of transaction value understand that position perfectly well, which is why creator infrastructure quality now decides where selling volume actually goes.

The buyer moved from a marketing function to a commercial one and the products have not followed. A marketing director once bought social commerce as brand activity measured on engagement. A commercial director now buys it as a sales channel measured on net revenue after returns of around 31%. Vendors presenting engagement and gross transaction value answer a buyer who stopped signing.
social-commerce-market-end-use-penetration-index-1789992011229

What Makes This Work Commercially

These are among the four positions where our research anticipates prominent divergence between winners and laggards over the coming forecast period. Each is grounded in the demand model, the regulatory perimeter, and the announced capacity pipeline.
01 / PRODUCTION CAPABILITY BUILDING

Buy A Studio Before Buying Software

A mature live commerce operation runs around 38 sessions each week from a studio with hosts, producers and merchandising teams, and session conversion near 9% comes from that operation rather than from whatever platform happens to be carrying it. Retailers who purchased tooling without building the capability behind it saw nothing at all happen, which is the single most repeated mistake anybody makes in this category. Vendors selling software into that situation supply the least important component and then explain why nothing followed.
02 / CREATOR SUPPLY RETENTION

Pay Creators Promptly Or Lose Them

Creators take around 14% of transaction value on the sales they generate, and at that level they choose where to sell partly on whether attribution is accurate and payment actually arrives when promised. Platforms with far larger audiences have lost selling volume to smaller competitors over payment delays alone, which is a supply side bargaining power that essentially nobody in this industry anticipated developing. Creator infrastructure compounds at 22.4% and remains unglamorous work that remarkably few operators anywhere fund seriously enough to matter.
03 / NET REVENUE REPORTING

Publish What Actually Stays Sold

Items purchased during live selling sessions return at around 31%, considerably above conventional online retail, because live selling works by compressing consideration and that produces both the conversion rate and the returns simultaneously. Gross merchandise value figures ignoring this overstate the economics substantially, and merchants discover the difference only after committing inventory to a broadcast schedule. Platforms reporting net figures build merchant relationships that survive a second quarter rather than collapsing into an argument nobody wants to have about numbers that were never net.
04 / PAYMENT INFRASTRUCTURE FOLLOWING

Enter Where The Wallet Already Is

Conversational commerce compounds at 19.6% and grows only in markets where a messaging application already carries payment capability, because the transaction must complete without leaving the conversation that created the purchase intent. Where payment sits in a separate application entirely, conversion collapses regardless of how good the messaging experience itself happens to be. Indonesia compounds at 27.6% and Brazilian messaging commerce works for precisely this infrastructure reason, while several Western platforms established the opposite conclusion rather expensively over several years.

Engagement Snapshot From the Field

A live engagement with an industry participant carrying material or product regulatory and market exposure ahead of a defining policy shift, showing how our research translates into a defensible multi-year portfolio strategy.
MARKET MINDS ADVISORY · CLIENT ENGAGEMENT SUMMARY
Social Commerce Producer Strategic Portfolio Review and Transition Roadmap 2026·Investment Scenario on Social Commerce Exposure Evaluation 2025-26
CLIENT PROFILE
A European fashion retailer operating across six countries, eighteen months into a live commerce programme that had produced disappointing revenue against the business case. The retailer had licensed a live selling platform and was broadcasting around six sessions a month using existing marketing staff as hosts. Returns from those sessions had not been separately measured at all.
STRATEGIC CHALLENGE
Marketing wanted a different platform, believing the tooling was the limitation. Finance questioned whether live commerce worked in European markets at all given the results. Nobody had compared the operating model against Asian operations running the same format successfully, or measured what proportion of live session revenue was surviving the return window.
MMA APPROACH
MMA compared the retailer's operating model against mature live commerce operations by session frequency, host development, merchandising and production, and measured net revenue after returns across eighteen months of sessions. We assessed whether the shortfall sat in tooling, operations or market conditions. The work drew on 47 expert interviews conducted in Q4 2025 with retailers, platforms and live commerce operators.
KEY FINDINGS
  1. Session frequency ran at 6 monthly against around 38 weekly at mature operations, so fixed studio and staff costs were spread across a tiny fraction of the output.
  2. Returns from the live sessions reached 38%, above the 31% category norm, and had never once been reported separately from general channel returns.
  3. Sessions hosted by one marketing employee with a genuine personal following converted roughly 4 times better than the rest (client-reported, unverified by MMA).
  4. The platform tooling was functionally comparable to alternatives, and changing it would not have addressed anything the programme was actually failing on.
CLIENT PROFILE
A European fashion retailer operating across six countries, eighteen months into a live commerce programme that had produced disappointing revenue against the business case. The retailer had licensed a live selling platform and was broadcasting around six sessions a month using existing marketing staff as hosts. Returns from those sessions had not been separately measured at all.
STRATEGIC CHALLENGE
Marketing wanted a different platform, believing the tooling was the limitation. Finance questioned whether live commerce worked in European markets at all given the results. Nobody had compared the operating model against Asian operations running the same format successfully, or measured what proportion of live session revenue was surviving the return window.
MMA APPROACH
MMA compared the retailer's operating model against mature live commerce operations by session frequency, host development, merchandising and production, and measured net revenue after returns across eighteen months of sessions. We assessed whether the shortfall sat in tooling, operations or market conditions. The work drew on 47 expert interviews conducted in Q4 2025 with retailers, platforms and live commerce operators.
KEY FINDINGS
  1. Session frequency ran at 6 monthly against around 38 weekly at mature operations, so fixed studio and staff costs were spread across a tiny fraction of the output.
  2. Returns from the live sessions reached 38%, above the 31% category norm, and had never once been reported separately from general channel returns.
  3. Sessions hosted by one marketing employee with a genuine personal following converted roughly 4 times better than the rest (client-reported, unverified by MMA).
  4. The platform tooling was functionally comparable to alternatives, and changing it would not have addressed anything the programme was actually failing on.
RECOMMENDED STRATEGY
Phase 1: Phase one: stop the platform replacement, since the tooling was never the limitation and switching would have consumed a quarter for nothing. Phase 2: Phase two: commit to a genuine weekly schedule or close the programme, because occasional broadcasting cannot recover fixed production cost. Phase 3: Phase three: develop the one host who converts and report live session revenue net of returns from the next session onward.
OUTCOME
The retailer kept the platform, moved to a weekly schedule and developed hosts internally (client-reported, unverified by MMA). Net revenue per session improved substantially once frequency rose and returns were priced in. Live commerce results are now reported net of returns alongside session frequency, which is the change that outlasted the engagement.

Frequently Asked Questions

Foundational context covering the market sizes, CAGR, scope, country, region and competition that inform every finding below. This section is provided to cover basics and most often pre-purchase conversations, answered from the MMA Primary Research Dataset.

What is the current size of the Social Commerce Market?

Enabling revenue reaches USD 25.70 billion in 2026, measured as what businesses earn from platforms, production, creator infrastructure and fulfilment. The 2025 base is USD 22.0 billion.

How large will the Social Commerce Market be by 2036?

Enabling revenue reaches USD 121.43 billion by 2036, an increase of USD 95.73 billion over the forecast period. That represents 4.72 times expansion from the 2026 base.

What is the CAGR for the Social Commerce Market 2026 to 2036?

The base case runs at 16.8% annually, with a bull case at 18.2% if live commerce finds a Western format that works and a bear case at 15.5% if return rates deter merchants.

Which segment is growing fastest?

Live commerce production and tooling grows at 25.2%, half again the market rate of 16.8%. Mature operations run around 38 studio sessions weekly, and conversion during a session reaches around 9%.

Who are the major companies in the Social Commerce Market?

ByteDance, Alibaba, Meta Platforms, Shopify and Kuaishou lead on enabling revenue, together holding 51%. Four of the five are platforms rather than software vendors, which shows where value accumulates.

Which country is growing fastest?

Indonesia leads at 27.6%, because commerce there developed on mobile with messaging and live video as native behaviours rather than as additions to desktop retail. Vietnam and India follow.

Report Segmentation Architecture

The full report scope spans multiple orthogonal segmentation dimensions, with cross-tabulated demand data provided for each dimension pair. Coverage extends further to regional breakdowns, trend trajectories, and the competitive detail needed to support segment-level decision-making.

By Enabling Revenue Class

  • Live Commerce Production And Tooling
  • Creator And Affiliate Commerce Infrastructure
  • Conversational And Messaging Commerce Platforms
  • Social Channel Fulfilment And Logistics Services
  • Social Storefront And Catalogue Software
  • Platform Commerce Take Rate Revenue

By End-Use Industry

  • Fashion And Apparel
  • Beauty And Personal Care
  • Consumer Electronics And Accessories
  • Food And Grocery
  • Collectables And Resale
  • Home And Lifestyle Goods

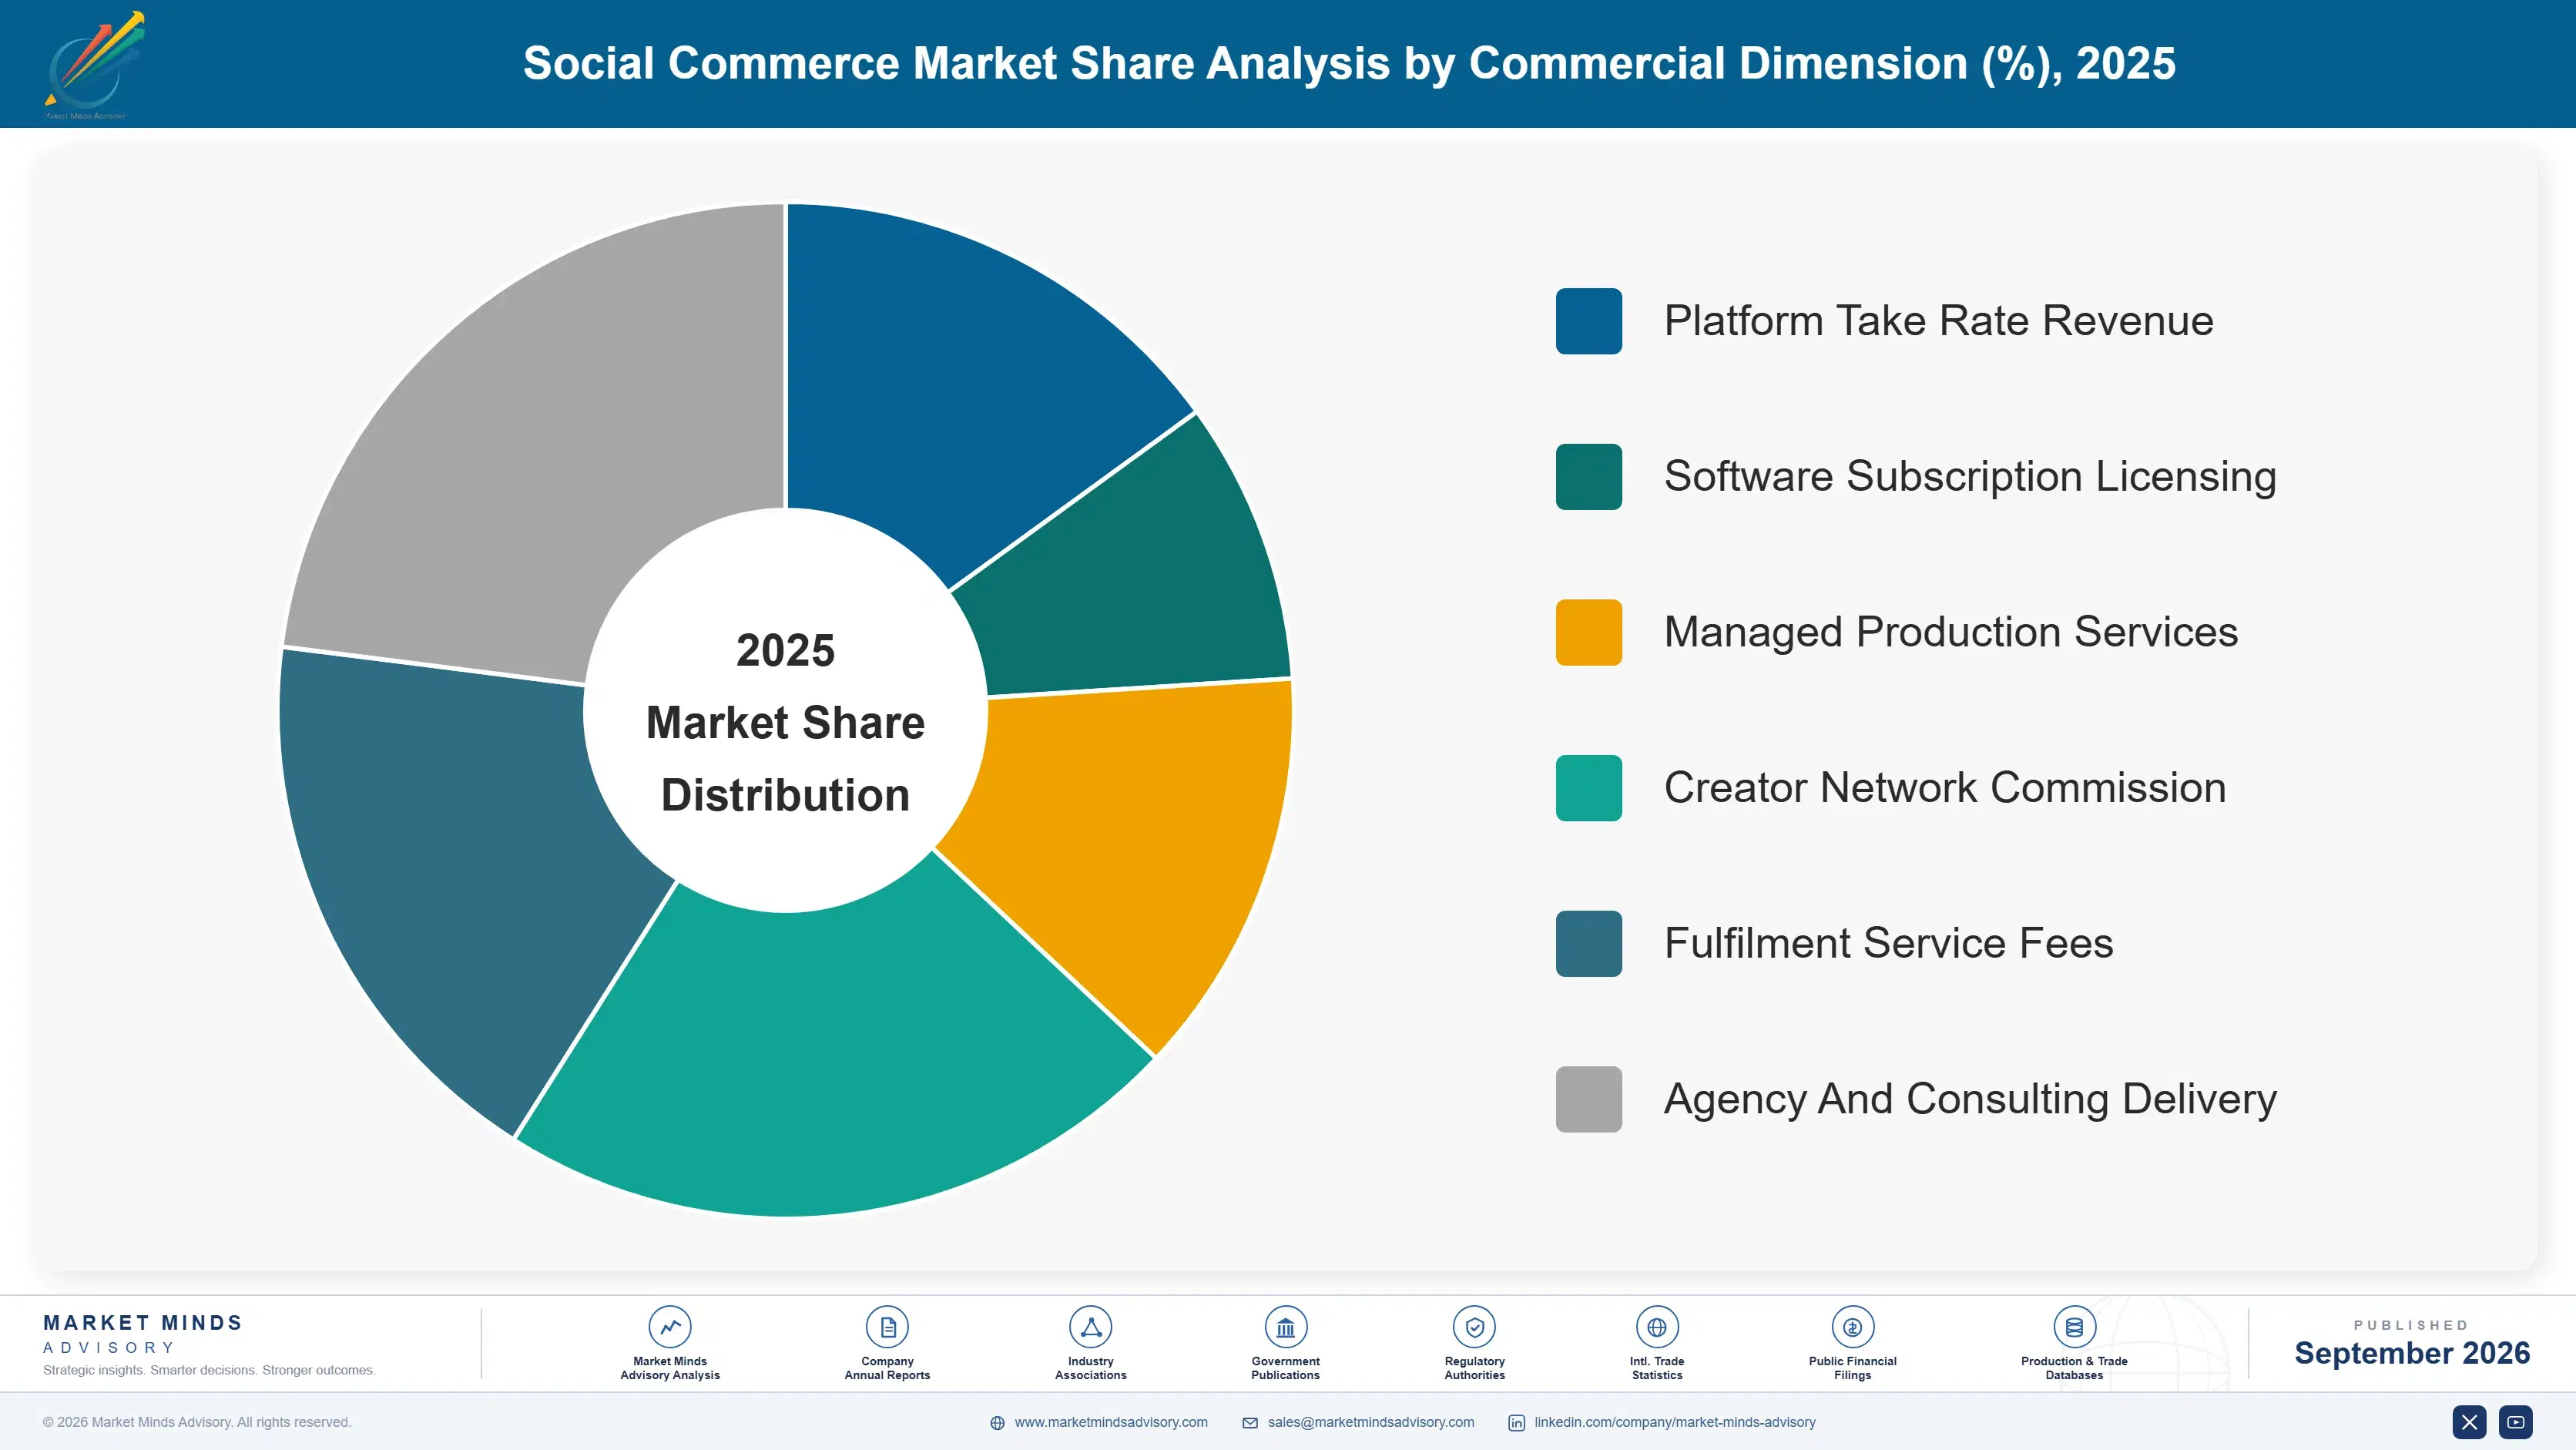
By Commercial Dimension

  • Platform Take Rate Revenue
  • Software Subscription Licensing
  • Managed Production Services
  • Creator Network Commission
  • Fulfilment Service Fees
  • Agency And Consulting Delivery

By Region

  • North America
  • Western Europe
  • East Asia
  • South Asia and Pacific
  • Latin America
  • Middle East and Africa
  • Eastern Europe

Scope, Methodology, and Coverage

Every figure in this report is reproducible from documented input assumptions. The scope below maps the historical period, the forecast horizon, the segmentation dimensions, and the countries covered, alongside the underlying primary and qualitative methodology.
Historical Period
2020 to 2025
Forecast Period
2026 to 2036
Base Year
2025 (USD billions; MMA Primary Research Dataset, September 2026)
Market Definition
This report covers revenue earned by businesses enabling commerce through social and messaging channels: live commerce production and tooling, creator and affiliate commerce infrastructure, platform commerce take rate revenue, social channel fulfilment and logistics services, conversational and messaging commerce platforms, and social storefront and catalogue software. It excludes gross merchandise value itself, advertising revenue, conventional e-commerce platforms without social mediation, influencer marketing without transaction, and general payment processing.
Quantitative Units
USD millions, enabling revenue basis rather than gross merchandise value; live sessions broadcast weekly; session conversion and return rates as percentages; platform take rates as percentages; creator commission share.
Segmentation Dimensions
Enabling revenue class; merchant product category; commercial revenue model; geography across seven regions.
Regions Covered
North America, Western Europe, East Asia, South Asia and Pacific, Latin America, Middle East and Africa, Eastern Europe
Countries Covered
China, Japan, South Korea, Taiwan, Indonesia, Vietnam, Thailand, India, Australia, United States, Canada, Mexico, Brazil, Colombia, United Kingdom, Germany, France, Poland, United Arab Emirates, Nigeria.
Key Companies Profiled
ByteDance, Alibaba, Meta Platforms, Shopify, Kuaishou, Amazon, Pinduoduo, Shopee, Coupang, Meesho, Whatnot, Bambuser, CommentSold, LTK, Firework.
Quantitative Methodology
Primary survey, n=3,800 respondents, Q4 2025, six countries; demand-side model with trade association cross-validation
Qualitative Methodology
47 expert interviews, Q4 2025; applied to validate demand model assumptions, identify emerging dynamics, and assess competitive positioning
Report Format
PDF and XLSX data workbook (Word format preview document)
Publisher
Market Minds Advisory
Report Code
MMA-2026-TEC-631
Published
September 2026
Contact
sales@marketmindsadvisory.com | www.marketmindsadvisory.com

Purchase the full Social Commerce Market Report (2026 to 2036).

This report sizes the global social commerce market from 2026 to 2036 by enabling revenue rather than gross merchandise value, across six revenue classes, six merchant categories and seven regions. It explains why Asian social commerce is mediated selling rather than shopping on social media, how a 31% live session return rate reverses reported transaction value, and why live commerce is a production business that retailers keep buying software for. Cost composition is sourced to company annual reports, with session utilisation analysed as the margin determinant. Regional analysis explains why East Asia holds 44% of enabling revenue.
Six enabling revenue classes sized through to 2036
Enabling revenue measured rather than gross merchandise value
Live production cost composition from company annual filings
Twenty named firms assessed on enabling revenue
Four revenue levers with quantified commercial impact
Anonymised European retailer live commerce engagement included fully

Built For The People Who Decide

From boardroom strategy to bench-side execution, this report is read cover-to-cover by leaders shaping the next decade of their industry, turning demand scenarios, market dynamics and valuation benchmarks into decisions.
CXOs/ Presidents/ VPs/ Managers
M&A and Corporate Development
Strategy Teams and R&D Heads
Procurement and Product Directors
Regulatory and Compliance Leaders
Investor Relations and Equity Analysts