Market Minds Advisory
Smart Water Metering Market

Smart Water Metering Market: Smart Water Metering Market. Advanced Metering Infrastructure Replacing Manual Meter Reading

Water utilities facing non-revenue water losses and drought-driven conservation mandates are replacing decades-old mechanical meters with two-way communicating sensors faster than utility budgets have historically allowed for infrastructure upgrades of this technical scale and pace.

Lead Analyst

Published

September 2026

Make Smarter Decisions with Customized Research Insights

Request a free sample report and evaluate market opportunities, growth trends, and competitive dynamics relevant to your business needs.

2025 MARKET VALUE$3.8BMarket Size 2025
2036 FORECAST VALUE$11.4BBase Case , 2026 to 2036
CAGR 2026 TO 203610.5 %Bull 11.8% / Bear 9.2%
INCREMENTAL OPPORTUNITY$7.2BNet 10- year value creation
EXPANSION MULTIPLE2.71x2036 value over 2026 base
Strategic Levers
M&A Pipeline
Regional Outlook
Country Rankings
Competitive Intelligence
Segmental Deep-dive
Call-Us : 91 93563 13602

Executive Snapshot and Market Trajectory.

Water utilities facing chronic non-revenue water losses and drought-driven conservation mandates are replacing decades-old mechanical meters with two-way communicating sensors faster than infrastructure budgets historically allowed, forcing rapid procurement cycles across municipal water utility systems nationwide across both large metropolitan utilities and smaller rural water districts alike.
Advanced metering infrastructure adopts fastest among utilities facing acute water scarcity and aging pipe networks, driven respectively by conservation regulation and leak detection economics, and North America leads deployment given its concentration of both specialized vendor headquarters and mature utility digitization budgets, with utilities increasingly consolidating meter reading, leak detection, and consumption analytics into single connected platforms rather than deploying isolated meter hardware alone across separate procurement cycles and separate vendor support contracts.
Competitive intensity now centers on data analytics depth and communication network reliability rather than raw meter accuracy alone, as Itron and Xylem defend leading platform positions while Kamstrup and Diehl Metering push aggressive ultrasonic technology adoption, and evolving water conservation regulation increasingly shapes which vendors clear municipal procurement review across increasingly water-stressed jurisdictions spanning the American Southwest, Southern Europe, and rapidly urbanizing Asian metropolitan regions.
Market Definition
The Smart Water Metering market covers connected water meters and supporting communication, data management, and analytics infrastructure that enable remote reading, leak detection, and consumption monitoring for water utilities and end customers. It excludes generic mechanical water meters without communication capability, wastewater treatment equipment, and irrigation control systems not integrated with metering data platforms.
Base Year Value
$3.8B in 2025 (MMA Primary Research Dataset, September 2026)
Forecast Period
2026 to 2036, eleven discrete annual values
CAGR
10.5% base case. Bull 11.8%. Bear 9.2%.
Fastest Growth Segment
AMI Smart Water Meters: 16.0% CAGR
Fastest Growth Country
India: 12.7% CAGR
Fastest Growth Region
South Asia and Pacific: 12.7% CAGR
Largest Region
North America: 28% of 2025 global value
Market Leaders
Itron, Xylem, Badger Meter, Diehl Metering, Kamstrup. Source: MMA Analysis based on company annual reports.
Primary Survey
n=3,800 procurement and R&D decision-makers, Q4 2025, six countries
Methodology
Demand-side build-up, cross-validated against public data, 47 expert interviews

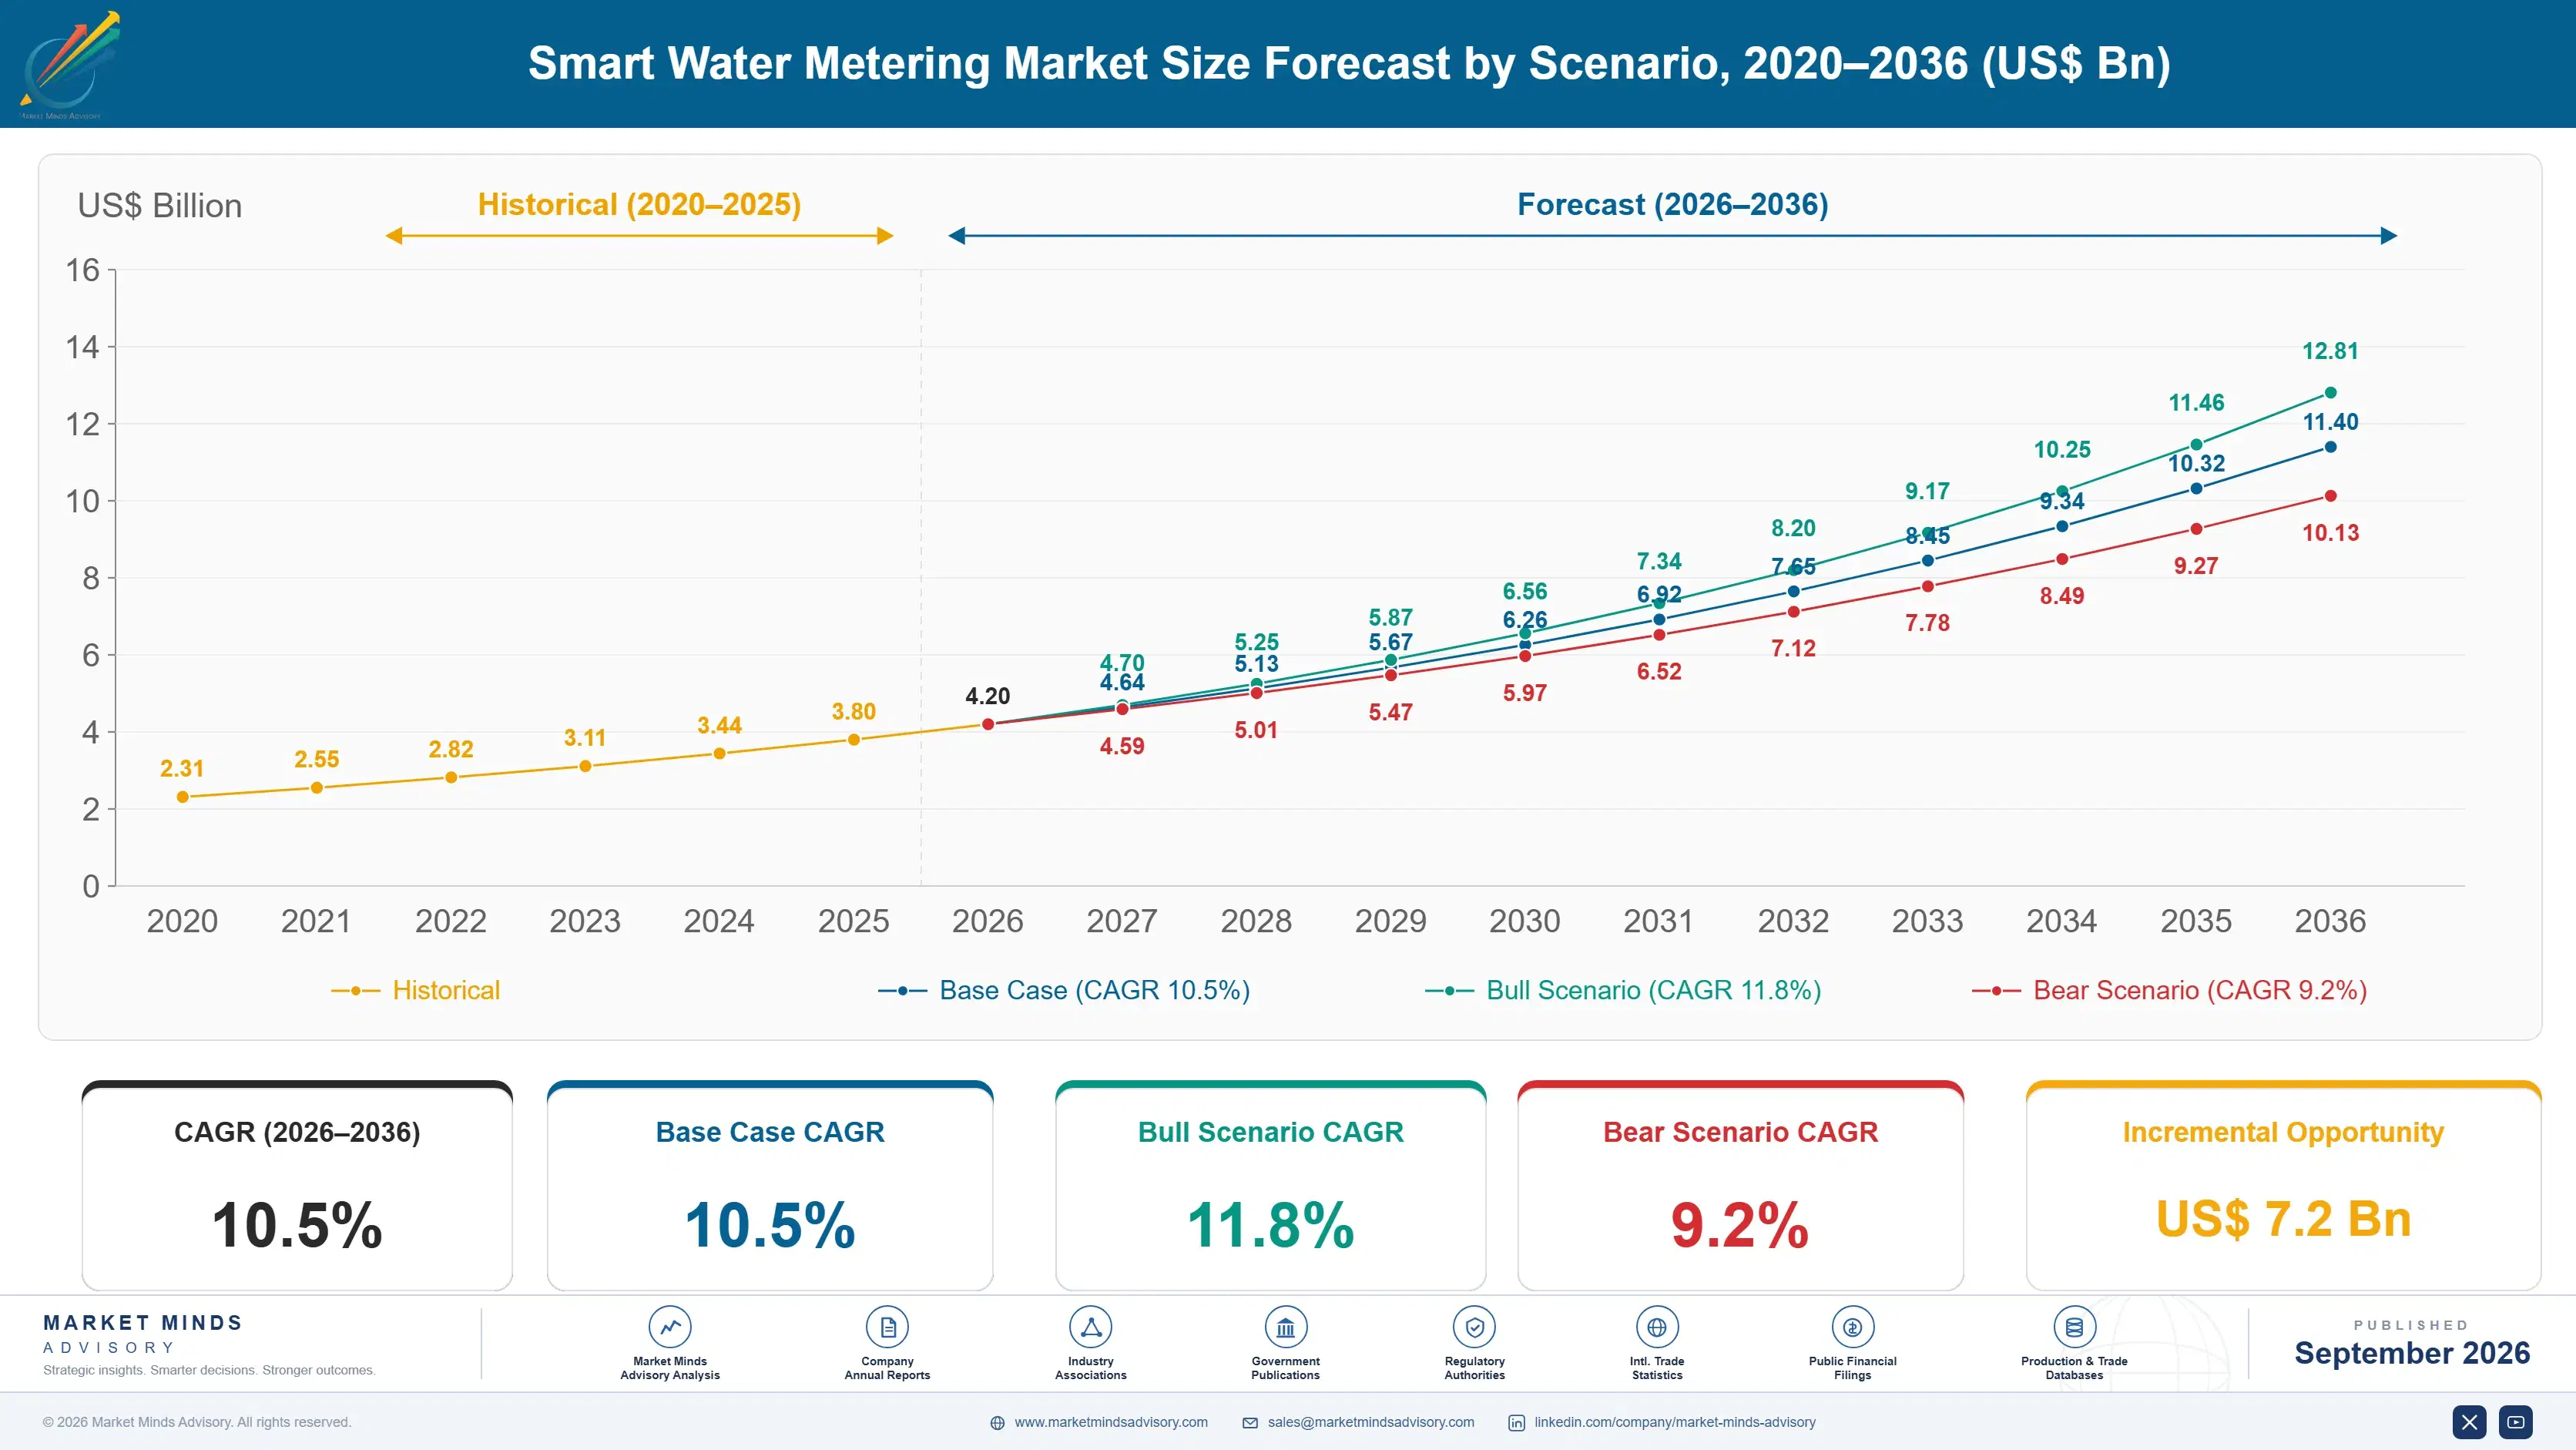
Smart Water Metering Market Forecast Scenarios

smart-water-meters-market-size-forecast-scenario-1789991392816
Between 2020 and 2025 smart water metering adoption moved from pilot deployments at forward-leaning utilities to a standard infrastructure replacement category, accelerated by drought conditions across multiple regions and a historical CAGR near nine and a half percent that reset how utilities budget for metering infrastructure spending overall, from a periodic capital project to a recurring modernization priority.
The base case assumes continued replacement of legacy mechanical and automatic meter reading systems as they reach end of service life, expanding water conservation regulation requiring granular consumption data, and rising utility willingness to fund advanced metering infrastructure through non-revenue water savings, three mechanisms that together sustain steady expansion through 2036 without requiring a fundamentally new metering technology to emerge beyond the conservation and revenue recovery case already driving most current program funding.
A bull scenario hinges on accelerated drought-driven conservation mandates pushing utilities toward comprehensive AMI rollout faster than currently planned. The bear case centers on municipal budget constraints delaying infrastructure replacement cycles as utilities prioritize other capital projects over metering upgrades, stretching replacement timelines by a year or more in cash-constrained municipalities facing competing infrastructure priorities.

Non-Revenue Water Losses Reshaping Utility Investment

Smart water metering sits at the intersection of aging municipal infrastructure and mounting conservation pressure, and the category has shifted decisively from a periodic meter replacement cycle toward continuous consumption monitoring that helps utilities recover revenue lost to leaks, theft, and metering inaccuracy across their entire distribution network, revenue that directly funds infrastructure maintenance elsewhere across an aging pipe network many utilities cannot otherwise afford to replace.
MARKET CONCENTRATIONCR5 48%top five vendors hold nearly half of spend
AVERAGE CONTRACT VALUE$2.4Mtypical municipal utility multi-year deployment contract commitment size
NON-REVENUE WATER LOSS RATE28%average share of treated water lost before billing occurs
AMI DEPLOYMENT SHARE44%share of installed meters now equipped with two-way communication
LEAK DETECTION ACCURACY92%average detection rate for pipe leaks using connected sensors
METER REPLACEMENT CYCLE LENGTH12 yrstypical service life before a meter requires replacement
Commercially the market behaves like recurring utility infrastructure software rather than a one-time hardware purchase: multi-year managed service contracts, expansion revenue from add-on analytics modules such as leak detection and demand forecasting, and renewal economics that favor incumbents once meter data flows into a utility's core billing and customer service systems permanently, and switching providers mid-cycle risks disrupting billing accuracy customers notice immediately.
Over the next decade, ultrasonic sensing technology, AI-driven leak prediction, and tightening water conservation regulation will separate vendors capable of delivering integrated hardware and analytics platforms from smaller players confined to basic mechanical meter manufacturing without a credible data platform story or the analytics talent needed to compete on outcomes rather than hardware specifications alone in a crowded field.
"A utility that cannot tell you where water is being lost is flying blind. The meter is just the sensor. The real product is knowing what to do with the data."
Director, Water Infrastructure and Utility Technology Practice · MMA IoT-Enabled Utility Metering And Analytics Platforms Practice · September 2026

Market Trends

Ultrasonic Metering Displaces Mechanical Measurement Technology

Ultrasonic water meters, which measure flow using sound wave transit time rather than moving mechanical parts, are rapidly displacing traditional mechanical meters because they maintain accuracy over a much longer service life without the wear-related degradation mechanical meters experience as internal components age. This shift has pushed utilities to favor ultrasonic technology for high-value commercial and industrial accounts where billing accuracy directly affects revenue, and manufacturers increasingly position ultrasonic as the default technology for new installations rather than a premium upgrade option. Vendors with mature ultrasonic manufacturing capability increasingly win the largest utility replacement contracts.
Market Impact: Adds mandate coverage for 60%

AI-Driven Leak Prediction Reduces Non-Revenue Water Losses

Vendors are embedding machine learning models that analyze consumption patterns across the distribution network to predict pipe leaks before they become visible surface failures, letting utilities dispatch repair crews proactively rather than reactively responding to customer complaints or visible water loss. This capability has become a primary differentiator in competitive utility procurement evaluations, since the financial case for AMI investment increasingly rests on leak-driven non-revenue water recovery rather than labor savings from eliminating manual meter reading routes. Vendors with the largest proprietary leak prediction datasets increasingly win the most valuable utility contracts.
Market Impact: Recovers investment cost within 7 years

Market Opportunities and Growth Drivers

Drought-Driven Conservation Mandates Force Utility Investment

State and regional water authorities across drought-affected regions increasingly mandate granular consumption reporting and conservation compliance verification that legacy manual meter reading cannot deliver at the frequency regulators now require. Water utilities failing to demonstrate credible conservation program results face regulatory penalties and public pressure that has made smart metering investment a defensive necessity rather than a discretionary technology upgrade, and similar conservation mandates are now spreading into water-stressed regions across Southern Europe and Australia, widening the addressable regulatory-driven demand considerably beyond the original American Southwest origin of this trend.
Market Impact: Extends rollout timelines to 5 years

Non-Revenue Water Recovery Justifies Rapid Payback Periods

Utilities deploying advanced metering infrastructure report non-revenue water loss reductions averaging 22 percent within the first two years, a return large enough that capital approval committees now fast-track metering projects ahead of other infrastructure priorities competing for the same limited municipal budget. The revenue recovered from previously unbilled or underbilled consumption often covers the entire technology investment within five to seven years, a payback period that clears most municipal capital allocation hurdles without requiring extended political debate over rate increases that elected officials would otherwise face from rate-sensitive residential and commercial constituents.
Market Impact: Adds 2 to 4 months delay

Market Restraints and Challenges

Municipal Budget Cycles Slow Large-Scale Deployment Timelines

Municipal utilities typically operate under multi-year capital budget cycles requiring public approval and bond financing, and a large-scale AMI rollout covering an entire service territory often requires several budget cycles to fully fund and execute rather than a single procurement decision. The root cause is that public utility governance structures prioritize deliberate, transparent capital allocation processes over speed, a reasonable approach for spending public funds but one that inherently slows technology adoption relative to private sector infrastructure investment. Vendors are mitigating this through phased deployment financing models that let utilities spread costs across multiple budget years.
Market Impact: Cuts meter measurement drift by 45%

Communication Network Interference Limits Rural Deployment

Rural and remote water utility territories often lack reliable cellular or dedicated radio network coverage needed for two-way meter communication, forcing utilities in these areas to either invest in dedicated network infrastructure or accept degraded data collection frequency compared to urban deployments. The root cause is that commercial telecommunications infrastructure investment prioritizes densely populated areas where subscriber revenue justifies network buildout costs, leaving rural utility service territories underserved. Vendors are mitigating this through low-power wide-area network technologies specifically designed for long-range rural connectivity at meaningfully lower infrastructure cost than cellular alternatives.
Market Impact: Cuts non-revenue water losses by 22%
4 additional market trends, 3 additional growth drivers, and 4 additional restraints and challenges are covered in the full report. Contact sales@marketmindsadvisory.com to access the complete intelligence.

Segment CAGR and Growth Architecture

Smart Water Metering is segmented by meter technology, the framework utilities and vendors use to evaluate procurement, since AMI and ultrasonic technologies carry fundamentally different capital cost and communication infrastructure requirements than legacy alternatives, and this technical lens maps directly onto how competing vendors structure their product lines and pricing across nearly every competing vendor in the field today.
smart-water-meters-market-market-share-analysis-1789991393353

AMI Smart Water Meters

AMI smart water meters use two-way communication networks to transmit consumption data continuously rather than requiring periodic manual or drive-by collection, enabling near-real-time leak detection and consumption analytics that one-way automatic meter reading systems cannot deliver. This segment is compounding fastest because it directly addresses the non-revenue water recovery case driving most current utility investment, and regulatory conservation mandates increasingly require the granular, frequent data only AMI can provide. Vendors increasingly differentiate on network reliability and data analytics depth rather than basic meter accuracy alone, and integration with utility billing systems has become a baseline expectation among serious municipal buyers evaluating competing vendors during any competitive procurement cycle spanning multiple vendor finalists.
CAGR 16.0%

Ultrasonic Smart Water Meters

Ultrasonic smart water meters measure flow using sound wave transit time rather than moving mechanical parts, delivering sustained accuracy over a much longer service life without the wear-related measurement drift mechanical meters experience as components age over years of continuous operation. Growth is accelerating as utilities recognize that mechanical meter accuracy degradation directly costs billing revenue, making ultrasonic technology's higher upfront cost easier to justify against long-run revenue protection. Commercial and industrial accounts lead adoption given the outsized billing impact of accuracy loss on high-volume water customers whose billing errors compound quickly at scale, and vendors increasingly bundle ultrasonic sensing as the default rather than a premium option reserved only for the largest accounts.
CAGR 14.0%
Full segment breakdown across 6 segments available in the complete report.

Regional Architecture and Country Demand Map

North America leads given its concentration of specialized vendor headquarters and drought-driven utility budgets, while South Asia and Pacific posts the fastest regional growth as urban water infrastructure programs scale rapidly across newly urbanizing municipalities, with Western Europe trailing mainly on slower utility procurement cycles.

North America

North America holds the largest share of smart water metering spend because it combines the headquarters of nearly every leading meter manufacturer with drought-driven conservation mandates concentrated across the American Southwest and California specifically. Municipal utility budgets here run larger per connection than in most other regions, supporting comprehensive AMI rollout rather than piecemeal automatic meter reading upgrades. Federal infrastructure funding programs add a substantial additional demand layer beyond utility-funded capital budgets specifically. Vendor headquarters concentration reinforces this lead: Itron and Badger Meter both maintain their primary manufacturing and engineering organizations here, giving North American utilities deeper reference relationships than most other regions currently enjoy from any comparably established meter manufacturer.
Share: 28% | CAGR: 11.3% (2026 to 2036)

Western Europe

Germany, France, and the United Kingdom account for the bulk of Western European smart water metering demand, led by utilities responding to strict European Union water efficiency directives that increasingly mandate granular consumption reporting across member states. Diehl Metering and Kamstrup both maintain substantial European manufacturing operations, giving regional utilities strong local supply relationships for ultrasonic and AMI technology alike. Growth trails North America and East Asia because most major Western European utilities already completed initial automatic meter reading deployment, shifting demand toward technology upgrades rather than first-time smart meter installation across most of the covered service territory. Vendor investment in local supply relationships keeps expanding steadily each product cycle.
Share: 23% | CAGR: 9.0% (2026 to 2036)
Regional intelligence for 5 additional markets available in the complete report: East Asia, South Asia and Pacific, Latin America, Middle East and Africa, Eastern Europe. Contact sales@marketmindsadvisory.com.
smart-water-meters-market-country-cagr-analysis-1789991393892

Where Meter Vendors Actually Expand Margin

Beyond base meter hardware pricing, four commercial mechanisms determine which smart water metering vendors convert utility modernization spend into durable margin expansion rather than competing purely on per-unit meter pricing against every rival, since basic meter accuracy has converged closely enough that it rarely decides a deal alone across the increasingly crowded competitive field overall.

Bundling Leak Detection Analytics Into Core Contracts

Vendors now fold AI-driven leak detection analytics directly into standard AMI contracts rather than selling non-revenue water software as a costly separate add-on, a shift that raises average contract value substantially once utility customers see measurable leak recovery results. Attach rates on leak detection modules have climbed past 50 percent among large utility renewals, and because the underlying models are shared across the customer base, incremental delivery cost stays low, converting most incremental revenue directly into margin for the vendor rather than into additional support cost for the vendor to absorb over time.
Market Impact: Raises average contract value by 28 percent overall

Expanding From Meter Hardware Into Managed Data Services

Early smart metering deployments sold hardware alone, leaving data hosting, analytics, and reporting outside the vendor relationship entirely. Vendors that extend into managed data services capture recurring revenue previously stuck with separate software vendors or in-house utility IT teams, and roughly 40 percent of utility accounts have not yet completed this expansion, leaving substantial unclaimed contract value on the table for account teams to pursue during upcoming renewal negotiations across their entire deployed meter base still running on hardware-only agreements without any managed data component layered on top of the base meter agreement.
Market Impact: Raises average contract value by roughly 35 percent

Monetizing Ultrasonic Upgrade Programs As A Premium Tier

Vendors increasingly package ultrasonic sensing technology as a premium tier priced above standard mechanical or basic AMI meters, targeting utilities that need superior long-run accuracy for high-value commercial and industrial accounts specifically. Early pricing data suggests these premium ultrasonic tiers carry list prices roughly 25 percent above standard meter units, and adoption concentrates among the largest utility accounts facing the most significant billing accuracy exposure across their commercial customer base and the widest range of account types requiring the highest measurement precision across their entire commercial and industrial customer portfolio simultaneously.
Market Impact: Prices ultrasonic tiers 25 percent above base overall

Capturing Installation And Field Service Revenue Upfront

Utilities deploying large-scale AMI programs increasingly purchase bundled installation and field maintenance services alongside core meter procurement rather than managing installation with in-house or third-party crews separately. These service engagements carry materially higher margins than standalone hardware sales once field service teams reach sufficient regional scale, and roughly 32 percent of large utility deployment contracts now include a bundled service component, up meaningfully from a smaller base only a few years earlier when installation remained a purely separate procurement line handled entirely by third-party field service contractors across each regional service territory.
Market Impact: Adds a 32 percent service attach rate overall

Who Controls the Margin Pool

Market concentration sits moderate at a CR5 of 48 percent, evaluated on trailing twelve-month platform and hardware revenue, leaving meaningful room between multi-utility leader Itron and water-specialist Xylem and a wide field of regional meter manufacturers still building comparable analytics depth and manufacturing scale to compete at the largest municipal utility accounts spanning multiple utility categories under one procurement decision at once.
Current competitive activity plays out across three fronts: aggressive AI-driven leak detection investment by leading vendors seeking to differentiate on non-revenue water outcomes, ultrasonic technology capacity expansion racing to meet rising utility demand, and price competition from regional manufacturers expanding aggressively in commodity mechanical meter segments where technical differentiation matters considerably less than raw production cost when procurement decisions come down to price alone.

Emerging pressure comes from software-only analytics vendors that partner with multiple meter manufacturers rather than building proprietary hardware themselves, a dynamic that could reshuffle rankings among mid-tier manufacturers lacking either Itron's multi-utility platform breadth or Xylem's deep water sector specialization built over many years of dedicated focus that newer entrants cannot easily replicate quickly regardless of available capital or engineering investment.
smart-water-meters-market-company-positioning-matrix-1789991394418

Competitive Moat and Risk Dimensions

ITRON

Moat: Broadest multi-utility platform breadth

Itron built its business selling connected metering infrastructure across water, gas, and electric utilities simultaneously, giving it cross-utility platform economies of scale and data analytics expertise that water-only competitors cannot easily replicate, particularly for municipalities managing multiple utility types under one integrated technology procurement decision.
ITRON

Risk: Public procurement decision delays

Itron's heavy reliance on municipal utility customers exposes it to slower, more deliberate public procurement cycles and budget approval processes than a comparable private sector infrastructure sale would face, meaningfully extending sales cycle length and creating revenue timing unpredictability that affects quarterly financial performance and complicates forward revenue guidance considerably.
XYLEM

Moat: Deep water sector specialization advantage

Xylem's Sensus metering business benefits from integration with the company's broader water technology portfolio spanning pumps, treatment, and analytics, letting it offer water utilities a genuinely comprehensive infrastructure relationship that multi-utility competitors selling generic connected metering platforms cannot credibly match at comparable depth without acquiring similarly broad water technology capability themselves.
XYLEM

Risk: Narrower cross-utility revenue diversification

Xylem's water-focused specialization limits its ability to cross-sell into gas and electric utility accounts the way multi-utility competitors like Itron can, constraining its addressable market relative to platform-agnostic rivals and concentrating revenue risk more heavily within water sector capital spending cycles specifically rather than spreading exposure across multiple utility categories.

Players Tracked

Prominent Players

Itron
Xylem
Badger Meter
Diehl Metering
Kamstrup

Other Key Players

Landis+Gyr
Honeywell (Elster)
Arad Group
Neptune Technology Group
Aclara Technologies
Zenner International
Master Meter
Mueller Water Products
Apator Group
B Meters
Suez
Veolia
Huawei
Cisco
Aeon Matrix

Recent Developments

FEBRUARY 2025

Itron Expands AMI Platform With New AI-Driven Leak Prediction Module

Itron added a new AI-driven leak prediction module to its advanced metering infrastructure platform, extending coverage beyond basic consumption monitoring into proactive pipe failure prediction, directly targeting the non-revenue water recovery trend already underway across the competitive utility technology field over the past year specifically.
Signal: Confirms leak prediction analytics has become a required capability across every serious vendor across the industry right now.
JUNE 2025

Xylem Completes Acquisition Of A Water Analytics Software Startup

Xylem acquired a smaller water analytics software vendor to accelerate consumption pattern analysis inside its Sensus metering platform, folding the acquired engineering team directly into its core product organization rather than operating the technology as a standalone product sold separately under a prior standalone pricing arrangement to existing customers.
Signal: Shows established water technology vendors racing to close analytics gaps against newer, more specialized entrants moving fast.
OCTOBER 2025

Kamstrup Deepens Ultrasonic Manufacturing Capacity With New Production Line

Kamstrup announced a new dedicated ultrasonic meter production line expansion aimed at meeting rising utility demand for higher-accuracy technology, directly addressing the capacity constraint that had limited ultrasonic adoption pace across several major utility markets in recent years across several major utility procurement cycles worldwide.
Signal: Shows manufacturers racing to close ultrasonic capacity gaps ahead of the next major procurement cycle arrives.

Semiconductor And Communication Module Costs

The dominant cost inputs for smart water meter manufacturers are semiconductor sensor components and cellular or radio communication modules, together running roughly 40 to 48 percent of cost of goods sold, sourced primarily from specialized semiconductor foundries alongside connectivity module suppliers serving the broader industrial IoT market that spans metering, agriculture, and asset tracking applications alike.
Semiconductor supply constraints in 2024 pushed lead times for specialized flow sensor chips out considerably, a disruption documented in company annual report supply chain disclosures, forcing manufacturers to redesign meter bills of materials around more widely available components or absorb higher costs passing through to utility customers during the affected renewal and expansion cycles across the most component-intensive product lines specifically, a squeeze that hit smaller vendors lacking scale to negotiate favorable terms hardest.

Manufacturers that own diversified component supplier relationships carry lower exposure to this volatility than smaller challengers dependent entirely on a single chip or module supplier, creating a durable cost gap between well-capitalized incumbents and smaller entrants reliant on single-vendor sourcing for their entire product line without the balance sheet room to build owned capacity at comparable scale.
smart-water-meters-market-cost-volatility-analysis-1789991394613

Diversifying Sensor Chip Sourcing Across Suppliers

Leading manufacturers now qualify flow sensor semiconductor components from two or more suppliers per product category rather than relying on a single source, reducing exposure to any one foundry's capacity constraints or pricing decisions during periods of tight supply. This diversification typically adds modest coordination overhead but pays off during future capacity or pricing disruptions.

Standardizing Communication Modules Across Product Lines

Vendors are standardizing communication module designs across multiple meter product lines, spreading integration and certification testing costs over a larger production volume and reducing per-unit component costs meaningfully as a result. These standardization efforts typically pay back within a year or two as production volume across the entire product family continues to scale further each year.

Locking In Multi-Year Component Supply Agreements

Manufacturers increasingly commit to multi-year minimum purchase agreements with component suppliers in exchange for locked-in pricing and priority allocation, trading flexibility for cost predictability that protects gross margin forecasts against sudden increases. These agreements typically span three to five years and are negotiated well ahead of expected demand across the largest strategic customer accounts.

Portfolio Architecture for Margin Defence

Vendor portfolios split across three margin tiers: commodity-adjacent mechanical and basic AMR meters priced to win volume among smaller utilities, certified full-AMI bundles carrying premium pricing for utilities demanding leak detection and analytics depth, and next-generation ultrasonic tiers commanding the steepest margins as differentiated capability rather than a simple meter-reading checkbox, and vendors increasingly design roadmaps around moving customers upward through this hierarchy over time rather than leaving them parked on entry-level licensing indefinitely.
Volume-tier deals win on price and simplicity of installation, while premium-tier deals win on analytics depth and communication network reliability, and the tension between the two shows up directly in how sales teams structure land-and-expand strategies across multi-year utility renewal cycles within regulated conservation frameworks, reshaping how account teams prioritize expansion conversations each renewal cycle.

High-value margin pools concentrate in the next-generation tier, where ultrasonic technology and AI-driven leak prediction modules command list prices well above the base AMR meter, and vendors capable of selling into that tier consistently outperform peers stuck competing on basic meter-reading functionality alone, a gap that widens as buyers grow comfortable paying for automated outcomes rather than raw meter accuracy alone.

Volume / Commodity-Adjacent Tier

Basic mechanical and automatic meter reading units sold to smaller utilities through regional distribution channels rather than direct enterprise sales, priced for volume over margin. Margins here trail the rest of the portfolio considerably.
Gross Margin: 22-30%

Premium / Certified Tier

Full-AMI bundles combining two-way communication, leak detection, and compliance reporting required by regulated municipal utility buyers, typically sold through direct enterprise sales channels. Renewal rates in this tier run consistently high across the customer base.
Gross Margin: 38-46%

Sustainability / Regulatory / Next-Generation Tier

Ultrasonic technology, AI-driven leak prediction, and multi-year managed service agreements sold to the largest municipal utility accounts, where account teams work closely with customer engineering leadership. These accounts anchor the vendor most durable long-term revenue.
Gross Margin: 48-56%
smart-water-meters-market-portfolio-architecture-1789991395124

High-value Sub-segments and Strategic Watch-out

AI Leak Prediction Add-On Suites

Highest-value, highest-growth pool as vendors price automated leak prediction and asset health scoring as standalone premium tiers above the core licensed platform, capturing disproportionate margin relative to incremental delivery cost. This makes it the single most important segment for margin-focused investors to track closely each fiscal quarter.
Gross Margin: 48-56%

Ultrasonic Technology Premium Upgrades

High-value, moderate-growth pool serving commercial and industrial accounts who need superior long-run accuracy beyond what standard AMR already provides, a gap that widens as billing accuracy grows more scrutinized each year. Vendors with mature manufacturing scale are best positioned to capture this expanding demand across new accounts.
Gross Margin: 40-48%

Core AMI Meter Deployment Contracts

Volume core of the market, generating the bulk of recurring revenue at moderate margin as the primary first-purchase most utilities make before expanding into ultrasonic and analytics modules over subsequent renewal cycles. Pricing here stays under steady competitive pressure from aggressive challenger discounting each renewal cycle.
Gross Margin: 26-34%

Commoditized Basic Mechanical Meter Products

Strategic watch-out as low-cost regional manufacturers offer basic mechanical meters without connectivity, threatening to commoditize the entry tier vendors rely on for new-logo growth among smaller municipal buyers. Vendors are responding by pushing differentiation higher up the value chain as quickly as possible to defend market position.
Gross Margin: 18-25%

Annuity Economics Of Utility Data Contracts

Smart water metering revenue behaves like an annuity once deployed: meter data flows become embedded into daily billing operations, switching costs rise with every year of accumulated consumption history tied to a specific vendor's platform, and renewal rates comfortably exceed those of most industrial component categories once a deployment clears its first full billing cycle without a major data or accuracy incident forcing a costly re-evaluation of the entire vendor relationship.
Adoption depth varies sharply by vertical. Large metropolitan utilities push deep multi-module deployments covering AMI, leak detection, and demand forecasting within the first contract year, while smaller rural water districts often start with basic automatic meter reading and expand gradually as budget and internal expertise allow over subsequent renewal cycles, a gap vendors actively work to close through account expansion programs.

Buyer profiles are shifting generationally too: utility managers who came up scheduling manual meter reading routes are giving way to a cohort raised on dashboard-driven operations, and this newer generation evaluates vendors on data integration quality and analytics depth rather than meter accuracy specification sheets alone, and they expect self-service reporting tools earlier buyer generations rarely demanded.
smart-water-meters-market-end-use-penetration-index-1789991395616

Where To Place Smart Metering Bets

These are among the four positions where our research anticipates prominent divergence between winners and laggards over the coming forecast period. Each is grounded in the demand model, the regulatory perimeter, and the announced capacity pipeline.
01 / VENDOR SELECTION DISCIPLINE

Prioritize analytics depth over raw meter accuracy alone

Buyers evaluating smart water metering vendors should weight demonstrated leak detection and analytics accuracy well above raw meter specification sheets, since the two vendors leading the market, Itron and Xylem, both compete primarily on data platform depth rather than any single hardware capability. Basic meter accuracy parity across serious vendors has become the norm rather than the exception. A vendor without proven analytics capability will lose municipal contracts regardless of how impressive its meter specifications look on paper during a procurement evaluation.
02 / CONTRACT STRUCTURING APPROACH

Negotiate managed data services at initial signature, not later

Utilities consistently pay a premium to add managed data services after initial contract signature rather than negotiating the full bundle upfront. Vendors price incremental services assuming reduced switching risk once the core meter platform is already embedded into daily billing operations. Procurement teams that anticipate future analytics needs during the first negotiation window capture meaningfully better pricing than those who return to the table each time a new regulatory requirement emerges months or years into the contract once budget finally becomes available.
03 / REGIONAL EXPANSION TIMING

Weight India and Gulf state deployments earlier than budget cycles suggest

South Asia and Pacific and Middle East regional demand is compounding faster than mature Western markets, driven respectively by national smart city programs and government-backed water conservation infrastructure funding. Vendors and enterprise buyers alike who treat these regions as an afterthought behind North American rollout plans risk ceding ground to competitors building local implementation capacity now. Early regional investment compounds through reference customers that later anchor broader account expansion across neighboring markets well ahead of slower-moving competitors entering the same region.
04 / COMPETITIVE POSITIONING WATCH

Monitor software-only analytics vendors as the next disruption vector

Software-only analytics vendors partnering with multiple meter manufacturers rather than building proprietary hardware represent the clearest long-run threat to vertically integrated incumbent pricing power. Established vendors should expect continued margin pressure at the analytics layer as this partner-based competitive model deepens over the coming several years. The strategic response is deepening proprietary leak prediction datasets where software-only entrants currently lack comparable field deployment scale and years of accumulated consumption data that took established incumbents considerable time and field experience to build properly.

Engagement Snapshot From the Field

A live engagement with an industry participant carrying material or product regulatory and market exposure ahead of a defining policy shift, showing how our research translates into a defensible multi-year portfolio strategy.
MARKET MINDS ADVISORY · CLIENT ENGAGEMENT SUMMARY
Smart Water Metering Producer Strategic Portfolio Review and Transition Roadmap 2026·Investment Scenario on Smart Water Metering Exposure Evaluation 2025-26
CLIENT PROFILE
The client is a regional water utility serving 320,000 residential and commercial connections across a drought-prone service territory, operating an automatic meter reading fleet that had not been meaningfully upgraded in nearly fifteen years despite escalating non-revenue water losses exceeding industry benchmarks considerably across nearly every service zone within the utility's broader operating territory overall.
STRATEGIC CHALLENGE
A state regulatory review flagged the utility's non-revenue water loss rate as a compliance concern, and the utility's board faced mounting political pressure to demonstrate conservation program results ahead of a scheduled rate case hearing. Leadership needed a full AMI transition plan finalized within ten months, ahead of the regulatory review deadline.
MMA APPROACH
MMA conducted a structured vendor evaluation benchmarking three leading AMI platforms against the utility's specific service territory characteristics, existing billing system integration requirements, and non-revenue water recovery targets. The engagement combined interviews with field operations staff, a total cost of ownership model spanning five contract years, and a phased rollout plan sequenced by highest-loss service zones first.
KEY FINDINGS
  1. Prioritizing the highest-loss 25 percent of the service territory first was projected to recover 60 percent of total non-revenue water losses within eighteen months.
  2. Existing billing system integration required custom middleware development that added an estimated six weeks to the original ten-month implementation timeline agreed upon at project kickoff.
  3. Two of the three evaluated vendors could not fully support the utility's specific state regulatory reporting formats without costly customization work spanning several additional months of effort.
  4. Field operations staff identified leak detection accuracy as the single highest-priority capability gap in the legacy AMR system currently in daily use.
CLIENT PROFILE
The client is a regional water utility serving 320,000 residential and commercial connections across a drought-prone service territory, operating an automatic meter reading fleet that had not been meaningfully upgraded in nearly fifteen years despite escalating non-revenue water losses exceeding industry benchmarks considerably across nearly every service zone within the utility's broader operating territory overall.
STRATEGIC CHALLENGE
A state regulatory review flagged the utility's non-revenue water loss rate as a compliance concern, and the utility's board faced mounting political pressure to demonstrate conservation program results ahead of a scheduled rate case hearing. Leadership needed a full AMI transition plan finalized within ten months, ahead of the regulatory review deadline.
MMA APPROACH
MMA conducted a structured vendor evaluation benchmarking three leading AMI platforms against the utility's specific service territory characteristics, existing billing system integration requirements, and non-revenue water recovery targets. The engagement combined interviews with field operations staff, a total cost of ownership model spanning five contract years, and a phased rollout plan sequenced by highest-loss service zones first.
KEY FINDINGS
  1. Prioritizing the highest-loss 25 percent of the service territory first was projected to recover 60 percent of total non-revenue water losses within eighteen months.
  2. Existing billing system integration required custom middleware development that added an estimated six weeks to the original ten-month implementation timeline agreed upon at project kickoff.
  3. Two of the three evaluated vendors could not fully support the utility's specific state regulatory reporting formats without costly customization work spanning several additional months of effort.
  4. Field operations staff identified leak detection accuracy as the single highest-priority capability gap in the legacy AMR system currently in daily use.
RECOMMENDED STRATEGY
Phase 1: Phase 1 (Months 1 to 3): Complete vendor selection and deploy AMI units across the highest-loss service zones identified during the initial assessment. Phase 2: Phase 2 (Months 4 to 8): Expand coverage across remaining residential and commercial zones, validating leak detection accuracy along the way. Phase 3: Phase 3 (Months 9 to 10): Complete territory-wide deployment and finalize regulatory compliance documentation for submission to the rate case hearing.
OUTCOME
The utility completed AMI deployment within the ten-month window, reporting a 34 percent reduction in non-revenue water losses against the legacy baseline (client-reported, unverified by MMA). The subsequent regulatory review closed the compliance concern without further findings, closing out the compliance concern entirely ahead of schedule.

Frequently Asked Questions

Foundational context covering the market sizes, CAGR, scope, country, region and competition that inform every finding below. This section is provided to cover basics and most often pre-purchase conversations, answered from the MMA Primary Research Dataset.

What is the current size of the Smart Water Metering Market?

The Smart Water Metering market was valued at $3.8 billion in 2025. It is projected to reach $4.2 billion in 2026 as drought-driven conservation mandates accelerate adoption.

How large will the Smart Water Metering Market be by 2036?

MMA projects the market will reach $11.4 billion by 2036, a 2.71-times expansion from 2026 levels. Growth is driven by non-revenue water recovery and ultrasonic technology adoption.

What is the CAGR for the Smart Water Metering Market 2026 to 2036?

The market is forecast to grow at a 10.5 percent CAGR between 2026 and 2036. Bull and bear scenarios range from 9.2 percent to 11.8 percent depending on regulatory trends.

Which segment is growing fastest?

AMI Smart Water Meters lead at a 16.0 percent CAGR, roughly 1.5 times the overall market rate. Demand is compounding as conservation mandates require granular consumption data.

Who are the major companies in the Smart Water Metering Market?

Itron, Xylem, Badger Meter, Diehl Metering, and Kamstrup lead the competitive field. Together these five vendors hold roughly 48 percent of the market on a platform revenue basis.

Which country is growing fastest?

India leads country-level growth at a 12.7 percent CAGR, driven by national smart city and water infrastructure programs. Australia follows closely on drought-driven conservation requirements.

Report Segmentation Architecture

The full report scope spans multiple orthogonal segmentation dimensions, with cross-tabulated demand data provided for each dimension pair. Coverage extends further to regional breakdowns, trend trajectories, and the competitive detail needed to support segment-level decision-making.

By Primary Market Dimension

  • AMI Smart Water Meters
  • Ultrasonic Smart Water Meters
  • Metering Data Management Software and Analytics
  • AMR Smart Water Meters
  • Electromagnetic Smart Water Meters
  • Mechanical Smart Water Meters with Communication Modules

By End-Use Industry

  • Municipal Water Utilities
  • Commercial and Industrial
  • Residential
  • Agricultural Irrigation Districts
  • Government and Public Sector

By Commercial Dimension

  • Direct Utility Sales Channel
  • Managed Service Provider Channel
  • Government Procurement
  • System Integrator Channel

By Region

  • North America
  • Western Europe
  • East Asia
  • South Asia and Pacific
  • Latin America
  • Middle East and Africa
  • Eastern Europe

Scope, Methodology, and Coverage

Every figure in this report is reproducible from documented input assumptions. The scope below maps the historical period, the forecast horizon, the segmentation dimensions, and the countries covered, alongside the underlying primary and qualitative methodology.
Historical Period
2020 to 2025
Forecast Period
2026 to 2036
Base Year
2025 (USD billions; MMA Primary Research Dataset, September 2026)
Market Definition
This report defines the Smart Water Metering market as connected water meters and supporting communication, data management, and analytics infrastructure that enable remote reading, leak detection, and consumption monitoring for water utilities and end customers. It excludes generic mechanical water meters without communication capability, wastewater treatment equipment, and irrigation control systems not integrated with metering data platforms.
Quantitative Units
USD billions (current prices); unit shipment volumes; year-over-year percentage growth; CAGR percentages
Segmentation Dimensions
By Meter Technology; By End-Use Industry; By Commercial Dimension; By Region
Regions Covered
North America, Western Europe, East Asia, South Asia and Pacific, Latin America, Middle East and Africa, Eastern Europe
Countries Covered
USA, China, Germany, France, UK, Japan, South Korea, India, Australia, Canada, Brazil, Mexico, Indonesia, Vietnam, Thailand, Malaysia, UAE, Saudi Arabia, South Africa, Nigeria, Turkey, Poland, Netherlands, Italy, Spain, Sweden, Switzerland, Argentina, Colombia, Singapore, and additional markets relevant to this sector
Key Companies Profiled
Itron, Xylem, Badger Meter, Diehl Metering, Kamstrup, Landis+Gyr, Honeywell (Elster), Arad Group, Neptune Technology Group, Aclara Technologies, Zenner International, Master Meter, Mueller Water Products, Apator Group, B Meters, Suez, Veolia, Huawei, Cisco, Aeon Matrix
Quantitative Methodology
Primary survey, n=3,800 respondents, Q4 2025, six countries; demand-side model with trade association cross-validation
Qualitative Methodology
47 expert interviews, Q4 2025; applied to validate demand model assumptions, identify emerging dynamics, and assess competitive positioning
Report Format
PDF and XLSX data workbook (Word format preview document)
Publisher
Market Minds Advisory
Report Code
MMA-2026-TEC-341
Published
September 2026
Contact
sales@marketmindsadvisory.com | www.marketmindsadvisory.com

Purchase the full Smart Water Metering Market Report (2026 to 2036).

The full Smart Water Metering Market report delivers comprehensive segment-level forecasts, competitive benchmarking across twenty profiled vendors, and detailed regional demand analysis spanning all seven world regions through 2036. It includes proprietary MMA primary survey data covering 3,800 enterprise respondents alongside 47 expert interviews conducted in the fourth quarter of 2025. The report also provides input cost analysis, revenue lever benchmarking, and a strategic verdict section designed to support vendor selection and investment decisions. Buyers gain access to portfolio tier margin economics and a detailed case study illustrating a real AMI modernization program.
Ten-year quantitative market forecasts by segment
Competitive benchmarking across twenty profiled vendors
Regional demand analysis across seven world regions
Primary survey data from 3,800 enterprise respondents
Expert interview insights from 47 qualitative interviews
Strategic verdict and revenue lever recommendations

Built For The People Who Decide

From boardroom strategy to bench-side execution, this report is read cover-to-cover by leaders shaping the next decade of their industry, turning demand scenarios, market dynamics and valuation benchmarks into decisions.
CXOs/ Presidents/ VPs/ Managers
M&A and Corporate Development
Strategy Teams and R&D Heads
Procurement and Product Directors
Regulatory and Compliance Leaders
Investor Relations and Equity Analysts