Market Minds Advisory
Smart Water Grid Market

Smart Water Grid Market: Non-Revenue Water as a Funded Infrastructure Mandate

Smart water grids are moving from pilot deployments to mandatory infrastructure as aging pipe networks lose large volumes to leaks, forcing utilities to fund sensor and analytics rollouts through rate cases rather than discretionary budgets.

Lead Analyst

David Horsley

Published

August 2026

Make Smarter Decisions with Customized Research Insights

Request a free sample report and evaluate market opportunities, growth trends, and competitive dynamics relevant to your business needs.

2025 MARKET VALUE$9.8BMarket Size 2025
2036 FORECAST VALUE$29.1BBase Case , 2026 to 2036
CAGR 2026 TO 203610.4 %Bull 11.6% / Bear 9.2%
INCREMENTAL OPPORTUNITY$18.3BNet 10- year value creation
EXPANSION MULTIPLE2.69x2036 value over 2026 base
Strategic Levers
M&A Pipeline
Regional Outlook
Country Rankings
Competitive Intelligence
Segmental Deep-dive
Call-Us : 91 93563 13602

Executive Snapshot and Market Trajectory

Utilities are done pilot-testing smart water technology. Regulators in multiple states and countries now let water utilities recover smart metering and leak-detection capital through rate cases, converting what was once a discretionary technology purchase into a funded infrastructure mandate tied directly to non-revenue water reduction targets.
Data analytics and software platforms are pulling the market forward fastest, as utilities move beyond raw sensor deployment toward systems that actually predict pipe failure and prioritize repair crews. East Asia now holds the largest share of global demand, driven by China's national water-loss reduction targets and sponge-city infrastructure programs, while South Asia grows fastest as India's urban utilities confront non-revenue water losses that in some cities exceed forty percent of treated supply.
Consolidation is proceeding through acquisitions of sensor and analytics specialists rather than mega-mergers, as meter manufacturers buy their way into software margins they cannot generate through hardware alone. Regulatory pressure compounds the shift: mandatory water-loss auditing standards in the European Union and expanding state-level non-revenue water reporting requirements in the United States are forcing utilities that once treated leak detection as optional into multi-year sensor deployment contracts.
Market Definition
The smart water grid market covers digital hardware, communication networks, and software used by water utilities to monitor, control, and optimize potable water distribution networks, including advanced metering infrastructure, SCADA systems, leak-detection sensors, water quality sensors, and analytics platforms. It includes both the capital equipment and the recurring software and data-service revenue tied to that equipment. Wastewater treatment plant automation, irrigation-specific systems, and bottled or point-of-use water treatment devices are excluded.
Base Year Value
$9.8B in 2025 (MMA Primary Research Dataset, August 2026)
Forecast Period
2026 to 2036, eleven discrete annual values
CAGR
10.4% base case. Bull 11.6%. Bear 9.2%.
Fastest Growth Segment
Data Analytics and Software Platforms: 13.5% CAGR
Fastest Growth Country
India: 15.2% CAGR
Fastest Growth Region
South Asia and Pacific: 12.5% CAGR
Largest Region
East Asia: 30% of 2025 global value
Market Leaders
Xylem Inc., Itron Inc., Badger Meter Inc., Mueller Water Products Inc., Siemens AG. Source: MMA Analysis based on company annual reports.
Primary Survey
n=3,800 procurement and R&D decision-makers, Q4 2025, six countries
Methodology
Demand-side build-up, cross-validated against public data, 47 expert interviews

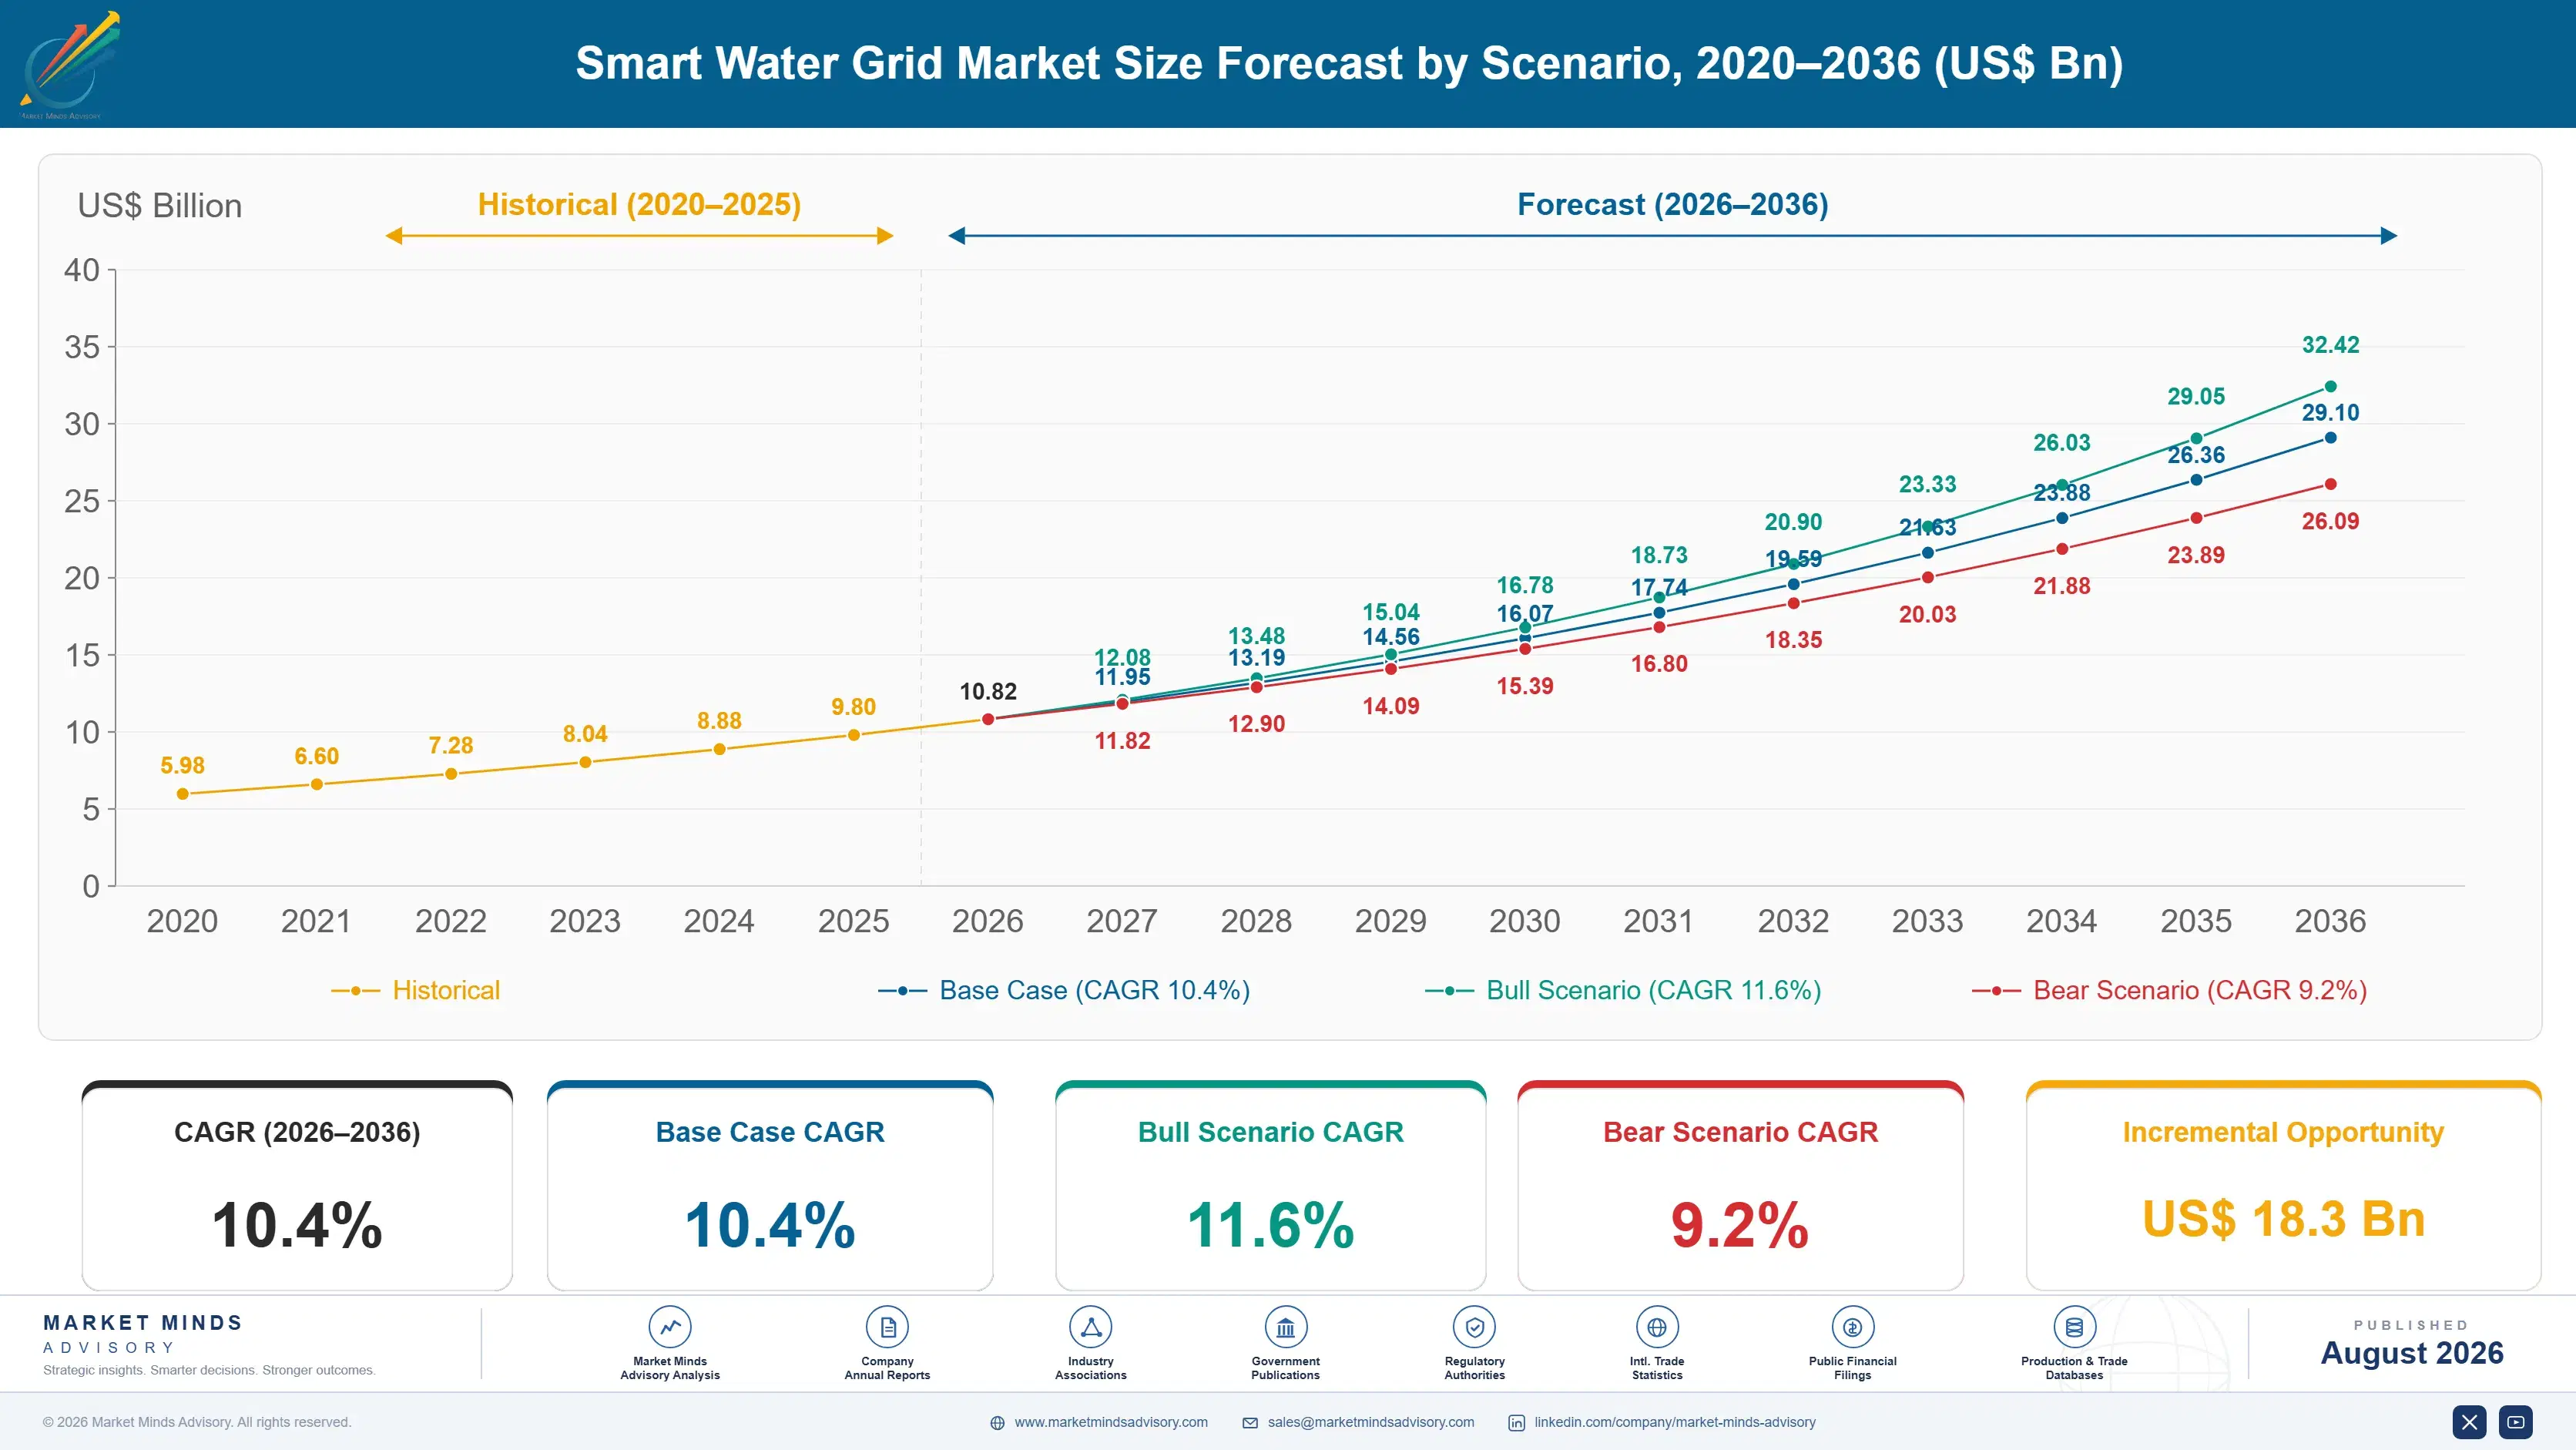
Smart Water Grid Market Forecast Scenarios

smart-water-grid-market-size-forecast-scenario-1787300357530
Between 2020 and 2025 the market grew at roughly 9.2% a year, propelled less by new-build demand than by utilities finally replacing analog meter fleets nearing end of life. Pandemic-era workforce shortages accelerated remote-read meter adoption, since utilities could no longer send crews door to door for manual reads. Municipal budget constraints slowed rollout pace in several regions even as the underlying case for digitization strengthened.
The base case carries the market to 29.1 billion dollars by 2036 on three mechanisms. First, water-scarce regions are mandating loss reduction targets that only continuous acoustic and pressure monitoring can achieve. Second, aging pipe networks across North America and Western Europe are reaching a replacement cycle that utilities pair with sensor infrastructure rather than pipe alone. Third, cloud analytics platforms let mid-sized utilities afford predictive maintenance once reserved for large utilities.
The bull case reaches roughly 12% annual growth if the EU finalizes mandatory water-loss reporting standards across all member states and China accelerates sponge-city sensor procurement further. The bear case falls near nine percent if municipal budget constraints and rate-case delays push utilities to defer sensor rollouts in favor of more visible, politically popular infrastructure spending instead.

Where Non-Revenue Water Becomes a Funded Mandate

Smart water grids used to mean a pilot project in a mid-sized city; now they are becoming a compliance requirement written into water-loss reduction mandates. Every acoustic sensor, pressure logger, and smart meter installed feeds into a system that tells a utility exactly where treated water is disappearing before it reaches a paying customer. That visibility, not the hardware itself, is what utilities are actually purchasing.
MARKET CONCENTRATION (CR5)38%Top five vendors hold a little over one third
AVERAGE SELLING PRICEUSD 62 per meter unitBlended price across residential and commercial meter classes
TOP PRODUCING COUNTRY SHAREChina, 21% of global shipmentsLargest single national source of smart meter volume
NON-REVENUE WATER RATE28% average across covered utilitiesShare of treated water lost before reaching customers
TRADE INTENSITY33% cross-borderAbout a third of hardware volume crosses a border
INSTALLED BASE PENETRATION46% of utility connectionsNearly half of connections already carry a smart meter
Commercially the market behaves like a slow-moving infrastructure business wearing a software label. Hardware still generates the bulk of revenue today, but recurring data-service and analytics subscription revenue is growing faster than hardware sales and carries far higher margins. Utilities rarely switch platform vendors mid-deployment, since a communication network and meter fleet installed on one protocol locks in that vendor's software for a decade or more.
The next decade turns on three forces: tightening non-revenue water regulation in the EU and parts of Asia, the replacement cycle for pipe and meter infrastructure installed decades ago, and cloud analytics finally making predictive capability affordable for utilities too small to build it themselves. Vendors positioned across all three will set the pace.
"Utilities didn't wake up wanting smart meters, they woke up needing to explain forty percent water loss to a regulator. The technology follows the accountability, not the other way around."
Director, Water Infrastructure and Utility Technology Practice · MMA Technology

Market Trends

EU Water Loss Regulation Forces Sensor Adoption

The EU's revised Drinking Water Directive and national transpositions now require member states to report non-revenue water performance and set reduction targets for utilities exceeding defined leakage thresholds, mandating continuous monitoring infrastructure that manual leak surveys cannot deliver. Utilities in Italy, Romania, and Bulgaria, which carry some of the bloc's highest leakage rates, face the sharpest compliance gap and are procuring acoustic sensor networks at a pace that outstrips domestic vendor capacity. The regulation converts a previously discretionary purchase into a compliance line item that utility boards can no longer defer without regulatory penalty exposure.
Market Impact: Pulls capital spending forward 5 years
Cloud Analytics Platforms Reach Mid-Sized Utilities

Cloud-hosted analytics platforms that once required a large utility's dedicated data science team are now sold as subscription software that mid-sized and small utilities can deploy without hiring specialized staff of their own. Vendors including Xylem and Itron have restructured pricing around per-connection monthly fees rather than large upfront licenses, lowering the adoption barrier for utilities serving under 100,000 connections, which make up the majority of the global utility count. That shift is pulling analytics revenue away from custom-built systems at large utilities and toward standardized platforms serving thousands of smaller customers instead.
Market Impact: Recovers water at 60% lower cost

Market Opportunities and Growth Drivers

Aging Pipe Networks Reach Simultaneous Replacement Age

Much of the pipe network across North America and Western Europe was installed between 1950 and 1980 and is now reaching the end of its designed service life at the same time across entire utility service areas, rather than in the gradual, staggered pattern utilities historically budgeted for. Replacing that pipe without also installing sensors and communication infrastructure means digging the same street twice within a decade, a cost utilities are unwilling to accept. Capital planning teams are bundling meter and sensor deployment directly into pipe replacement programs, pulling smart infrastructure spending forward years ahead of its own replacement schedule.
Market Impact: Raises switching cost 3 to 5x

Water Scarcity Pushes Utilities Toward Loss Reduction

Chronic water scarcity across the American Southwest, southern Europe, and northern China is pushing utilities to treat non-revenue water reduction as a supply-expansion strategy rather than a maintenance line item, since recovered leaked water is cheaper than any new source utilities could develop. California and Arizona utilities have adopted specific loss-reduction targets tied to drought contingency planning, and several have funded sensor deployment through the same capital programs used for desalination projects. That framing changes the internal budget conversation: leak detection now competes for capital against new supply on a genuine cost-per-gallon-saved basis.
Market Impact: Delays rollout 2 to 4 years

Market Restraints and Challenges

Legacy Communication Protocols Fragment Vendor Interoperability

Utilities that deployed first-generation fixed-network meter communication systems a decade ago are often locked into a single vendor's proprietary radio protocol, since meters, data collectors, and head-end software from different vendors frequently cannot interoperate without expensive gateway hardware. The root cause is that early smart-water standards bodies never converged on a single protocol the way electricity smart-grid standards eventually did, leaving the market fragmented across at least four incompatible radio technologies. That fragmentation raises switching costs so high that utilities often stay with an underperforming vendor. Some are mitigating the risk by specifying open, standards-based protocols in new contracts.
Market Impact: Adds mandatory reporting for 27 states

Municipal Budget Cycles Delay Sensor Procurement

Municipal and public utility capital budgets typically run on multi-year cycles requiring council or board approval, and smart water infrastructure competes directly against more visible, politically popular projects such as new treatment plants or road repaving for the same limited allocation. The root cause is that leak reduction delivers savings that are diffuse and hard for elected officials to point to, unlike a ribbon-cutting at a new facility. That dynamic delays rollouts well beyond vendor lead times in many municipalities. Some vendors now structure financing as an operating expense tied to guaranteed water-loss savings, avoiding the capital budget process entirely.
Market Impact: Cuts analytics adoption cost 45%
3 additional market trends, 3 additional growth drivers, and 4 additional restraints and challenges are covered in the full report. Contact sales@marketmindsadvisory.com to access the complete intelligence.

Segment CAGR and Growth Architecture

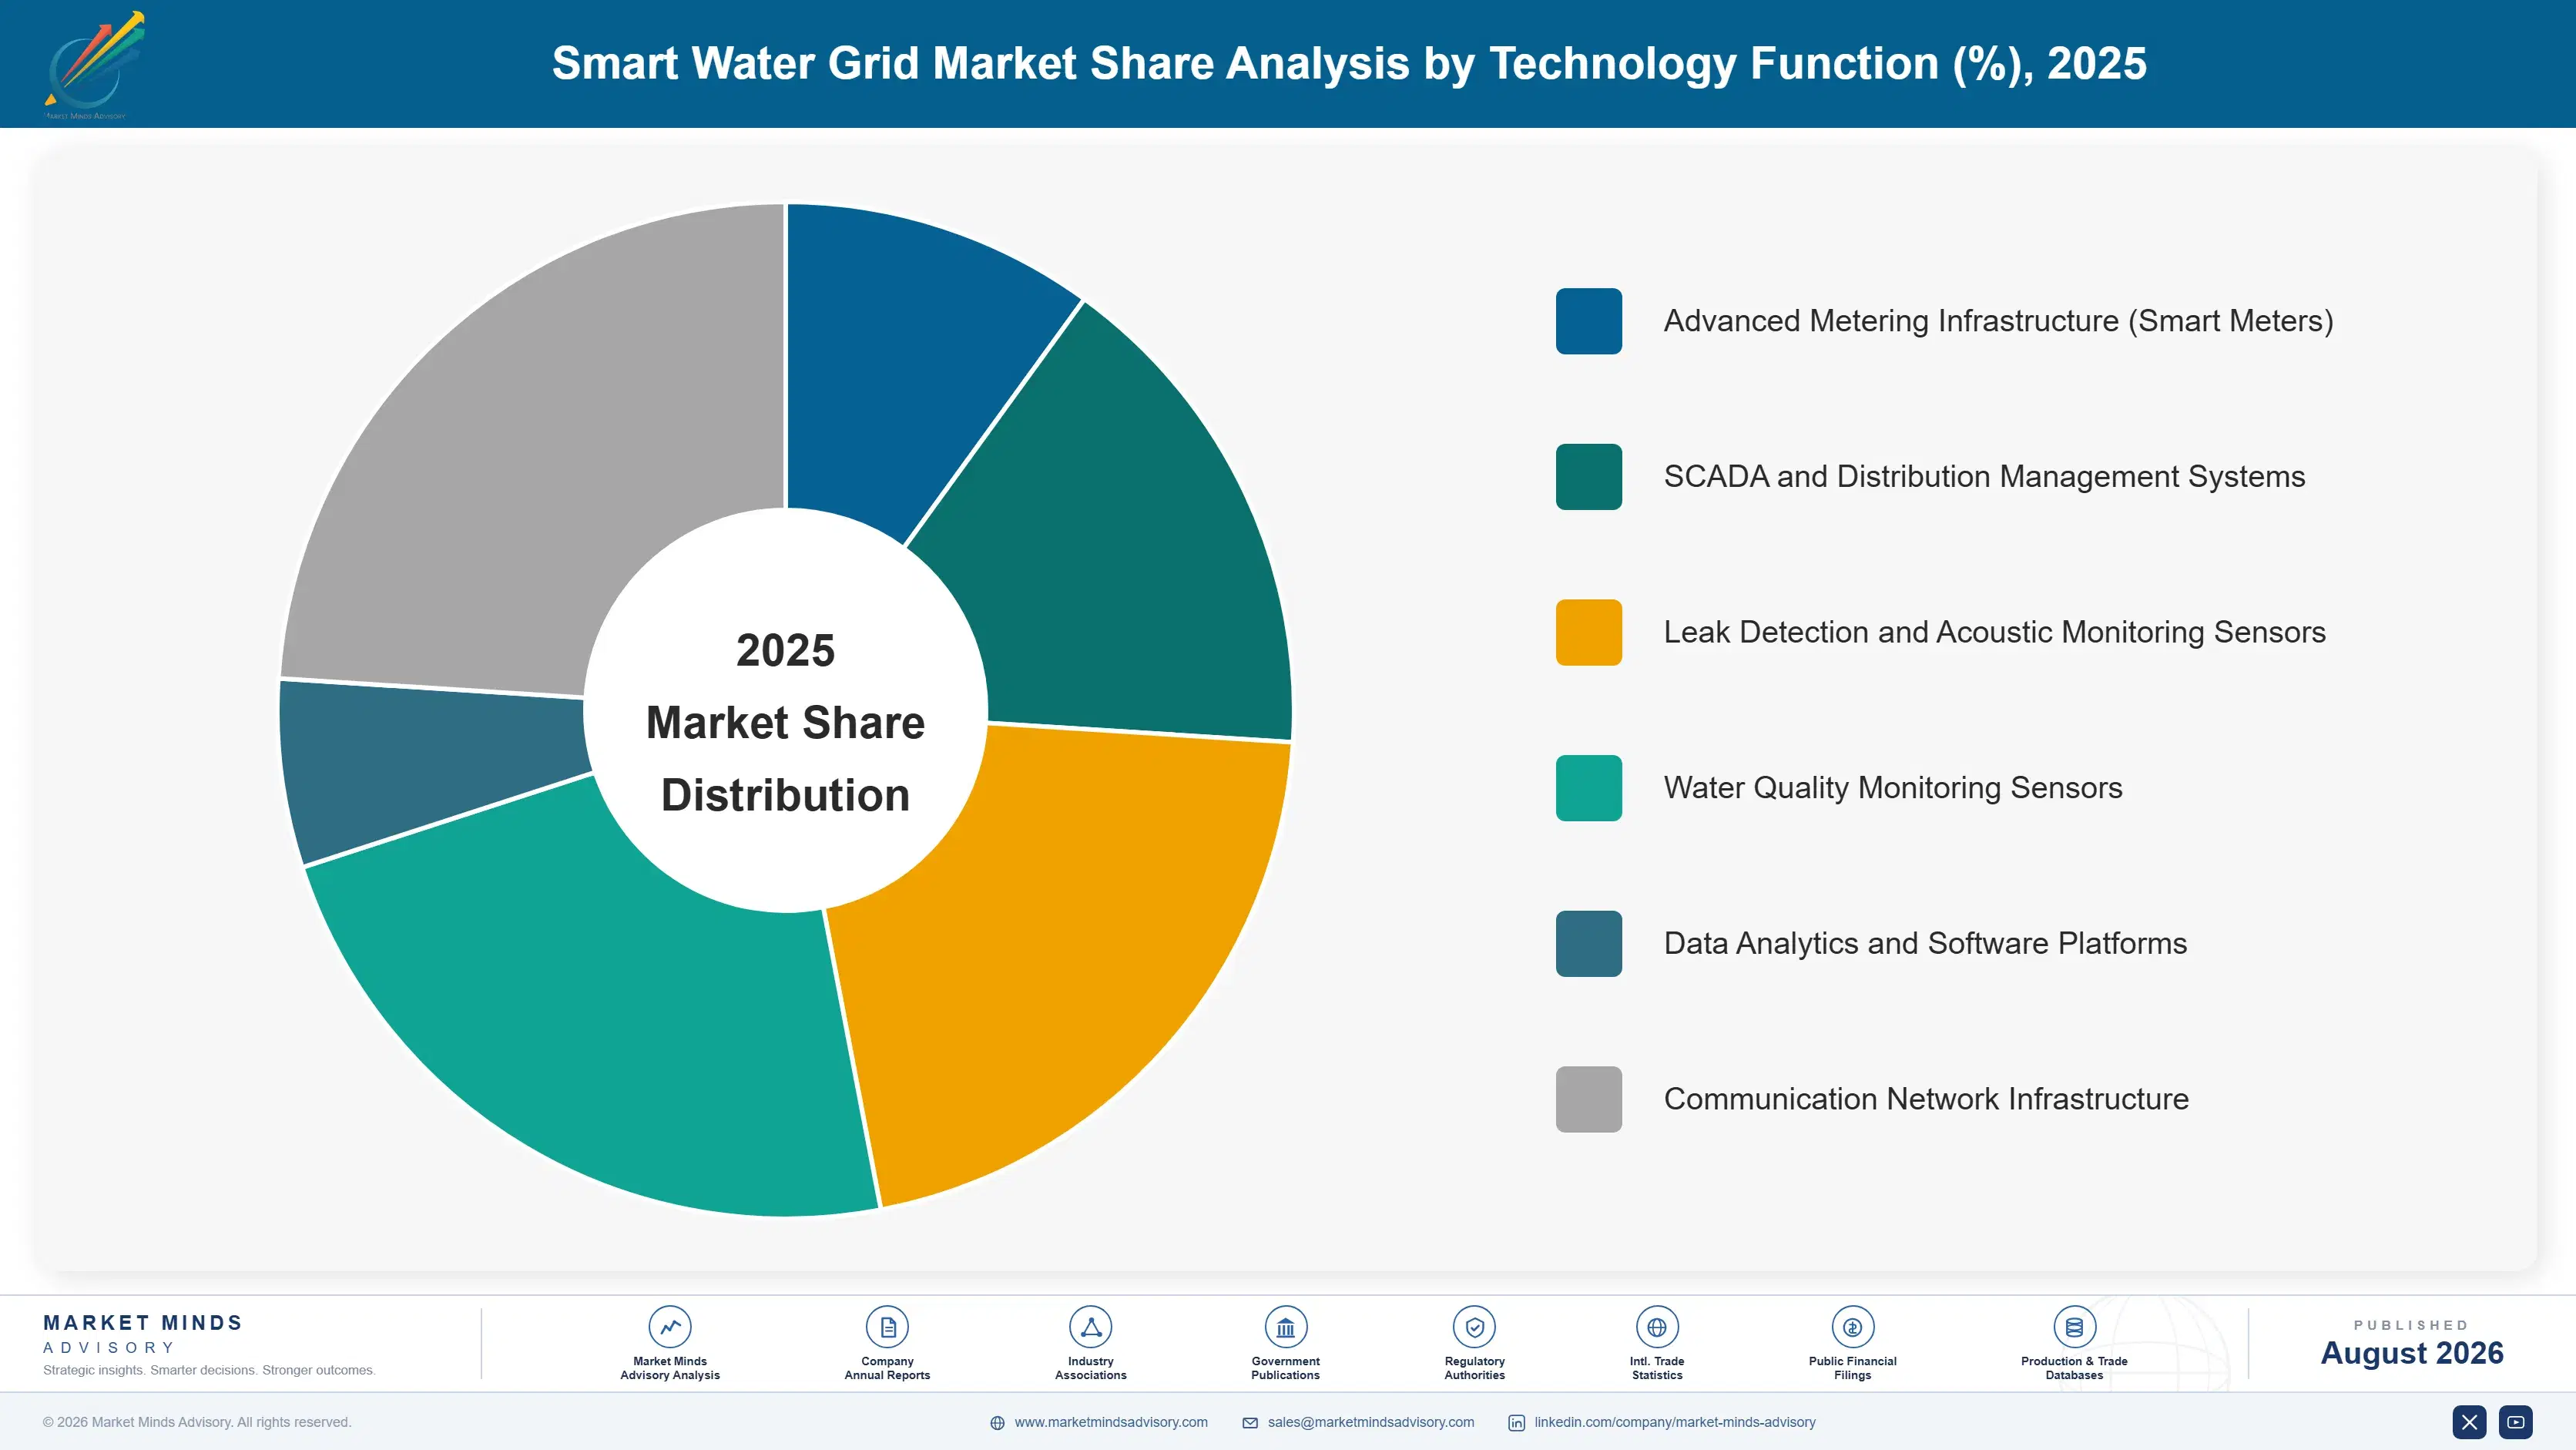
Segmentation follows technology function, a single systems-architecture logic that groups components by the role they play in sensing, communicating, or analyzing water network data rather than by end customer. Each function carries its own vendor landscape, procurement cycle, and margin profile, so commercial position tracks the technology layer rather than the utility that eventually buys it.
smart-water-grid-market-market-share-analysis-1787300358062

Data Analytics and Software Platforms

Data analytics and software platforms grow fastest at 13.5%, about 1.30 times the overall market rate, as utilities shift spending from raw sensor deployment toward systems that turn sensor data into prioritized repair orders and capital planning inputs. Hardware alone tells a utility a leak exists somewhere in a district; analytics software tells a crew which of a thousand possible pipe segments to dig up first, the capability utilities need to convert sensor investment into measurable water savings. Cloud-hosted, subscription-priced platforms have opened this capability to utilities that could never have afforded a custom-built system, and vendors including Xylem, Itron, and specialized analytics startups compete hardest for this layer precisely because software margins run well above hardware margins on the same sensor data.
CAGR 13.5%

Leak Detection and Acoustic Monitoring Sensors

Leak detection and acoustic monitoring sensors grow second-fastest at 12.2%, driven directly by non-revenue water reduction mandates that require continuous rather than periodic leak surveying. Acoustic loggers, correlators, and satellite-based leak detection services let utilities monitor entire pipe networks continuously rather than sending survey crews out on multi-year rotation schedules that miss leaks forming between visits. Regulatory deadlines in the EU and drought-driven mandates across the American Southwest are compressing utility deployment timelines from a decade to a few years in some jurisdictions. The segment sits upstream of the analytics layer, since acoustic data is a primary input predictive maintenance software depends on, giving hardware vendors a natural path to bundle software revenue.
CAGR 12.2%
Full segment breakdown across 6 segments available in the complete report.

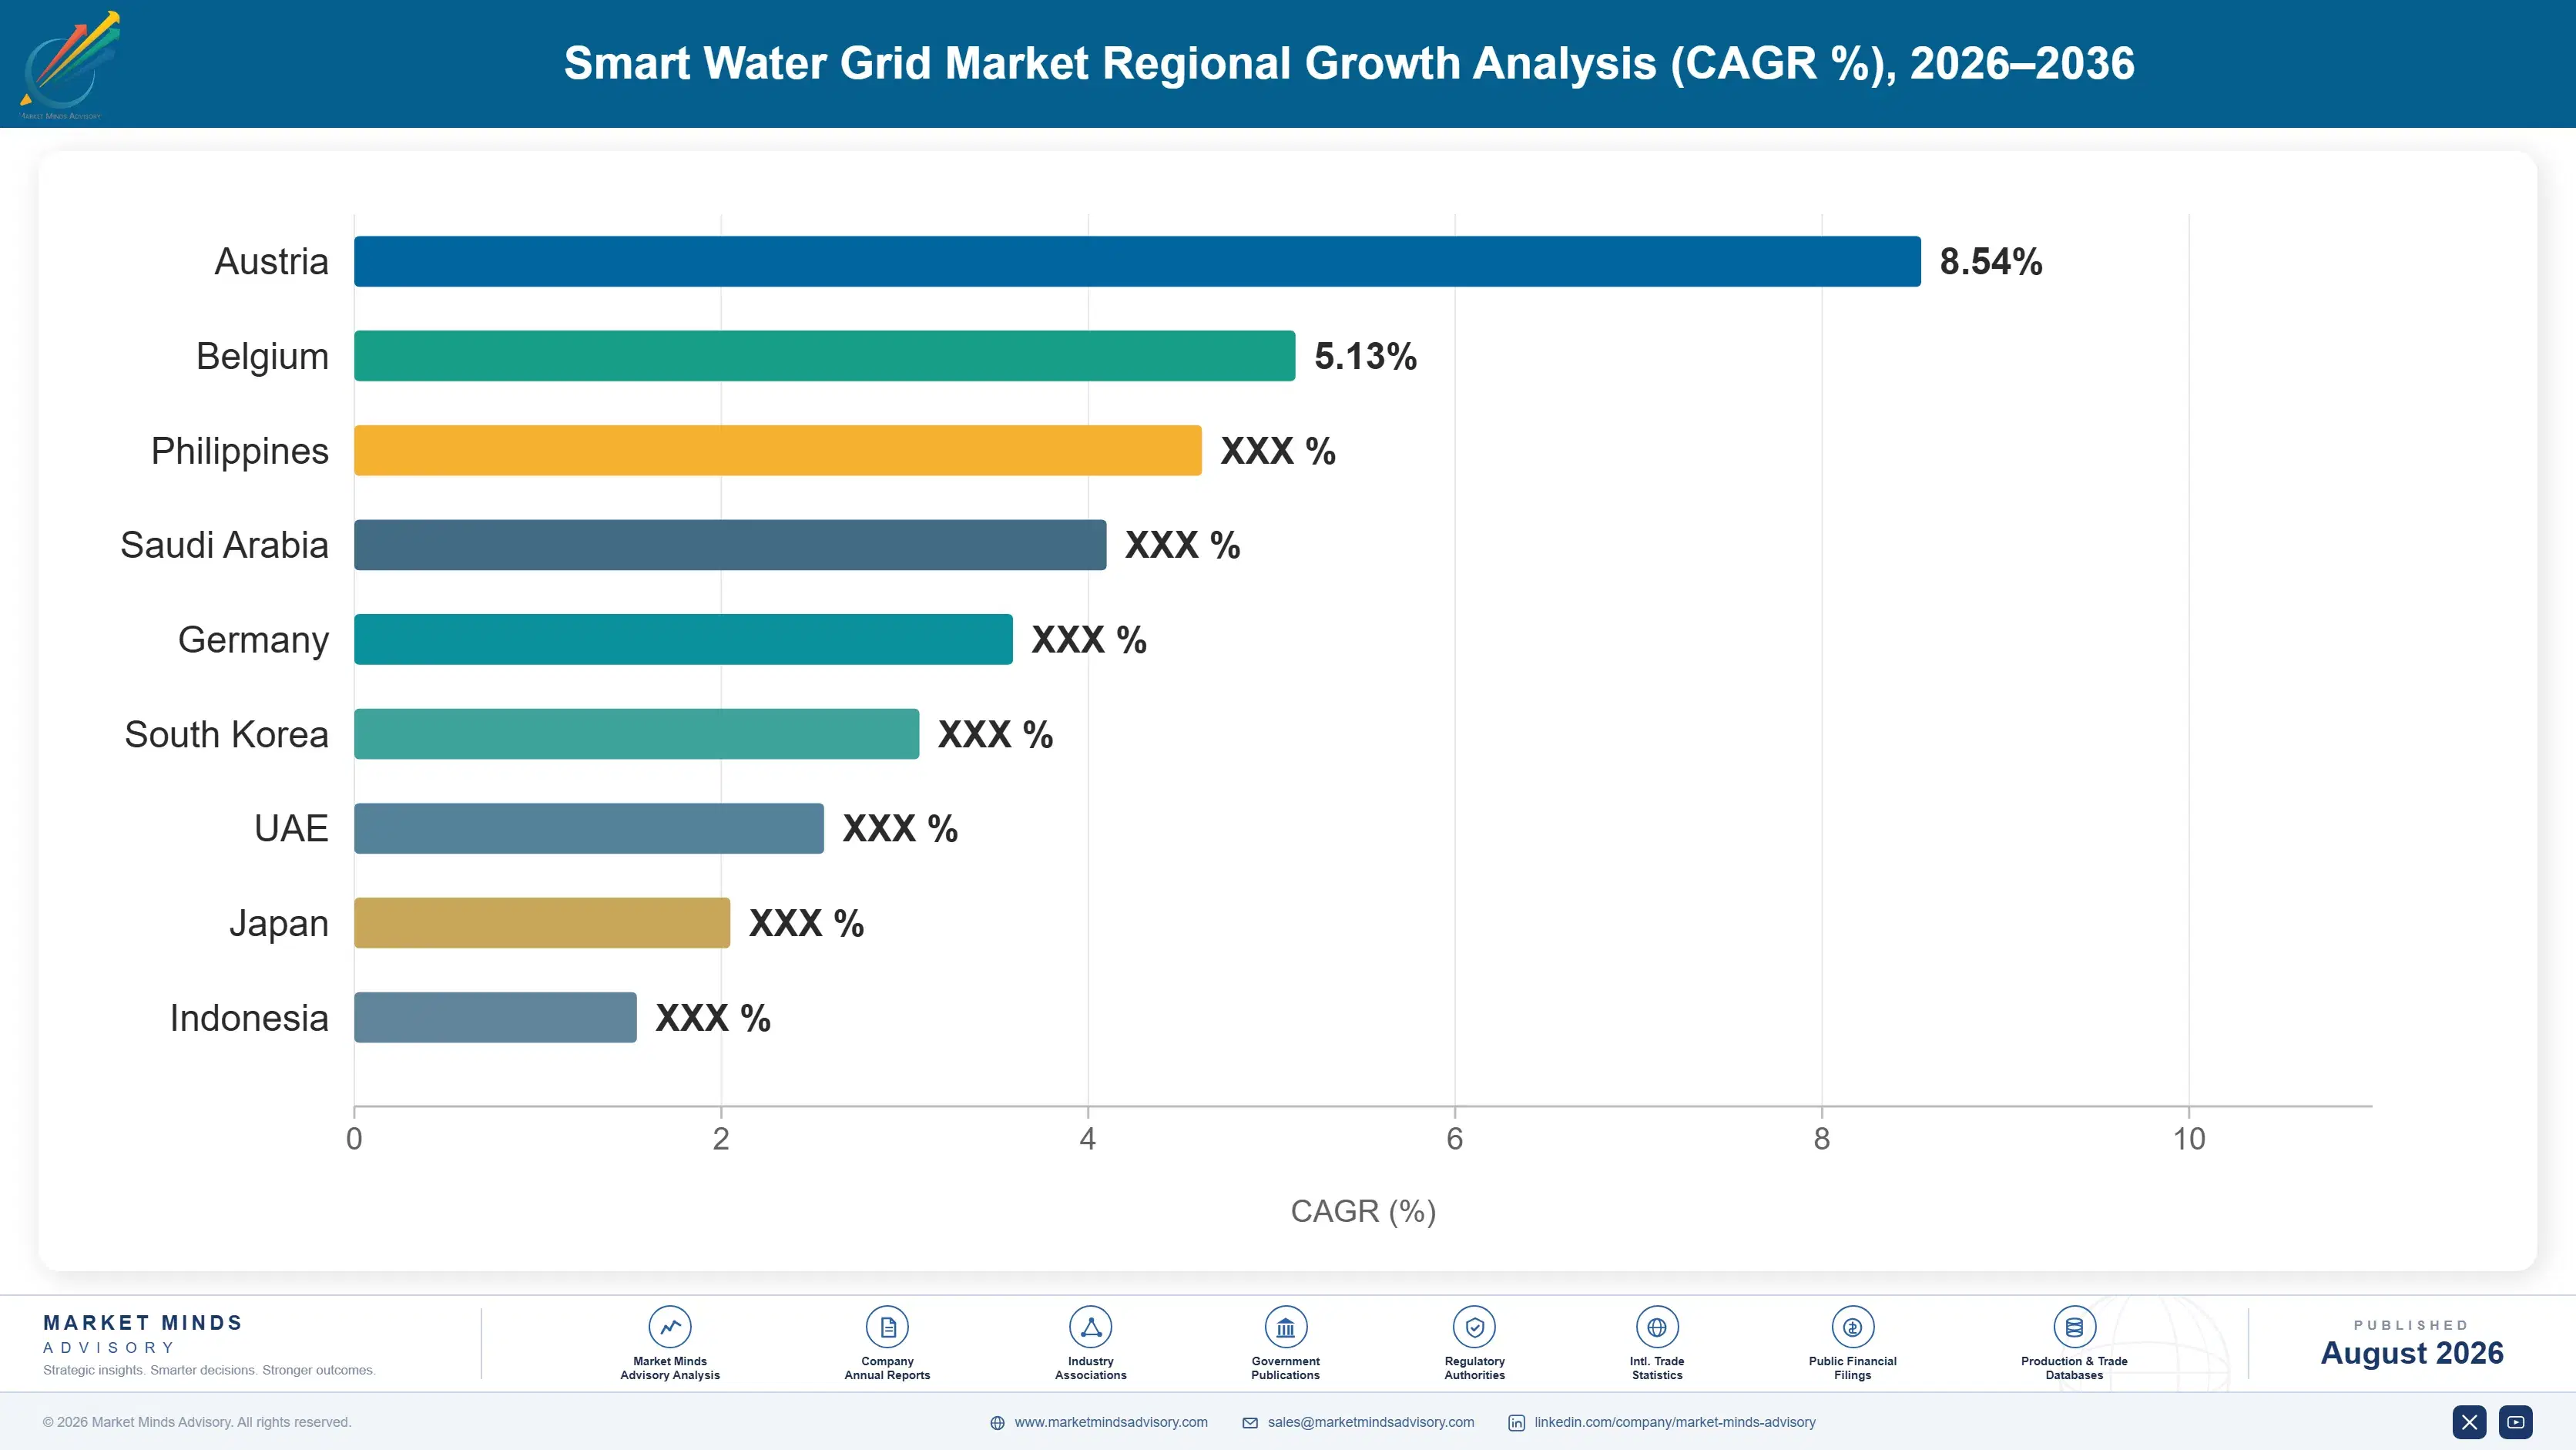
Regional Architecture and Country Demand Map

Demand concentrates where regulatory pressure and water scarcity intersect with utility capital capacity, which increasingly means East Asia rather than the historically dominant North American installed base. China's national water-loss targets and sponge-city programs are pulling deployment volume east even as North America retains the deepest per-utility technology spend.

North America

North America holds 26% of global value, still the deepest per-utility technology spend anywhere, even though East Asia has overtaken it on total volume. Thousands of fragmented municipal utilities across the United States and Canada have driven demand for standardized, vendor-supported platforms rather than the custom systems large national utilities elsewhere can build in-house. Itron, Badger Meter, and Mueller Water Products all run their core manufacturing and software development from domestic operations, giving American utilities direct access to vendor engineering teams. Growth of 10.0% tracks state-level non-revenue water reporting mandates expanding from early-adopter states such as California and Georgia, converting optional reporting into a funded compliance requirement utilities can no longer defer.
Share: 26% | CAGR: 10.0% (2026 to 2036)

Western Europe

Western Europe accounts for 20% of value, a mature base built on some of the world's earliest smart metering mandates but now growing more slowly as the easiest deployment gains have already been captured. The UK, France, and Italy lead regional deployment, and Suez and Veolia both run extensive smart water programs across concession contracts spanning multiple countries. The EU's revised Drinking Water Directive is now pulling laggard member states such as Romania and Bulgaria into compliance, creating a secondary wave of demand even as the largest markets mature. Growth of 9.0% trails the global rate directly because of that maturity, though the region still sets much of the regulatory template other jurisdictions eventually adopt.
Share: 20% | CAGR: 9.0% (2026 to 2036)
Regional intelligence for 5 additional markets available in the complete report: East Asia, South Asia and Pacific, Latin America, Middle East and Africa, Eastern Europe. Contact sales@marketmindsadvisory.com.
smart-water-grid-market-country-cagr-analysis-1787300358580

How Vendors Can Capture Recurring Revenue

Selling a meter once and walking away leaves the highest-margin part of this market on the table. The four moves below shift revenue toward positions that pay every year rather than once: subscription analytics, financing structures that avoid capital budget delays, open protocols that widen addressable deployments, and data services utilities cannot easily replicate themselves.

Convert Hardware Sales Into Analytics Subscriptions

Vendors that bundle a multi-year analytics subscription into every meter and sensor sale convert a one-time hardware transaction into a recurring revenue stream worth roughly 15% to 20% of the original hardware value each year for the life of the contract. Utilities prefer this structure too, since it shifts software maintenance and update responsibility onto the vendor rather than an internal IT team that may lack the skills. Badger Meter and Itron have both restructured commercial terms around this model over the past three years, and the shift is visible in their reported recurring-revenue mix relative to hardware-only competitors.
Market Impact: Adds 15% to 20% of hardware value annually

Offer Savings-Based Financing To Skip Capital Budgets

Structuring sensor and meter deployment as an operating expense financed against guaranteed water-loss savings, rather than a capital purchase requiring council approval, lets utilities adopt the technology without waiting through a multi-year budget cycle that can delay procurement by 2 to 4 years. Vendors absorb more upfront risk under this model, typically guaranteeing a minimum percentage reduction in non-revenue water within a defined period or accepting reduced payment. In practice the approach has cut utility decision timelines from an average of eighteen months down to under six in several documented deployments, the fastest-growing commercial structure vendors now offer.
Market Impact: Cuts utility decision timeline to under 6 months

Champion Open Protocols To Widen Addressable Deployments

Vendors that support open, standards-based communication protocols rather than proprietary radio systems can sell into utilities already committed to a competitor's meters, since open-protocol sensors and analytics software can layer onto an existing network without a full fleet replacement. That approach roughly triples, to 3x, the addressable base of any software or analytics vendor, since it no longer requires winning the original hardware contract to sell the higher-margin software layer. Several analytics specialists have built their commercial strategy around this interoperability, avoiding proprietary hardware so they can sell into any utility regardless of which meter vendor won that deployment.
Market Impact: Expands addressable analytics customer base by roughly 3x

Sell Predictive Maintenance As A Data Service

Rather than selling analytics software as a flat annual license, vendors are increasingly pricing predictive maintenance as a per-avoided-failure or per-gallon-saved data service tied directly to utility outcomes, capturing a share of the value they actually create rather than a fixed fee. Early adopters of this outcome-based pricing report capturing 20% to 30% more total contract value over a five-year deployment than under flat-fee licensing, since utilities share savings they would not have achieved without the vendor's analytics. The structure also deepens switching costs, since a utility tied to a vendor's predictive output rarely wants to disrupt that integration.
Market Impact: Captures 20% to 30% more total contract value

Who Controls the Margin Pool

Concentration sits at a moderate CR5 of 38%, reflecting a market split between meter hardware incumbents and analytics specialists neither has fully absorbed. The gap between the top five and the next tier is real: leaders combine hardware scale with genuine software capability, while most challengers hold only one or the other. All participants here are assessed on one basis: disclosed water-technology segment revenue.
Competition today runs across three dimensions. First, communication protocol control, since a vendor whose radio standard becomes the utility's fixed-network backbone locks in decades of business. Second, analytics depth, as predictive maintenance capability differentiates vendors more than meter accuracy ever did. Third, financing innovation, since vendors able to structure savings-based payment avoid the budget delays that kill deals for competitors selling only outright hardware.

Pressure is building from telecom and industrial technology majors entering through communication infrastructure and cloud analytics rather than meter manufacturing. Huawei and IBM both compete for the data layer without selling a meter, undercutting traditional vendors on the software margin that used to be their advantage. Rankings will shift toward vendors who control both the sensor and the software, since either piece alone is now commoditized.
smart-water-grid-market-company-positioning-matrix-1787300359095

Competitive Moat and Risk Dimensions

XYLEM INC.

Moat: Combined Hardware And Analytics Scale

Xylem's acquisition of Sensus gave it meter hardware scale to pair with its existing analytics and treatment technology portfolio, letting it sell a genuinely integrated sensing-to-software offering few competitors can match end to end. That breadth wins large utility contracts where fragmented multi-vendor solutions carry real integration risk utilities would rather avoid entirely.
XYLEM INC.

Risk: Integration Complexity Across Acquisitions

Xylem has grown substantially through acquisition, and integrating Sensus and other legacy platforms onto a common software architecture has taken longer than initially planned, leaving some utility customers on older systems awaiting promised upgrades. Competitors with narrower, more focused product lines can move faster on specific features, exploiting gaps while Xylem works through its own integration backlog.
ITRON INC.

Moat: Deep Installed Meter Base

Itron's installed base across millions of electricity, gas, and water meters gives it a multi-utility relationship many water-only vendors lack, letting it cross-sell water analytics into utilities where it already runs electric or gas metering programs. That existing commercial relationship shortens sales cycles competitors starting from zero cannot replicate quickly.
ITRON INC.

Risk: Exposure To Multi-Utility Budget Cycles

Itron's water business remains smaller than its electricity and gas segments, meaning capital allocation and product investment decisions compete internally against larger business lines. When corporate priorities shift toward grid modernization spending, water-specific analytics development can slow, creating an opening for water-focused specialists to move faster on features Itron deprioritizes.

Key Players

Xylem Inc.
Itron Inc.
Badger Meter Inc.
Mueller Water Products Inc.
Siemens AG

Others

Honeywell International Inc.
Schneider Electric SE
ABB Ltd
Kamstrup A/S
Diehl Metering GmbH
Landis+Gyr Group AG
Suez SA
Veolia Environnement SA
Aclara Technologies LLC
Trimble Inc.
Bentley Systems Incorporated
IBM Corporation
Huawei Technologies Co., Ltd.
Neptune Technology Group Inc.
Zenner International GmbH & Co. KG

Recent Developments

FEBRUARY 2025

Xylem Completes Integration Milestone for Sensus Analytics Platform

Xylem announced completion of a multi-year integration milestone unifying its Sensus metering hardware with its broader analytics software stack under a single utility-facing platform. The organic integration effort, not an acquisition, followed the 2023 Sensus purchase and targeted a common data architecture across water, gas, and electric metering lines.
Signal: Signals that hardware and software integration timelines run considerably longer than acquisitions themselves typically suggest to investors.
NOVEMBER 2024

Badger Meter Acquires Water Analytics Software Firm

Badger Meter completed the acquisition of a specialized water analytics software firm for an undisclosed sum, adding predictive leak detection capability to its existing meter and communication hardware business. The deal gives Badger Meter direct analytics capability it previously accessed only through third-party software integration partnerships.
Signal: Signals that hardware manufacturers increasingly buy analytics capability outright rather than build it internally over several years.
MAY 2025

Huawei and a Chinese Utility Form Smart Water Joint Venture

Huawei and a major Chinese municipal water utility formed a joint venture to deploy narrowband IoT water sensor networks across multiple provincial capitals under China's national water-loss reduction program. The partnership combines Huawei's cellular network infrastructure with the utility's operational access, targeting deployment across dozens of cities within three years.
Signal: Signals that telecom infrastructure providers are entering smart water directly rather than relying on hardware partnerships alone.

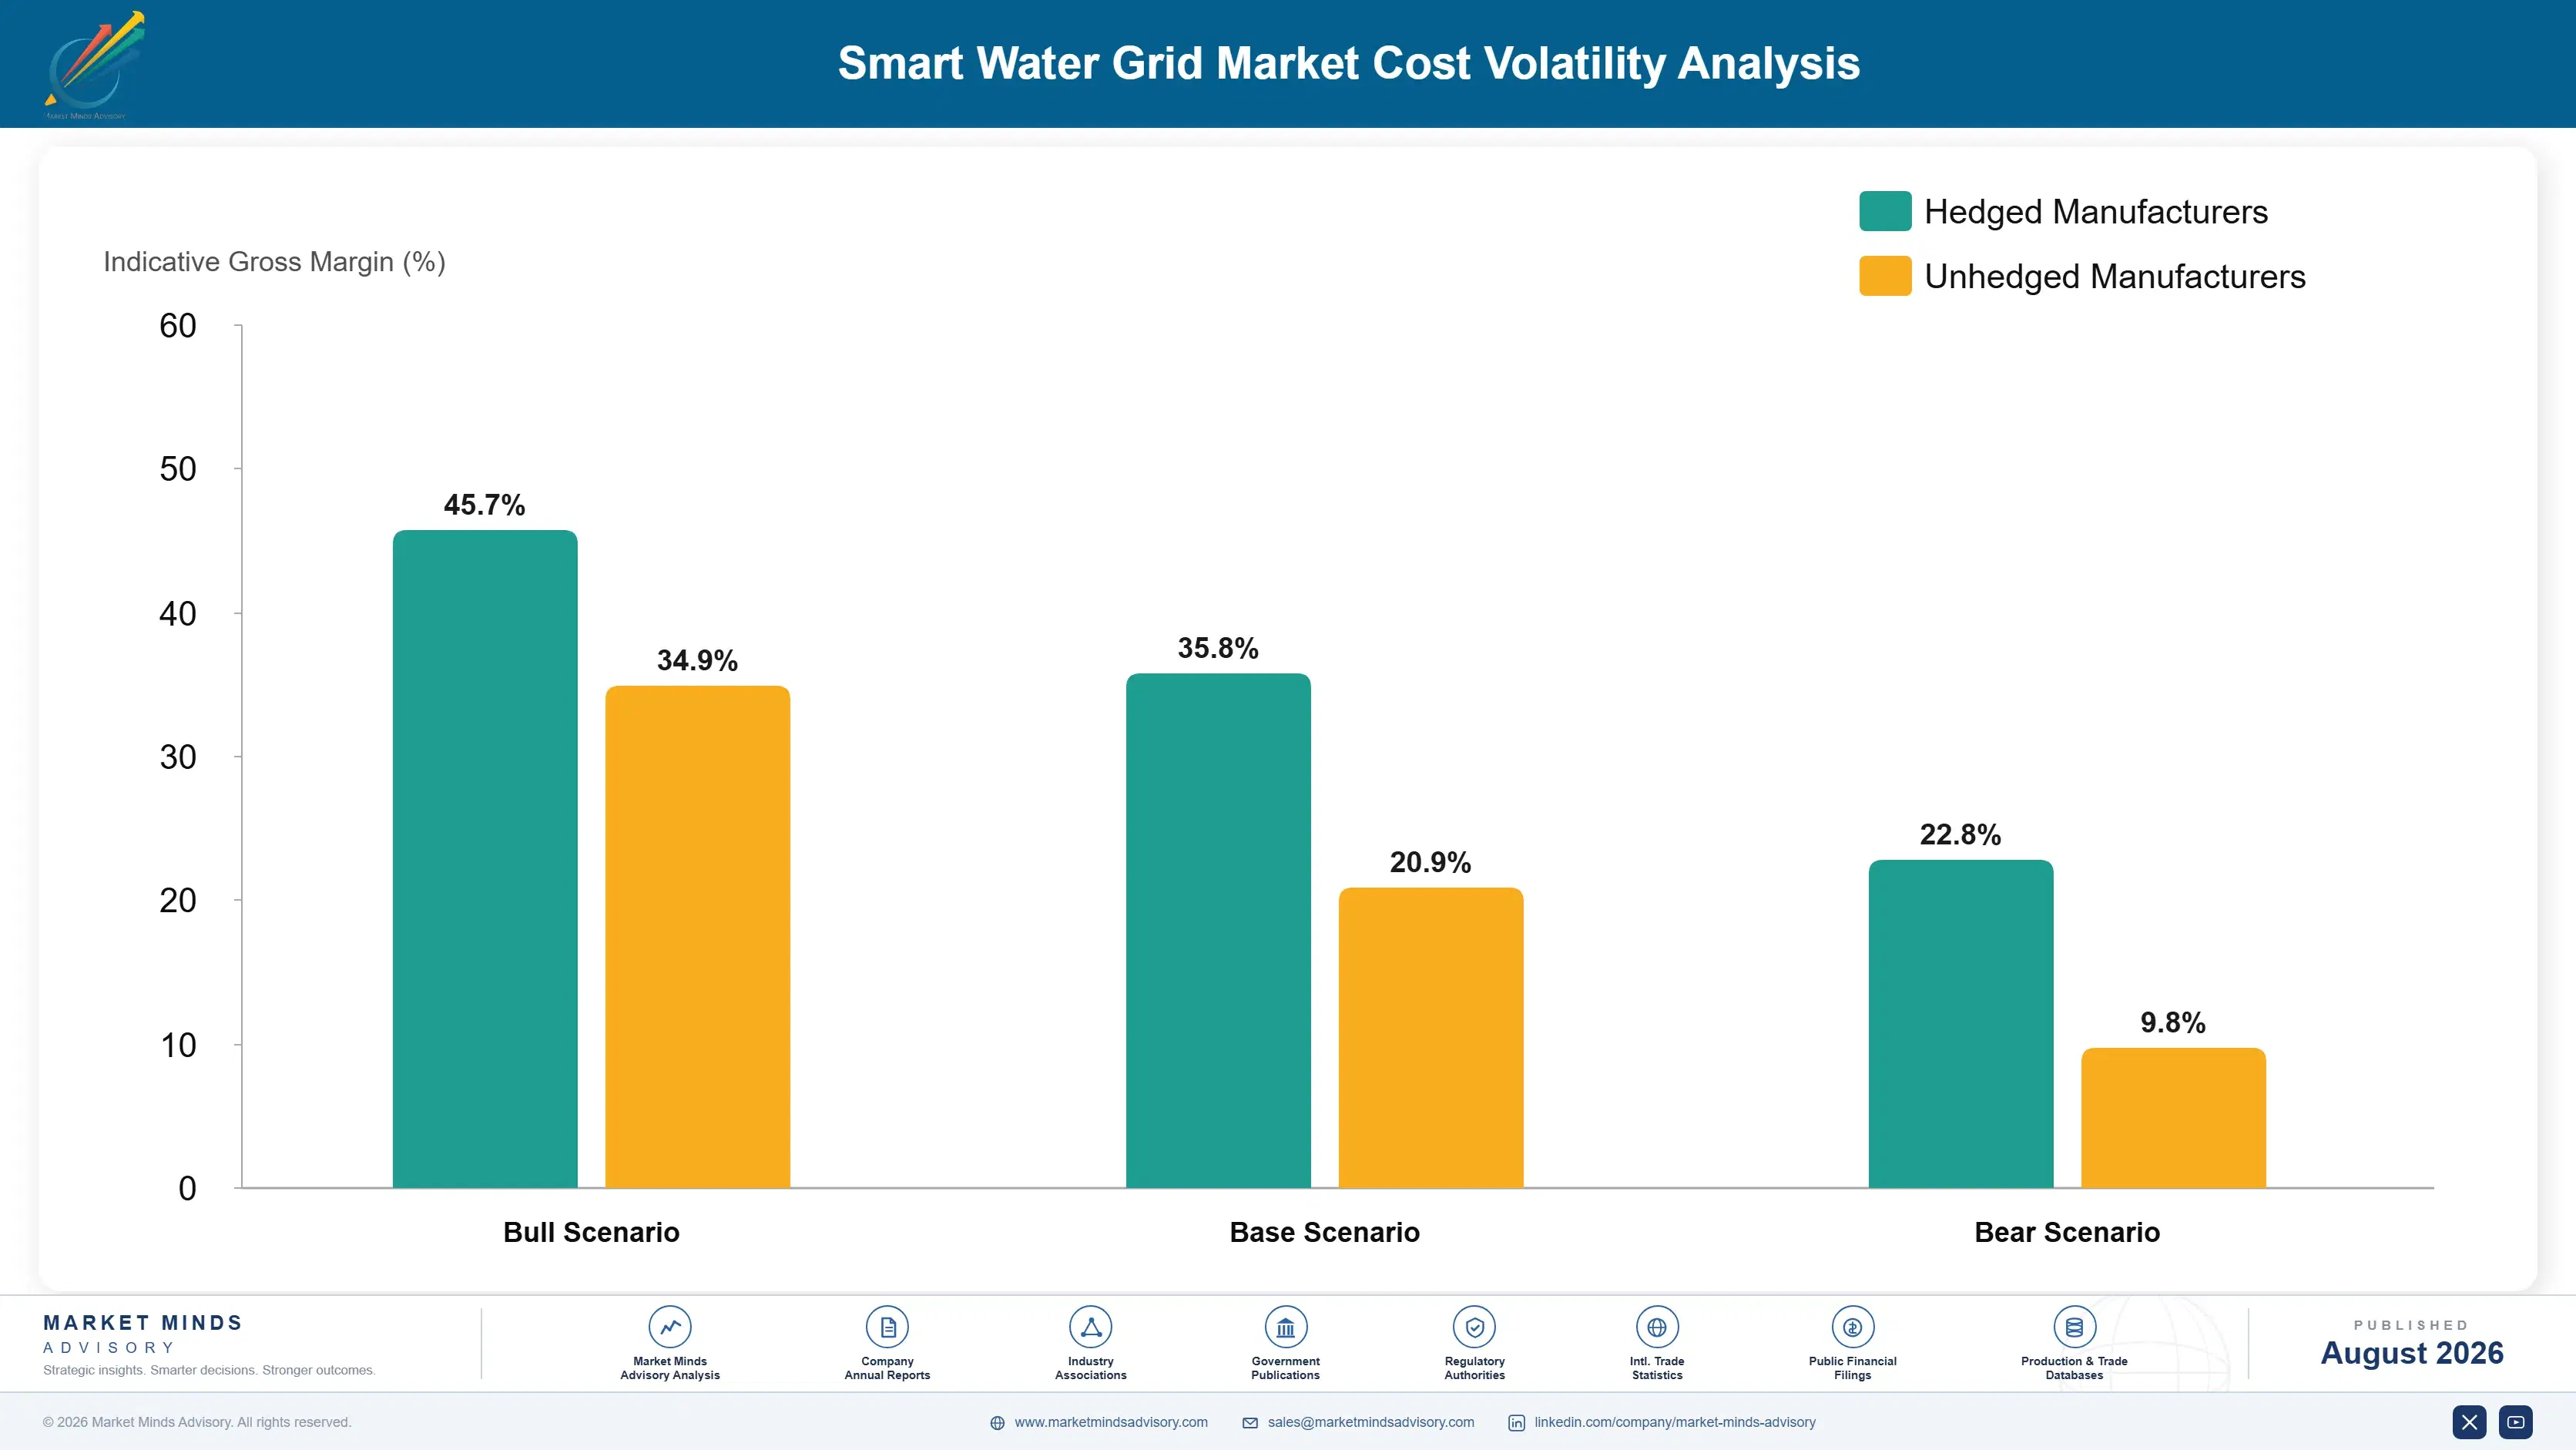
Sensor Electronics and Communication Chip Exposure

Semiconductor components and radio modules make up roughly 38% to 45% of cost of goods sold across smart meter hardware, since every unit requires a metering chip, a radio transceiver, and increasingly a cellular or LPWAN modem. Those components trace to a concentrated group of Asian semiconductor foundries and module assemblers, with Taiwan and China accounting for the large majority of supply.
The 2021 to 2022 semiconductor shortage illustrated the exposure directly. Multiple vendors including Itron and Badger Meter disclosed extended lead times and order backlogs in their 2022 annual reports, attributing delays specifically to microcontroller and radio-module shortages rather than to demand weakness. Itron's 2022 Annual Report cited component constraints as a driver of revenue recognition delays, with some deployments pushed by two to three quarters as vendors waited for chip allocation.

Smaller sensor vendors without long-term semiconductor supply agreements absorbed the shortage hardest, since their order volumes were too small to secure priority allocation from constrained foundries the way Itron or Xylem could through direct relationships. That gap compounds: large vendors pre-purchase components years ahead using balance sheet capacity smaller competitors do not have, leaving specialists exposed every time a shortage cycle repeats.
smart-water-grid-market-cost-volatility-analysis-1787300359292

Secure Multi-Year Semiconductor Supply Agreements Directly

Negotiating multi-year component supply agreements directly with semiconductor foundries and module assemblers, rather than buying through distributors on shorter terms, secures priority allocation during shortage cycles and smooths input cost volatility. The approach requires committing to volume forecasts years in advance, a real forecasting risk, but it has protected larger vendors' delivery schedules through two separate shortage cycles since 2020.

Diversify Radio Module Sourcing Across Suppliers

Qualifying radio and communication modules from more than one supplier, rather than relying on a single module vendor, reduces exposure to any single company's production disruption or allocation decision during a shortage. Requalification takes real engineering time, so vendors are prioritizing it for their highest-volume product lines first before extending diversified sourcing across their full hardware catalog over time.

Redesign Hardware Around More Available Components

Engineering meter and sensor hardware to accept a wider range of interchangeable microcontroller and radio module families, rather than designing around one specific part number, lets vendors substitute components during a shortage without a full product redesign. Several vendors adopted this flexible-design approach after the 2021 shortage specifically to avoid repeating the multi-quarter delivery delays it caused across the industry.

Portfolio Architecture for Margin Defence

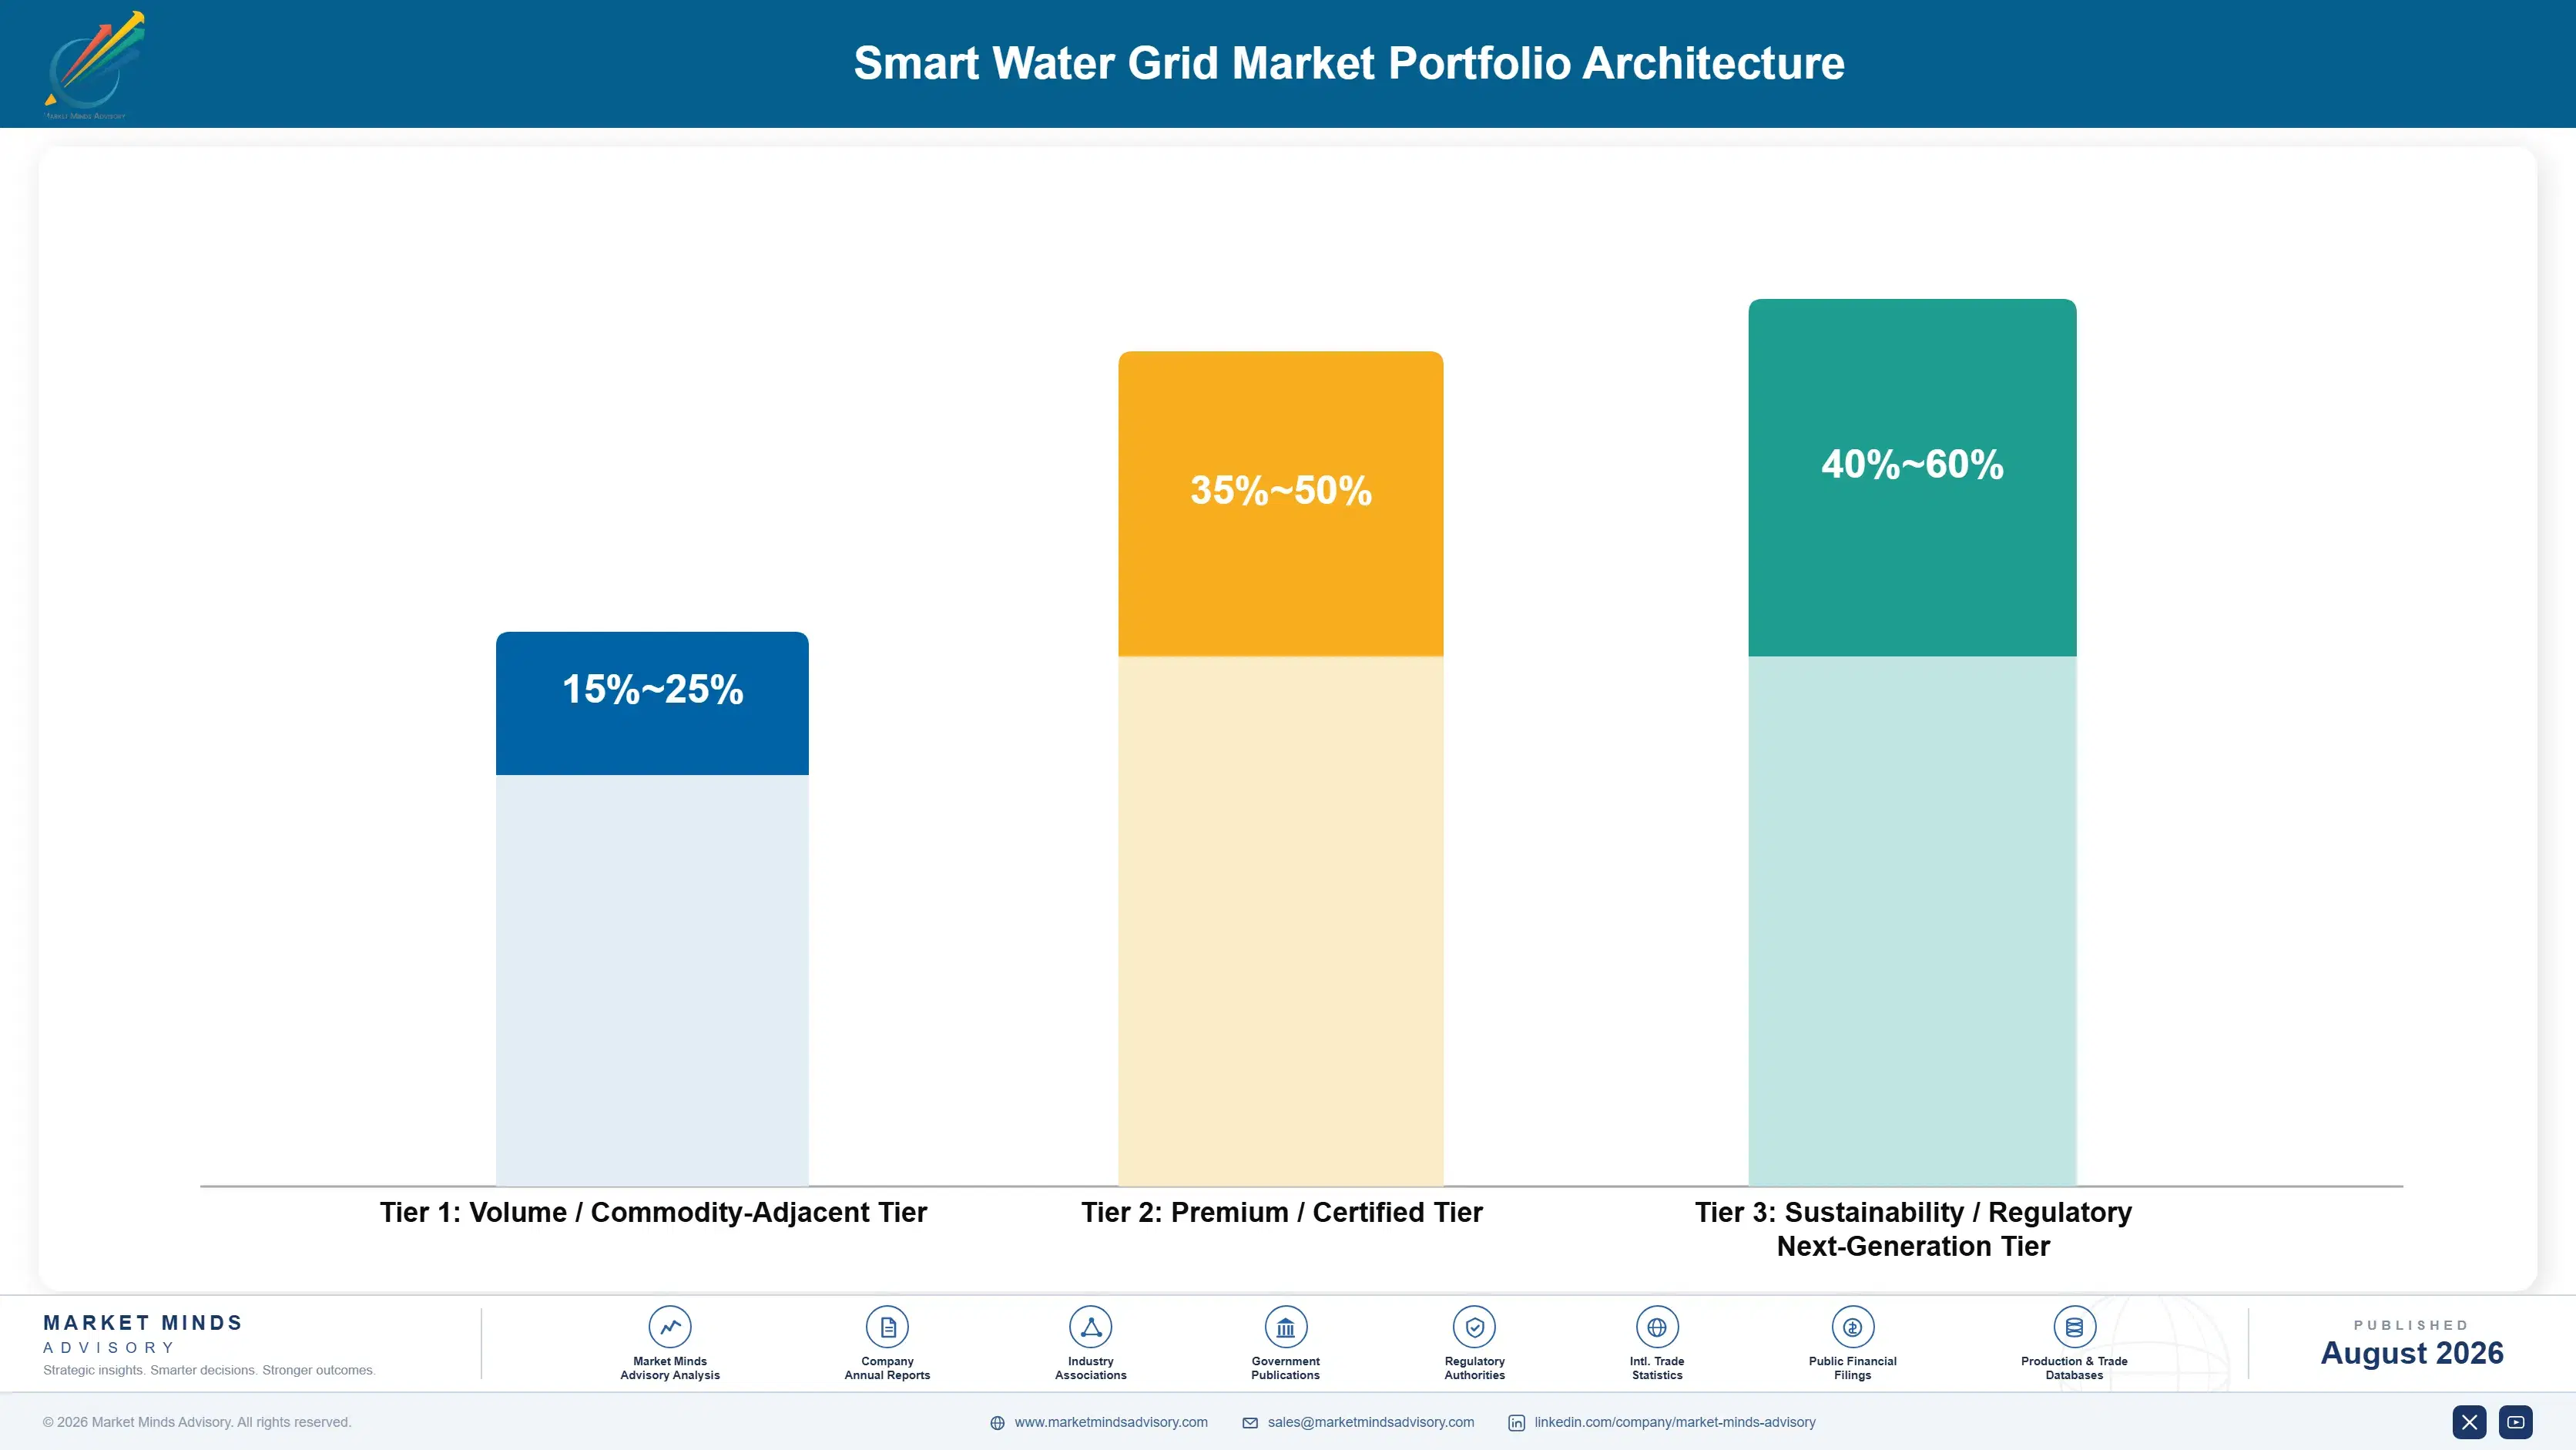
The portfolio splits into three tiers with wide margin separation tied to how much software sits on top of the hardware. Commodity meter hardware sold on price and delivery reliability carries thin margins. Certified platforms combining hardware, communication, and vendor-supported analytics carry the strongest margins. A third tier of next-generation predictive and outcome-based data services is still scaling toward proven, repeatable commercial economics across a broad utility base.
The tension between hardware volume and software premium shapes how vendors allocate engineering investment: hardware sales fund the manufacturing scale and installed base that make software attractive to sell against in the first place, while analytics platforms fund the data science and utility-domain expertise that create genuine competitive protection. Vendors that lean too far toward hardware risk commoditization; those that lean too far toward software risk lacking the installed base to sell into.

High-value pools concentrate specifically in predictive analytics and outcome-based data services, where recurring revenue and genuine switching costs both run highest. Commodity meter hardware generates volume but thin, price-competitive margins, since multiple vendors can supply functionally similar meters against the same specification with limited real differentiation.

Volume / Commodity-Adjacent Tier

Standard residential water meters and basic fixed-network communication hardware sold against several qualified vendors competing primarily on unit price, delivery reliability, and battery life specifications across large multi-year fleet replacement orders.
Gross Margin: 15-25%

Premium / Certified Tier

Integrated hardware, communication, and vendor-supported analytics platforms carrying multi-year service contracts and genuine switching costs once a utility standardizes its entire network on one vendor's full software and hardware platform.
Gross Margin: 35-50%

Sustainability / Regulatory / Next-Generation Tier

Outcome-based predictive maintenance and water-loss data services still scaling toward proven, repeatable commercial economics across a broad and varied utility customer base of different sizes and technical sophistication.
Gross Margin: 40-60%
smart-water-grid-market-portfolio-architecture-1787300359785

High-value Sub-segments and Strategic Watch-out

Data Analytics and Software Platforms

The fastest-growing and highest-margin segment, converting raw sensor data into prioritized repair work orders and capital planning inputs that utilities increasingly cannot generate internally, commanding subscription pricing well above the underlying hardware value it runs on, and deepening steadily over the life of each contract.
Gross Margin: 45-60%

Leak Detection and Acoustic Monitoring Sensors

High value with steadier growth than analytics, directly serving non-revenue water reduction mandates that regulators in the EU and drought-affected regions are converting from optional practice into a binding compliance requirement utilities must now fund every budget cycle.
Gross Margin: 35-50%

Advanced Metering Infrastructure (Smart Meters)

The volume core of the market, supplying residential and commercial meter replacement against several qualified vendors competing primarily on price, accuracy, and battery life across large multi-year fleet replacement orders that anchor most utility contracts.
Gross Margin: 20-32%

SCADA and Distribution Management Systems

The strategic watch-out, a mature category facing margin pressure as cloud-native analytics platforms absorb functions once sold as standalone control-room software licensed separately to each utility on its own multi-year terms.
Gross Margin: 22-35%

Why Utility Contracts Run Decades

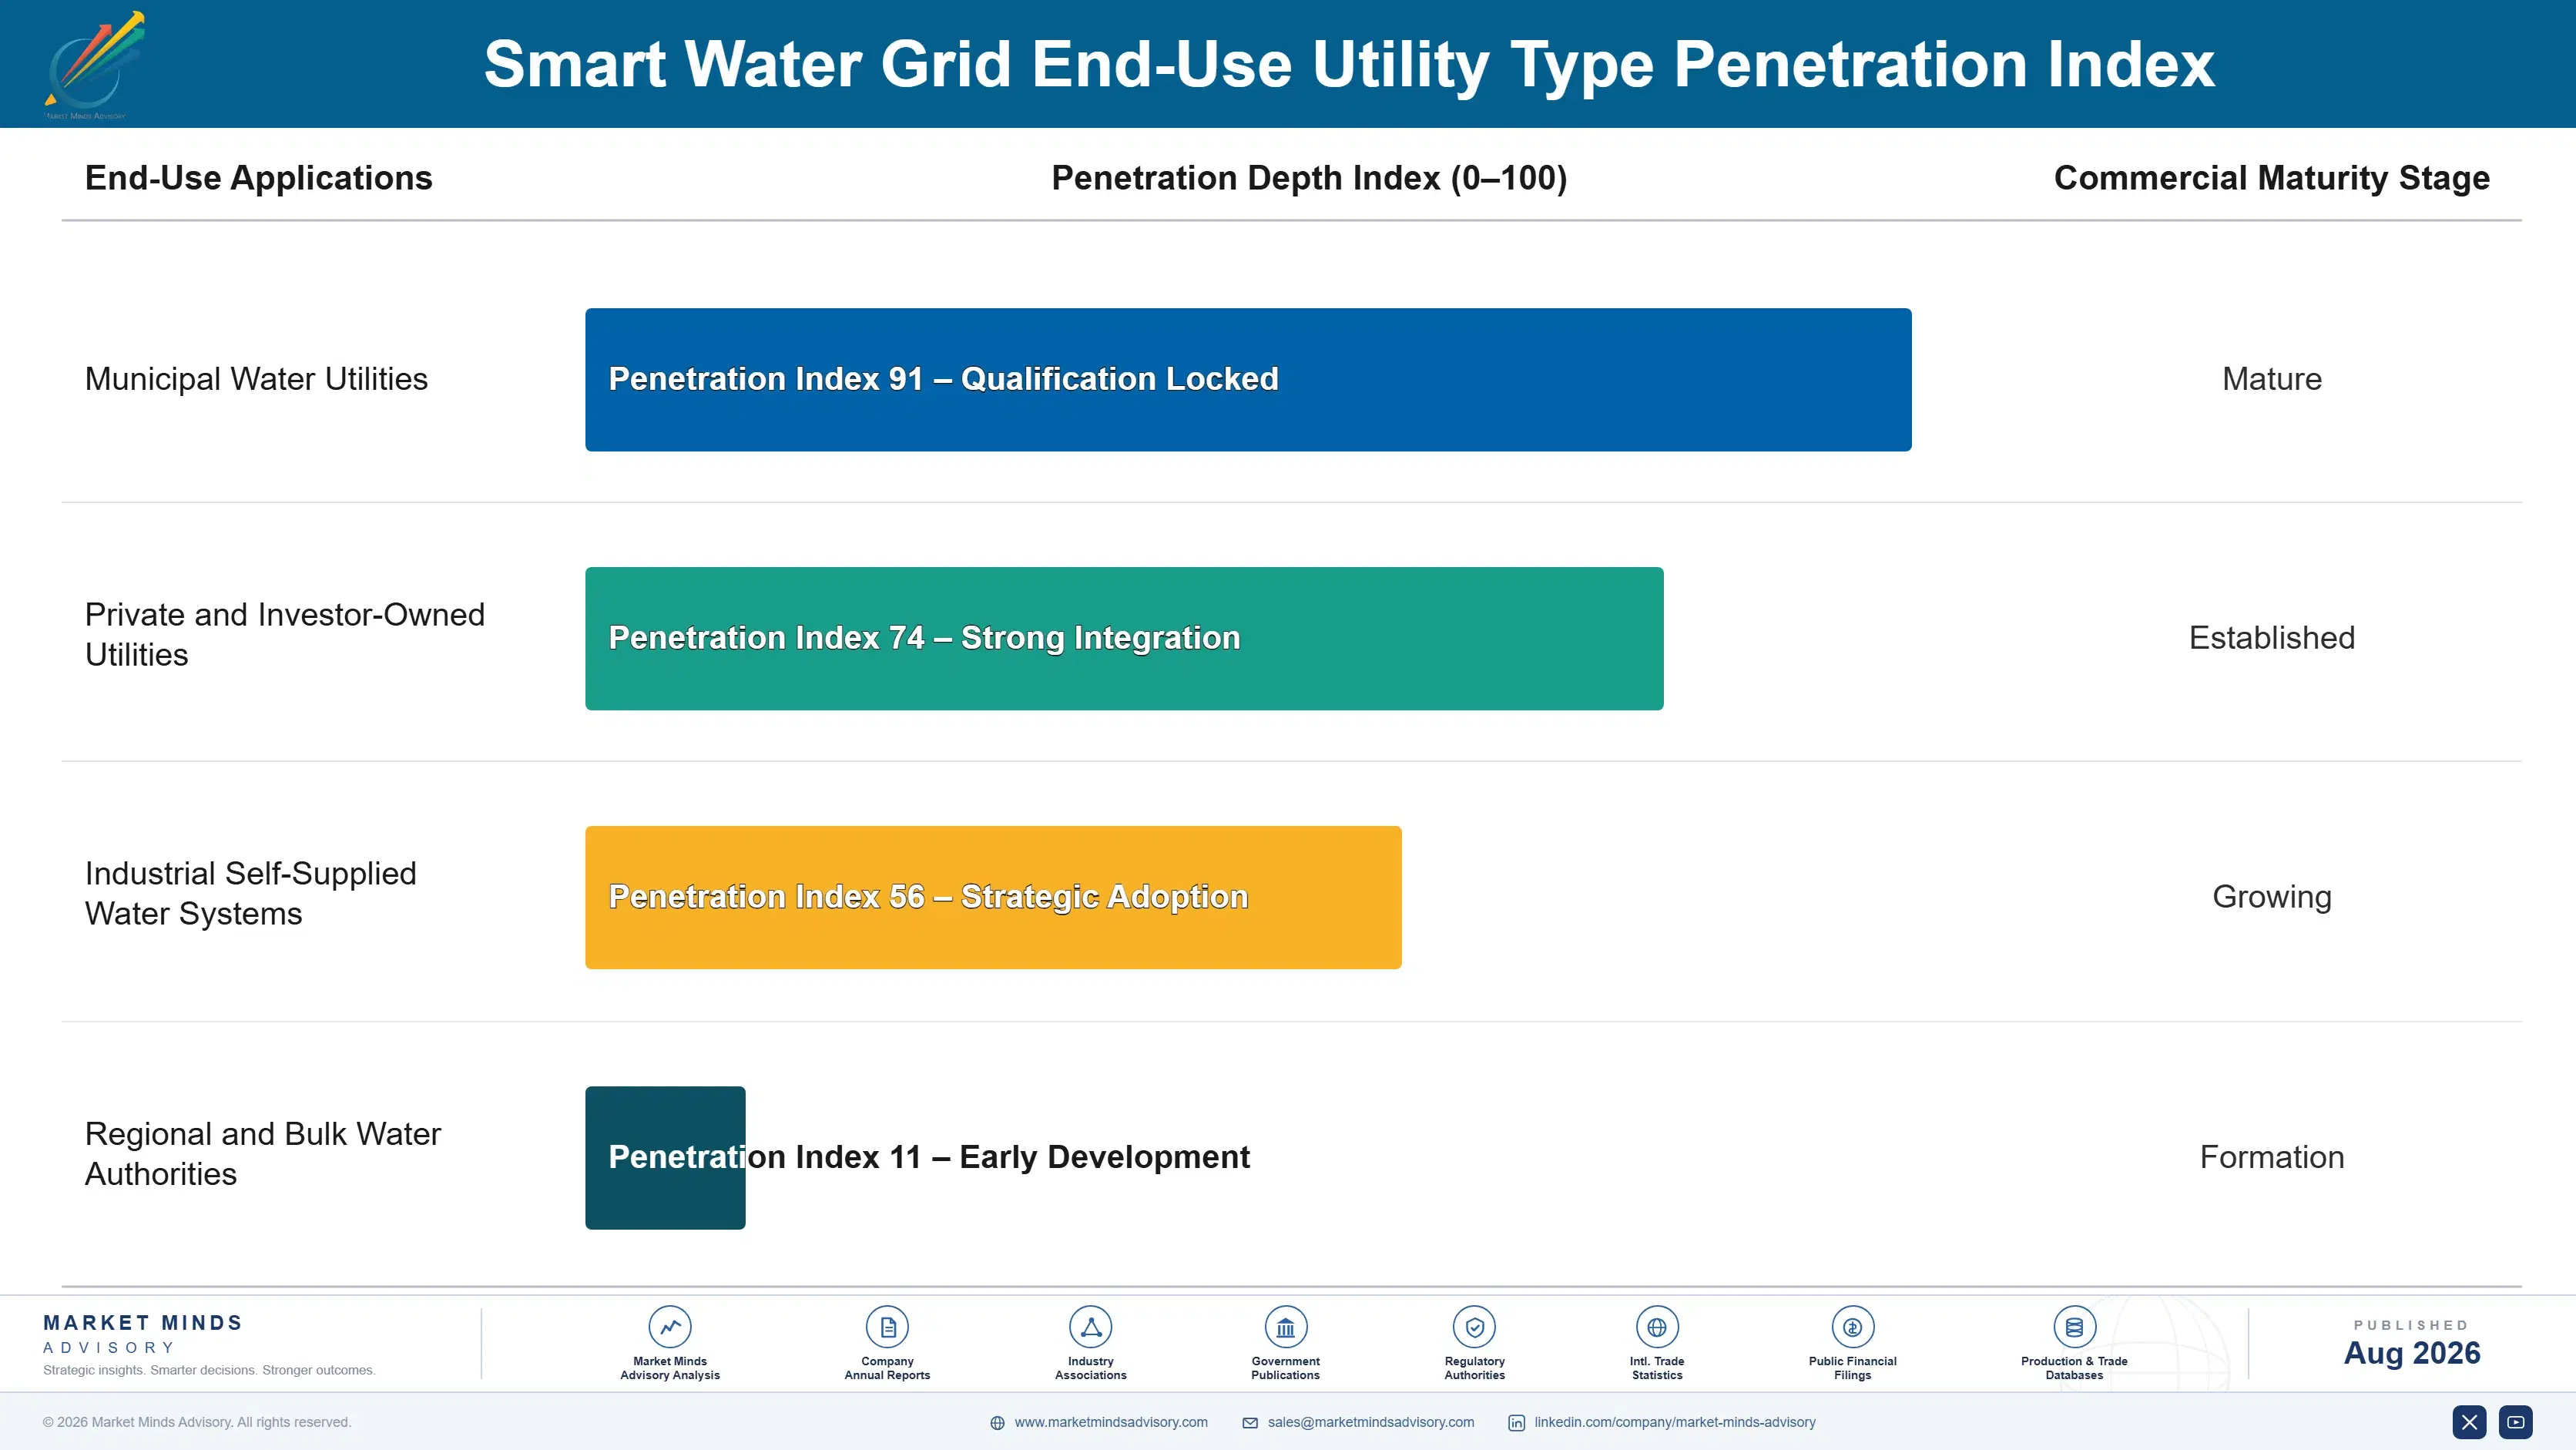
Demand here behaves like an annuity once a utility standardizes on a vendor's meter and communication protocol, because replacing an entire fixed-network fleet mid-contract means abandoning working infrastructure and retraining field crews on new equipment. A vendor that wins the original fixed-network deployment typically supplies that utility for fifteen to twenty years, the working life of the communication infrastructure, converting an initial hardware sale into a multi-decade recurring rela
Adoption depth varies sharply by utility size. Large metropolitan utilities build custom analytics capability in-house and treat vendors primarily as hardware suppliers, giving them real negotiating leverage and lower stickiness. Small and mid-sized utilities, which make up the large majority of utility connections globally, depend entirely on vendor-supplied analytics since they lack the technical staff to build anything themselves, making them the stickiest and most vendor-loyal customer segment in the market.

Buyer profiles are shifting generationally too. A newer cohort of utility general managers, trained under mounting regulatory and drought pressure, now weighs a vendor's analytics and data-service depth as heavily as unit hardware price, a shift that favors vendors with genuine software capability over hardware-only suppliers competing purely on meter cost.
smart-water-grid-market-end-use-penetration-index-1787300360275

What Utilities Will Pay For Next

These are among the four positions where our research anticipates prominent divergence between winners and laggards over the coming forecast period. Each is grounded in the demand model, the regulatory perimeter, and the announced capacity pipeline.
01 / REGULATORY COMPLIANCE MANDATES

Non-revenue water rules will keep forcing sensor adoption

Utilities facing binding water-loss reduction targets in the EU and expanding American states will keep converting discretionary technology purchases into funded compliance line items regardless of near-term budget pressure or local political turnover between elections. Vendors positioned to help utilities meet specific reporting thresholds, rather than selling generic sensor hardware, will capture the bulk of this compliance-driven spending over the next decade. Expect further regulatory expansion as more American states adopt non-revenue water reporting requirements modeled on California's and Georgia's existing frameworks.
02 / ASIAN DEPLOYMENT SCALE

East Asia's share keeps growing as China scales sponge cities

East Asia already holds the largest regional share at 30% and grows near the top of its band as China's national water-loss targets pull deployment into second and third-tier cities across the country at real scale. Domestic vendors including Huawei are closing the technology gap with Western hardware incumbents faster than most industry observers expected just a few years ago. Multinationals that fail to build direct China relationships risk losing the single largest volume opportunity in the entire global market.
03 / SOFTWARE MARGIN CAPTURE

Analytics platforms will separate winners from hardware-only vendors

Data analytics and software platforms are growing faster than any other segment and carry the highest margins in the market, and vendors without genuine analytics capability will increasingly compete only on commoditized hardware price alone from here forward. Telecom and cloud majors entering through the software layer without ever selling a meter intensify that pressure further still, year after year. Expect hardware-only vendors to either acquire analytics capability or gradually cede the highest-margin part of every deployment to specialists.
04 / FINANCING STRUCTURE INNOVATION

Savings-based financing will win over budget-constrained mid-sized utilities

Vendors that structure deployment as an operating expense financed against guaranteed water-loss savings will keep winning business that multi-year municipal capital budget cycles would otherwise delay or kill entirely before it ever starts. That financing innovation matters most for small and mid-sized utilities that make up the majority of connections but hold the smallest individual capital budgets available. Expect vendors without a savings-based financing option to lose ground steadily to competitors who have already built one.

Engagement Snapshot From the Field

A live engagement with an industry participant carrying material or product regulatory and market exposure ahead of a defining policy shift, showing how our research translates into a defensible multi-year portfolio strategy.
MARKET MINDS ADVISORY · CLIENT ENGAGEMENT SUMMARY
Smart Water Grid Producer Strategic Portfolio Review and Transition Roadmap 2026·Investment Scenario on Smart Water Grid Exposure Evaluation 2025-26
CLIENT PROFILE
A mid-sized municipal water utility serving roughly 280,000 connections across a drought-prone American Southwest metro area approached MMA while evaluating a full fixed-network smart meter rollout. The utility reported non-revenue water losses near 31% of treated supply and an annual operating budget of USD 95 million, with capital committee approval required before any multi-year technology contract (client-reported, unverified by MMA).
STRATEGIC CHALLENGE
Management knew leak reduction could fund itself through avoided water purchase costs but faced a capital budget process that historically took eighteen months to clear council approval. The engineering team wanted a full fixed-network deployment; the finance team worried about upfront capital exposure; and the general manager needed a financing structure the capital committee would approve on the first vote.
MMA APPROACH
MMA modeled avoided-cost savings from non-revenue water reduction against three vendor proposals, benchmarked savings-based financing structures against the utility's own capital cost of debt, and quantified the revenue-at-risk from continuing to lose water at the current rate. We also assessed deployment sequencing options that would let the utility demonstrate savings from a pilot district before committing to full-fleet capital spending.
KEY FINDINGS
  1. A savings-based financing structure tied to a guaranteed 15% non-revenue water reduction would pay for itself within four years purely from avoided water purchase costs (client-reported, unverified by MMA).
  2. The eighteen-month capital budget cycle was the binding constraint on deployment timing, not vendor lead time or technical readiness, which the finance team had not previously separated out.
  3. A phased pilot across one district, rather than a full-fleet rollout, could demonstrate measurable savings within twelve months and build the internal case for full committee approval.
  4. Two of three vendor proposals evaluated could not support outcome-based pricing at the scale the utility needed, narrowing the realistic vendor shortlist considerably.
CLIENT PROFILE
A mid-sized municipal water utility serving roughly 280,000 connections across a drought-prone American Southwest metro area approached MMA while evaluating a full fixed-network smart meter rollout. The utility reported non-revenue water losses near 31% of treated supply and an annual operating budget of USD 95 million, with capital committee approval required before any multi-year technology contract (client-reported, unverified by MMA).
STRATEGIC CHALLENGE
Management knew leak reduction could fund itself through avoided water purchase costs but faced a capital budget process that historically took eighteen months to clear council approval. The engineering team wanted a full fixed-network deployment; the finance team worried about upfront capital exposure; and the general manager needed a financing structure the capital committee would approve on the first vote.
MMA APPROACH
MMA modeled avoided-cost savings from non-revenue water reduction against three vendor proposals, benchmarked savings-based financing structures against the utility's own capital cost of debt, and quantified the revenue-at-risk from continuing to lose water at the current rate. We also assessed deployment sequencing options that would let the utility demonstrate savings from a pilot district before committing to full-fleet capital spending.
KEY FINDINGS
  1. A savings-based financing structure tied to a guaranteed 15% non-revenue water reduction would pay for itself within four years purely from avoided water purchase costs (client-reported, unverified by MMA).
  2. The eighteen-month capital budget cycle was the binding constraint on deployment timing, not vendor lead time or technical readiness, which the finance team had not previously separated out.
  3. A phased pilot across one district, rather than a full-fleet rollout, could demonstrate measurable savings within twelve months and build the internal case for full committee approval.
  4. Two of three vendor proposals evaluated could not support outcome-based pricing at the scale the utility needed, narrowing the realistic vendor shortlist considerably.
RECOMMENDED STRATEGY
Phase 1: Phase 1 (0 to 12 months): Deploy acoustic sensors and smart meters across one pilot district to demonstrate measurable non-revenue water reduction. Phase 2: Phase 2 (12 to 24 months): Present pilot results to the capital committee alongside a savings-based financing proposal covering full-fleet deployment. Phase 3: Phase 3 (24 to 48 months): Complete fixed-network rollout across all remaining districts, funded by avoided water purchase costs from the pilot.
OUTCOME
The utility approved the pilot district deployment within four months rather than the historical eighteen, using MMA's avoided-cost model to secure capital committee support. Pilot-district non-revenue water fell by an estimated 17% within ten months, ahead of the modeled target, and the utility has since approved full-fleet financing worth a reported USD 22 million (client-reported, unverified by MMA).

Frequently Asked Questions

Foundational context covering the market sizes, CAGR, scope, country, region and competition that inform every finding below. This section is provided to cover basics and most often pre-purchase conversations, answered from the MMA Primary Research Dataset.

What is the current size of the Smart Water Grid Market?

The market stood at USD 9.8 billion in 2025, spanning meters, sensors, and analytics software. Data analytics and software platforms are the fastest-growing technology layer within that base.

How large will the Smart Water Grid Market be by 2036?

The market is projected to reach USD 29.1 billion by 2036 under the base case scenario. That represents roughly 2.69 times the 2026 value of USD 10.8 billion.

What is the CAGR for the Smart Water Grid Market 2026 to 2036?

The base case CAGR is 10.4% annually through 2036. The bull case reaches 11.6% on faster regulatory adoption, while the bear case falls to 9.2%.

Which segment is growing fastest?

Data analytics and software platforms grow fastest at 13.5% annually, well ahead of hardware categories. That is roughly 1.30 times the overall market growth rate.

Who are the major companies in the Smart Water Grid Market?

Xylem Inc., Itron Inc., Badger Meter Inc., Mueller Water Products Inc., and Siemens AG lead the market. Together the top five vendors hold a CR5 of 38%.

Which country is growing fastest?

India grows fastest among all countries at 15.2% annually. Growth is driven by urban utilities confronting non-revenue water losses exceeding forty percent in several major cities.

Report Segmentation Architecture

The full report scope spans multiple orthogonal segmentation dimensions, with cross-tabulated demand data provided for each dimension pair. Coverage extends further to regional breakdowns, trend trajectories, and the competitive detail needed to support segment-level decision-making.

By Technology Function

  • Advanced Metering Infrastructure (Smart Meters)
  • SCADA and Distribution Management Systems
  • Leak Detection and Acoustic Monitoring Sensors
  • Water Quality Monitoring Sensors
  • Data Analytics and Software Platforms
  • Communication Network Infrastructure

By End-Use Utility Type

  • Municipal Water Utilities
  • Private and Investor-Owned Utilities
  • Industrial Self-Supplied Water Systems
  • Regional and Bulk Water Authorities

By Commercial Dimension

  • Direct Utility Procurement
  • Systems Integrator and EPC Channel
  • Subscription and Managed Service Models
  • Public-Private Concession Contracts

By Region

  • North America
  • Western Europe
  • East Asia
  • South Asia and Pacific
  • Latin America
  • Middle East and Africa
  • Eastern Europe

Scope, Methodology, and Coverage

Every figure in this report is reproducible from documented input assumptions. The scope below maps the historical period, the forecast horizon, the segmentation dimensions, and the countries covered, alongside the underlying primary and qualitative methodology.
Historical Period
2020 to 2025
Forecast Period
2026 to 2036
Base Year
2025 (USD billions; MMA Primary Research Dataset, August 2026)
Market Definition
The smart water grid market covers digital hardware, communication networks, and software used by water utilities to monitor, control, and optimize potable water distribution networks, including advanced metering infrastructure, SCADA systems, leak-detection sensors, water quality sensors, and analytics platforms. It includes both the capital equipment and the recurring software and data-service revenue tied to that equipment. Wastewater treatment plant automation, irrigation-specific systems, and bottled or point-of-use water treatment devices are excluded.
Quantitative Units
USD billions (current prices); million connected smart meter units where applicable
Segmentation Dimensions
By Technology Function; By End-Use Utility Type; By Commercial Dimension; By Region
Regions Covered
North America, Western Europe, East Asia, South Asia and Pacific, Latin America, Middle East and Africa, Eastern Europe
Countries Covered
USA, China, Germany, France, UK, Japan, South Korea, India, Australia, Canada, Brazil, Mexico, Indonesia, Vietnam, Thailand, Malaysia, UAE, Saudi Arabia, South Africa, Nigeria, Turkey, Poland, Netherlands, Italy, Spain, Sweden, Switzerland, Argentina, Colombia, Singapore, and additional markets relevant to this sector
Key Companies Profiled
Xylem Inc., Itron Inc., Badger Meter Inc., Mueller Water Products Inc., Siemens AG, Honeywell International Inc., Schneider Electric SE, ABB Ltd, Kamstrup A/S, Diehl Metering GmbH, Landis+Gyr Group AG, Suez SA, Veolia Environnement SA, Aclara Technologies LLC, Trimble Inc., Bentley Systems Incorporated, IBM Corporation, Huawei Technologies Co., Ltd., Neptune Technology Group Inc., Zenner International GmbH & Co. KG
Quantitative Methodology
Primary survey, n=3,800 respondents, Q4 2025, six countries; demand-side model with trade association cross-validation
Qualitative Methodology
47 expert interviews, Q4 2025; applied to validate demand model assumptions, identify emerging dynamics, and assess competitive positioning
Report Format
PDF and XLSX data workbook (Word format preview document)
Publisher
Market Minds Advisory
Report Code
MMA-2026-TEC-118
Published
August 2026
Contact
sales@marketmindsadvisory.com | www.marketmindsadvisory.com

Purchase the full Smart Water Grid Market Report (2026 to 2036).

The full MMA Smart Water Grid report sizes the market across six technology functions, four utility end-use types, four commercial models, and seven regions through 2036. It profiles 20 vendors on a consistent basis of disclosed water-technology segment revenue, scoring each on hardware scale, analytics depth, and communication protocol reach. Scenario models quantify how EU water-loss regulation, Chinese sponge-city investment, and semiconductor supply conditions move both demand and realizable pricing. The report also includes delivered-cost modeling by technology function, a regulatory compliance timeline across major jurisdictions, and a savings-based financing feasibility framework built for utility strategy, vendor management, and infrastructure investment teams.
Six-function segmentation with cross-tabulated regional demand data
Twenty-company competitive benchmarking on consistent revenue basis
Regulatory compliance timeline across EU, US, and China
Semiconductor supply and cost exposure modeling by function
Scenario forecasts through 2036 under bull and bear cases
Case study on savings-based financing and pilot deployment

Built For The People Who Decide

From boardroom strategy to bench-side execution, this report is read cover-to-cover by leaders shaping the next decade of their industry, turning demand scenarios, market dynamics and valuation benchmarks into decisions.
CXOs/ Presidents/ VPs/ Managers
M&A and Corporate Development
Strategy Teams and R&D Heads
Procurement and Product Directors
Regulatory and Compliance Leaders
Investor Relations and Equity Analysts