Market Minds Advisory
Smart Waste Management Market

Smart Waste Management Market: The Sensor Is Cheap, the Route Change Is Not

Fill-level sensors are inexpensive and now widely deployed, yet most cities never change a single collection route, because the crews, contracts, and union schedules behind them were never designed to move.

Lead Analyst

David Horsley

Published

September 2026

Make Smarter Decisions with Customized Research Insights

Request a free sample report and evaluate market opportunities, growth trends, and competitive dynamics relevant to your business needs.

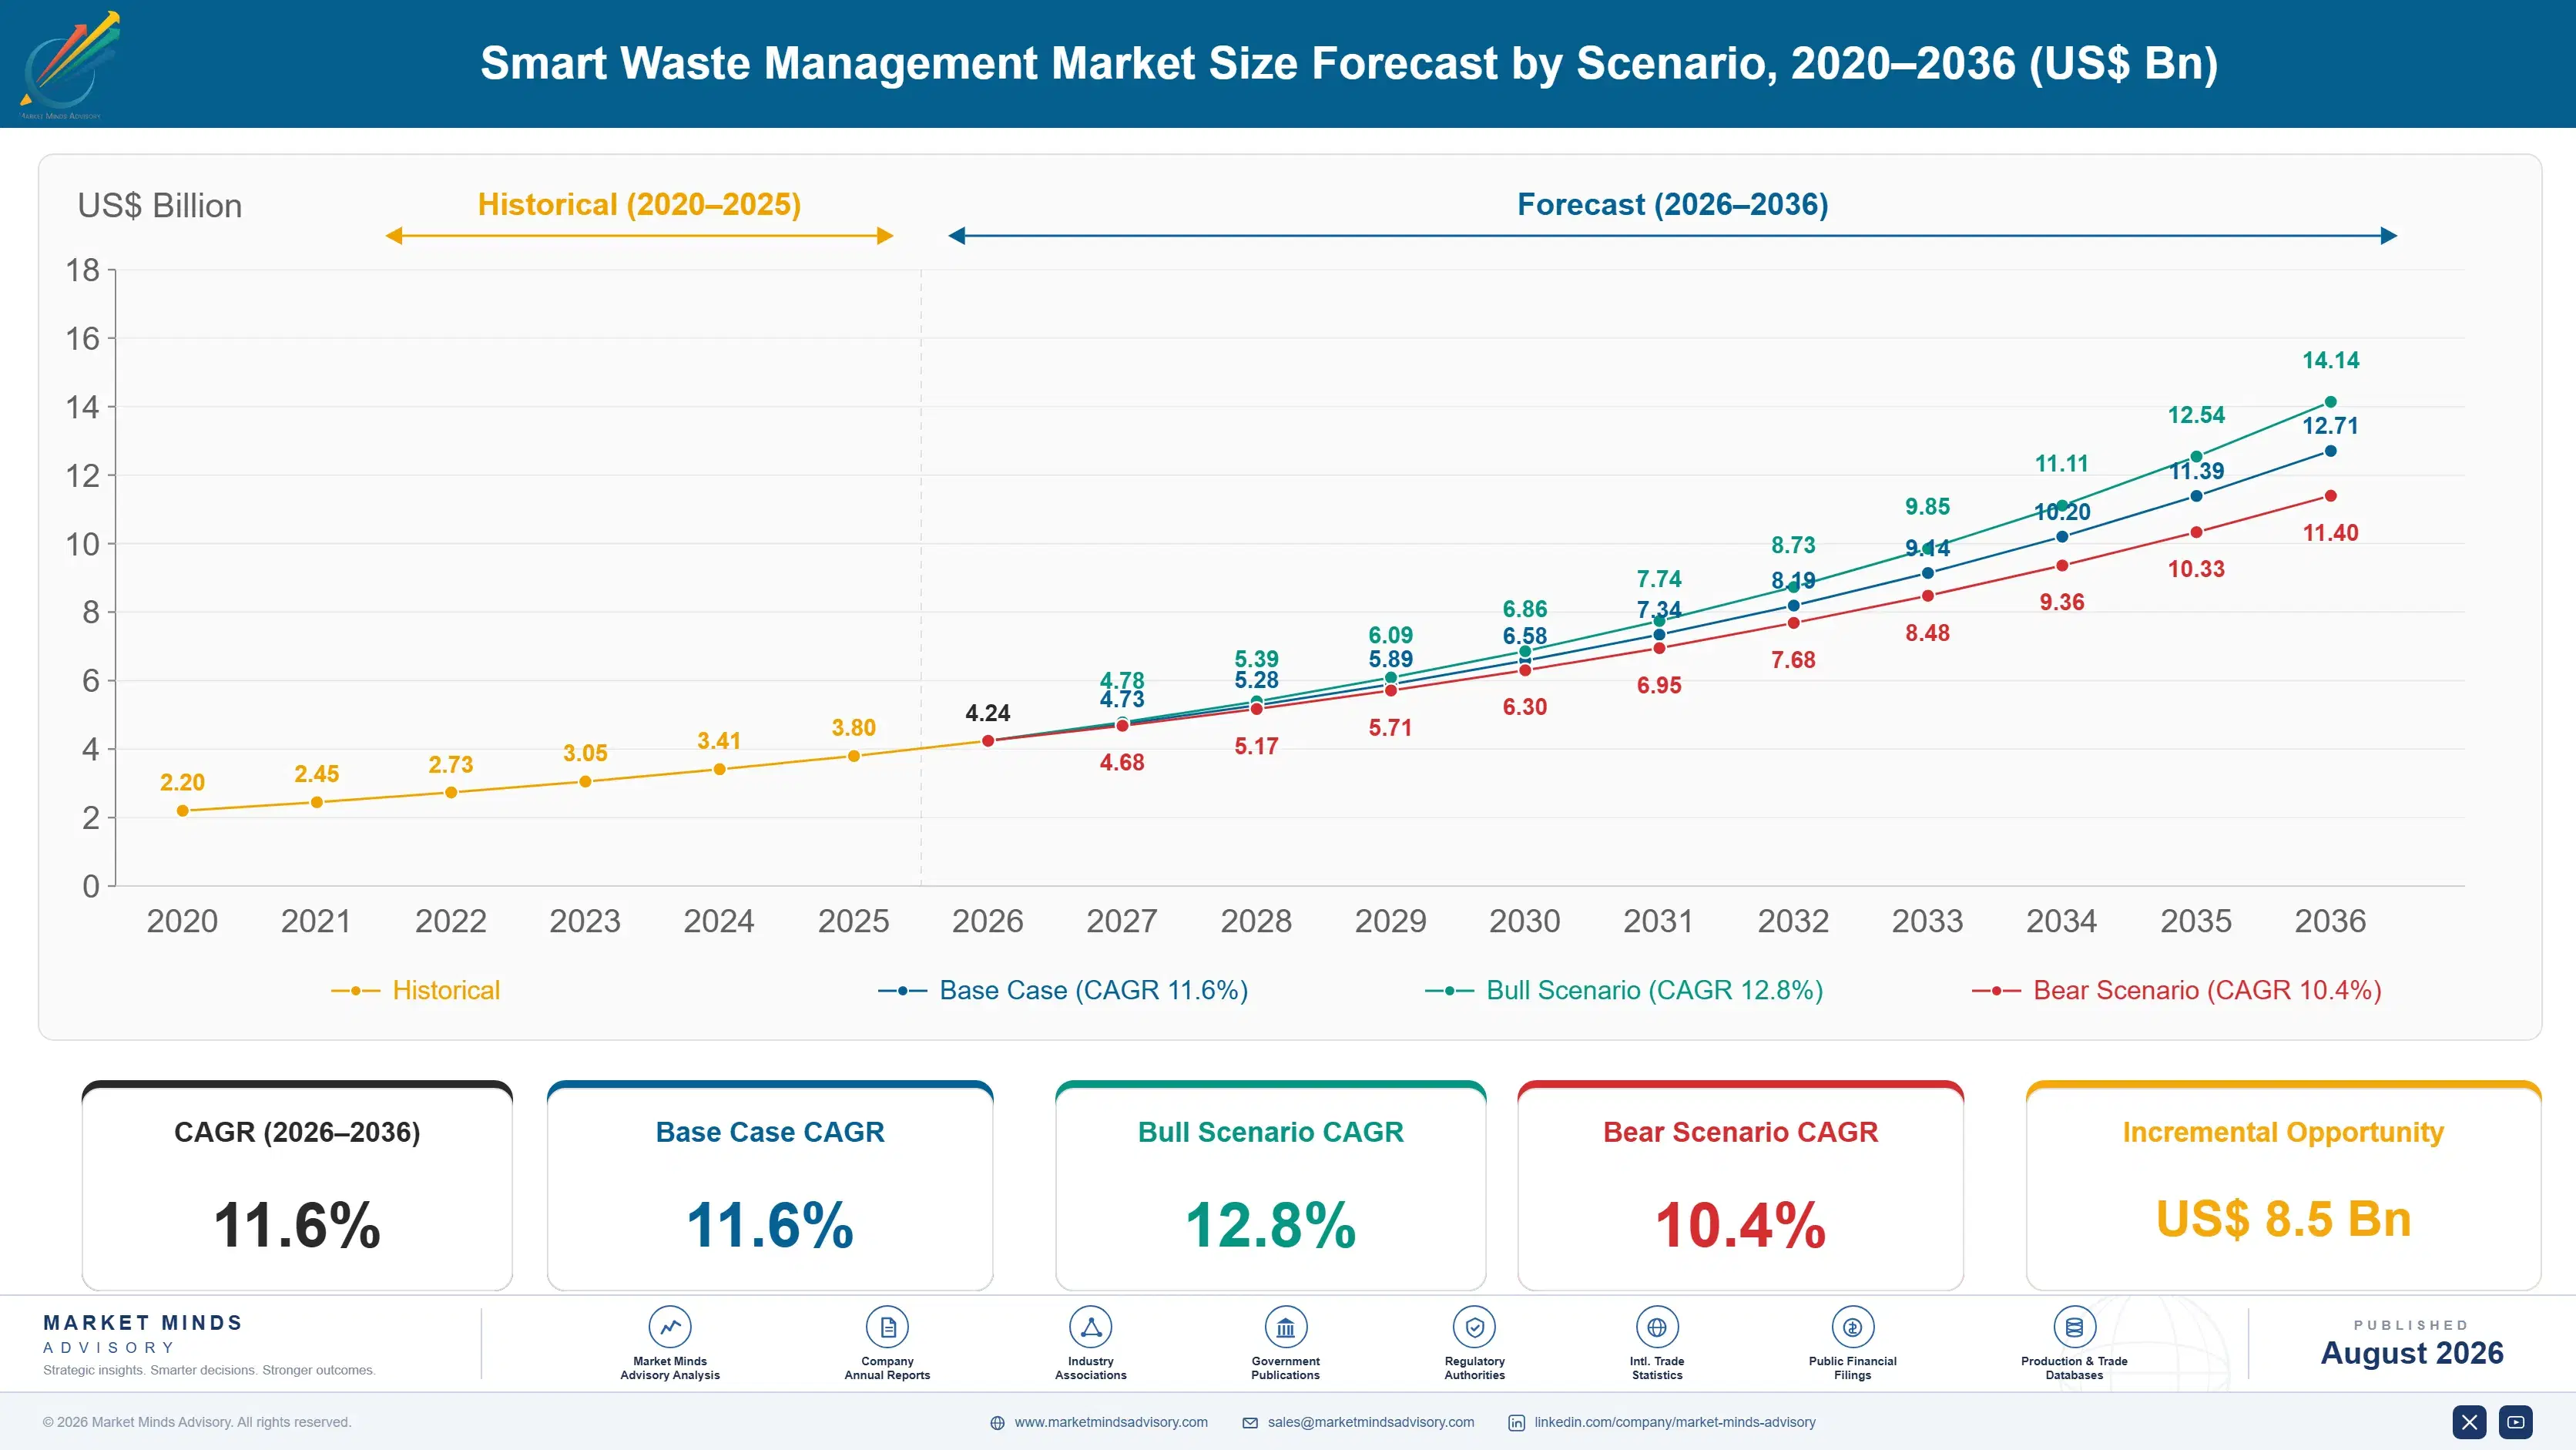
2025 MARKET VALUE$3.8BMarket Size 2025
2036 FORECAST VALUE$12.7BBase Case , 2026 to 2036
CAGR 2026 TO 203611.6 %Bull 12.8% / Bear 10.4%
INCREMENTAL OPPORTUNITY$8.5BNet 10- year value creation
EXPANSION MULTIPLE3.00x2036 value over 2026 base
Strategic Levers
M&A Pipeline
Regional Outlook
Country Rankings
Competitive Intelligence
Segmental Deep-dive
Call-Us : 91 93563 13602

Executive Snapshot and Market Trajectory

Cities buy sensors and then keep the same routes. Around 61% of deployed fill-level sensors feed dashboards nobody acts on, because collection contracts are written on fixed schedules and crew rosters that no dashboard has authority to change. The technology works. The operating model behind it does not.
Growth runs at 11.6%, and value is shifting decisively from hardware toward the software that actually redirects a truck. Route optimisation and fleet analytics grows fastest at 17.4%, exactly 1.50 times the market rate, because that is the layer where fuel and labour savings become real. East Asia holds the largest share at 29%, driven by dense urban collection where route inefficiency costs most per kilometre.
Concentration is low at 29% across the top five measured on annual recurring contracted revenue, split between waste haulers adding digital services, pure software vendors, and sensor manufacturers. Municipal procurement rules that require lowest-cost bidding on collection contracts remain the single largest obstacle to the savings this technology can demonstrate. Fleet telematics providers with no waste heritage are entering from the vehicle side. Independent software channels are also closing through acquisition.
Market Definition
This market covers hardware, software, and services that instrument, monitor, and optimise waste collection and processing operations, spanning fill-level sensing and container monitoring, route optimisation and fleet analytics software, weighing and identification systems on vehicles, sorting automation at material recovery facilities, and citizen-facing engagement and billing platforms. The underlying collection service itself, waste disposal fees, landfill and incineration operations, and general municipal enterprise software fall outside scope.
Base Year Value
$3.8B in 2025 (MMA Primary Research Dataset, August 2026)
Forecast Period
2026 to 2036, eleven discrete annual values
CAGR
11.6% base case. Bull 12.8%. Bear 10.4%.
Fastest Growth Segment
Route Optimisation and Fleet Analytics Software: 17.4% CAGR
Fastest Growth Country
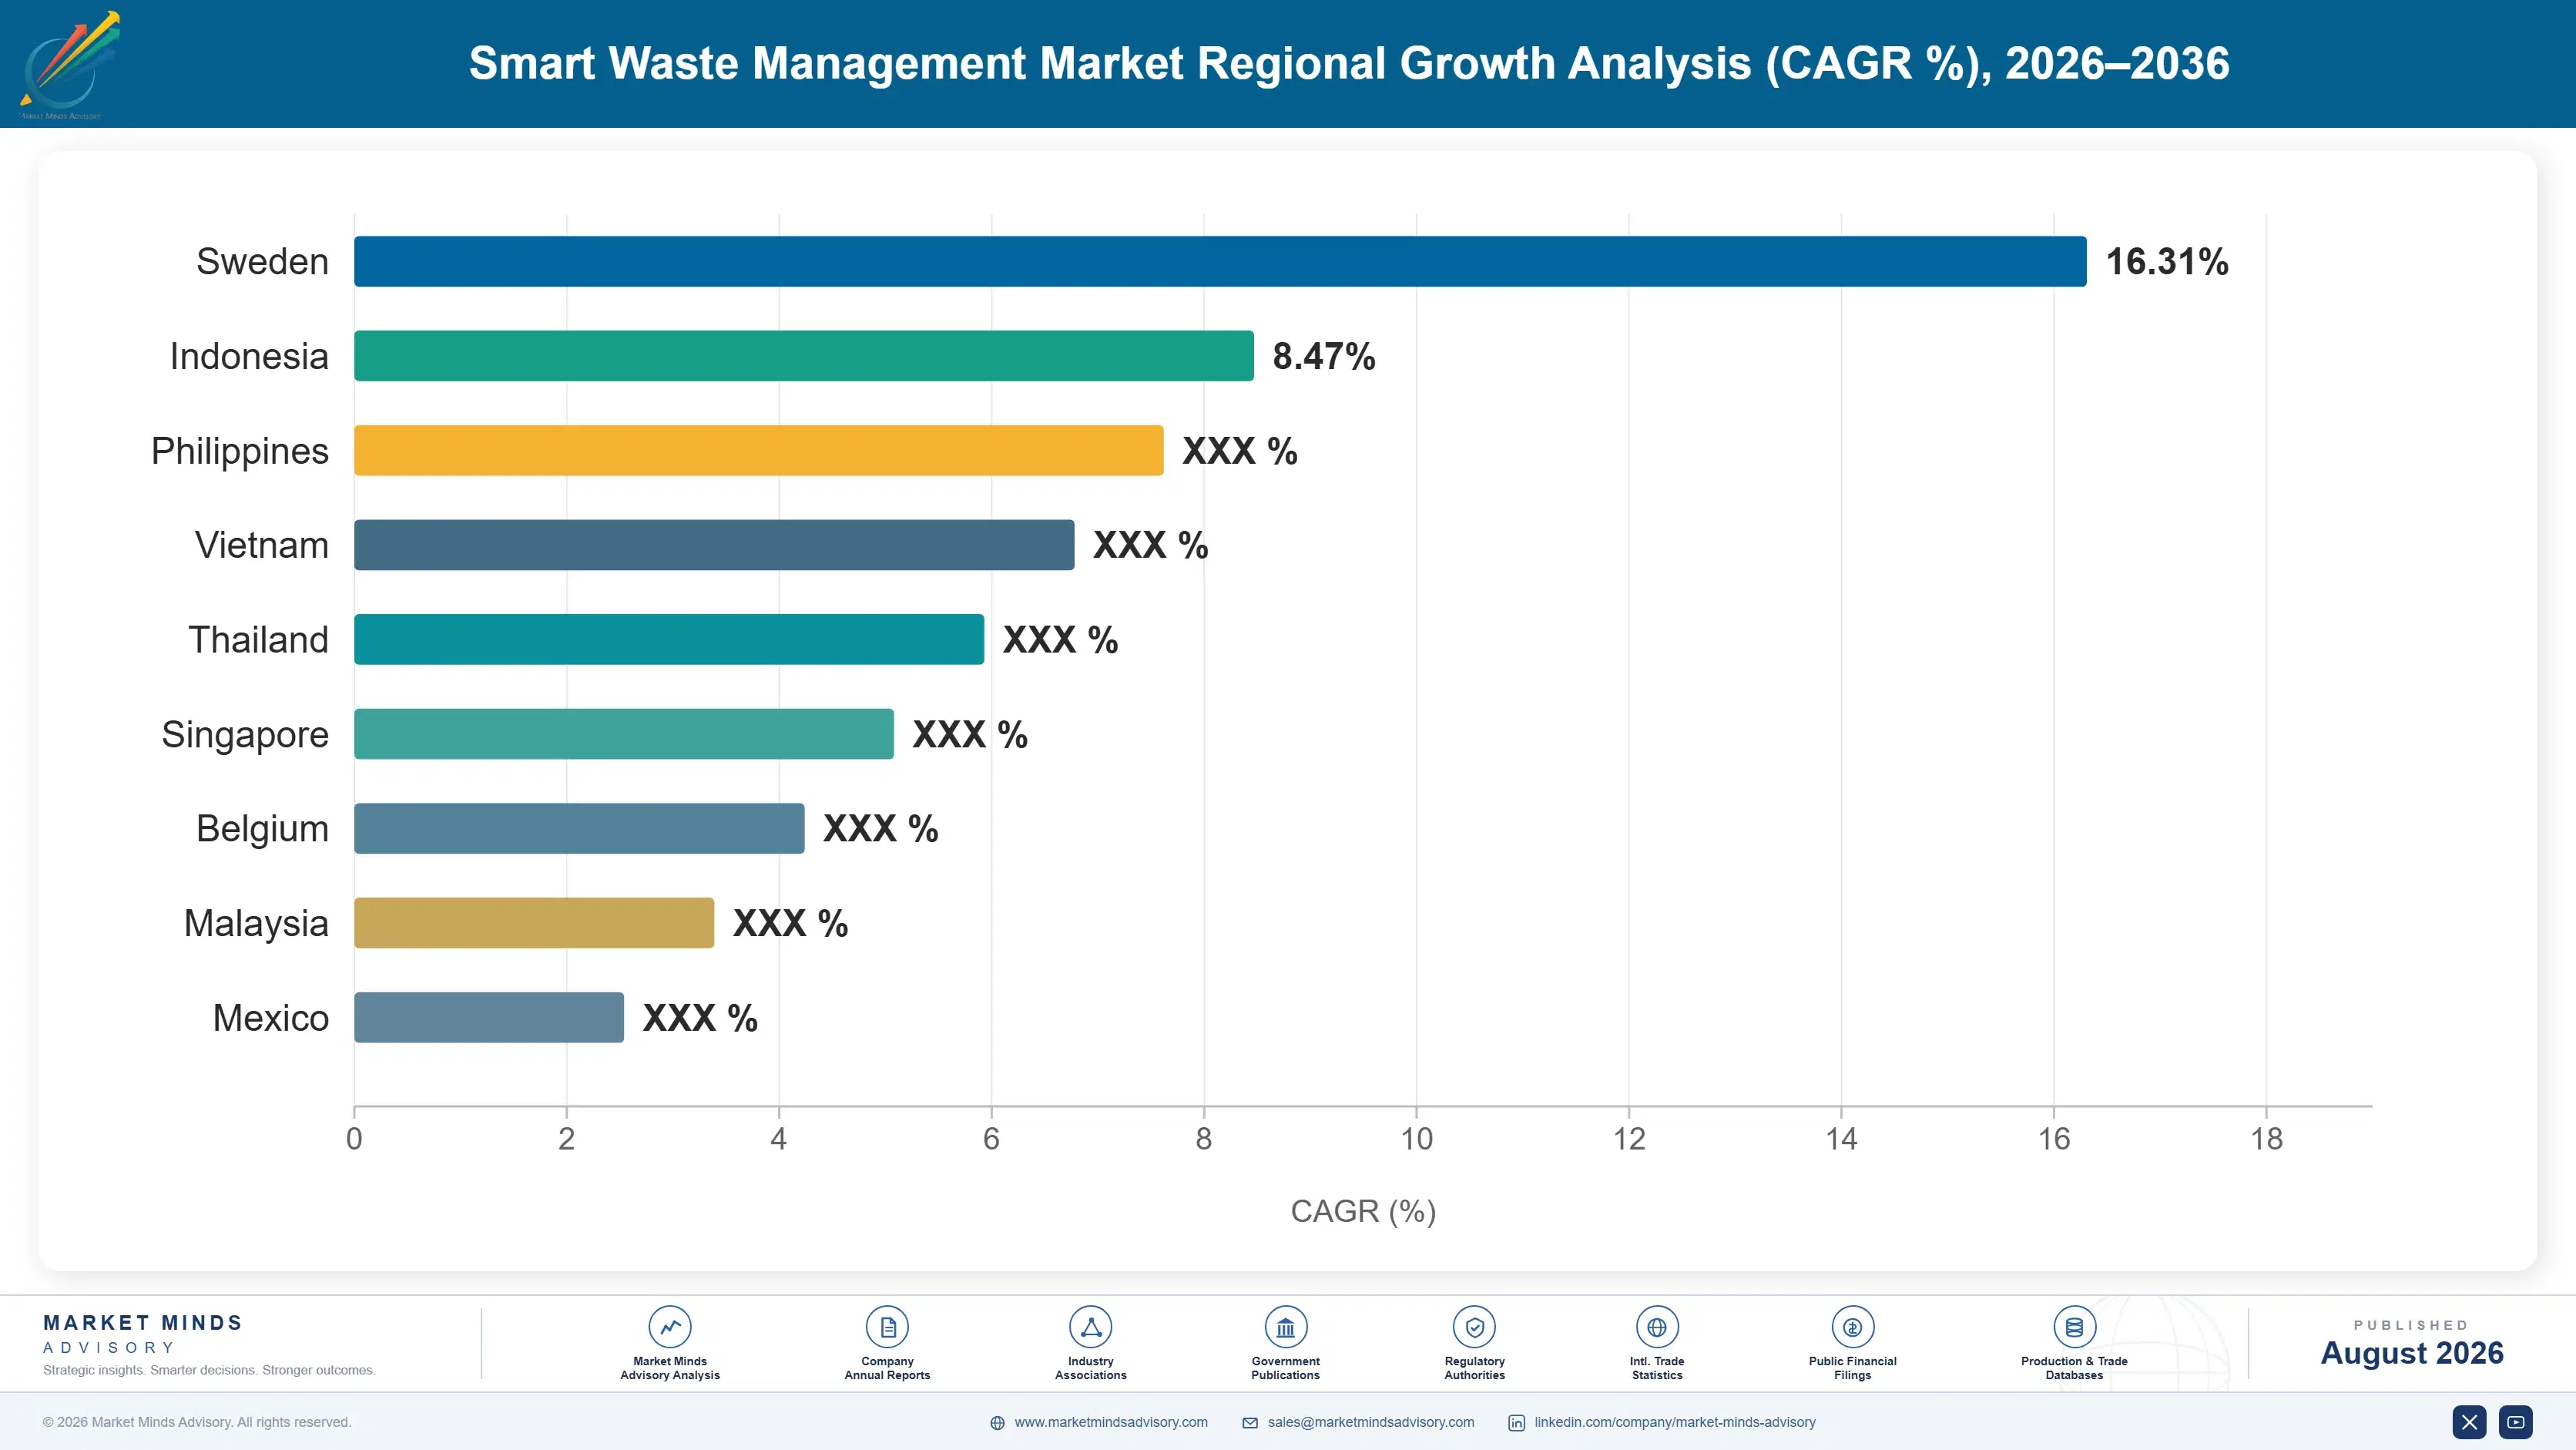
India: 14.2% CAGR
Fastest Growth Region
South Asia and Pacific: 13.8% CAGR
Largest Region
East Asia: 29% of 2025 global value
Market Leaders
Veolia, Enevo, Bigbelly, AMCS Group, Rubicon Technologies. Source: MMA Analysis based on company annual reports.
Primary Survey
n=3,800 procurement and R&D decision-makers, Q4 2025, six countries
Methodology
Demand-side build-up, cross-validated against public data, 47 expert interviews

Smart Waste Management Market Forecast Scenarios

smart-waste-management-market-size-forecast-scenario-1787300410370
The 2020 to 2025 period grew at 10.4% and was dominated by sensor deployment rather than by any operational change. Cities and haulers installed fill-level monitoring at pilot scale, generated data, and largely left collection schedules alone. Municipal budget pressure after 2022 forced a harder look at whether the pilots had saved anything, and several were quietly discontinued. The deployments that survived were the ones tied to a contract clause.
Three mechanisms carry the 11.6% base case. Contract restructuring is the largest, because performance-based collection contracts rather than fixed-schedule ones are what let a route actually change. Sorting automation at material recovery facilities is the second, where labour scarcity makes the business case without any municipal decision required. And extended producer responsibility reporting requirements are the third, since compliance demands measurement cities cannot produce manually. None requires any advance in sensing itself.
The 12.8% bull case rests on performance-based collection contracting spreading faster than expected, which would convert dormant sensor deployments into operational savings almost immediately. The 10.4% bear case is municipal capital budget compression, where waste technology competes against water and transit infrastructure and generally loses that argument because its savings arrive as avoided cost rather than visible service.

Data Nobody Has Authority to Use

The awkward figure in this market is that roughly 61% of deployed fill-level sensors report into dashboards that nobody acts on. This is not a technology failure. The sensors work, the data is accurate, and the fill levels are exactly what they claim. What is missing is anyone with authority to change a route, because it sits inside a seven-year contract on fixed weekly schedules with crew rosters negotiated separately.
DORMANT SENSOR SHARE61%Of deployed sensors feeding dashboards that change nothing
TOP FIVE CONCENTRATION29%Low, split across haulers, software vendors, and manufacturers
COLLECTION COST IN FUEL24%Of municipal collection operating cost consumed by vehicle fuel
TYPICAL CONTRACT LENGTH7 yearsLocking schedules and crew rosters against any optimisation change
SENSOR HARDWARE PRICE78 dollarsPer container unit, falling and no longer the obstacle
SORTING FACILITY LABOUR GAP22%Vacancy rate across manual sorting positions in recovery facilities
Hardware cost stopped being the obstacle several years ago. A container sensor now runs around 78 dollars per unit against several hundred a decade back, and connectivity costs have fallen alongside. That price decline pushed the sector into a strange position: the cheap part is fully solved and widely deployed, while the expensive part, renegotiating how collection is contracted and staffed, has barely started anywhere.
Where the technology does pay, it pays hard. Fuel is roughly 24% of municipal collection operating cost, and a route that skips half-empty containers cuts both fuel and vehicle hours immediately. Material recovery facilities tell a cleaner story still, because a 22% vacancy rate across manual sorting positions makes automation a staffing necessity rather than an efficiency argument requiring anybody's approval.
"A city showed me a beautiful dashboard with 4,000 containers on it, colour-coded, live. I asked what happened when a container turned red. Nothing happened. The truck came Tuesday because the truck comes Tuesday."
Principal, Urban Infrastructure Technology Practice · MMA Technology and Urban I

Market Trends

Value Migrates From Sensing To Route Decisions

Sensor hardware has commoditised toward roughly 78 dollars per container unit, and margin has followed the decision layer instead. Route optimisation and fleet analytics software grows at 17.4% against 11.6% for the market, because that is where fuel and vehicle hour savings become visible against roughly 24% of collection cost sitting in fuel alone. Hardware vendors without a software position are being reduced to component suppliers, and several have responded through acquisition rather than through internal development. Recurring software revenue also carries economics that hardware sales cannot approach at any volume. Component assemblers now compete directly on sensor price.
Market Impact: Sorting vacancy rate near 22%
Performance Contracts Replace Fixed Collection Schedules

Collection contracts running around seven years on fixed weekly schedules give nobody authority to skip a half-empty container, which is why roughly 61% of deployed sensors change nothing operationally. Municipalities rewriting contracts on service outcomes rather than on collection frequency create the authority that makes the data useful. The shift is slow because procurement rules, union agreements, and political risk all point the other way, and each renewal cycle takes years to arrive. Vendors tracking renewal calendars therefore convert at multiples of those selling on general municipal interest. Renewal windows are predictable years ahead.
Market Impact: Reporting required across 12 jurisdictions

Market Opportunities and Growth Drivers

Sorting Labour Scarcity Forces Automation Without Municipal Approval

Material recovery facilities carry vacancy rates around 22% across manual sorting positions, and the work is unpleasant enough that wage increases have not closed the gap in most markets. Optical sorting and robotic picking therefore get approved as a staffing response rather than as an efficiency project, which matters enormously because it bypasses the municipal decision-making that stalls collection-side deployment. Facility operators are private in most jurisdictions and can simply decide to buy. Producer responsibility reporting adds a second justification for the same equipment. Automated lines record material by stream in a way manual sorting never could.
Market Impact: About 61% of sensors dormant

Producer Responsibility Rules Demand Measurement Cities Lack

Extended producer responsibility schemes across Europe, Canada, and a growing set of American states require reporting on material recovered by stream and by volume, at a granularity manual weighbridge records cannot produce. Vehicle weighing systems, container identification, and facility-level material tracking become compliance infrastructure rather than optimisation tools. That reframing matters commercially, since compliance spending survives budget review in a way efficiency spending consistently does not. The same weighing and identification hardware serves optimisation and compliance equally well. Framing therefore decides which municipal budget line pays for it. Compliance lines survive review far more reliably.
Market Impact: Contracts run about 7 years

Market Restraints and Challenges

Sixty-One Percent Of Sensors Change Nothing At All

Roughly 61% of deployed fill-level sensors feed dashboards that never alter a collection route. The root cause is contractual rather than technical: collection runs on fixed schedules inside multi-year agreements, and no operations manager holds authority to skip a stop the contract specifies. Commercial impact is a reference base that demonstrates nothing, which makes the next city harder to sell. Mitigation runs through contract-linked deployment, where sensors are installed only alongside a renegotiated service agreement. Cities auditing what their pilots actually saved are now declining renewal on that basis. Renewal risk across the dormant base is substantial.
Market Impact: Software growing at 17.4%

Lowest-Cost Procurement Blocks The Savings Argument

Municipal procurement rules requiring award to the lowest compliant bid systematically disadvantage proposals carrying technology cost against a savings claim, since the savings are projected while the cost is immediate and certain. The root cause is procurement law written to prevent favouritism rather than to evaluate operating outcomes. Commercial impact is haulers stripping technology from bids to stay competitive. Mitigation runs through separate technology procurement, shared-savings structures, and pilot funding that sits outside the collection tender entirely. Separated technology tenders are appearing in several large municipalities and they work. Shared-savings structures remove the upfront line item entirely.
Market Impact: Contracts run about 7 years
4 additional market trends, 3 additional growth drivers, and 2 additional restraints and challenges are covered in the full report. Contact sales@marketmindsadvisory.com to access the complete intelligence.

Segment CAGR and Growth Architecture

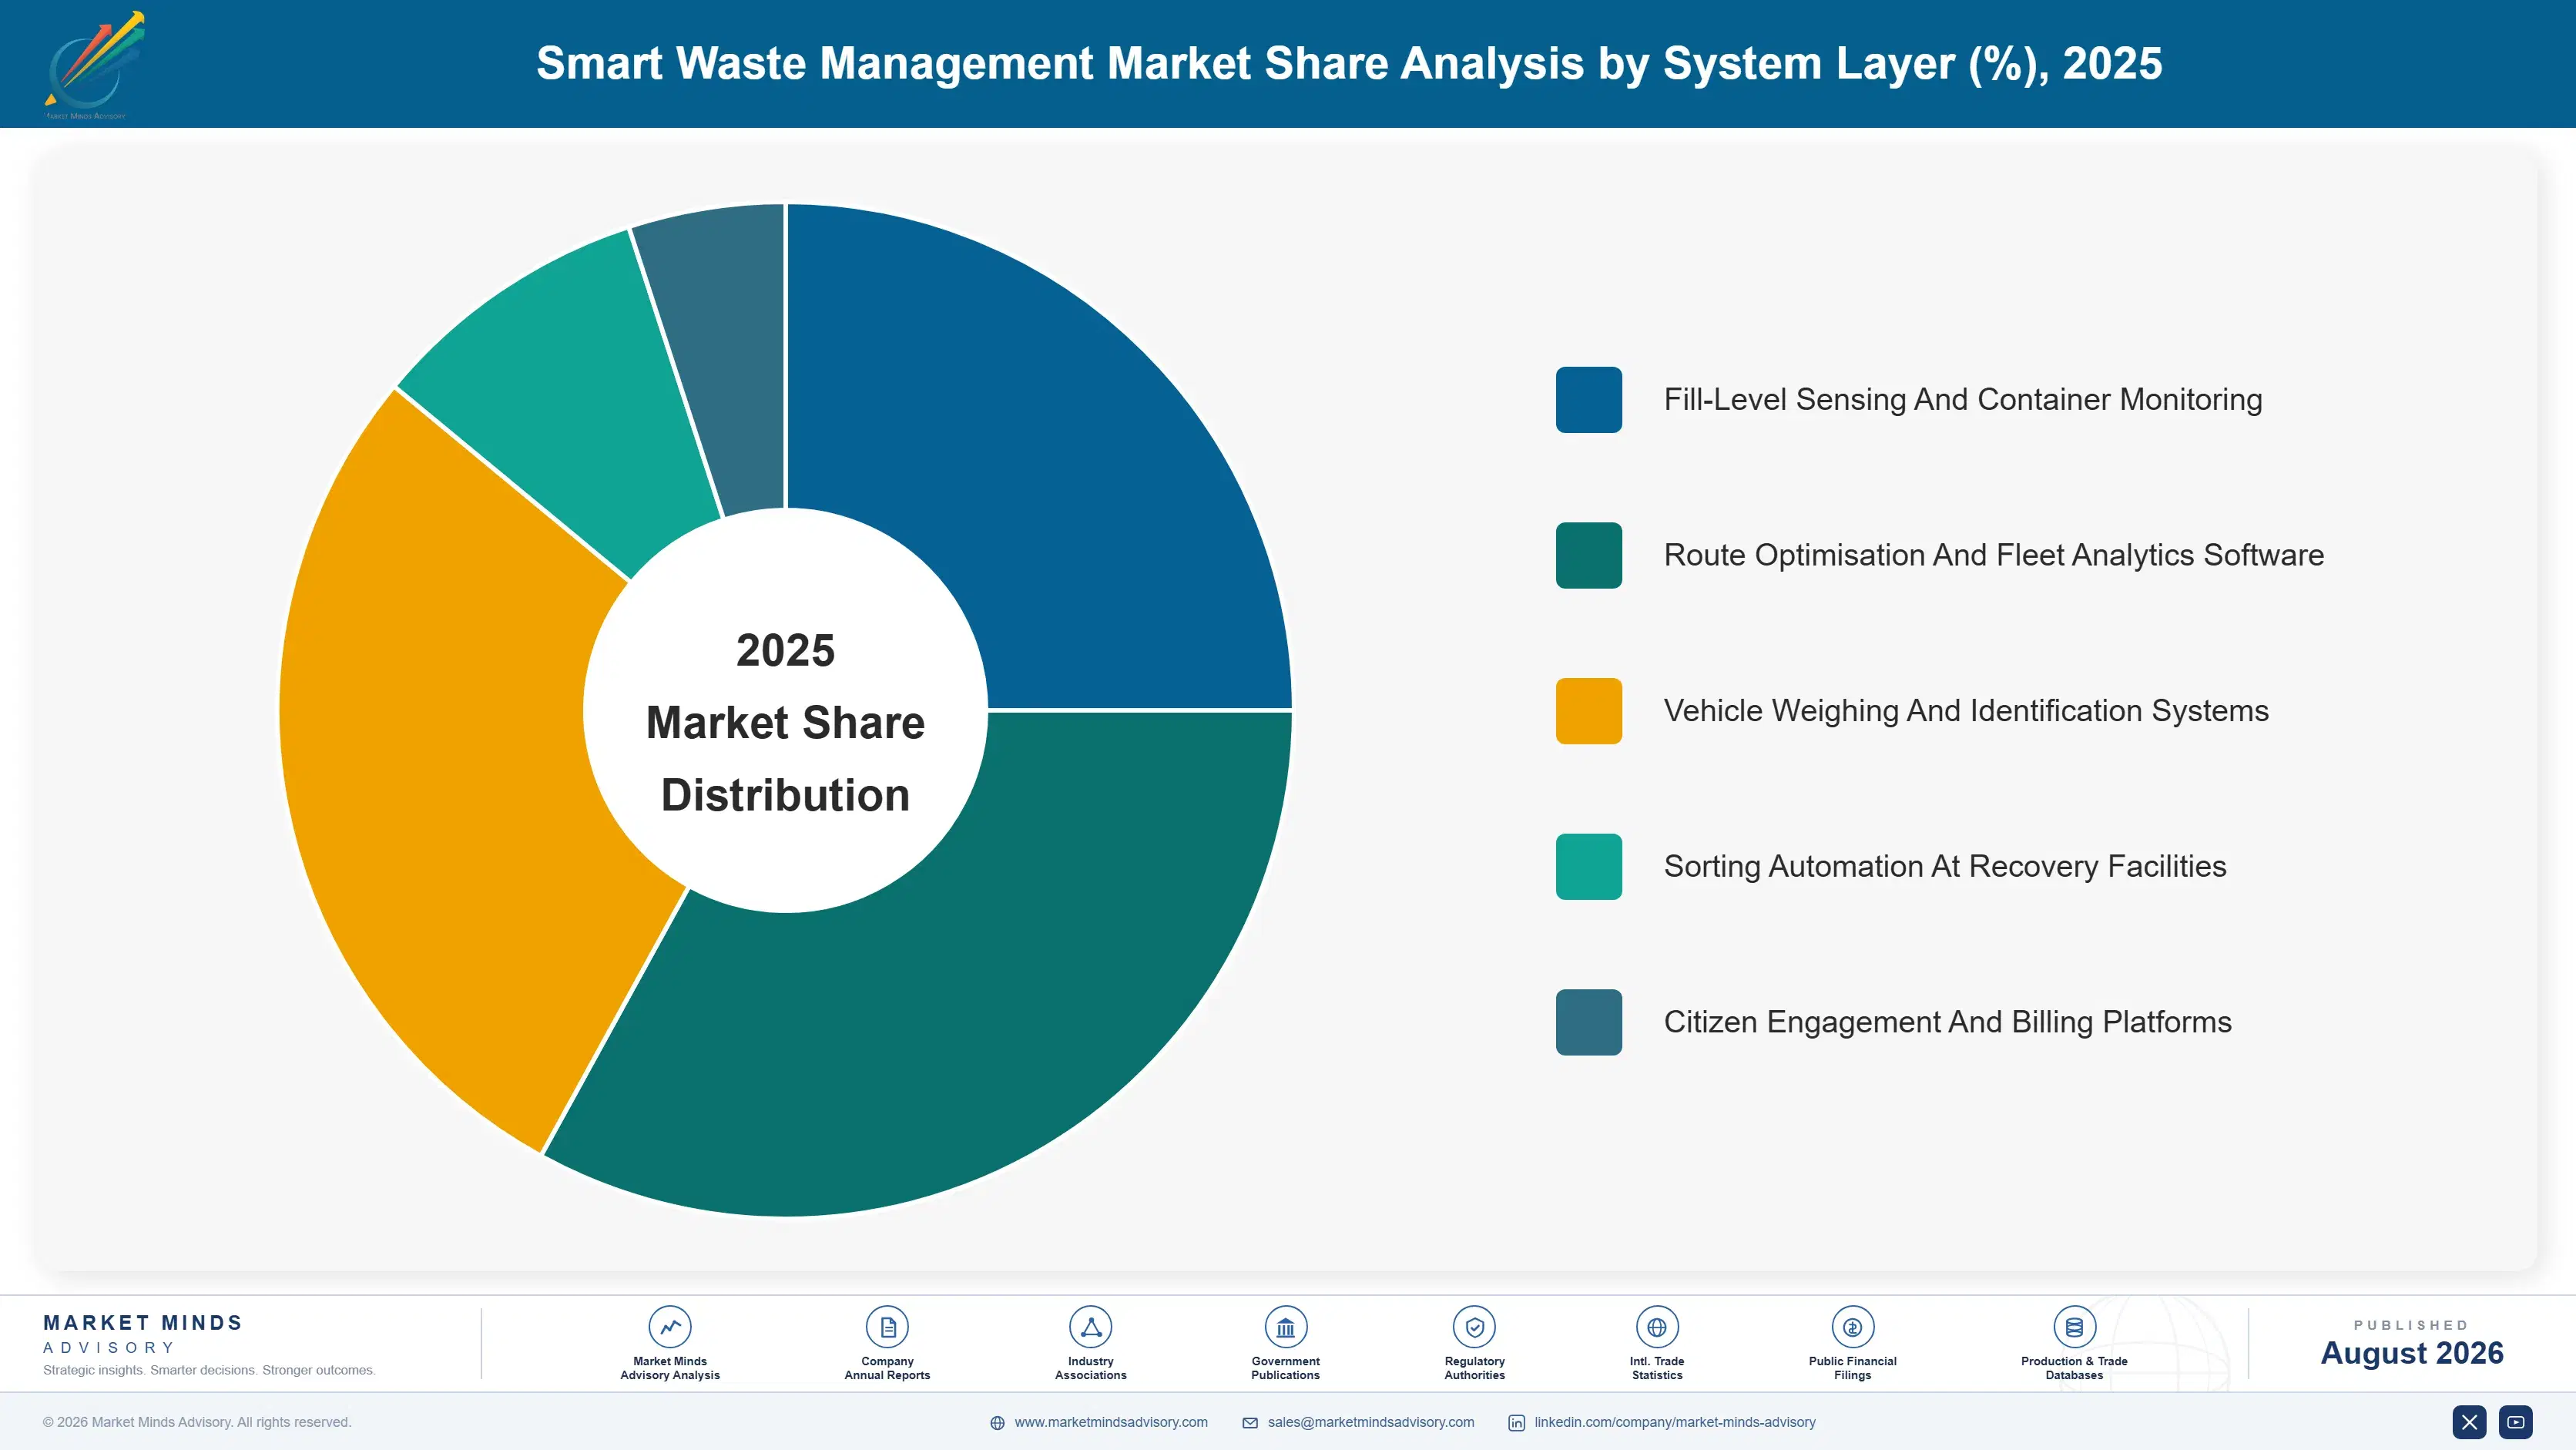
Segmentation here follows the functional layer of the system, because each separate layer carries quite different economics, a different buyer, and a different approval path inside a municipality or inside a private hauler. Layer determines that approval path more than anything else does, which makes deployment technology and end-user type considerably weaker primary dimensions.
smart-waste-management-market-market-share-analysis-1787300410941

Route Optimisation And Fleet Analytics Software

The fastest layer at 17.4%, exactly 1.50 times the market rate, and the only one where savings become genuinely visible on an operating budget. Fuel accounts for roughly 24% of municipal collection operating cost, and skipping half-empty containers reduces fuel and vehicle hours together. Recurring software revenue also carries far better economics than hardware sales that commoditised toward 78 dollars per unit. The constraint is authority rather than capability: without a contract permitting route change, the software produces recommendations that go nowhere and renewal becomes difficult to justify. Cities auditing dormant pilots are now declining renewal, which makes deployment timing commercially decisive. Contract renewal windows arrive about every seven years. Pipelines built against them convert far better.
CAGR 17.4%

Sorting Automation At Recovery Facilities

Second fastest at 15.8%, and commercially the easiest sale in this market because the buyer decides alone. Facility operators are private in most jurisdictions, face vacancy rates around 22% across manual sorting positions, and can approve optical sorting or robotic picking without municipal procurement involvement at all. Capital intensity is high and payback rests on labour cost avoided rather than on any projected efficiency. Producer responsibility reporting adds a second justification, since automated systems record material by stream in a way manual lines never could. Optical recognition accuracy and throughput rather than any software argument decide these competitions. Industrial equipment builders compete here against robotics specialists with no waste heritage. Payback periods are measured against wages avoided.
CAGR 15.8%
Full segment breakdown across 5 segments available in the complete report.

Regional Architecture and Country Demand Map

East Asia leads at 29% on dense urban collection where route inefficiency costs most per kilometre travelled, ahead of Western Europe on producer responsibility compliance and North America on private hauler investment. South Asia and Pacific grows fastest, from municipal systems being built rather than retrofitted.

East Asia

Twenty-nine percent, the largest share, and the reason is collection density rather than any policy programme. Japanese, Korean, and Chinese cities collect from container populations packed far more tightly than Western equivalents, which means route inefficiency costs more per kilometre and optimisation returns more per truck. Chinese municipal waste programmes have deployed container monitoring at a scale nothing elsewhere matches, tied to mandatory source separation rules that created a measurement requirement alongside. Japanese operators bring sorting automation with long industrial operating records. Growth at 12.6% runs above the market rate on continued Chinese municipal deployment. Source separation compliance created a measurement requirement that optimisation savings alone never would have. Deployment scale here has no equivalent elsewhere.
Share: 29% | CAGR: 12.6% (2026 to 2036)

Western Europe

Producer responsibility compliance drives this region far more than operating savings do, and 24% reflects that. Reporting obligations across German, French, Dutch, and Nordic schemes require material recovery data at granularity manual records cannot deliver, so weighing, identification, and facility tracking systems get bought as compliance infrastructure. Municipal collection contracting is also more flexible here than in North America, giving operations managers genuine authority to change routes. Sorting automation is well established at facility level. Growth at 10.2% is the slowest here, reflecting a mature deployment base rather than any weakening requirement. Compliance spending also survives municipal budget review far better than efficiency spending does. Facility-level material tracking is now effectively a qualifying requirement rather than a differentiator.
Share: 24% | CAGR: 10.2% (2026 to 2036)
Regional intelligence for 5 additional markets available in the complete report: North America, South Asia and Pacific, Latin America, Middle East and Africa, Eastern Europe. Contact sales@marketmindsadvisory.com.
smart-waste-management-market-country-cagr-analysis-1787300411455

Making The Data Actually Change Something

Roughly 61% of deployed sensors change nothing, collection contracts run about seven years, fuel is 24% of operating cost, and sorting vacancies sit near 22%. Value comes from selling into contract renewals, from targeting private haulers and facilities that decide alone, and from pricing on shared savings. Timing and buyer authority matter more here than product capability does.

Sell Into Contract Renewal Windows Only

A sensor deployed mid-contract cannot change a route, which is why roughly 61% of the installed base is dormant and why those references sell nothing. Deployments timed to collection contract renewal, where service terms are being rewritten anyway, arrive with the authority to act built in. Contracts run around seven years, so renewal windows are predictable and can be tracked years ahead. Pipeline built on renewal calendars rather than on general municipal interest converts at multiples of the alternative. Cities auditing dormant pilots now decline renewal, which makes mid-contract selling actively harmful.
Market Impact: Collection contracts renew on about 7 year cycles

Target Buyers Who Decide Without Procurement

Private haulers own their fleets and set their own routes, and material recovery facility operators face vacancy rates near 22% and can approve automation alone. Neither buyer needs a municipal tender, a council vote, or a union renegotiation to act. Municipal collection is the larger addressable base and the slower one by a wide margin. Commercial effort weighted toward buyers with unilateral authority produces revenue years earlier, and it builds the operating references municipalities later demand before committing. Municipal accounts renew at a fraction of the private hauler rate on current evidence.
Market Impact: Facility vacancy rates near 22% force these decisions

Price On Shared Savings Not On Licences

Lowest-cost procurement rules penalise any bid carrying visible technology cost against a projected saving, which is why haulers strip technology out to stay competitive on price. Shared-savings pricing, where the vendor takes a portion of verified fuel and vehicle hour reduction against roughly 24% of collection cost sitting in fuel, removes the upfront line item that loses tenders. It transfers performance risk to the party best able to manage it, and it requires measurement discipline most vendors currently lack. Verified route change is the reference that sells the next city anyway.
Market Impact: Fuel carries about 24% of collection operating cost

Position Reporting Systems As Compliance Infrastructure

Producer responsibility schemes across Europe, Canada, and a widening set of American states require material recovery reporting at granularity manual records cannot produce. Systems sold as compliance infrastructure survive budget review in a way efficiency projects consistently do not, because the alternative is a regulatory failure rather than a missed saving. The same weighing, identification, and tracking hardware serves both purposes. Framing determines which budget line pays, and the compliance line is far more durable through municipal budget compression. Reporting obligations now apply across roughly 12 separate jurisdictions and continue widening. Compliance budgets survive compression that efficiency budgets do not.
Market Impact: Reporting is mandated across roughly 12 jurisdictions now

Who Controls the Margin Pool

Concentration is low at 29% across the top five measured on annual recurring contracted revenue, and the fragmentation is genuine rather than transitional. Three different business models compete: waste haulers adding digital services to existing collection contracts, pure software vendors selling optimisation without owning trucks, and sensor manufacturers moving upward into analytics. None has established a position the others cannot contest, and the leader to challenger gap is narrow enough t
Competitive activity concentrates on three fronts. Access to collection contracts is the first, which strongly favours incumbent haulers who already hold the customer relationship. Sorting facility automation is the second, where industrial equipment builders compete on throughput and recognition accuracy rather than on any software argument. Compliance reporting capability is the third, and it is increasingly the qualifying requirement rather than a differentiator.

Pressure comes from two directions. Fleet telematics providers with no waste heritage are entering from the vehicle side, where route optimisation is a solved problem in other logistics sectors. And large haulers are acquiring software vendors outright rather than partnering, which removes independent channels quickly.

Rankings shift wherever contract renewal cycles cluster.
smart-waste-management-market-company-positioning-matrix-1787300411978

Competitive Moat and Risk Dimensions

VEOLIA

Moat: Contract base and operating scale

Holding collection and treatment contracts across thousands of municipalities gives an incumbent the one thing software vendors cannot buy, which is authority over the route being optimised. Technology deployed inside an existing service contract needs no separate procurement and no new supplier approval. That access advantage compounds every renewal cycle and is very difficult to attack from outside.
VEOLIA

Risk: Efficiency reduces own contract value

A hauler paid on collection frequency has limited incentive to prove that fewer collections are needed, which creates a genuine conflict at the heart of the offer. Municipalities increasingly recognise this and are separating technology procurement from service contracts. That separation removes exactly the access advantage the incumbent position rests on.
AMCS GROUP

Moat: Deep waste operations software

Software built specifically around waste collection workflows, weighing, billing, and compliance reporting handles operational detail that general fleet telematics platforms consistently underestimate. Container identification, material stream tracking, and producer responsibility reporting are not features that transfer easily from other logistics sectors. Replacing an embedded operations platform also carries migration risk customers avoid.
AMCS GROUP

Risk: Hauler acquisitions close the channel

Large waste companies acquiring software vendors outright rather than licensing removes independent distribution and turns former partners into competitors holding customer relationships. An independent vendor then faces buyers who own an internal alternative regardless of comparative capability. Channel access can disappear considerably faster than product advantage erodes.

Key Players

Veolia
Enevo
Bigbelly
AMCS Group
Rubicon Technologies

Others

SUEZ
Waste Management
Republic Services
Sensoneo
Ecube Labs
Compology
TOMRA
Machinex
AMP Robotics
ZenRobotics
Routeware
FCC Environment
Remondis
Nordsense
Evreka

Recent Developments

FEBRUARY 2025

Municipality separates technology procurement from collection tender

A large municipality tendered fill-level monitoring and route analytics separately from its collection service contract, removing the technology line item that had previously lost bids on price. The separation was a procurement policy change rather than any joint venture, acquisition, or partnership with a technology supplier.
Signal: Separating procurement removes the lowest-cost bidding obstacle that has quietly stalled most municipal deployment for years.
MAY 2025

Hauler acquires route optimisation software vendor outright

A large waste collection company acquired a route optimisation software vendor, bringing an independent platform in-house and ending its availability to competing haulers. The transaction was a full acquisition rather than an equity stake, joint venture, or commercial licensing arrangement between the two companies. Existing licensees were given notice.
Signal: Independent software channels are closing faster than product differentiation is eroding across this market right now.
SEPTEMBER 2025

Recovery facility commissions robotic sorting against staffing shortfall

A material recovery facility operator commissioned robotic picking across several sorting lines, citing persistent vacancies in manual sorting positions rather than any throughput or efficiency target. The investment was organic capital expenditure rather than a joint venture, acquisition, or shared arrangement with the equipment supplier.
Signal: Labour scarcity approves automation that efficiency arguments alone had failed to justify for years without argument.

Sensors, Connectivity and Field Labour

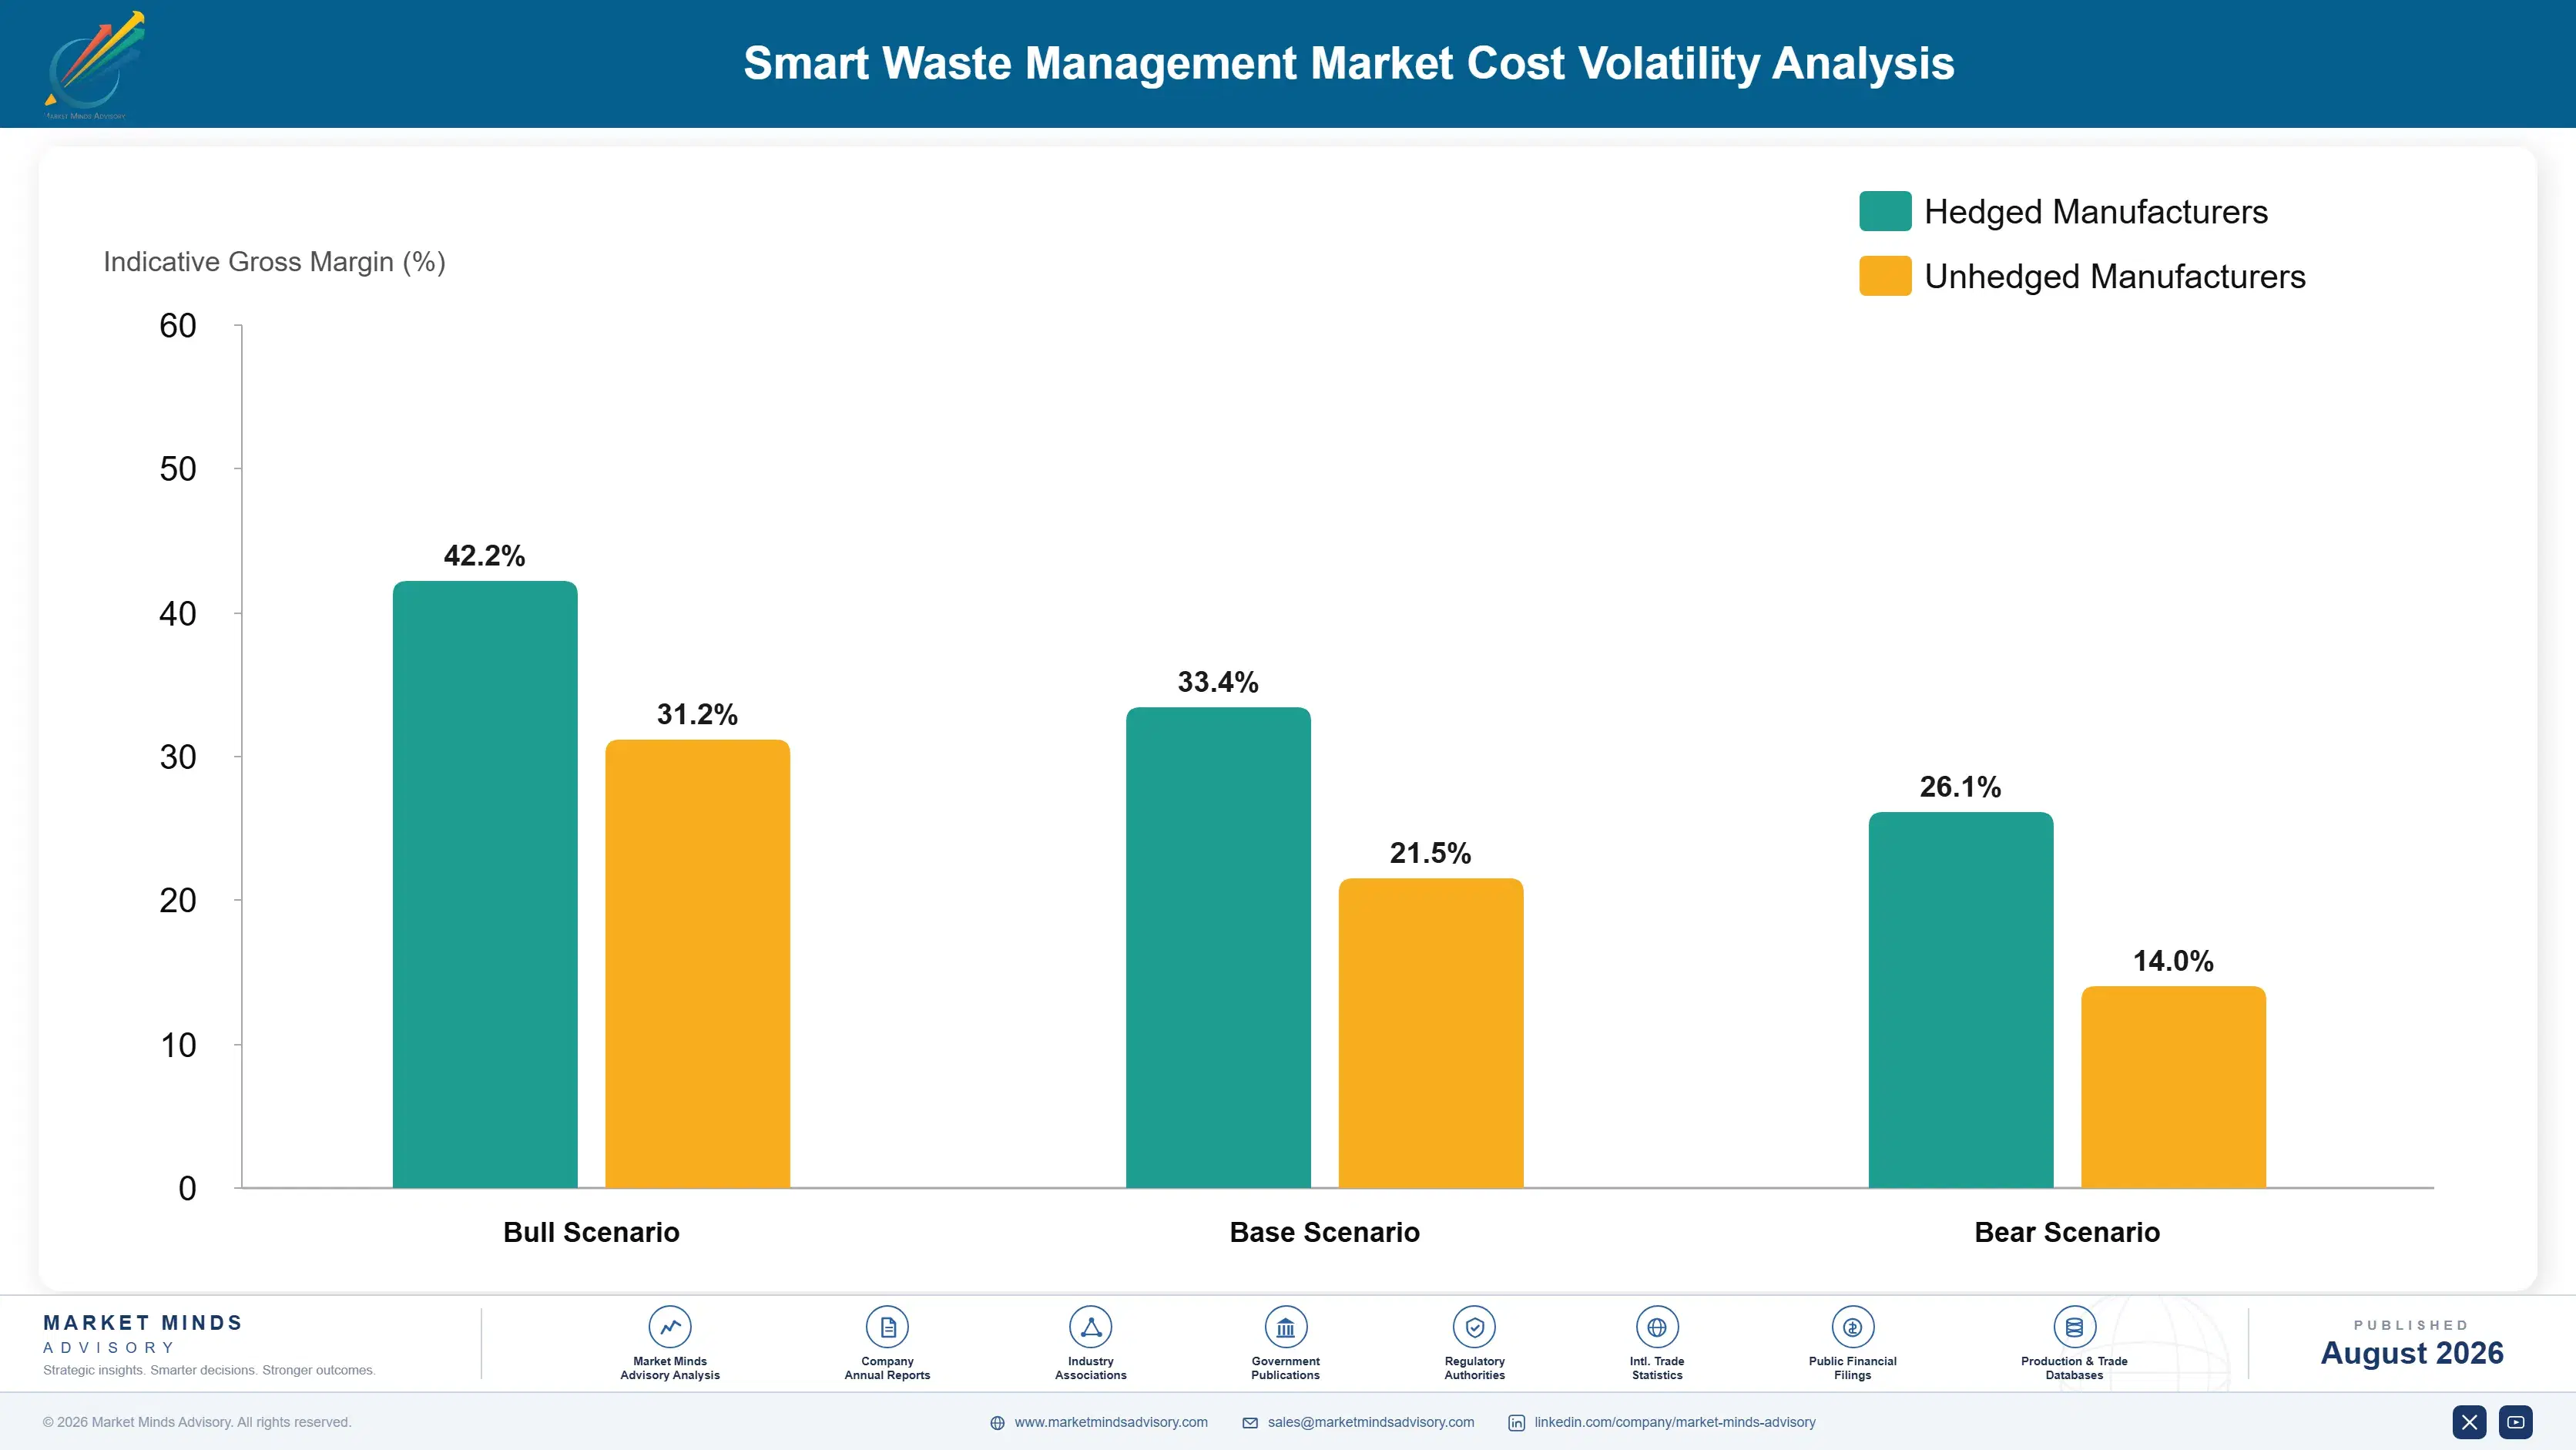
Hardware is no longer the dominant cost. Sensor units run around 78 dollars and account for roughly 18% of a deployment budget, while field installation labour carries about 27%, connectivity and data plans around 14%, and software development and support the balance. The cost structure inverted over the past decade as component prices fell and installation wages did not, which changed which suppliers hold pricing power.
Semiconductor supply disruption through 2021 and 2022 raised sensor component costs sharply and delayed deployments across the sector, with several vendors reporting extended lead times and margin compression in annual filings for those years. Connectivity pricing moved the other way as cellular network operators competed for low-bandwidth device traffic. Component availability has since normalised, and installation labour is now the input that reprices upward each year.

The competitive disadvantage mechanism runs through installation model rather than through component sourcing. Vendors dependent on subcontracted field crews carry full exposure to local labour rates and scheduling, and margins vary enormously between metropolitan markets. Those with hauler partnerships install during existing collection rounds at marginal cost. Geography matters more than scale here, since installation wages differ far more between cities than component prices differ between suppliers.
smart-waste-management-market-cost-volatility-analysis-1787300412173

Install during existing collection rounds rather than separately

Field installation labour carries roughly 27% of deployment cost, and dispatching dedicated crews to visit containers a truck already passes weekly is the largest avoidable expense in the model. Hauler partnerships allowing installation during scheduled rounds reduce that cost substantially. The arrangement requires crew training and a commercial agreement, and it removes the largest single exposure to local labour rates.

Design for battery life measured in years not months

Field visits to replace batteries repeat the installation cost that dominates this model, and a sensor requiring annual service costs more over its life than one costing twice as much upfront. Transmission frequency, not battery capacity, is the design variable that matters most. Fill levels change slowly enough that hourly reporting serves no operational purpose whatsoever.

Contract connectivity across the whole deployed fleet

Connectivity carries around 14% of deployment cost and is priced per device on most standard tariffs, which penalises vendors negotiating city by city rather than across their whole installed base. Fleet-level agreements with network operators competing for low-bandwidth device traffic reduce that meaningfully. Operators want the volume commitment and will price accordingly when a vendor can actually offer it.

Portfolio Architecture for Margin Defence

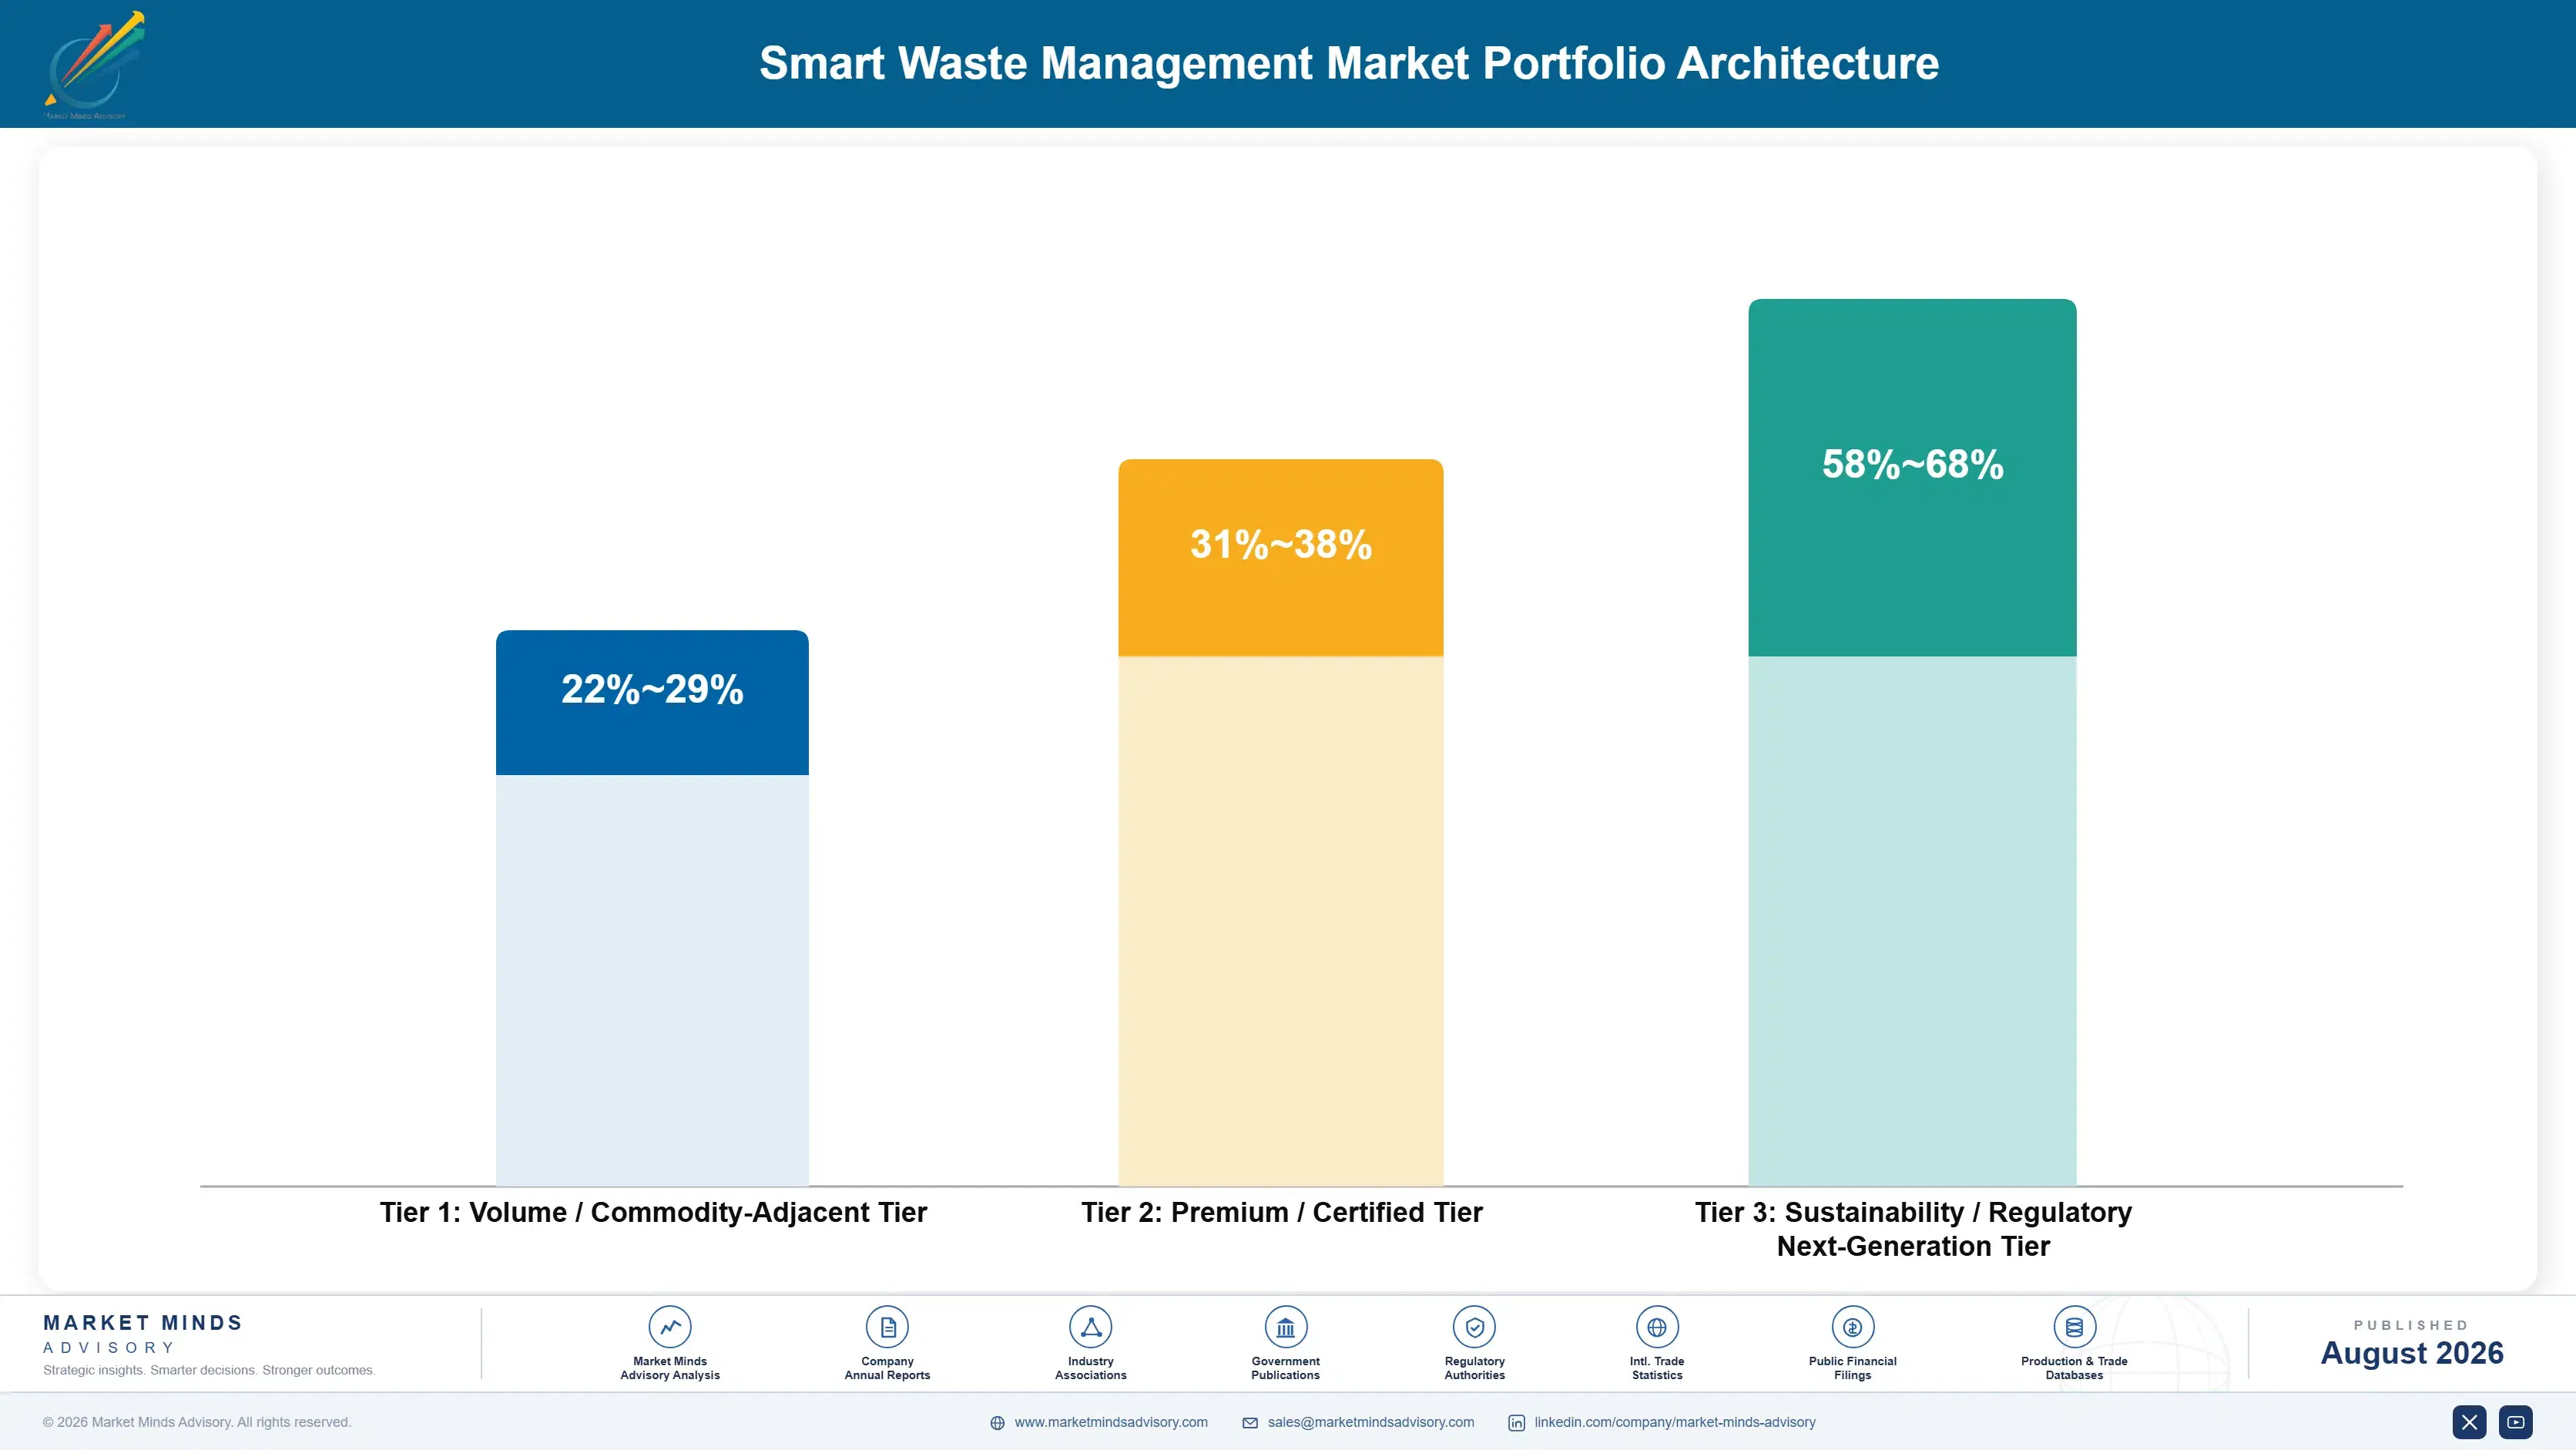
Three tiers describe this business and the margin spread across them is wide. Sensor hardware sits at the bottom, commoditised toward 78 dollars per unit with competition from component assemblers holding no waste knowledge at all. Installation and managed services occupy the middle, priced against local field labour that reprices upward every year. Software and analytics sit at the top, carrying recurring revenue economics that hardware sales cannot approach.
The tension is that hardware volume is what gets a vendor into a city, and software is what makes the account worth holding. Vendors who chased sensor volume without a software position ended up as component suppliers into other people's platforms. Those who led with software struggled to reach the containers at all. Almost every durable position in this market combines both, generally through partnership rather than through building the second capability.

High-value pools concentrate where the buyer decides alone and the saving is a wage rather than a projection. Recovery facility automation is the clearest example, since a 22% vacancy rate makes the case without anyone approving an efficiency argument. Compliance reporting installations pool value similarly, because removing them creates a regulatory exposure nobody will accept.

Volume / Commodity-Adjacent Tier

Fill-level sensors and container hardware commoditised toward 78 dollars per unit, competing against component assemblers with no waste-specific knowledge. Volume gets a vendor into a city and the margin does not sustain a business alone.
Gross Margin: 22-29%

Premium / Certified Tier

Installation, managed services, and compliance reporting delivery, priced against local field labour carrying roughly 27% of deployment cost. Margin varies widely between metropolitan markets according to wage rates rather than any vendor capability.
Gross Margin: 31-38%

Sustainability / Regulatory / Next-Generation Tier

Route optimisation, fleet analytics, and sorting automation software carrying recurring revenue economics. Best margin by a clear distance, because pricing follows demonstrated fuel and labour savings rather than any hardware bill of materials.
Gross Margin: 58-68%
smart-waste-management-market-portfolio-architecture-1787300412677

High-value Sub-segments and Strategic Watch-out

Route Optimisation And Fleet Analytics

Fastest growth at 17.4%, exactly 1.50 times the market rate, and the layer where savings against 24% fuel cost become visible. Recurring revenue economics far exceed hardware, and the binding constraint is contractual authority rather than technical capability. Dormant deployments across the installed base renew very poorly.
Gross Margin: 58-68%

Recovery Facility Sorting Automation

Strong growth at 15.8% and the easiest commercial sale here, because private facility operators approve capital alone against vacancy rates near 22%. Payback rests on labour cost avoided rather than on any projected efficiency requiring municipal agreement. Producer responsibility reporting supplies a second and separate justification.
Gross Margin: 58-68%

Container Sensing Hardware Volume

Commoditised toward 78 dollars per unit with margin under continued pressure from component assemblers. Still the entry point into a city and no longer a business on its own, which is why hardware-only vendors have been acquiring software capability. Volume still opens the account and no longer holds it.
Gross Margin: 22-29%

Dormant Municipal Sensor Installed Base

The strategic watch-out, since roughly 61% of deployed sensors change no route and generate references that demonstrate nothing to the next buyer. Renewal risk across that base is substantial once cities audit what their pilots actually saved. Contract-linked deployment remains the only remedy available here.
Gross Margin: 22-29%

Who Signs and Who Renews

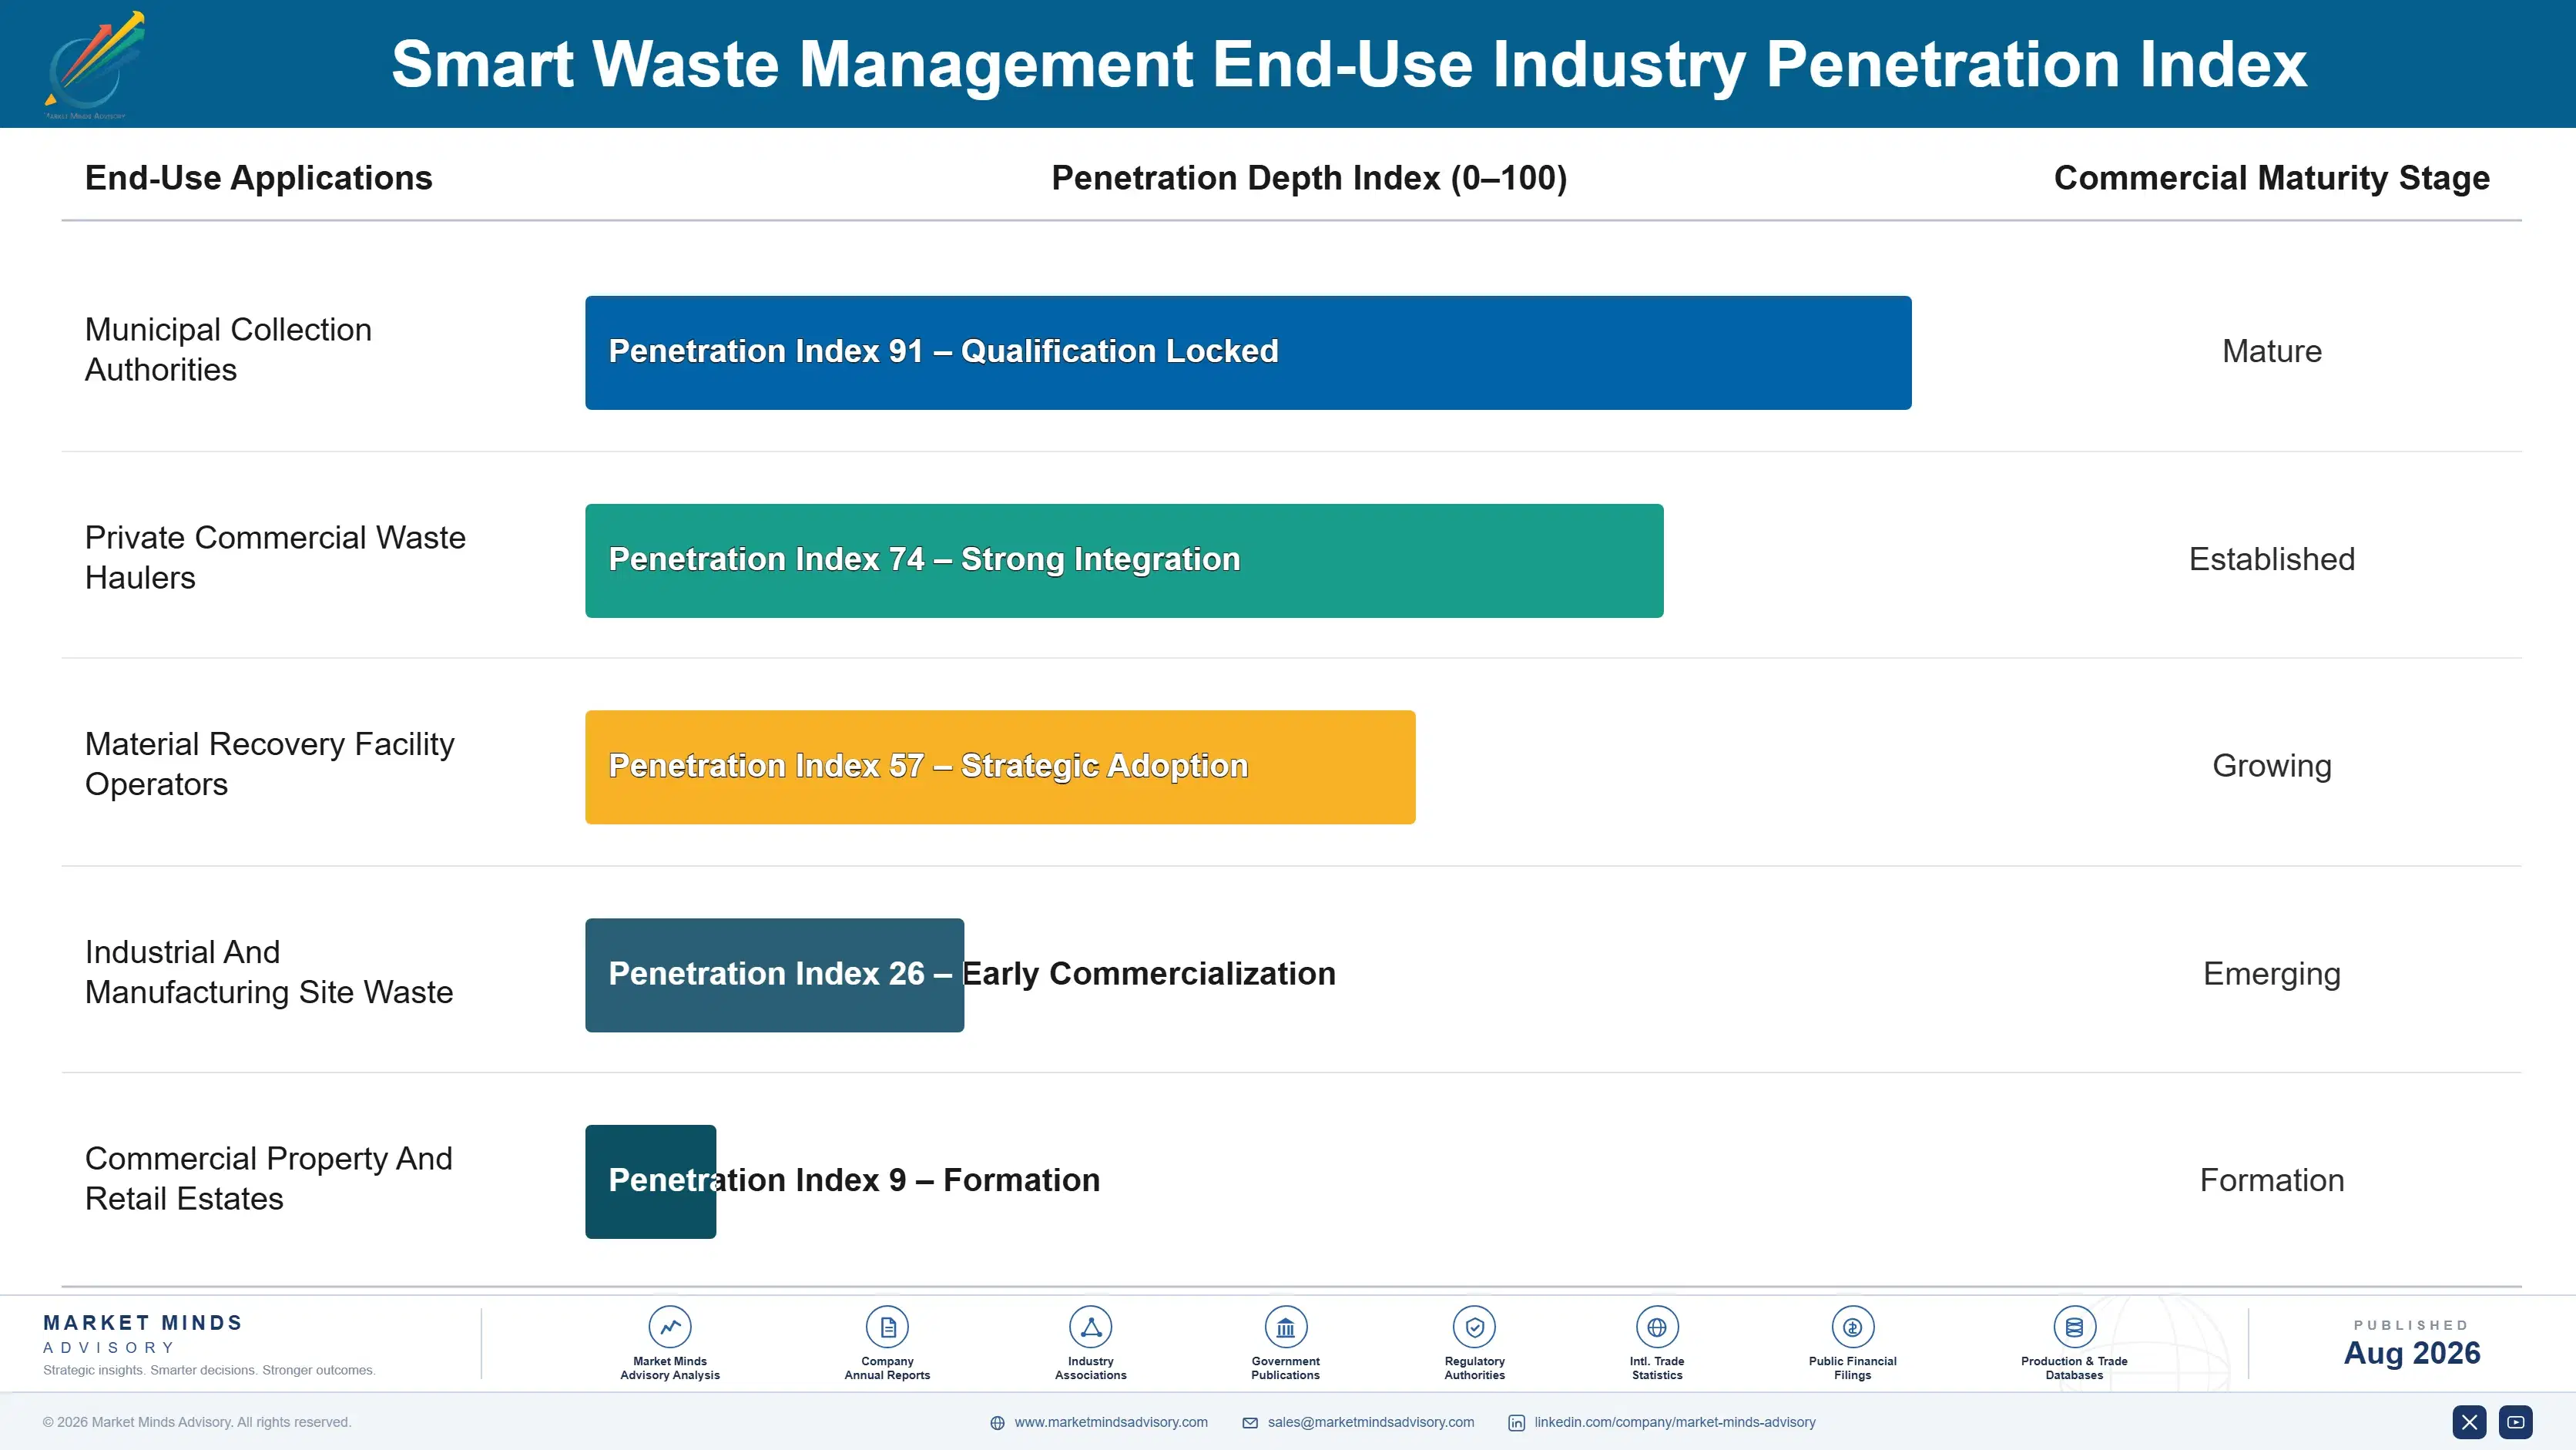
Revenue splits between one-time hardware and installation and a recurring software and connectivity stream, and the second is what makes an account valuable. Annuity economics work well where the software demonstrably changed something, since a city that cut vehicle hours will renew almost automatically. They work very badly across the dormant installed base, where renewal arrives as a budget line nobody can defend and the answer is frequently no.
Stickiness varies enormously by buyer. Private haulers and recovery facility operators embed these systems into daily operations, integrate them with billing and payroll, and effectively cannot remove them without disruption. Municipal collection deployments sit far looser, because a dashboard nobody acts on can be switched off without any operational consequence. Compliance reporting installations are the stickiest of all, since removing them creates a regulatory exposure.

Buyer profiles shifted as procurement moved out of sustainability offices and into operations and finance. The earlier buyer wanted a visible programme. The current one wants a verified saving or a compliance obligation discharged, and asks for reference data before signing anything. Reference data from comparable deployments has become the qualifying document in most competitive processes. Sustainability offices still influence and no longer decide.
smart-waste-management-market-end-use-penetration-index-1787300413164

What We Would Tell a Board

These are among the four positions where our research anticipates prominent divergence between winners and laggards over the coming forecast period. Each is grounded in the demand model, the regulatory perimeter, and the announced capacity pipeline.
01 / CONTRACT TIMING DISCIPLINE

Deploy at contract renewal or do not deploy

A sensor installed mid-contract cannot change a collection route, which is precisely why roughly 61% of the deployed base sits dormant today and generates references that sell nothing at all to the next city. Deployments timed to collection contract renewal arrive alongside rewritten service terms and therefore carry the authority to act on whatever the data shows. Collection contracts run about seven years, so renewal windows are entirely predictable and commercial pipelines can be built against them several years in advance.
02 / BUYER AUTHORITY SELECTION

Sell first to buyers who need nobody's permission

Private haulers own their fleets and set their own routes, and recovery facility operators facing vacancy rates near 22% can approve automation without any tender, council vote, or union renegotiation standing anywhere in the way. Municipal collection is the larger addressable base and by a wide margin the slower one to convert into actual revenue. Weighting commercial effort toward buyers with unilateral authority produces revenue years earlier, and it builds exactly the operating references municipalities later demand before they commit to anything.
03 / COMMERCIAL PRICING STRUCTURE

Shared savings beats a licence fee in tenders

Municipal lowest-cost procurement rules penalise every bid that carries a visible technology cost against a merely projected future saving, which is exactly why haulers strip technology out of their proposals to stay price competitive. Shared-savings pricing against the roughly 24% of collection cost sitting in fuel removes the upfront line item that loses tenders outright. It transfers performance risk to the party best placed to manage it, and it demands a measurement discipline that most vendors in this market currently lack entirely.
04 / COMPLIANCE BUDGET POSITIONING

Sell reporting as obligation not as efficiency

Producer responsibility schemes across Europe, Canada, and a widening set of American states now require material recovery reporting at a granularity that manual weighbridge records and sampling simply cannot substantiate. Systems positioned as compliance infrastructure survive municipal budget review in a way efficiency projects consistently do not, because the alternative is regulatory failure rather than a missed saving. The same weighing and identification hardware serves both purposes equally well, so framing alone decides which municipal budget line ends up paying for it.

Engagement Snapshot From the Field

A live engagement with an industry participant carrying material or product regulatory and market exposure ahead of a defining policy shift, showing how our research translates into a defensible multi-year portfolio strategy.
MARKET MINDS ADVISORY · CLIENT ENGAGEMENT SUMMARY
Smart Waste Management Producer Strategic Portfolio Review and Transition Roadmap 2026·Investment Scenario on Smart Waste Management Exposure Evaluation 2025-26
CLIENT PROFILE
A waste technology vendor with approximately 41 million dollars in annual revenue (client-reported, unverified by MMA), selling fill-level sensors and a route analytics platform across municipal and private hauler customers in two continents. Hardware carried the majority of revenue, software attach rates were low, and municipal renewal rates had fallen for two consecutive years without a clear explanation.
STRATEGIC CHALLENGE
Management attributed falling municipal renewals to competitive pricing pressure and proposed reducing hardware prices further. The board suspected the problem sat elsewhere and wanted an independent read on why deployed customers were not renewing, before committing to a price reduction that would remove most of the remaining hardware margin. Renewal behaviour differed sharply between customer types.
MMA APPROACH
We reviewed renewal outcomes across the full municipal installed base against whether each deployment had produced a documented route change. Collection contract terms and renewal dates were mapped for every account. Interviews covered operations managers rather than the sustainability offices that had originally purchased, and private hauler accounts were analysed separately for comparison.
KEY FINDINGS
  1. Municipal accounts that had never changed a collection route renewed at a small fraction of the rate seen among accounts with a documented route change.
  2. Nearly every non-renewing account had been sold mid-contract, with no mechanism available to alter collection schedules regardless of what the data showed.
  3. Private hauler accounts renewed at a far higher rate and carried software attach rates several times the municipal average across the base.
  4. Price was raised as an objection in a minority of lost accounts, well behind an inability to demonstrate any operational saving at all.
CLIENT PROFILE
A waste technology vendor with approximately 41 million dollars in annual revenue (client-reported, unverified by MMA), selling fill-level sensors and a route analytics platform across municipal and private hauler customers in two continents. Hardware carried the majority of revenue, software attach rates were low, and municipal renewal rates had fallen for two consecutive years without a clear explanation.
STRATEGIC CHALLENGE
Management attributed falling municipal renewals to competitive pricing pressure and proposed reducing hardware prices further. The board suspected the problem sat elsewhere and wanted an independent read on why deployed customers were not renewing, before committing to a price reduction that would remove most of the remaining hardware margin. Renewal behaviour differed sharply between customer types.
MMA APPROACH
We reviewed renewal outcomes across the full municipal installed base against whether each deployment had produced a documented route change. Collection contract terms and renewal dates were mapped for every account. Interviews covered operations managers rather than the sustainability offices that had originally purchased, and private hauler accounts were analysed separately for comparison.
KEY FINDINGS
  1. Municipal accounts that had never changed a collection route renewed at a small fraction of the rate seen among accounts with a documented route change.
  2. Nearly every non-renewing account had been sold mid-contract, with no mechanism available to alter collection schedules regardless of what the data showed.
  3. Private hauler accounts renewed at a far higher rate and carried software attach rates several times the municipal average across the base.
  4. Price was raised as an objection in a minority of lost accounts, well behind an inability to demonstrate any operational saving at all.
RECOMMENDED STRATEGY
Phase 1: Phase 1 (months one to six): halt the price reduction, map collection contract renewal dates across the municipal pipeline, and requalify accordingly. Phase 2: Phase 2 (months six to eighteen): weight commercial effort toward private haulers and recovery facilities, and rebuild pricing around shared savings. Phase 3: Phase 3 (months eighteen to thirty-six): re-enter municipal accounts at contract renewal with software-led offers rather than hardware volume. and verified savings.
OUTCOME
The price reduction was cancelled. Software attach rates on new accounts improved materially within two quarters as commercial effort shifted toward private haulers, and municipal pipeline was rebuilt against contract renewal calendars rather than general interest (client-reported, unverified by MMA). Hardware margin was preserved through the transition.

Frequently Asked Questions

Foundational context covering the market sizes, CAGR, scope, country, region and competition that inform every finding below. This section is provided to cover basics and most often pre-purchase conversations, answered from the MMA Primary Research Dataset.

What is the current size of the Smart Waste Management Market?

The market is valued at USD 3.8 billion in 2025, rising to USD 4.24 billion in 2026. Scope covers sensing, optimisation software, weighing, sorting automation, and citizen platforms, but not the collection service itself.

How large will the Smart Waste Management Market be by 2036?

MMA forecasts USD 12.71 billion by 2036, an increase of USD 8.47 billion over the 2026 base. That represents an expansion multiple of 3.00 times across the forecast period.

What is the CAGR for the Smart Waste Management Market 2026 to 2036?

The base case CAGR is 11.6%, with a bull case of 12.8% and a bear case of 10.4%. The historical rate from 2020 to 2025 was also 10.4%, dominated by sensor deployment rather than operational change.

Which segment is growing fastest?

Route optimisation and fleet analytics software at 17.4%, exactly 1.50 times the market rate. It is the layer where fuel and vehicle hour savings become visible on an operating budget.

Who are the major companies in the Smart Waste Management Market?

Veolia, Enevo, Bigbelly, AMCS Group, and Rubicon Technologies lead on annual recurring contracted revenue. The top five hold only 29%, and the field remains genuinely fragmented across three competing business models.

Which country is growing fastest?

India at 14.2%, where national urban sanitation programmes specify tracking, weighing, and monitoring into new collection systems from the outset. Building rather than retrofitting avoids the contract lock-in that stalls Western deployment.

Report Segmentation Architecture

The full report scope spans multiple orthogonal segmentation dimensions, with cross-tabulated demand data provided for each dimension pair. Coverage extends further to regional breakdowns, trend trajectories, and the competitive detail needed to support segment-level decision-making.

By System Layer

  • Fill-Level Sensing And Container Monitoring
  • Route Optimisation And Fleet Analytics Software
  • Vehicle Weighing And Identification Systems
  • Sorting Automation At Recovery Facilities
  • Citizen Engagement And Billing Platforms

By End-Use Industry

  • Municipal Collection Authorities
  • Private Commercial Waste Haulers
  • Material Recovery Facility Operators
  • Industrial And Manufacturing Site Waste
  • Commercial Property And Retail Estates

By Commercial Model

  • Capital Purchase With Support Contract
  • Subscription And Software As A Service
  • Shared Savings And Performance Pricing
  • Bundled Within Collection Service Contract
  • Compliance Reporting Managed Service

By Region

  • East Asia
  • Western Europe
  • North America
  • South Asia and Pacific
  • Latin America
  • Middle East and Africa
  • Eastern Europe

Scope, Methodology, and Coverage

Every figure in this report is reproducible from documented input assumptions. The scope below maps the historical period, the forecast horizon, the segmentation dimensions, and the countries covered, alongside the underlying primary and qualitative methodology.
Historical Period
2020 to 2025
Forecast Period
2026 to 2036
Base Year
2025 (USD billions; MMA Primary Research Dataset, August 2026)
Market Definition
This market comprises hardware, software, and services that instrument, monitor, and optimise waste collection and processing operations, measured at vendor revenue across capital sales, subscriptions, and managed service contracts. Coverage spans fill-level sensing and container monitoring, route optimisation and fleet analytics software, vehicle weighing and container identification systems, sorting automation at material recovery facilities, and citizen engagement and billing platforms. The underlying waste collection service, disposal and landfill fees, incineration and energy recovery operations, general municipal enterprise resource planning software, and industrial process waste treatment equipment fall outside scope.
Quantitative Units
USD billions (current prices); deployed sensor units; annual recurring contracted revenue; installed base by system layer
Segmentation Dimensions
By System Layer; By End-Use Industry; By Commercial Model; By Region
Regions Covered
East Asia, Western Europe, North America, South Asia and Pacific, Latin America, Middle East and Africa, Eastern Europe
Countries Covered
China, Japan, South Korea, Germany, France, Netherlands, United Kingdom, Sweden, United States, Canada, India, Australia, Brazil, Mexico, Saudi Arabia, United Arab Emirates, South Africa, Poland, Czechia, and additional markets relevant to this sector
Key Companies Profiled
Veolia, Enevo, Bigbelly, AMCS Group, Rubicon Technologies, SUEZ, Waste Management, Republic Services, Sensoneo, Ecube Labs, Compology, TOMRA, Machinex, AMP Robotics, ZenRobotics, Routeware, FCC Environment, Remondis, Nordsense, Evreka
Quantitative Methodology
Primary survey, n=3,800 respondents, Q4 2025, six countries; demand-side model with trade association cross-validation
Qualitative Methodology
47 expert interviews, Q4 2025; applied to validate demand model assumptions, identify emerging dynamics, and assess competitive positioning
Report Format
PDF and XLSX data workbook (Word format preview document)
Publisher
Market Minds Advisory
Report Code
MMA-2026-TEC-560
Published
August 2026
Contact
sales@marketmindsadvisory.com | www.marketmindsadvisory.com

Purchase the full Smart Waste Management Market Report (2026 to 2036).

The full report sizes smart waste management across five system layers, five end-use industries, five commercial models, and seven regions, with deployment mapped against whether it produced any operational change. Dormant installed base is quantified separately from active deployment, since the gap between the two describes this market more honestly than any growth rate does. Collection contract structures are analysed against renewal timing and the authority they grant. Competitive profiling covers twenty companies on annual recurring contracted revenue. Producer responsibility reporting requirements are tracked by jurisdiction.
Dormant installed base quantified separately from active deployment
Collection contract terms mapped against renewal timing windows
Deployment cost structure broken down by input category
Producer responsibility reporting requirements tracked across jurisdictions
Buyer authority analysed across municipal and private channels
Sorting automation payback modelled against facility vacancy rates

Built For The People Who Decide

From boardroom strategy to bench-side execution, this report is read cover-to-cover by leaders shaping the next decade of their industry, turning demand scenarios, market dynamics and valuation benchmarks into decisions.
CXOs/ Presidents/ VPs/ Managers
M&A and Corporate Development
Strategy Teams and R&D Heads
Procurement and Product Directors
Regulatory and Compliance Leaders
Investor Relations and Equity Analysts