Market Minds Advisory
Smart Urban Infrastructure Deployment Market

Smart Urban Infrastructure Deployment Market: Connected Traffic, Lighting, Utility, and Public Safety Systems for Cities.

Municipal budgets are shifting from standalone pilot projects toward citywide connected infrastructure programs, as video analytics, smart metering, and adaptive traffic systems mature enough for procurement officers to justify multi-year capital commitments confidently.

Lead Analyst

Published

September 2026

Make Smarter Decisions with Customized Research Insights

Request a free sample report and evaluate market opportunities, growth trends, and competitive dynamics relevant to your business needs.

2025 MARKET VALUE$28.0BMarket Size 2025
2036 FORECAST VALUE$84.0BBase Case , 2026 to 2036
CAGR 2026 TO 203610.5 %Bull 11.8% / Bear 9.2%
INCREMENTAL OPPORTUNITY$53.0BNet 10- year value creation
EXPANSION MULTIPLE2.71x2036 value over 2026 base
Strategic Levers
M&A Pipeline
Regional Outlook
Country Rankings
Competitive Intelligence
Segmental Deep-dive
Call-Us : 91 93563 13602

Executive Snapshot and Market Trajectory.

Smart urban infrastructure spending is transitioning from isolated pilot deployments toward integrated, citywide programs as procurement officers gain confidence that connected traffic, lighting, and utility systems deliver measurable operating savings rather than experimental technology risk that previous budget cycles treated with considerable caution. Analysts call this the single biggest shift.
Public safety and video analytics platforms are absorbing the largest share of new capital as cities pair camera networks with artificial intelligence software for incident detection, while environmental monitoring networks grow nearly as fast on the strength of new air quality regulation. East Asia and North America concentrate the bulk of citywide deployment spending, reflecting both government-directed smart city programs and large municipal capital budgets.
Competitive intensity remains moderate to high, with Siemens, Schneider Electric, and Cisco holding durable systems-integration advantages built on decades of municipal infrastructure relationships. Specialized software vendors focused purely on video analytics or traffic optimization are gaining share within specific solution categories, even as they lack the broad systems-integration scale of the largest incumbent vendors. Cities increasingly weigh a vendor's financing flexibility and analytics roadmap alongside pure hardware quality when awarding large procurement contracts.
Market Definition
The market covers hardware, software, and systems-integration services enabling connected traffic management, public lighting, water and utility metering, public safety analytics, environmental monitoring, and waste management infrastructure deployed by municipal and regional governments. It excludes private building automation, residential smart home devices, and standalone consumer-facing municipal mobile applications.
Base Year Value
$28.0B in 2025 (MMA Primary Research Dataset, September 2026)
Forecast Period
2026 to 2036, eleven discrete annual values
CAGR
10.5% base case. Bull 11.8%. Bear 9.2%.
Fastest Growth Segment
Public Safety and Video Analytics Platforms: 13.5% CAGR
Fastest Growth Country
China: 11.8% CAGR
Fastest Growth Region
South Asia and Pacific: 12.5% CAGR
Largest Region
East Asia: 28% of 2025 global value
Market Leaders
Siemens, Schneider Electric, Cisco, Huawei, IBM. Source: MMA Analysis based on company annual reports and municipal procurement disclosures.
Primary Survey
n=3,800 procurement and R&D decision-makers, Q4 2025, six countries
Methodology
Demand-side build-up, cross-validated against public data, 47 expert interviews

Smart Urban Infrastructure Deployment Market Forecast Scenarios

smart-urban-infrastructure-deployment-size-forecast-scenario-1790001848761
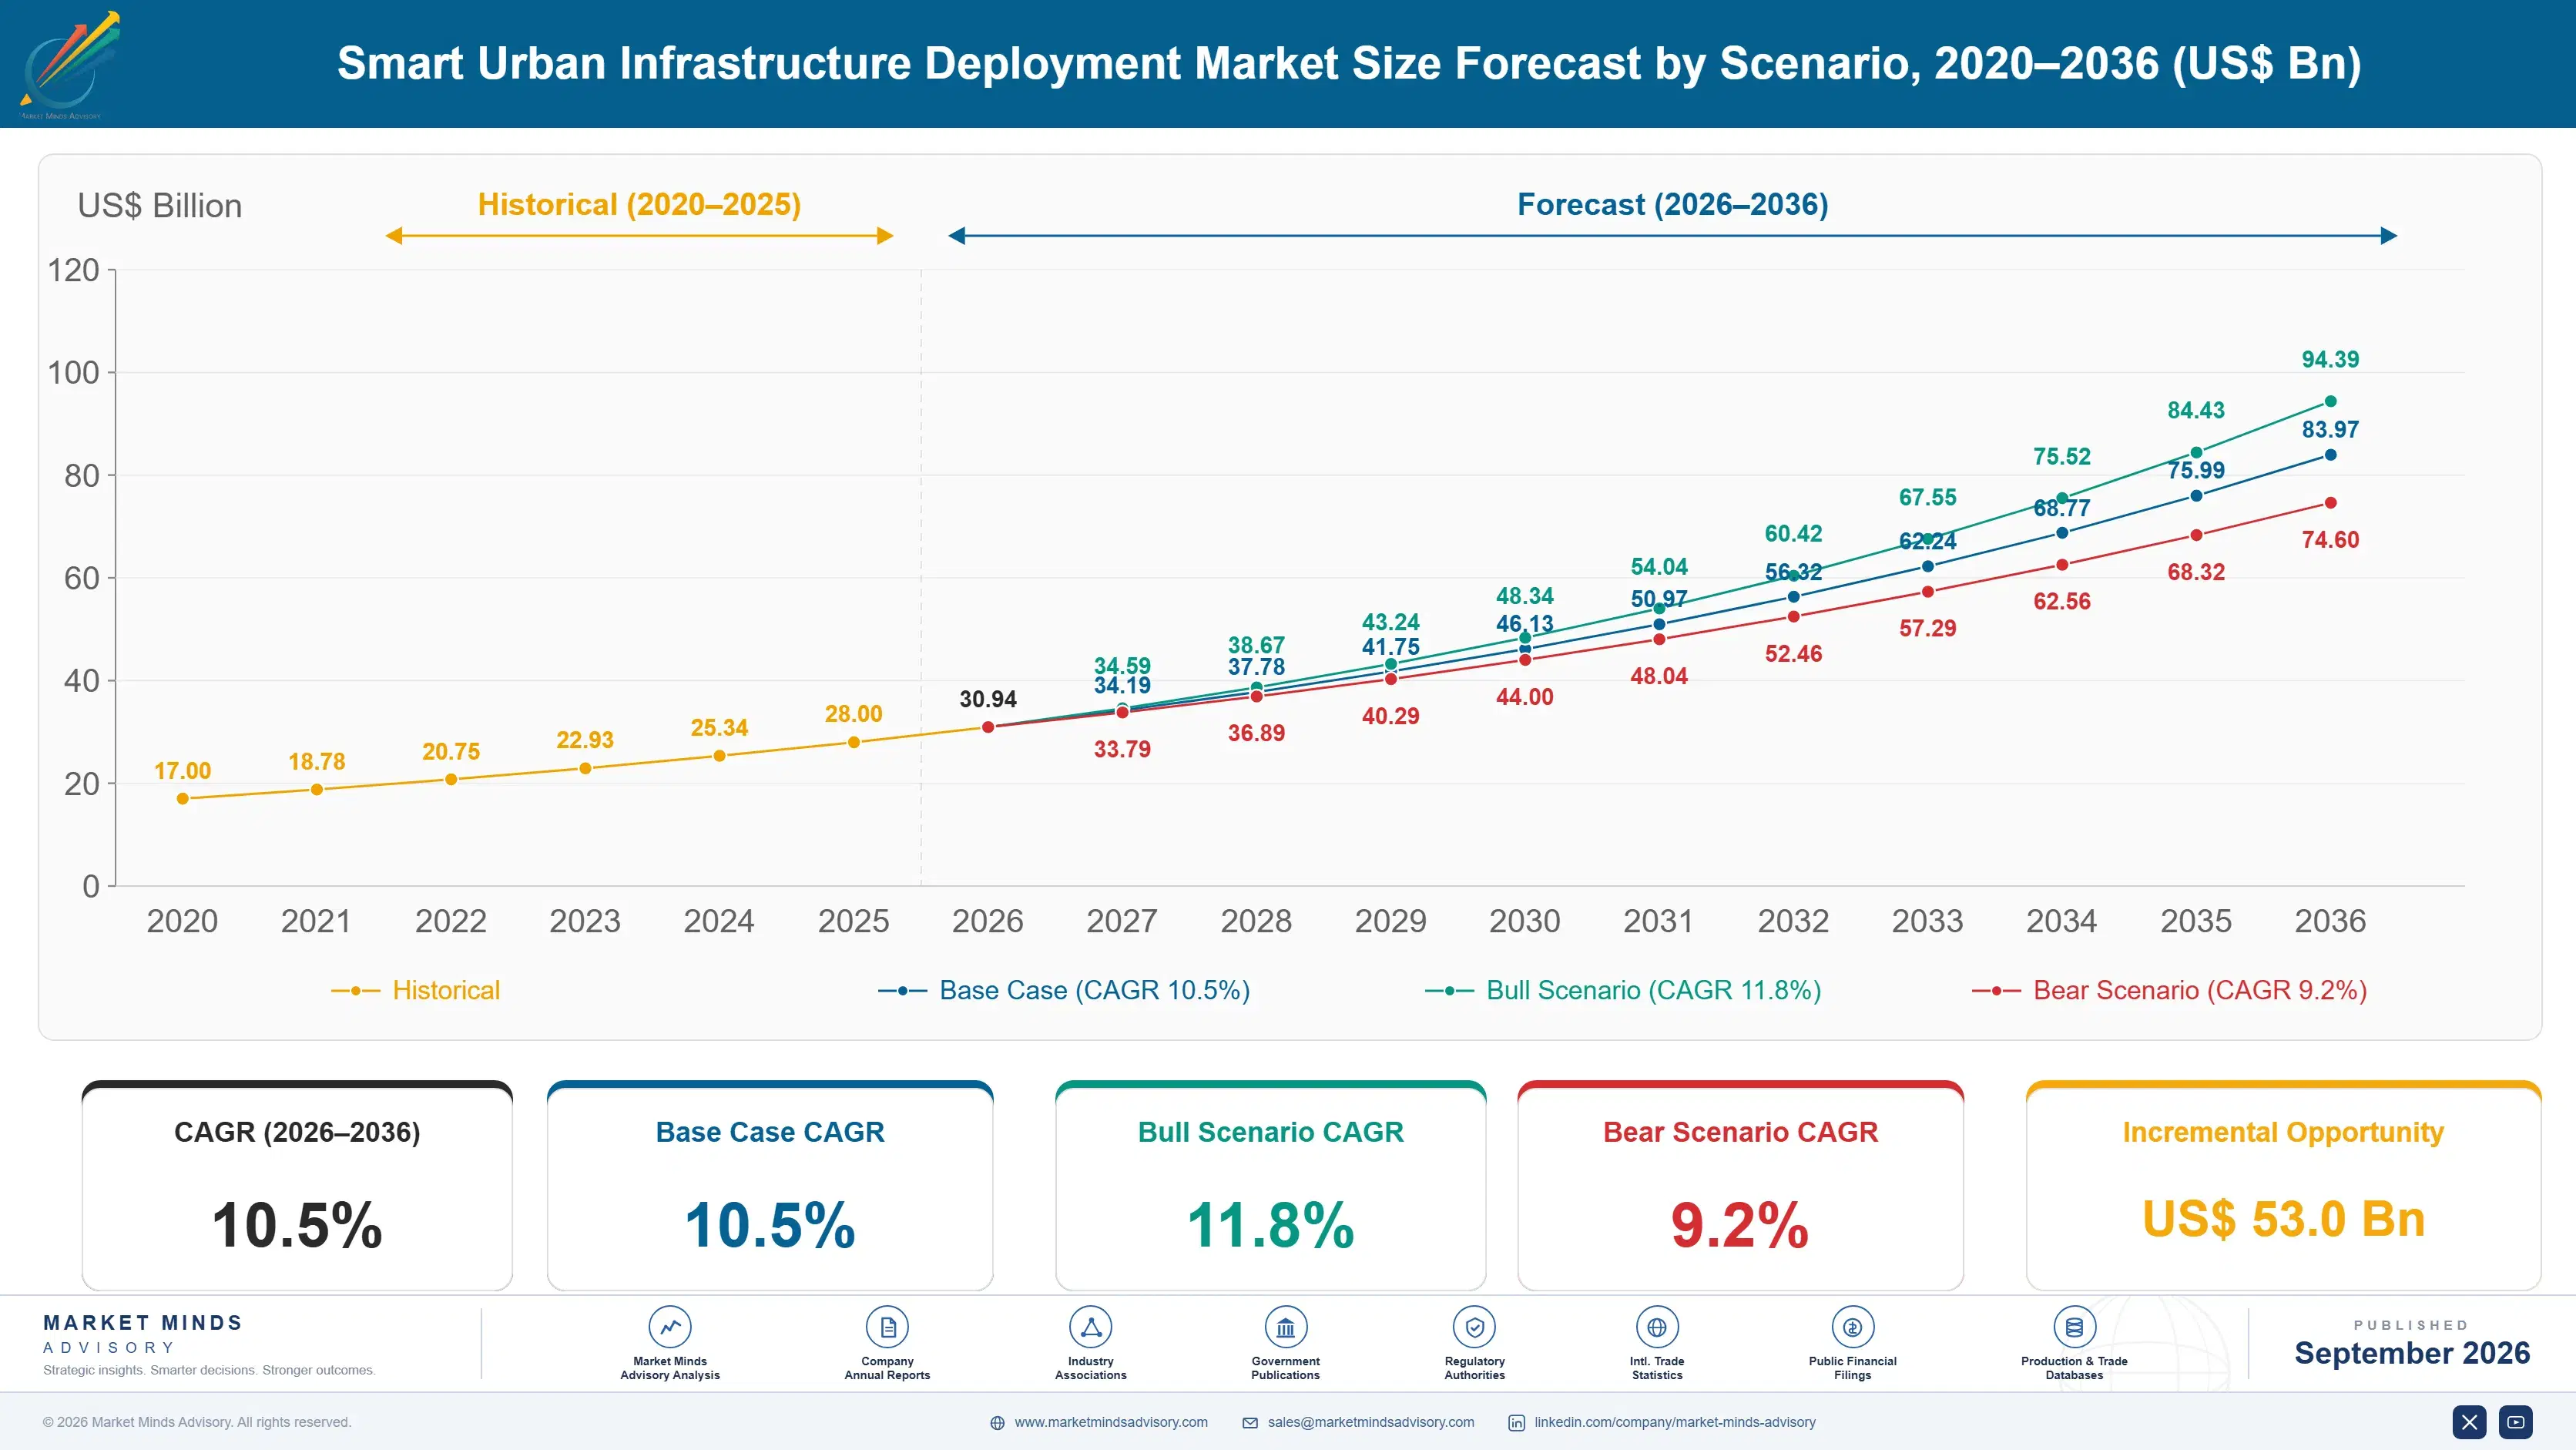
Between 2020 and 2025 smart urban infrastructure spending grew at an estimated 9.5% historical annual rate as municipalities moved cautiously from small pilot programs toward broader deployment, constrained largely by capital budget cycles and the need to demonstrate measurable return on investment before committing to citywide scale-up across additional infrastructure categories. Several early pilot cities reported measurable savings within eighteen months, building the internal budget case for wider rollout.
The base case assumes accelerating expansion through 2036 as three mechanisms compound: artificial intelligence software maturing enough for reliable video analytics and predictive maintenance applications, falling sensor and connectivity hardware costs enabling denser citywide deployment, and expanding national government funding programs that co-invest alongside municipal capital budgets rather than leaving cities to fund infrastructure entirely alone. China's national smart city funding and the European Union's urban digitalization programs both illustrate how national investment accelerates municipal procurement.
The bull case centers on national governments expanding direct co-funding for municipal smart infrastructure programs faster than currently modeled, pulling forward citywide deployment timelines. The bear case hinges on municipal budget constraints and competing capital priorities like housing and transit infrastructure crowding out smart infrastructure spending in cities facing tighter fiscal conditions than currently assumed.

Municipal Capital Cycles and Citywide Deployment Economics

Smart urban infrastructure sits at the intersection of municipal capital planning and rapidly maturing sensor and artificial intelligence technology, converting what were once standalone pilot projects into integrated, multi-system deployment programs. National government co-funding is increasingly the decisive factor determining which cities move from pilot to citywide scale, since municipal budgets alone rarely cover the capital cost of comprehensive deployment across every infrastructure category simultaneously.
MARKET CONCENTRATION (CR5)32%Reflects a fragmented systems-integration and specialized software vendor base
AVERAGE CITYWIDE DEPLOYMENT COST$45MTypical multi-system infrastructure investment for a mid-sized city
TOP DEPLOYING COUNTRY SHAREChinaLargest single-country municipal smart infrastructure investment currently underway
VIDEO ANALYTICS ADOPTION RATE42%Share of large cities deploying artificial intelligence camera analytics
SENSOR DEPLOYMENT DENSITY180 per km2Average connected sensor count across deployed urban districts
COGS HARDWARE COST SHARE52%Sensors, cameras, and networking equipment as share of unit cost
Commercial character today increasingly favors systems integrators capable of bundling traffic, lighting, and public safety infrastructure into a single procurement contract rather than specialized point-solution vendors serving one category alone. Municipal buyers increasingly demand interoperability between systems from different vendors, pushing standardization efforts that reduce switching costs but also compress vendor differentiation on pure hardware specifications.
Over the next decade, expect continued consolidation around integrated platform vendors as cities tire of managing dozens of disconnected point solutions, while artificial intelligence-driven predictive maintenance becomes the primary new value proposition justifying continued infrastructure investment in cities that already completed initial sensor deployment years earlier. Vendors slow to build this predictive maintenance narrative risk losing renewal conversations to competitors offering clearer measurable savings.
"Cities don't buy smart infrastructure because it sounds futuristic anymore. They buy it because the maintenance budget math finally works, and that shift changed who wins these procurement contracts."
Director, Smart Infrastructure and Public Sector Technology Practice · MMA Technology / Smart City and Urban Infrastructure Practice · September 2026

Market Trends

Artificial Intelligence Video Analytics Reach Deployment Maturity

Artificial intelligence-powered video analytics have matured from experimental pilot deployments to production-grade systems capable of reliably detecting traffic incidents, crowd density anomalies, and public safety events across large camera networks without requiring constant human monitoring of every feed simultaneously. Singapore, Shenzhen, and several major American cities have moved from single-district pilots to citywide deployment within two years, reflecting growing confidence in detection accuracy as models improve. Vendors report public safety departments now represent the fastest-growing buyer segment within the broader smart infrastructure category, often moving faster than traffic or utility departments through internal procurement approval processes.
Market Impact: Cuts sensor deployment cost 40%

National Government Co-Funding Programs Accelerate Municipal Adoption

National governments across China, the European Union, and India are directing substantial co-funding toward municipal smart infrastructure programs, recognizing that individual city budgets alone rarely justify the capital investment required for comprehensive, multi-system deployment. China's national smart city initiative has funded pilot-to-citywide transitions across several hundred municipalities, while the European Union's urban digitalization funding stream requires member states to co-invest alongside Brussels-level grants rather than receiving funding outright. This shared-funding model meaningfully de-risks municipal capital planning decisions, since cities no longer bear the entire deployment cost burden alone within a single fiscal year budget cycle.
Market Impact: Expands sensor density requirement 60%

Market Opportunities and Growth Drivers

Falling Sensor and Connectivity Hardware Costs

Sensor, camera, and low-power wide-area network connectivity hardware costs have fallen considerably over the past several years as production volumes scale and component standardization reduces per-unit manufacturing cost across vendors. This cost decline lets cities deploy meaningfully denser sensor networks per capital dollar than earlier pilot programs achieved, extending coverage from a handful of demonstration districts to citywide scale within comparable budget envelopes. Municipal procurement officers increasingly report that hardware cost is no longer the primary barrier to expanded deployment, shifting the constraint toward software integration and skilled staff availability instead across most large deployment programs currently underway.
Market Impact: Adds 30% to integration project cost

Regulatory Air Quality and Emissions Monitoring Mandates

National and municipal governments across Europe, China, and parts of North America are implementing stricter air quality monitoring and reporting mandates, requiring cities to deploy denser environmental sensor networks than voluntary programs previously achieved. The European Union's updated air quality directive sets considerably tighter monitoring density requirements for major metropolitan areas, directly driving procurement of new environmental sensor infrastructure across member state cities that previously relied on sparse, centralized monitoring stations. Vendors report environmental monitoring contract volumes growing meaningfully faster than the broader smart infrastructure category as compliance deadlines approach across multiple jurisdictions simultaneously.
Market Impact: Extends sales cycles 18 months

Market Restraints and Challenges

Interoperability Gaps Between Legacy and New Systems

Many cities operate infrastructure procured from different vendors across successive budget cycles, creating interoperability gaps between legacy traffic control systems and newer connected sensor networks that complicate integrated citywide deployment. The root cause is that early smart infrastructure procurement predates today's interoperability standards, leaving cities with a patchwork of proprietary systems that were never designed to share data with equipment from other vendors. This fragmentation raises integration costs well beyond a greenfield deployment, discouraging comprehensive upgrades. Vendors are mitigating the gap by offering middleware platforms specifically designed to bridge legacy and modern systems without requiring full infrastructure replacement.
Market Impact: Cuts incident response time by 35%

Municipal Budget Cycles Constrain Deployment Pace

Municipal capital budgets typically operate on multi-year cycles tied to political terms and tax revenue projections, constraining how quickly cities can commit to large, multi-system smart infrastructure programs regardless of technology readiness or vendor capability. The root cause: municipal funding requires public council votes and competes directly against visible priorities like housing and transit. This constrains deployment pace independent of underlying technology cost or maturity considerations, extending sales cycles considerably longer than vendors serving private enterprise customers typically experience. Vendors mitigate the constraint by structuring financing and phased deployment contracts that align with municipal budget cycle realities.
Market Impact: Adds funding across 400 cities
3 additional market trends, 4 additional growth drivers, and 3 additional restraints and challenges are covered in the full report. Contact sales@marketmindsadvisory.com to access the complete intelligence.

Segment CAGR and Growth Architecture

Smart urban infrastructure is segmented by application and system type rather than by city size or geography, since municipal procurement decisions center on which infrastructure category a given investment addresses. This lens separates traffic management from lighting, utility metering, and public safety systems that serve distinct municipal departments with separate budgets and separate vendor relationships entirely.
smart-urban-infrastructure-deployment-market-share-analysis-1790001849327

Public Safety and Video Analytics Platforms

Public safety and video analytics platforms represent the fastest-growing segment as cities deploy artificial intelligence-powered camera networks capable of detecting incidents, monitoring crowd density, and supporting law enforcement investigations without requiring constant human review of every camera feed simultaneously across large urban districts. This segment covers camera hardware, video management software, and artificial intelligence analytics licensing that together let cities extract actionable insight from footage that previously sat largely unreviewed except after an incident had already occurred. Singapore, Shenzhen, and several major American cities have moved from single-district pilots to citywide deployment within the past two years, reflecting growing confidence in detection accuracy as underlying models improve considerably. Public safety departments increasingly outpace other municipal buyers moving through procurement.
CAGR 13.5%

Environmental and Air Quality Monitoring Networks

Environmental and air quality monitoring networks represent the second-fastest-growing segment as regulatory mandates across Europe, China, and parts of North America require denser sensor coverage than voluntary programs previously achieved across major metropolitan areas. This segment covers air quality sensors, water quality monitoring, and noise pollution tracking infrastructure that feed data into municipal compliance reporting and public health advisory systems used by residents and government agencies alike. The European Union's updated air quality directive has directly driven procurement across member state cities that previously relied on sparse, centralized monitoring stations covering only a handful of locations citywide. Vendors report environmental monitoring contract volumes growing meaningfully faster than the broader smart infrastructure category overall as compliance deadlines approach.
CAGR 12.0%
Full segment breakdown across 6 segments available in the complete report.

Regional Architecture and Country Demand Map

East Asia and North America concentrate the largest share of citywide deployment spending, reflecting government-directed smart city programs and large municipal capital budgets, while South Asia and the Middle East show the fastest growth from a smaller installed base. Latin America and Eastern Europe trail but are catching up steadily.

North America

United States cities including New York, Los Angeles, and Chicago lead regional deployment through large-scale traffic management and public safety video analytics programs, often funded through a combination of municipal capital budgets and federal infrastructure grant programs directed at urban modernization. Canadian cities including Toronto and Vancouver are pursuing comparable programs at somewhat smaller absolute scale given the country's smaller aggregate municipal budget base relative to its southern neighbor. Regional deployment increasingly emphasizes interoperability standards following several high-profile integration failures between legacy and newer connected systems that raised total project costs meaningfully beyond original municipal budget projections in multiple documented cases. Public safety agencies increasingly drive procurement pace ahead of traffic departments in several major metropolitan markets.
Share: 27% | CAGR: 10.5% (2026 to 2036)

Western Europe

Major European cities including Amsterdam, Barcelona, and Copenhagen lead regional deployment through comprehensive environmental monitoring and smart mobility programs, often supported by European Union urban digitalization co-funding that requires member states to match Brussels-level grant funding rather than receiving it outright. Germany and France are pursuing similarly ambitious programs across their largest metropolitan areas, though generally at a more measured pace than the Nordic and Benelux early movers who established much of the region's current best-practice deployment framework. Eastern European Union member states lag considerably behind the region's wealthiest cities in completing comparable infrastructure investment programs. Southern European cities generally trail the Nordic and Benelux early movers in deployment maturity considerably.
Share: 21% | CAGR: 9.0% (2026 to 2036)
Regional intelligence for 5 additional markets available in the complete report: East Asia, South Asia and Pacific, Latin America, Middle East and Africa, Eastern Europe. Contact sales@marketmindsadvisory.com.
smart-urban-infrastructure-deployment-country-cagr-analysis-1790001849886

Where Vendors Capture Value Beyond Hardware Sales

Beyond initial hardware and installation revenue, vendors are building recurring income through managed platform subscriptions, predictive maintenance analytics, and data licensing arrangements that convert one-time municipal capital projects into multi-year recurring vendor relationships worth considerably more over time. This mirrors how enterprise software vendors monetize installed customer bases well after the initial platform deployment closes.

Managed Platform and Analytics Subscription Services

Vendors increasingly bundle ongoing platform hosting, software updates, and artificial intelligence analytics into multi-year managed subscription contracts rather than selling municipal infrastructure as a one-time capital purchase alone. This shift converts unpredictable capital project revenue into recurring subscription income that better matches how vendors themselves plan long-term business investment and staffing. Vendors report managed subscription contract values now exceeding 35% of total deal value on new citywide deployment programs, up meaningfully from purely hardware-focused contracts municipalities favored just several years earlier. This shift lets vendors plan staffing and investment around predictable recurring revenue rather than lumpy capital project cycles.
Market Impact: Lifts recurring subscription revenue share to roughly 35%

Predictive Maintenance and Infrastructure Analytics Services

Vendors are offering predictive maintenance analytics that flag failing sensors, cameras, or connectivity equipment before outright failure disrupts service, capturing service revenue that scales with installed base size rather than depending entirely on new equipment sales. This analytics layer meaningfully reduces municipal maintenance costs relative to reactive repair models, giving vendors a compelling value proposition beyond the initial infrastructure sale itself. Cities adopting predictive maintenance report equipment downtime reductions exceeding 25% relative to comparable cities still relying on purely reactive maintenance approaches. This predictive layer gives vendors a compelling case for renewal beyond the original hardware sale itself.
Market Impact: Reduces average equipment downtime by roughly 25% citywide

Data Licensing and Municipal Analytics Dashboards

Vendors increasingly license anonymized traffic, environmental, and utility usage data back to municipal planning departments and, in some cases, third-party urban planning firms, creating a data monetization revenue stream entirely separate from the underlying infrastructure hardware and software sale. This data layer typically carries considerably higher margins than hardware sales alone, since it requires minimal incremental cost once sensor infrastructure is already deployed. Cities with several years of sensor history generate roughly 3 times higher data licensing revenue per capita than newer deployments. Vendors report this revenue stream growing meaningfully faster than hardware sales across mature deployments.
Market Impact: Adds nearly $850,000 in average annual data revenue

Financing and Phased Deployment Program Structuring

Vendors are offering direct financing and phased deployment contract structures that let municipal budgets spread capital cost across multiple fiscal years rather than requiring the full deployment cost upfront within a single budget cycle that many cities cannot approve at once. These financing arrangements typically carry higher effective yields than straight equipment sales, since financing charges compound over multi-year terms while cities continue receiving value throughout deployment. Financing-structured deals now close in roughly 50% less time than deals requiring full upfront council approval. Cities without financing options often delay procurement decisions by a full additional budget cycle.
Market Impact: Expands addressable municipal customer base by roughly 30%

Who Controls the Margin Pool

Concentration is moderate at a CR5 of 32%, reflecting a fragmented vendor landscape spanning large systems integrators, specialized point-solution software vendors, and regional infrastructure contractors that together prevent any single vendor from dominating the broader category the way concentrated telecom equipment markets sometimes do.
Current competitive activity centers on three fronts: bundling multiple infrastructure categories into single integrated procurement contracts, expanding artificial intelligence analytics capability across video and sensor data, and building managed services and financing structures that reduce municipal upfront capital barriers. Vendors increasingly compete on total citywide platform capability rather than individual point-solution specifications alone. Financing capability increasingly serves as a tiebreaker between otherwise comparable vendor proposals evaluated by budget-constrained municipal buyers.

Emerging pressure comes from specialized artificial intelligence software vendors offering superior analytics capability within narrow categories like video analytics or traffic optimization, challenging broader systems integrators on pure technical performance even without comparable systems-integration scale. Rankings could shift meaningfully if a major cloud infrastructure provider enters municipal systems integration directly, or if consolidation among smaller point-solution vendors concentrates competitive pressure among fewer, better-capitalized challengers. Cities themselves increasingly favor multi-vendor strategies to preserve negotiating position over any single systems-integration partner.
smart-urban-infrastructure-deployment-company-positioning-matrix-1790001850417

Competitive Moat and Risk Dimensions

SIEMENS

Moat: Broad Systems Integration Scale

Siemens brings decades of municipal infrastructure relationships spanning traffic, lighting, and utility systems, letting it bundle multiple categories into single procurement contracts that specialized point-solution vendors cannot match. Its established municipal financing relationships also help cities structure phased deployment programs that smaller vendors typically cannot offer independently.
SIEMENS

Risk: Slower Artificial Intelligence Innovation Pace

Siemens' broad systems-integration focus means its artificial intelligence analytics capability sometimes lags specialized software vendors focused purely on video or predictive maintenance analytics. Cities prioritizing leading-edge analytics performance over broad systems-integration scale may increasingly favor these more specialized competitors instead. Losing ground on artificial intelligence performance could gradually erode its broader systems-integration advantage over time.
CISCO

Moat: Network Connectivity Infrastructure Depth

Cisco's networking equipment already underlies much of the connectivity infrastructure smart urban systems depend on, giving it natural entry points into municipal accounts through existing network infrastructure relationships. Its software analytics partnerships further extend its platform capability beyond pure networking hardware into broader smart infrastructure categories.
CISCO

Risk: Limited Direct Municipal Relationship History

Compared with traditional infrastructure vendors like Siemens or Schneider Electric, Cisco has a shorter direct history serving municipal government procurement processes specifically, potentially disadvantaging it in competitive tenders where established municipal relationship depth matters considerably to risk-averse procurement officers. Winning large municipal tenders often requires exactly the relationship depth Cisco has historically lacked in this specific buyer category.

Players Tracked

Prominent Players

Siemens
Schneider Electric
Cisco
Huawei
IBM

Other Key Players

Hitachi
NEC Corporation
Itron
Honeywell
Johnson Controls
ABB
Bentley Systems
Esri
Ericsson
Signify
Landis+Gyr
Telensa
Axis Communications
Motorola Solutions
Verizon

Recent Developments

APRIL 2025

Siemens Wins Integrated Traffic and Lighting Contract in Sao Paulo

Siemens announced a multi-year integrated contract covering traffic management and connected streetlighting infrastructure across several districts of Sao Paulo, Brazil, bundling two previously separate municipal procurement categories into a single systems-integration agreement. The contract includes managed services covering ongoing platform maintenance. Financial terms were not disclosed publicly by either party.
Signal: Bundled multi-category contracts continue displacing separate point-solution procurement across major Latin American metropolitan markets and the wider region.
AUGUST 2025

Hitachi Expands Video Analytics Partnership Across Japanese Cities

Hitachi announced an expanded artificial intelligence video analytics partnership covering public safety infrastructure across several major Japanese metropolitan areas, building on earlier pilot programs that demonstrated reliable incident detection performance. The expansion includes predictive maintenance capability for existing camera networks. Terms of the expanded agreement were not publicly disclosed.
Signal: Domestic vendors continue winning share in home markets where established government relationships matter considerably to procurement decisions.
DECEMBER 2025

India's Smart Cities Mission Announces Second Funding Phase

India's national government announced a second funding phase for its Smart Cities Mission, directing additional capital toward water utility metering and public safety infrastructure across the program's one hundred designated cities. The announcement extends funding commitments through the next several fiscal years. State governments will administer disbursement to designated cities.
Signal: Sustained national government funding commitments continue de-risking multi-year municipal procurement planning across the program's designated cities nationwide.

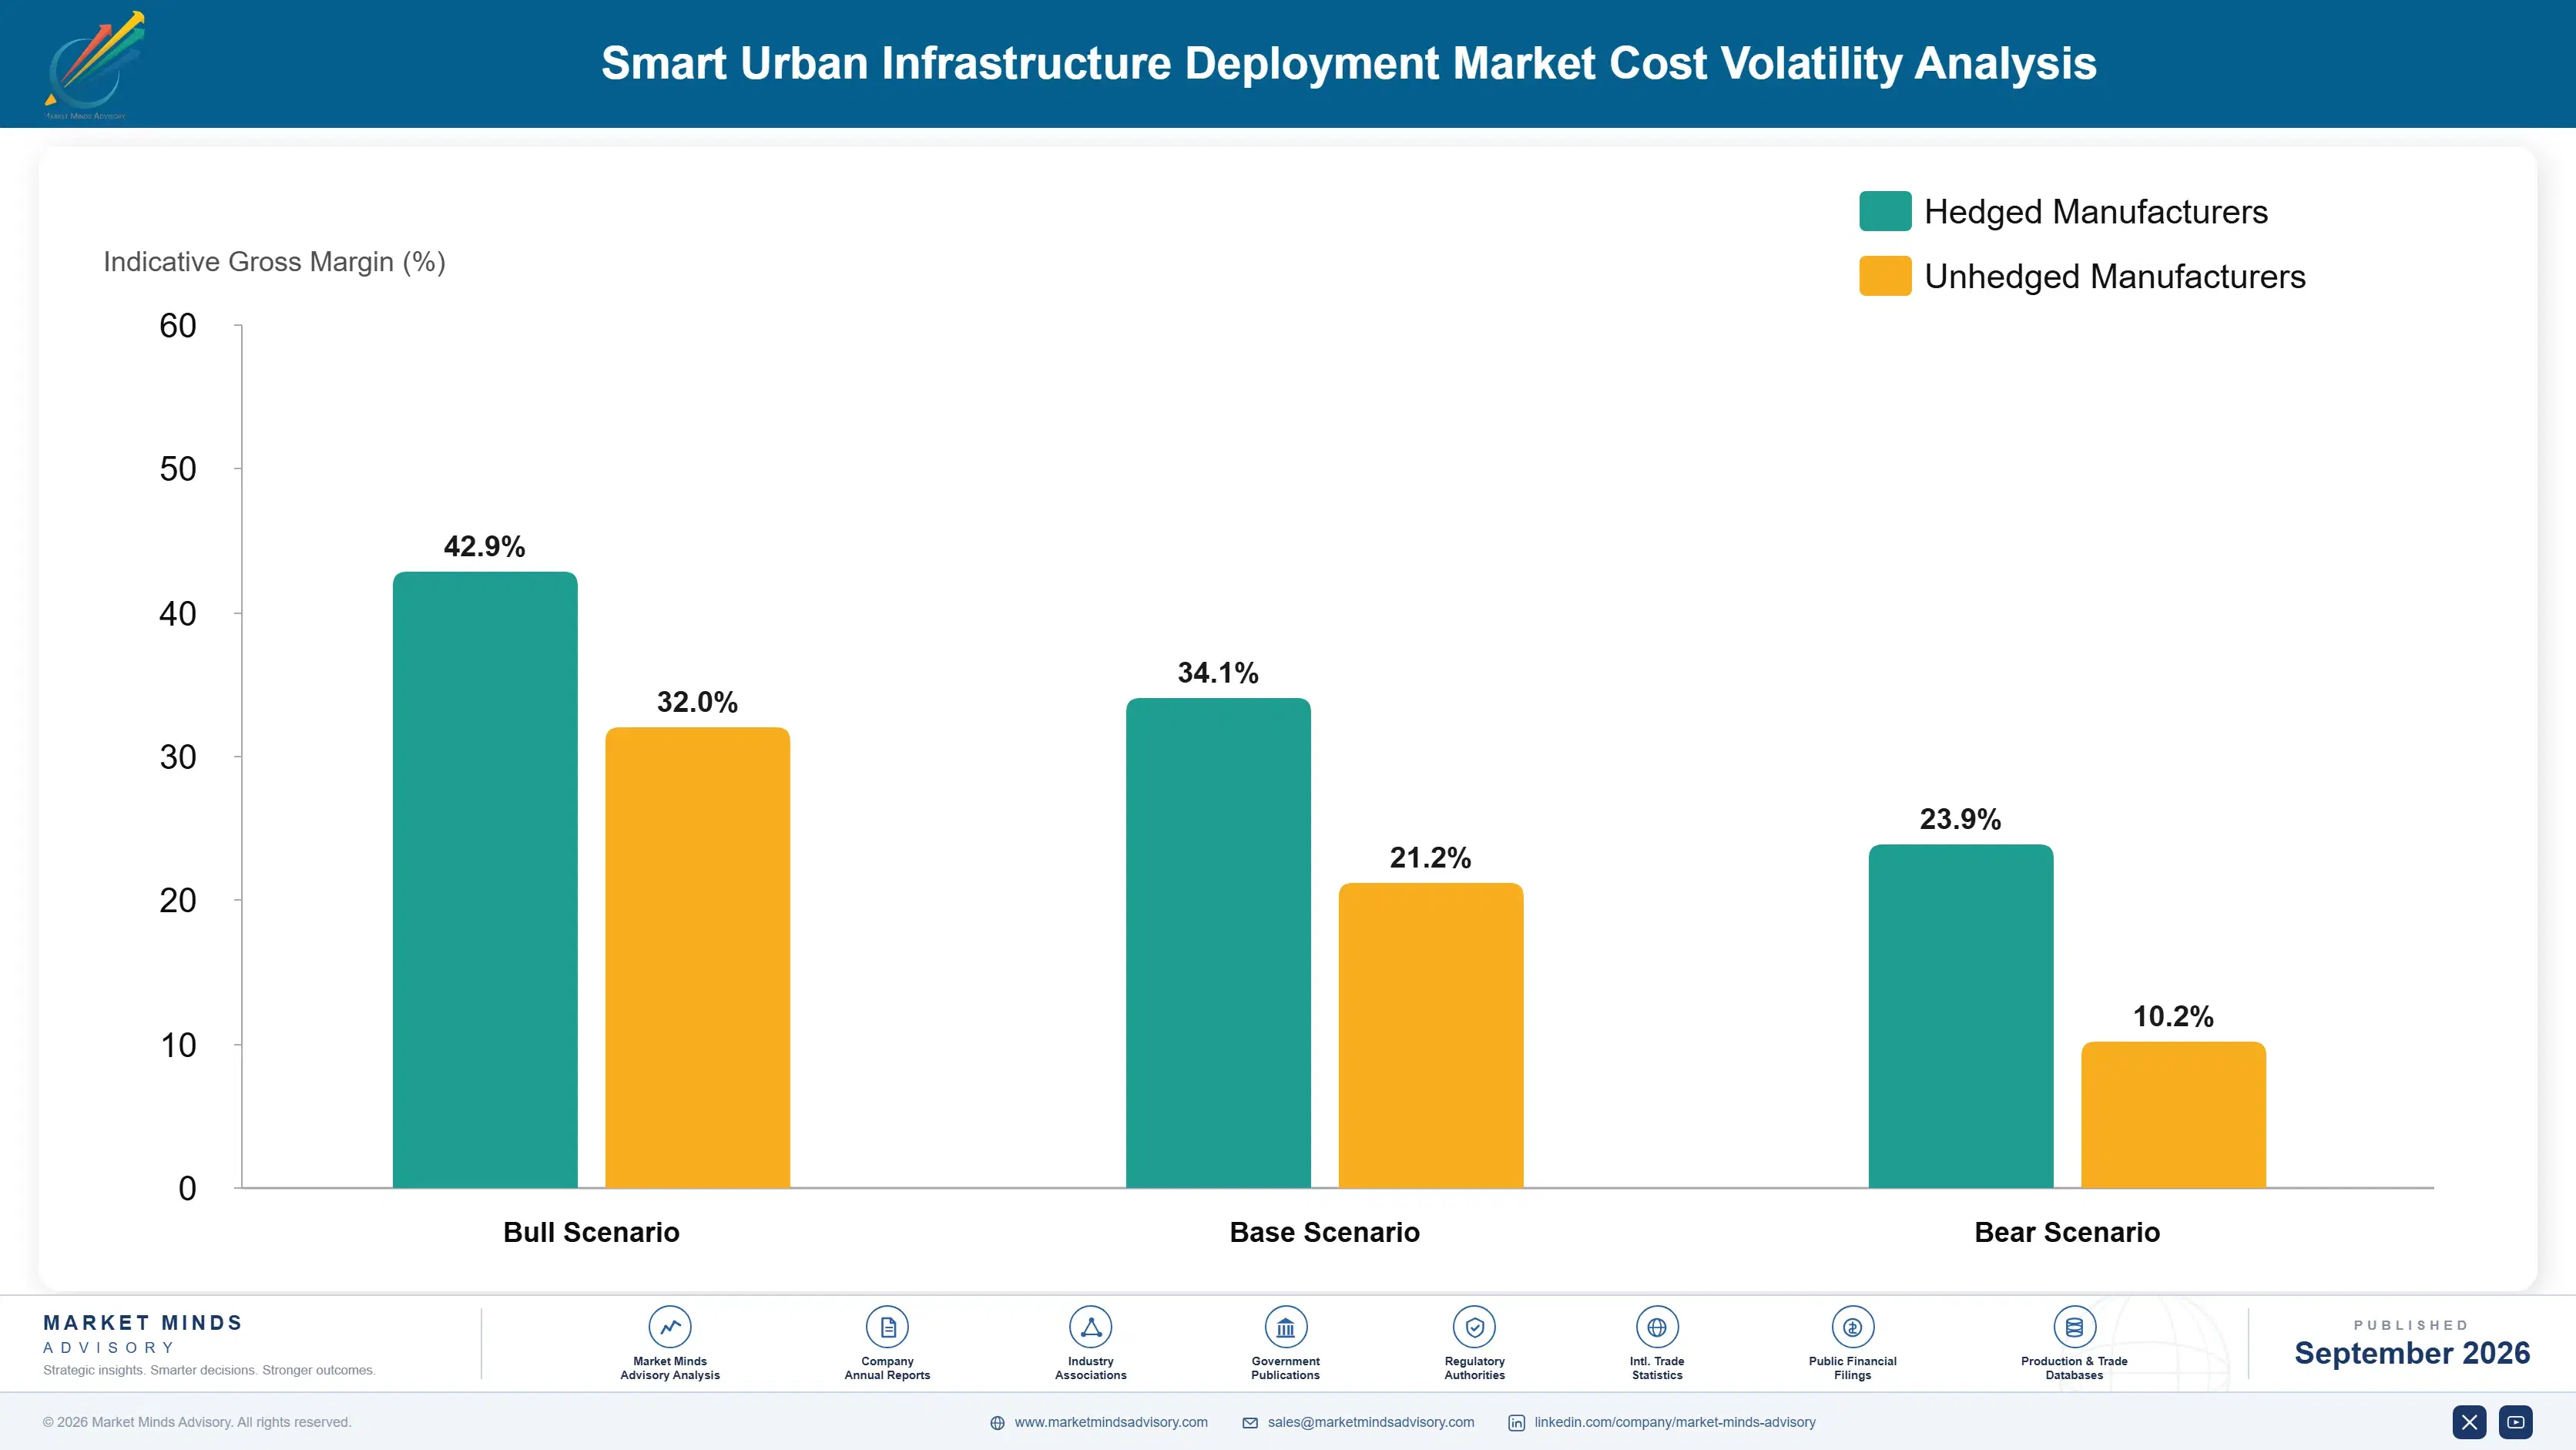
Sensor Hardware and Component Cost Exposure

Sensors, cameras, and networking equipment together represent roughly 52% of unit cost of goods sold, sourced predominantly from specialized electronics manufacturers concentrated in China, Taiwan, and South Korea as vendors increasingly rely on standardized, commodity-adjacent hardware rather than proprietary custom components across most deployment categories. This sourcing concentration exposes vendors to regional supply chain disruption risk more than earlier proprietary architectures did.
Camera and sensor component pricing rose meaningfully during the 2021 through 2022 global semiconductor shortage, with the International Energy Agency and multiple vendor annual reports documenting extended lead times across specialized imaging sensor categories that delayed several publicly disclosed municipal deployment timelines by multiple quarters during that period, frustrating cities that had already secured budget approval before delays emerged. Some vendors renegotiated municipal delivery timelines to avoid contractual penalty clauses during the worst of the shortage.

Smaller regional systems integrators carry disproportionately higher exposure since they lack the purchase volume to negotiate long-term supply agreements the way large global vendors like Siemens or Cisco can. This dynamic compounds during any renewed component shortage, since smaller integrators sit further back in allocation queues behind larger customers with standing volume contracts already in place across multiple product categories.
smart-urban-infrastructure-deployment-cost-volatility-analysis-1790001850614

Multi-Source Component Qualification Programs

Leading vendors qualify sensor and camera components from at least two independent suppliers per critical part, reducing exposure to any single supplier's capacity constraints during periods of tight semiconductor market conditions industry-wide. Some vendors now formalize this into standing dual-sourcing procurement policy. Carrier and city customers alike increasingly favor vendors who can demonstrate this practice contractually.

Long-Term Component Supply Agreements

Larger vendors increasingly sign multi-year volume commitments with electronics manufacturers, trading pricing flexibility for guaranteed allocation priority during future shortage conditions that could otherwise delay municipal deployment commitments significantly across their contracted city customers. Smaller regional integrators often cannot secure comparable multi-year terms given their considerably smaller order volumes. These deals often span three years or more.

Modular Hardware Design Standardization

Vendors increasingly design modular hardware platforms compatible with components from multiple suppliers, widening the qualified supplier pool and reducing exposure to any single specialized component category during periods of shortage or pricing volatility. This approach has become increasingly common among newer vendors seeking to differentiate against established hardware-centric incumbents. It also simplifies future component upgrades.

Portfolio Architecture for Margin Defence

The market organizes into three tiers reflecting deployment scale and revenue durability. Volume-tier standard sensor and hardware sales into single-category municipal projects carry thinner margins driven by price competition among several similarly capable vendors, while premium integrated multi-system platforms bundled with managed services command considerably better economics overall for vendors positioned there. This tiering reflects both technical maturity and how much of a given contract's value is recurring rather than one-time.
Tension between commoditizing standard hardware sales and premium recurring platform and analytics revenue defines vendor strategy today, as point-solution hardware vendors face continuous margin pressure while those successfully building managed subscription and data licensing revenue construct more durable, higher-margin recurring income streams over time. Vendors making this shift successfully report meaningfully steadier revenue than peers still dependent on lumpy capital project cycles.

High-value pools concentrate in artificial intelligence analytics licensing, predictive maintenance services, and data monetization arrangements, where vendors capture recurring revenue well beyond the initial hardware transaction itself. Next-generation integrated multi-system platforms serving cities pursuing comprehensive citywide deployment represent the newest and fastest-growing high-margin pool available to vendors today. Vendors positioned early in analytics and data monetization capture the largest share of this expanding high-margin opportunity.

Volume / Commodity-Adjacent Tier

Standard sensors, cameras, and networking hardware sold primarily on price into single-category municipal infrastructure projects with limited service bundling attached. Replacement cycles here typically run eight to ten years before major hardware refresh across categories.
Gross Margin: 22%-30%

Premium / Certified Tier

Integrated multi-system platforms bundling traffic, lighting, and utility infrastructure with multi-year managed services contracts sold to larger city customers. Renewal rates on these bundled contracts run considerably higher than single-category vendor relationships alone.
Gross Margin: 38%-46%

Sustainability / Regulatory / Next-Generation Tier

Artificial intelligence analytics licensing, predictive maintenance services, and data monetization platforms for cities with mature, comprehensive sensor deployment already in place. Margins benefit from limited direct competition and considerable specialized analytics expertise required to compete.
Gross Margin: 52%-60%
smart-urban-infrastructure-deployment-portfolio-architecture-1790001851116

High-value Sub-segments and Strategic Watch-out

AI Video Analytics Licensing Revenue

Recurring artificial intelligence analytics licensing growing fastest as cities extract actionable insight from existing camera networks previously reviewed only after incidents occurred. Source: MMA Estimate, July 2026. Source: MMA Estimate, July 2026, based on comparable citywide deployment benchmarks. Growth here outpaces every other tracked category.
Gross Margin: 50%-58%

Predictive Maintenance Service Contracts

Bundled predictive maintenance analytics contracts growing steadily as cities seek to reduce reactive repair costs across aging and newly deployed infrastructure alike. Source: MMA Estimate, July 2026. Source: MMA Estimate, July 2026, based on disclosed vendor service contract trends. Contract renewal rates remain notably strong industry-wide.
Gross Margin: 42%-50%

Standard Sensor and Hardware Deployment

The volume core of the market, sold primarily into single-category municipal projects where price competition among established vendors keeps margins comparatively thin industry-wide overall. Vendor count here remains the highest of any tier given the category's long history. Pricing pressure persists across most competing vendor tiers.
Gross Margin: 24%-30%

Legacy Point-Solution Integration Services

Declining standalone point-solution integration services facing sustained margin pressure as cities increasingly favor integrated multi-system platform contracts over piecemeal vendor relationships. Source: MMA Estimate, July 2026, reflecting accelerating platform consolidation citywide. Vendors are exiting this category gradually over time. Vendors with diversified platform portfolios are least exposed to this decline.
Gross Margin: 16%-24%

Recurring Municipal Relationships Beyond Initial Deployment

Demand increasingly behaves like an annuity rather than a one-time capital sale, since deployed sensor networks require continuous software updates, platform hosting, and analytics licensing for the life of the installation, which typically runs eight to twelve years before major replacement across most infrastructure categories. Vendors that fail to maintain this relationship risk losing the account at the next major infrastructure refresh cycle.
Adoption depth varies meaningfully by department: public safety departments tend toward comprehensive citywide camera network deployment once they commit to a vendor relationship, while environmental monitoring programs often expand incrementally as regulatory compliance deadlines phase in gradually across different pollutant categories and monitoring density requirements over successive budget cycles. This uneven pattern means vendors must maintain both large-scale citywide sales capability and smaller phased-rollout expertise simultaneously.

Buyer profiles are shifting generationally as municipal chief technology officers and data analytics teams, rather than purely traditional public works engineers, increasingly lead procurement decisions around integrated platform selection, favoring vendors who can demonstrate measurable operating cost savings rather than pure infrastructure specification sheets that engineering teams historically prioritized. Vendors slow to build this commercial fluency risk being sidelined in procurement conversations increasingly led by data-driven city leadership.
smart-urban-infrastructure-deployment-end-use-penetration-index-1790001851659

Where MMA Sees the Real Opportunity

These are among the four positions where our research anticipates prominent divergence between winners and laggards over the coming forecast period. Each is grounded in the demand model, the regulatory perimeter, and the announced capacity pipeline.
01 / INTEGRATED PLATFORM STRATEGY

Prioritize multi-category bundled procurement contracts

Vendors should prioritize bundling multiple infrastructure categories into single integrated procurement contracts rather than competing purely on point-solution specifications within one narrow category. Cities increasingly favor this approach since it reduces the number of separate vendor relationships they must manage and simplifies interoperability across previously disconnected systems. Vendors unable to offer credible multi-category bundling risk losing share to broader systems integrators who can present a more compelling single-contract value proposition, particularly as procurement committees grow increasingly risk-averse toward managing many separate vendor relationships.
02 / ANALYTICS REVENUE FOCUS

Build artificial intelligence analytics licensing capability

The vendors capturing the most durable new revenue are those helping cities extract actionable insight from existing sensor infrastructure rather than those simply selling additional hardware. Building video analytics, predictive maintenance, and data licensing capability positions vendors to capture recurring revenue as installed sensor networks mature and expand across additional infrastructure categories. Vendors without credible analytics offerings risk being perceived as legacy hardware suppliers rather than strategic technology partners, a positioning gap that grows more costly with every additional budget cycle that passes.
03 / NATIONAL FUNDING ALIGNMENT

Align sales strategy with national co-funding programs

Vendors should closely track national government co-funding announcements, since these programs meaningfully de-risk municipal capital planning and accelerate procurement timelines that would otherwise move considerably slower under purely municipal budget constraints alone. Vendors positioned early with relationships in cities designated for national funding phases stand to capture disproportionate share of the resulting procurement activity as budgets clear council approval processes faster than usual. Vendors that build dedicated national funding tracking capability into their sales organization gain meaningful lead time over competitors still reacting to funding announcements after the fact.
04 / FINANCING MODEL INNOVATION

Expand phased deployment and financing offerings

Municipal budget cycle constraints remain one of the most persistent barriers to faster deployment, and vendors offering credible financing and phased deployment structures can access budget-constrained cities that cannot otherwise approve large upfront capital commitments. This financing capability increasingly differentiates vendors beyond pure technology performance, particularly among smaller and mid-sized cities lacking the fiscal capacity of the largest metropolitan markets already pursuing comprehensive deployment programs. Vendors slow to build this financing capability risk ceding an expanding pool of budget-constrained municipal customers entirely to competitors already offering credible payment flexibility.

Engagement Snapshot From the Field

A live engagement with an industry participant carrying material or product regulatory and market exposure ahead of a defining policy shift, showing how our research translates into a defensible multi-year portfolio strategy.
MARKET MINDS ADVISORY · CLIENT ENGAGEMENT SUMMARY
Smart Urban Infrastructure Deployment Producer Strategic Portfolio Review and Transition Roadmap 2026·Investment Scenario on Smart Urban Infrastructure Deployment Exposure Evaluation 2025-26
CLIENT PROFILE
The client is a mid-sized North American city government serving approximately 650,000 residents, operating a patchwork of aging traffic control systems and standalone streetlight infrastructure procured across several previous decades from multiple vendors that lacked meaningful interoperability with one another or with any centralized municipal management platform. City leadership had previously deferred modernization for several years given competing capital priorities and budget uncertainty.
STRATEGIC CHALLENGE
The city needed to modernize its traffic management and streetlighting infrastructure within a constrained multi-year capital budget while demonstrating measurable operating cost savings to a city council skeptical of large technology investments following a previous, poorly executed infrastructure project that ran considerably over its original approved budget. The finance department also required a clear payback timeline before endorsing any new capital request to council.
MMA APPROACH
MMA's team benchmarked systems integrator options against the city's specific infrastructure age profile and interoperability requirements, evaluating both traditional systems-integration vendors and newer, software-centric challengers. MMA modeled total cost of ownership across a ten-year horizon and structured a phased deployment financing plan aligned with the city's existing multi-year capital budget cycle.
KEY FINDINGS
  1. An integrated traffic and lighting platform was projected to reduce annual energy costs by approximately 28% (client-reported, unverified by MMA) relative to the city's existing standalone infrastructure.
  2. Roughly 35% of the city's existing traffic control infrastructure lacked meaningful interoperability with any centralized management platform, complicating citywide optimization efforts during typical peak commuting hours.
  3. A phased three-year deployment plan was expected to stay within the city's existing approved capital budget envelope without requiring additional council appropriation.
  4. City council members had significantly underestimated how quickly integrated lighting controls alone could generate measurable savings once fully deployed across the pilot district.
CLIENT PROFILE
The client is a mid-sized North American city government serving approximately 650,000 residents, operating a patchwork of aging traffic control systems and standalone streetlight infrastructure procured across several previous decades from multiple vendors that lacked meaningful interoperability with one another or with any centralized municipal management platform. City leadership had previously deferred modernization for several years given competing capital priorities and budget uncertainty.
STRATEGIC CHALLENGE
The city needed to modernize its traffic management and streetlighting infrastructure within a constrained multi-year capital budget while demonstrating measurable operating cost savings to a city council skeptical of large technology investments following a previous, poorly executed infrastructure project that ran considerably over its original approved budget. The finance department also required a clear payback timeline before endorsing any new capital request to council.
MMA APPROACH
MMA's team benchmarked systems integrator options against the city's specific infrastructure age profile and interoperability requirements, evaluating both traditional systems-integration vendors and newer, software-centric challengers. MMA modeled total cost of ownership across a ten-year horizon and structured a phased deployment financing plan aligned with the city's existing multi-year capital budget cycle.
KEY FINDINGS
  1. An integrated traffic and lighting platform was projected to reduce annual energy costs by approximately 28% (client-reported, unverified by MMA) relative to the city's existing standalone infrastructure.
  2. Roughly 35% of the city's existing traffic control infrastructure lacked meaningful interoperability with any centralized management platform, complicating citywide optimization efforts during typical peak commuting hours.
  3. A phased three-year deployment plan was expected to stay within the city's existing approved capital budget envelope without requiring additional council appropriation.
  4. City council members had significantly underestimated how quickly integrated lighting controls alone could generate measurable savings once fully deployed across the pilot district.
RECOMMENDED STRATEGY
Phase 1: Phase 1 (Months 1-8): Deploy integrated traffic management and streetlighting infrastructure across the highest-priority downtown district identified through traffic incident data. Phase 2: Phase 2 (Months 9-20): Expand deployment citywide, prioritizing districts with the oldest existing infrastructure and highest projected energy savings., coordinating closely with utility crews on shared trenching work Phase 3: Phase 3 (Months 21-36): Transition to a managed services contract covering ongoing platform maintenance, software updates, and predictive maintenance analytics.
OUTCOME
The city council approved the phased deployment plan and began Phase 1 installation in early 2026, with citywide completion targeted by 2029 (client-reported, unverified by MMA). Projected annual operating cost savings were estimated at approximately $3.2 million (client-reported, unverified by MMA) once the full integrated platform reaches operational status citywide.

Frequently Asked Questions

Foundational context covering the market sizes, CAGR, scope, country, region and competition that inform every finding below. This section is provided to cover basics and most often pre-purchase conversations, answered from the MMA Primary Research Dataset.

What is the current size of the Smart Urban Infrastructure Deployment Market?

The global Smart Urban Infrastructure Deployment Market was valued at approximately $28.0 billion in 2025. Growth reflects both citywide platform expansion and rising national government co-funding programs.

How large will the Smart Urban Infrastructure Deployment Market be by 2036?

MMA projects the market will reach approximately $83.99 billion by 2036, with public safety analytics and environmental monitoring both benefiting from expanding national funding programs.

What is the CAGR for the Smart Urban Infrastructure Deployment Market 2026 to 2036?

The market is projected to grow at a 10.5% compound annual growth rate over the forecast period. This places it within the technology-enabled, transitioning growth band.

Which segment is growing fastest?

Public Safety and Video Analytics Platforms lead growth at a 13.5% CAGR. This is roughly 1.29 times the overall market growth rate across the forecast period.

Who are the major companies in the Smart Urban Infrastructure Deployment Market?

Leading companies include Siemens, Schneider Electric, Cisco, Huawei, and IBM. Together these five hold an estimated 32% combined market presence, measured consistently on systems-integration revenue as the evaluation basis.

Which country is growing fastest?

China leads global growth at an estimated 11.8% CAGR, as the national smart city initiative's citywide funding programs drive expansion across hundreds of designated cities.

Report Segmentation Architecture

The full report scope spans multiple orthogonal segmentation dimensions, with cross-tabulated demand data provided for each dimension pair. Coverage extends further to regional breakdowns, trend trajectories, and the competitive detail needed to support segment-level decision-making.

By Solution Type

  • Smart Traffic Management Systems
  • Connected Streetlighting and Public Lighting
  • Smart Water and Utility Metering Infrastructure
  • Public Safety and Video Analytics Platforms
  • Environmental and Air Quality Monitoring Networks
  • Smart Waste Management Systems

By End-Use Industry

  • Municipal Governments
  • Regional and State Governments
  • Transportation Authorities
  • Utility Providers
  • Public Safety Agencies

By Commercial Dimension

  • Hardware and Software Licensing
  • Managed Services Contracts
  • Financing and Phased Deployment Programs
  • Data Licensing Services

By Region

  • North America
  • Western Europe
  • East Asia
  • South Asia and Pacific
  • Latin America
  • Middle East and Africa
  • Eastern Europe

Scope, Methodology, and Coverage

Every figure in this report is reproducible from documented input assumptions. The scope below maps the historical period, the forecast horizon, the segmentation dimensions, and the countries covered, alongside the underlying primary and qualitative methodology.
Historical Period
2020 to 2025
Forecast Period
2026 to 2036
Base Year
2025 (USD billions; MMA Primary Research Dataset, September 2026)
Market Definition
The market covers hardware, software, and systems-integration services enabling connected traffic management, public lighting, water and utility metering, public safety analytics, environmental monitoring, and waste management infrastructure deployed by municipal and regional governments. It excludes private building automation, residential smart home devices, and standalone consumer-facing municipal mobile applications.
Quantitative Units
USD billions (current prices); sensor deployment counts; citywide program counts
Segmentation Dimensions
By Solution Type; By End-Use Industry; By Commercial Dimension; By Region
Regions Covered
North America, Western Europe, East Asia, South Asia and Pacific, Latin America, Middle East and Africa, Eastern Europe
Countries Covered
USA, China, Germany, France, UK, Japan, South Korea, India, Australia, Canada, Brazil, Mexico, Indonesia, Vietnam, Thailand, Malaysia, UAE, Saudi Arabia, South Africa, Nigeria, Turkey, Poland, Netherlands, Italy, Spain, Sweden, Switzerland, Argentina, Colombia, Singapore, and additional markets relevant to this sector
Key Companies Profiled
Siemens, Schneider Electric, Cisco, Huawei, IBM, Hitachi, NEC Corporation, Itron, Honeywell, Johnson Controls, ABB, Bentley Systems, Esri, Ericsson, Signify, Landis+Gyr, Telensa, Axis Communications, Motorola Solutions, Verizon
Quantitative Methodology
Primary survey, n=3,800 respondents, Q4 2025, six countries; demand-side model with trade association cross-validation
Qualitative Methodology
47 expert interviews, Q4 2025; applied to validate demand model assumptions, identify emerging dynamics, and assess competitive positioning
Report Format
PDF and XLSX data workbook (Word format preview document)
Publisher
Market Minds Advisory
Report Code
MMA-2026-TEC-232
Published
September 2026
Contact
sales@marketmindsadvisory.com | www.marketmindsadvisory.com

Purchase the full Smart Urban Infrastructure Deployment Market Report (2026 to 2036).

The full report provides detailed market sizing, ten-year forecasts, and competitive benchmarking across the smart urban infrastructure category worldwide. It includes country-level national funding program tracking, vendor systems-integration capability comparisons, and segment-level growth analysis across traffic, lighting, utility, and public safety applications. Buyers receive access to MMA's proprietary municipal deployment tracker updated quarterly throughout the subscription period. The report also includes detailed input-cost analysis for sensor and camera hardware sourcing across major supplier regions. Subscribers can request a customized briefing call to discuss findings relevant to their specific investment or procurement questions.
Country-level national funding tracking dashboard updates
Vendor systems-integration capability scorecards by category
Segment-level ten-year growth forecasts included fully
Competitive benchmarking covering every profiled vendor
Municipal deployment tracker updated each quarter
Input-cost and supply-chain risk analysis included

Built For The People Who Decide

From boardroom strategy to bench-side execution, this report is read cover-to-cover by leaders shaping the next decade of their industry, turning demand scenarios, market dynamics and valuation benchmarks into decisions.
CXOs/ Presidents/ VPs/ Managers
M&A and Corporate Development
Strategy Teams and R&D Heads
Procurement and Product Directors
Regulatory and Compliance Leaders
Investor Relations and Equity Analysts