Market Minds Advisory
Smart TV Market

Smart TV Market: Smart TV Market. Trends and Forecast 2026 to 2036

Television manufacturers are betting margin growth on panel premiumization and advertising-supported software platforms rather than unit volume, as replacement cycles lengthen in developed markets even while emerging market screen upgrades continue accelerating steadily.

Lead Analyst

Published

September 2026

Make Smarter Decisions with Customized Research Insights

Request a free sample report and evaluate market opportunities, growth trends, and competitive dynamics relevant to your business needs.

2025 MARKET VALUE$180.0BMarket Size 2025
2036 FORECAST VALUE$359.8BBase Case , 2026 to 2036
CAGR 2026 TO 20366.5 %Bull 7.8% / Bear 5.2%
INCREMENTAL OPPORTUNITY$168.1BNet 10- year value creation
EXPANSION MULTIPLE1.88x2036 value over 2026 base
Strategic Levers
M&A Pipeline
Regional Outlook
Country Rankings
Competitive Intelligence
Segmental Deep-dive
Call-Us : 91 93563 13602

Executive Snapshot and Market Trajectory.

Unit growth in developed markets has flattened as replacement cycles stretch beyond seven years, forcing manufacturers to chase margin through panel premiumization and software platform monetization rather than volume expansion alone across most tracked product categories, price tiers, screen sizes, and geographic markets worldwide today.
OLED and mini-LED panel technologies are expanding fastest as premiumization accelerates in developed markets, while standard LED/LCD models still dominate unit shipment volume across price-sensitive emerging market segments where affordability drives most purchase decisions nationwide and regionally. East Asia and North America together account for most manufacturing and consumption activity, reflecting concentrated brand manufacturing scale and mature premium display adoption in both regions respectively, a pattern MMA expects to persist through the forecast period.
Competitive intensity remains high as Korean, Chinese, and Japanese brands compete across overlapping price and technology tiers, keeping hardware margins compressed while software platform advertising revenue increasingly determines overall profitability across the entire global industry landscape. Regulatory attention is building around energy efficiency labeling requirements and data privacy rules governing viewing behavior collection through connected television advertising platforms embedded in most current smart TV operating systems today.
Market Definition
The Smart TV Market covers internet-connected television sets with integrated operating systems, app libraries, and content streaming capability, measured by unit shipment and hardware revenue. It excludes standalone streaming media players, dedicated projector systems, and commercial digital signage displays not intended for home entertainment use.
Base Year Value
$180.0B in 2025 (MMA Primary Research Dataset, September 2026)
Forecast Period
2026 to 2036, eleven discrete annual values
CAGR
6.5% base case. Bull 7.8%. Bear 5.2%.
Fastest Growth Segment
OLED Smart TVs: 11.0% CAGR
Fastest Growth Country
India: 9.0% CAGR
Fastest Growth Region
South Asia and Pacific: 8.5% CAGR
Largest Region
East Asia: 30% of 2025 global value
Market Leaders
Leading participants include Samsung Electronics, LG Electronics, TCL Technology, Hisense, and Sony. Source: MMA Primary Research Dataset, July 2026.
Primary Survey
n=3,800 procurement and R&D decision-makers, Q4 2025, six countries
Methodology
Demand-side build-up, cross-validated against public data, 47 expert interviews

Smart TV Market Forecast Scenarios

smart-tv-market-size-forecast-scenario-1788423609801
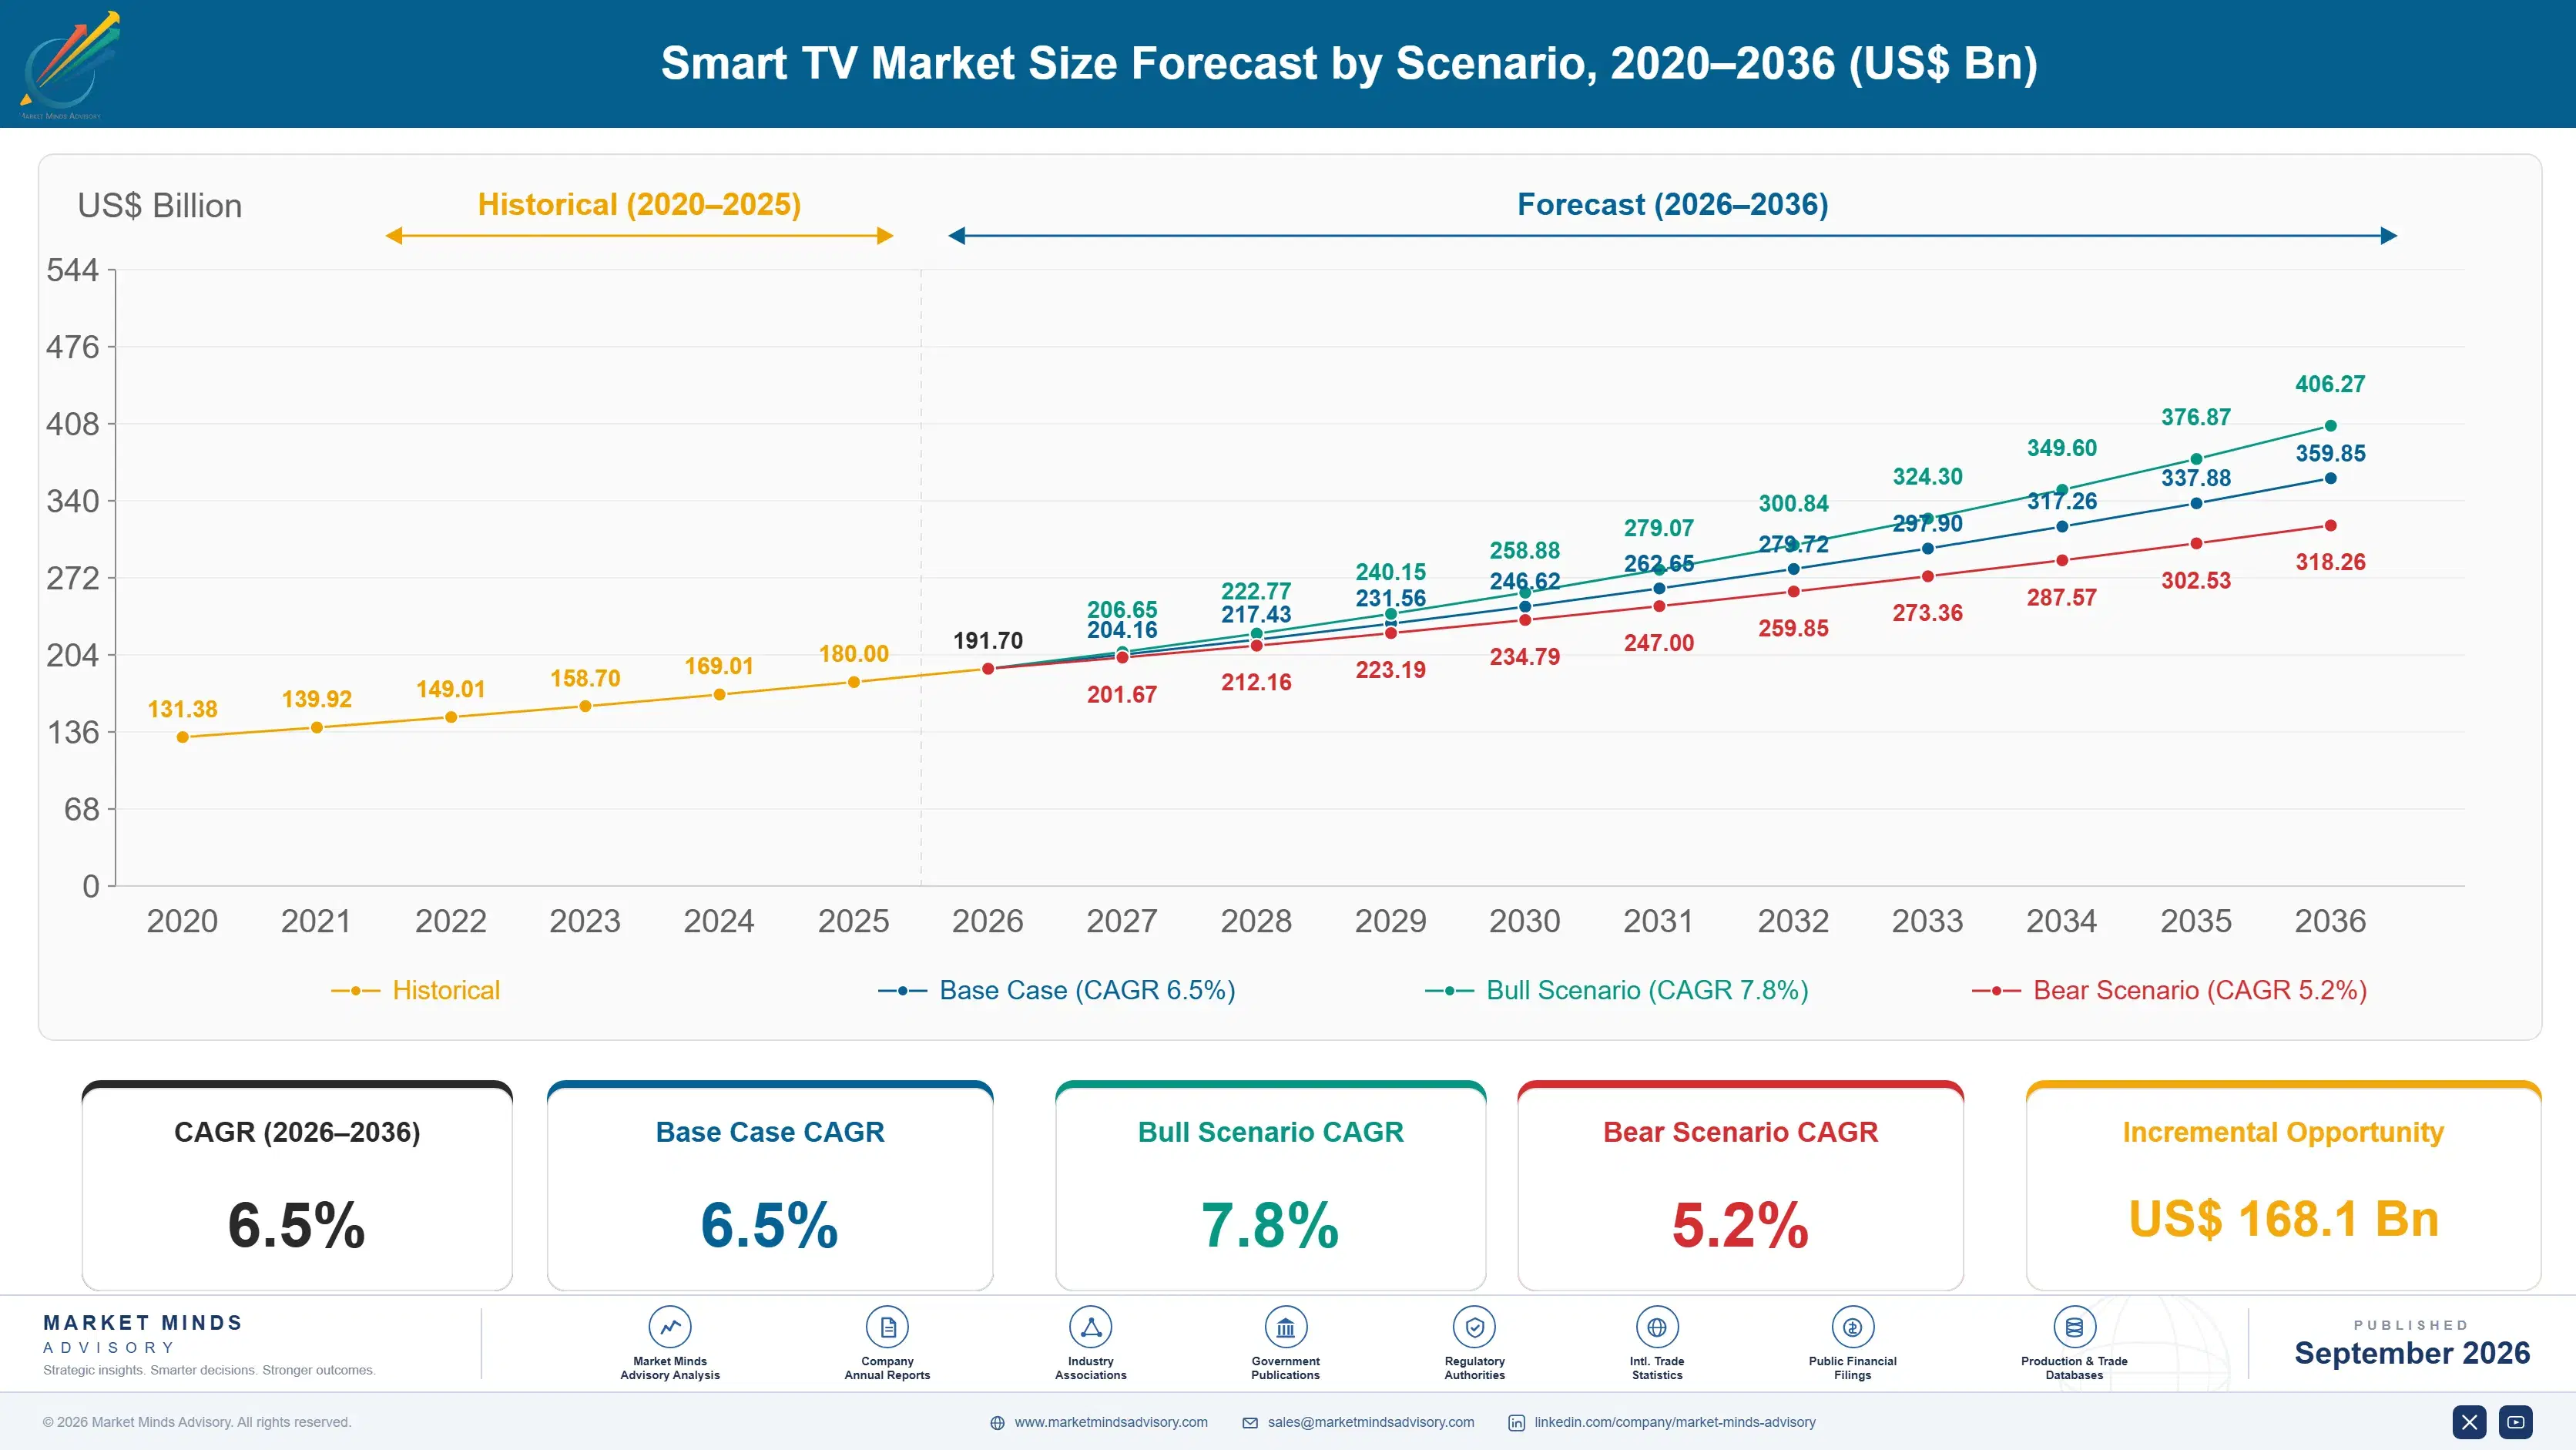
Between 2020 and 2025, smart TV adoption approached saturation in developed markets while emerging markets continued converting from basic television sets, with pandemic-era demand spikes giving way to more moderate replacement-driven purchasing patterns afterward across most tracked regional markets globally. Historical growth ran near 5.5% annually through this period as adoption broadened considerably worldwide and steadily.
The base case assumes continued panel premiumization, expanding software platform advertising revenue, and steady emerging market unit growth as screen sizes and picture quality continue improving, sustaining growth near 6.5% annually through 2036. Manufacturers increasingly treat the smart operating system as a strategic asset generating recurring advertising and subscription revenue well beyond the initial hardware sale, broadening profit pools considerably beyond traditional unit margin economics that historically defined this hardware category.
A bull scenario near 7.8% depends on faster OLED and mini-LED cost curves accelerating premium segment penetration across price-sensitive middle-income households in emerging markets. The bear case near 5.2% reflects the risk that extended replacement cycles in developed markets combined with commodity pricing pressure in emerging markets compress both unit growth and average selling prices simultaneously across the industry.

The Screen That Keeps Earning After the Sale

Smart TVs stopped being primarily a hardware business years ago, since the operating system layer now generates recurring advertising and subscription revenue that increasingly determines which manufacturers post the strongest overall profitability across their entire television product portfolio and lineup worldwide today, not just those with the best display panels alone.
MARKET CONCENTRATION55% CR5Share held by the five largest tracked participants
AVERAGE SELLING PRICE$385 per unitTypical global blended price across all screen sizes sold
TOP PRODUCING COUNTRY42% ChinaShare of global smart TV manufacturing capacity located domestically
TRADE INTENSITY60% cross-border shipmentsShare of finished units shipped across international borders annually
FEEDSTOCK COST SHARE48% of unit COGSShare of production cost from display panel components alone
REPLACEMENT CYCLE LENGTH7 to 9 yearsTypical ownership duration before consumers replace their television set
Manufacturing remains concentrated among a handful of Korean, Chinese, and Japanese brands who compete on panel technology, screen size scaling, and increasingly on software platform quality rather than hardware specifications alone in isolation from other important considerations. Price competition intensifies further in commodity screen size tiers, pushing manufacturers to differentiate through premium panel technology and exclusive content partnerships that competitors cannot easily replicate quickly or cheaply.
Panel technology premiumization is reshaping average selling prices upward within specific screen size and quality tiers, as OLED and mini-LED models command meaningfully higher margins than standard LED/LCD panels sold at ordinary commodity pricing across most retail channels and distribution networks. Manufacturers increasingly position these premium panel variants as a hedge against commodity price erosion in standard screen categories facing persistent downward cost pressure from lower-cost regional competitors.
"The television is no longer a box you buy once. It is a screen that keeps generating revenue for whoever owns the software running on it."
Senior Analyst, Consumer Electronics and Connected Devices Practice · MMA Technology Practice · September 2026

Market Trends

Connected TV Advertising Becomes Core Revenue Stream

Manufacturers increasingly monetize the smart operating system through targeted advertising and content recommendation placement, generating recurring revenue that continues well beyond the initial hardware sale and often exceeds the original margin captured on the television unit itself entirely and consistently. This shift is pushing manufacturers to prioritize operating system engagement and viewer data collection as strategic assets comparable in importance to display panel quality and screen size specifications. Manufacturers investing early in advertising platform capability report meaningfully stronger overall profitability than competitors still treating the television purely as a hardware product.
Market Impact: Emerging market unit shipments grew 18%
Mini-LED Technology Narrows the OLED Price Gap

Mini-LED backlighting technology continues improving picture quality closer to OLED performance levels at meaningfully lower production cost, letting manufacturers offer near-premium viewing experience across a considerably broader range of price tiers than OLED panels alone could realistically reach given persistent cost constraints today across markets. This technology convergence is expanding the addressable premium segment considerably faster than OLED adoption alone would achieve given OLED's persistently higher manufacturing cost structure across most global production facilities. Manufacturers report meaningfully accelerated mini-LED model proliferation across their mid-tier and premium product lines this current year.
Market Impact: Large screen segment revenue grew 25%

Market Opportunities and Growth Drivers

Emerging Market Screen Upgrades Sustain Unit Volume Growth

Households across emerging markets continue upgrading from basic non-smart televisions to internet-connected models as falling panel prices and expanding broadband infrastructure make smart TV ownership newly affordable for a rapidly growing middle-class consumer base across major population centers and secondary cities alike. This conversion represents the single largest source of new unit volume growth as developed markets approach saturation and rely primarily on replacement cycle purchasing rather than first-time ownership expansion. Manufacturers report meaningfully sustained order volume from emerging market retail channels specifically targeting first-time smart TV buyers this year.
Market Impact: Compliance changes cut ad revenue 10%

Larger Screen Sizes Drive Average Selling Price Growth

Consumers across most markets continue trading up to larger screen sizes during replacement purchases, driven by falling per-inch panel manufacturing costs that make larger displays increasingly affordable relative to household budgets and living room space constraints in most modern homes. This screen size migration directly lifts average selling prices even when unit shipment volume growth remains comparatively modest, since larger screens carry meaningfully higher per-unit revenue than the smaller models they typically replace. Manufacturers report meaningfully accelerated large screen segment growth across most tracked retail channels and price tiers this year.
Market Impact: Replacement cycles extended by 18 months

Market Restraints and Challenges

Data Privacy Rules Threaten Advertising Revenue Model

Regulators in several developed markets are tightening restrictions on automatic content recognition and viewing behavior data collection that connected television advertising platforms depend on to generate targeted advertising revenue for manufacturers and their platform partners. The root cause is growing consumer and regulatory concern about pervasive household viewing surveillance conducted without sufficiently clear consumer consent or transparency about data usage practices across manufacturer software platforms. Some manufacturers are shifting toward contextual advertising models and clearer opt-in consent frameworks that preserve some advertising revenue while addressing regulatory and consumer privacy concerns proactively.
Market Impact: Advertising revenue per unit grew 30%

Extended Replacement Cycles Limit Unit Volume Growth

Consumers in developed markets increasingly hold onto existing smart TVs longer than previous generations, since improved build quality and slower meaningful feature differentiation between successive model years reduce the perceived urgency of upgrading to a newer television set. The root cause traces to genuine technological plateauing in core picture quality metrics that most consumers cannot easily distinguish between current and several-year-old premium models during typical retail comparison shopping. Some manufacturers are countering this trend by bundling exclusive content partnerships and software features unavailable on older television models to encourage earlier replacement.
Market Impact: Mini-LED shipments grew nearly 40%
3 additional market trends, 4 additional growth drivers, and 3 additional restraints and challenges are covered in the full report. Contact sales@marketmindsadvisory.com to access the complete intelligence.

Segment CAGR and Growth Architecture

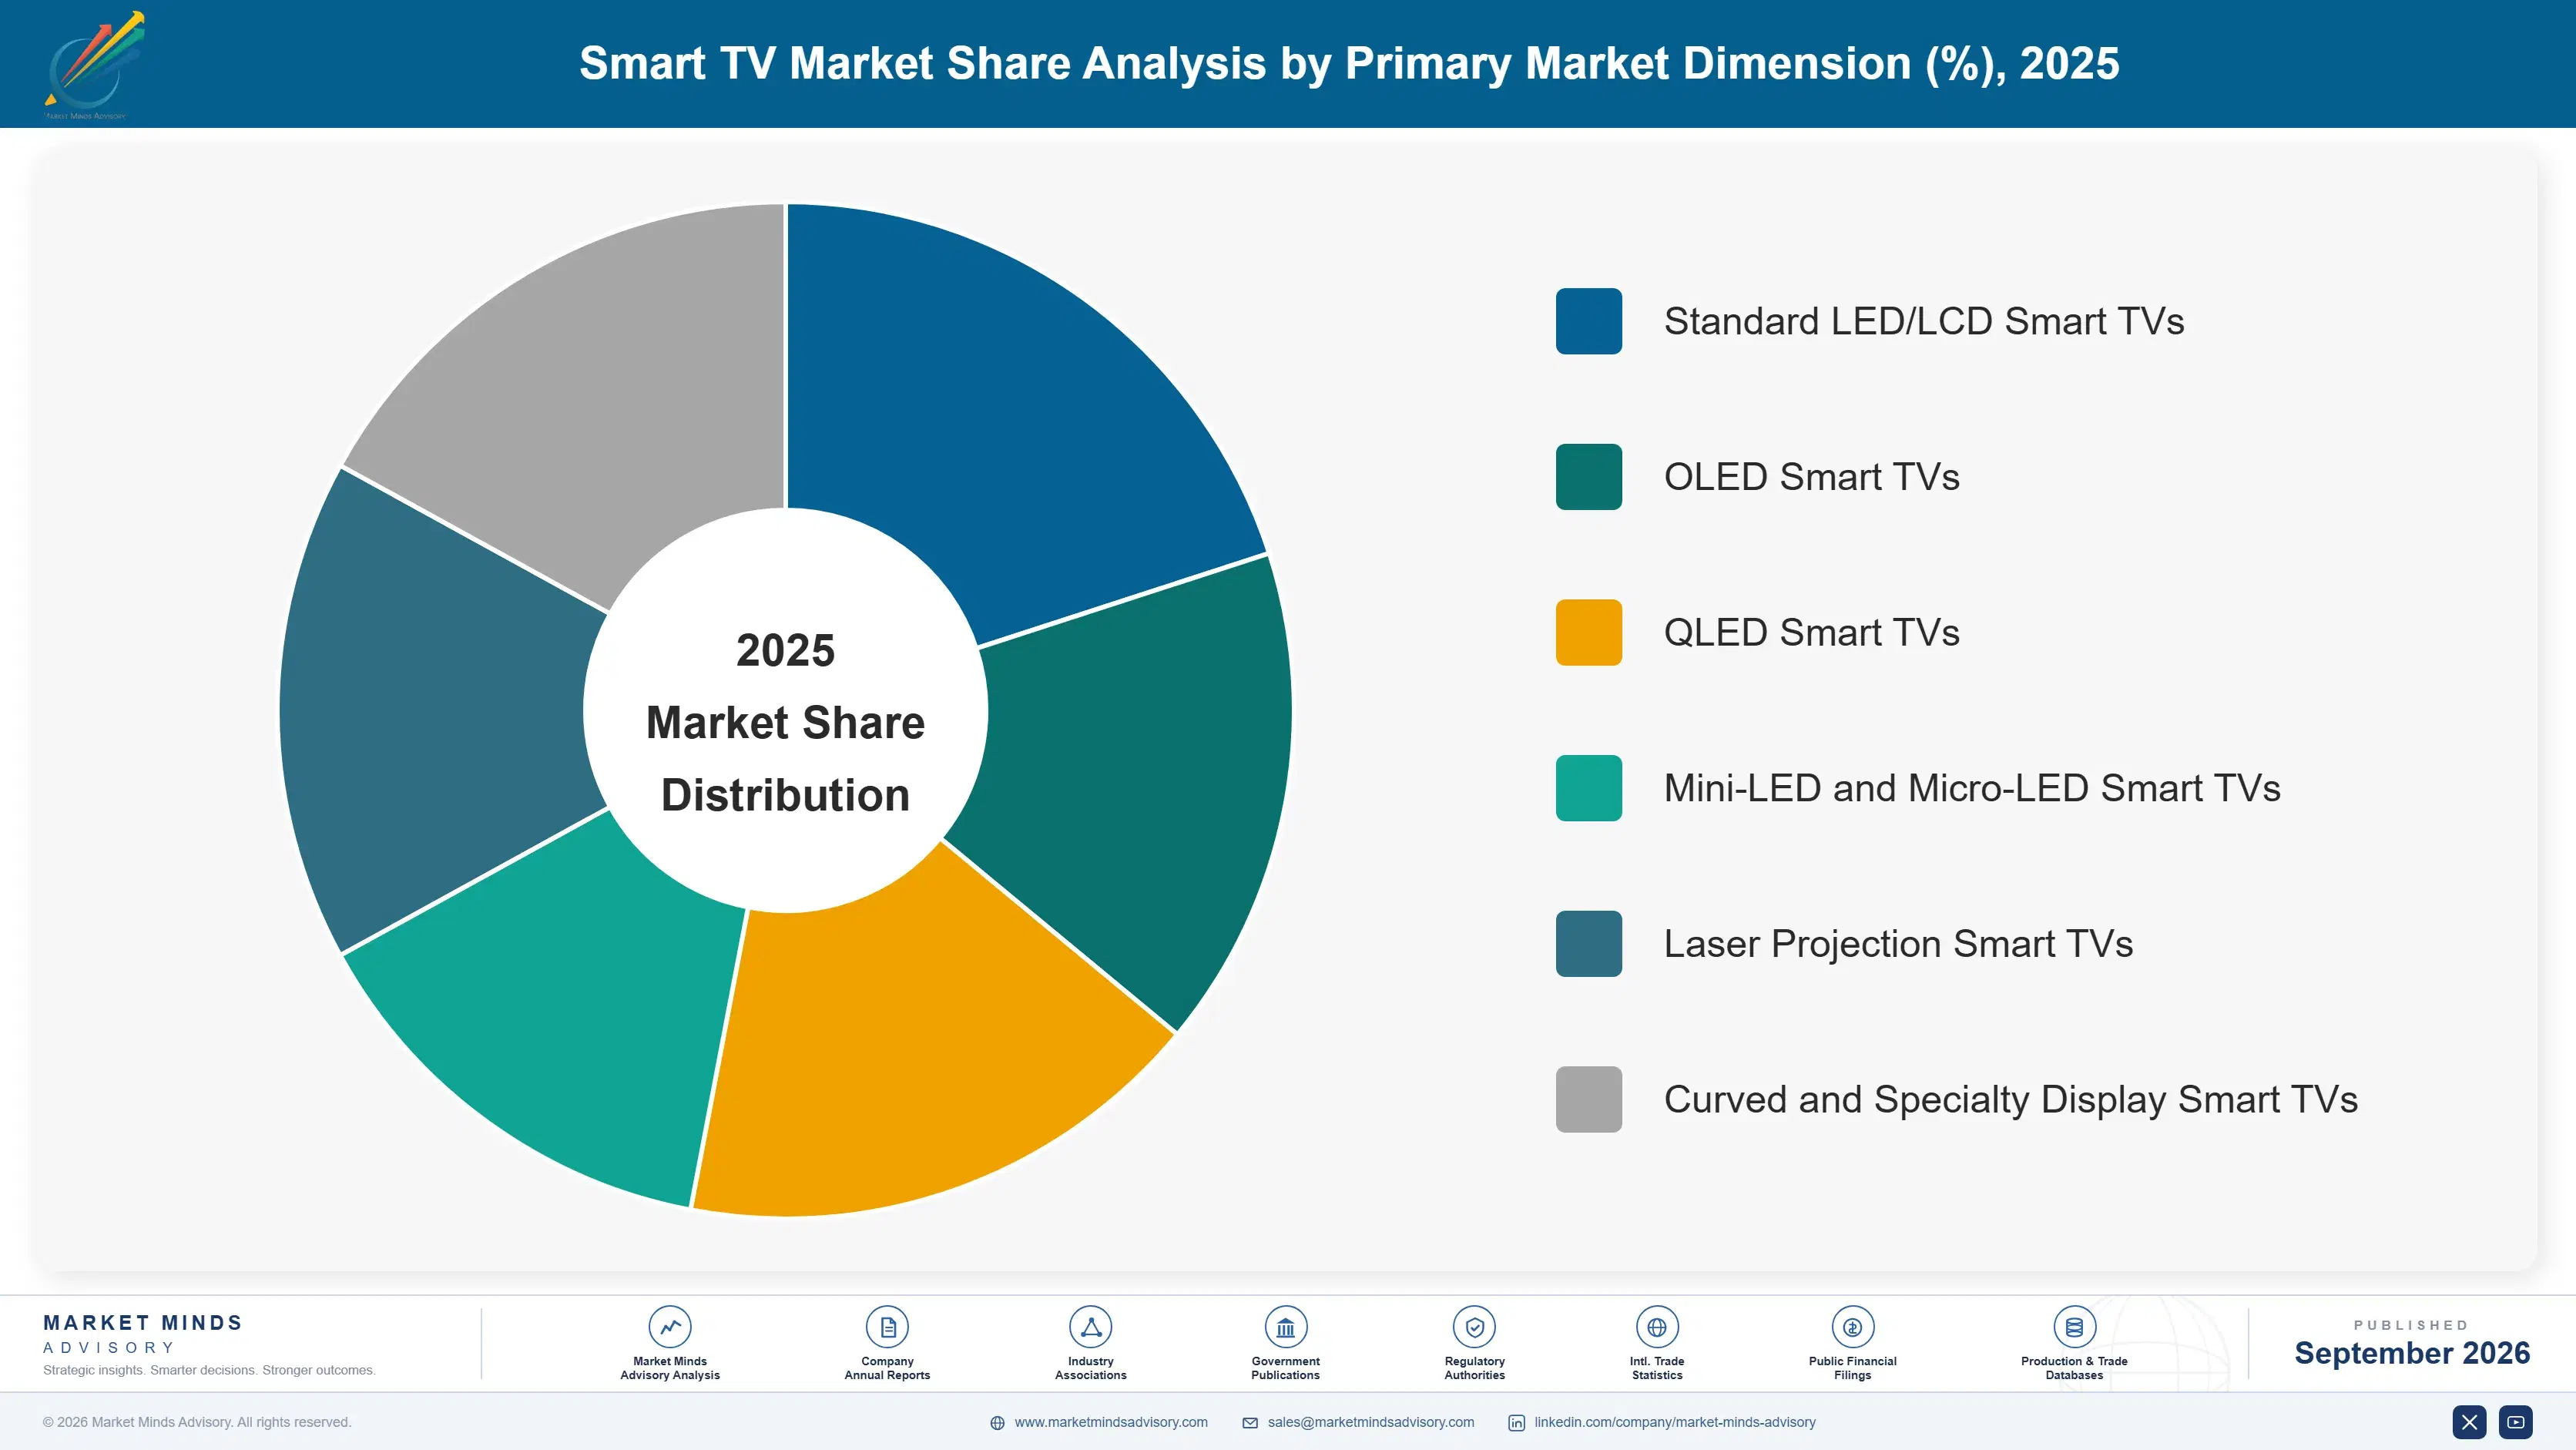
The Smart TV Market splits into six panel-technology-defined segments spanning display type and overall picture quality tier level. OLED panels lead growth as premiumization accelerates across developed markets, followed closely by mini-LED and micro-LED models, since both categories command meaningfully higher margins than standard LED/LCD panels. Laser and specialty displays round out the mix.
smart-tv-market-market-share-analysis-1788423610360

OLED Smart TVs

OLED smart TVs lead all segments because they deliver picture quality advantages, including true blacks and wider viewing angles, that discerning premium buyers increasingly prioritize over raw screen size when making replacement purchase decisions across most developed markets and metropolitan regions. Falling OLED panel manufacturing costs continue expanding the technology's addressable price range downward into upper mid-tier segments previously served exclusively by standard LED/LCD panels, broadening the customer base considerably each year. Manufacturers standardizing on OLED for their flagship product lines increasingly treat premium panel technology as their primary competitive differentiator against lower-cost rivals. MMA estimates this segment will represent well over a fifth of total category revenue by 2036.
CAGR 11.0%

Mini-LED and Micro-LED Smart TVs

Mini-LED and micro-LED smart TVs represent the second fastest-growing segment as the technology narrows the picture quality gap with OLED at meaningfully lower production cost, appealing to consumers wanting near-premium performance without paying the full OLED price premium demanded elsewhere across the broader retail market today. This technology convergence is expanding the addressable premium segment considerably faster than OLED adoption alone would achieve given persistent cost differences between the two competing display technologies available today across most leading brands worldwide. Manufacturers increasingly position mini-LED models as their primary mid-to-premium tier offering, capturing consumers trading up from standard panels who still find full OLED pricing prohibitively expensive for their household budget.
CAGR 10.0%
Full segment breakdown across 6 segments available in the complete report.

Regional Architecture and Country Demand Map

East Asia leads on concentrated brand manufacturing scale across Korean, Chinese, and Japanese producers, while North America follows closely on mature premium panel adoption and replacement spending. South Asia and Pacific grows fastest as smart TV penetration expands through previously underserved emerging households rapidly across the region.

North America

The United States drives most North American demand through continued premium panel upgrades and larger screen size trading up during replacement purchases, supported by strong retail promotional cycles around major shopping holidays including Black Friday and Cyber Monday each year across the entire country and its outlying territories. Canada contributes smaller but steady volume through similar retail patterns and replacement cycle purchasing across its major metropolitan centers and provinces from coast to coast. Domestic manufacturing remains limited, with most units imported from East Asian brands despite growing interest in supply chain resilience following recent trade policy uncertainty affecting the broader consumer electronics industry, retail pricing, and component sourcing decisions nationwide.
Share: 24% | CAGR: 6.5% (2026 to 2036)

Western Europe

Germany, France, and the United Kingdom anchor Western European demand, driven by steady replacement cycle purchasing and continued premium OLED adoption among design-conscious and technology-forward households across the region's major urban centers and surrounding suburbs, smaller towns, and outlying rural villages nationwide and beyond. Regional energy efficiency labeling requirements shape purchasing decisions more visibly here than in less regulated markets elsewhere, favoring manufacturers who can demonstrate genuine efficiency credentials across their entire product lineup and catalog offerings. Manufacturers serving this region increasingly invest in compliance testing and certification infrastructure to navigate evolving national and pan-European energy and data privacy standards currently in force and continuing to evolve considerably further still today.
Share: 19% | CAGR: 5.0% (2026 to 2036)
Regional intelligence for 5 additional markets available in the complete report: East Asia, South Asia and Pacific, Latin America, Middle East and Africa, Eastern Europe. Contact sales@marketmindsadvisory.com.
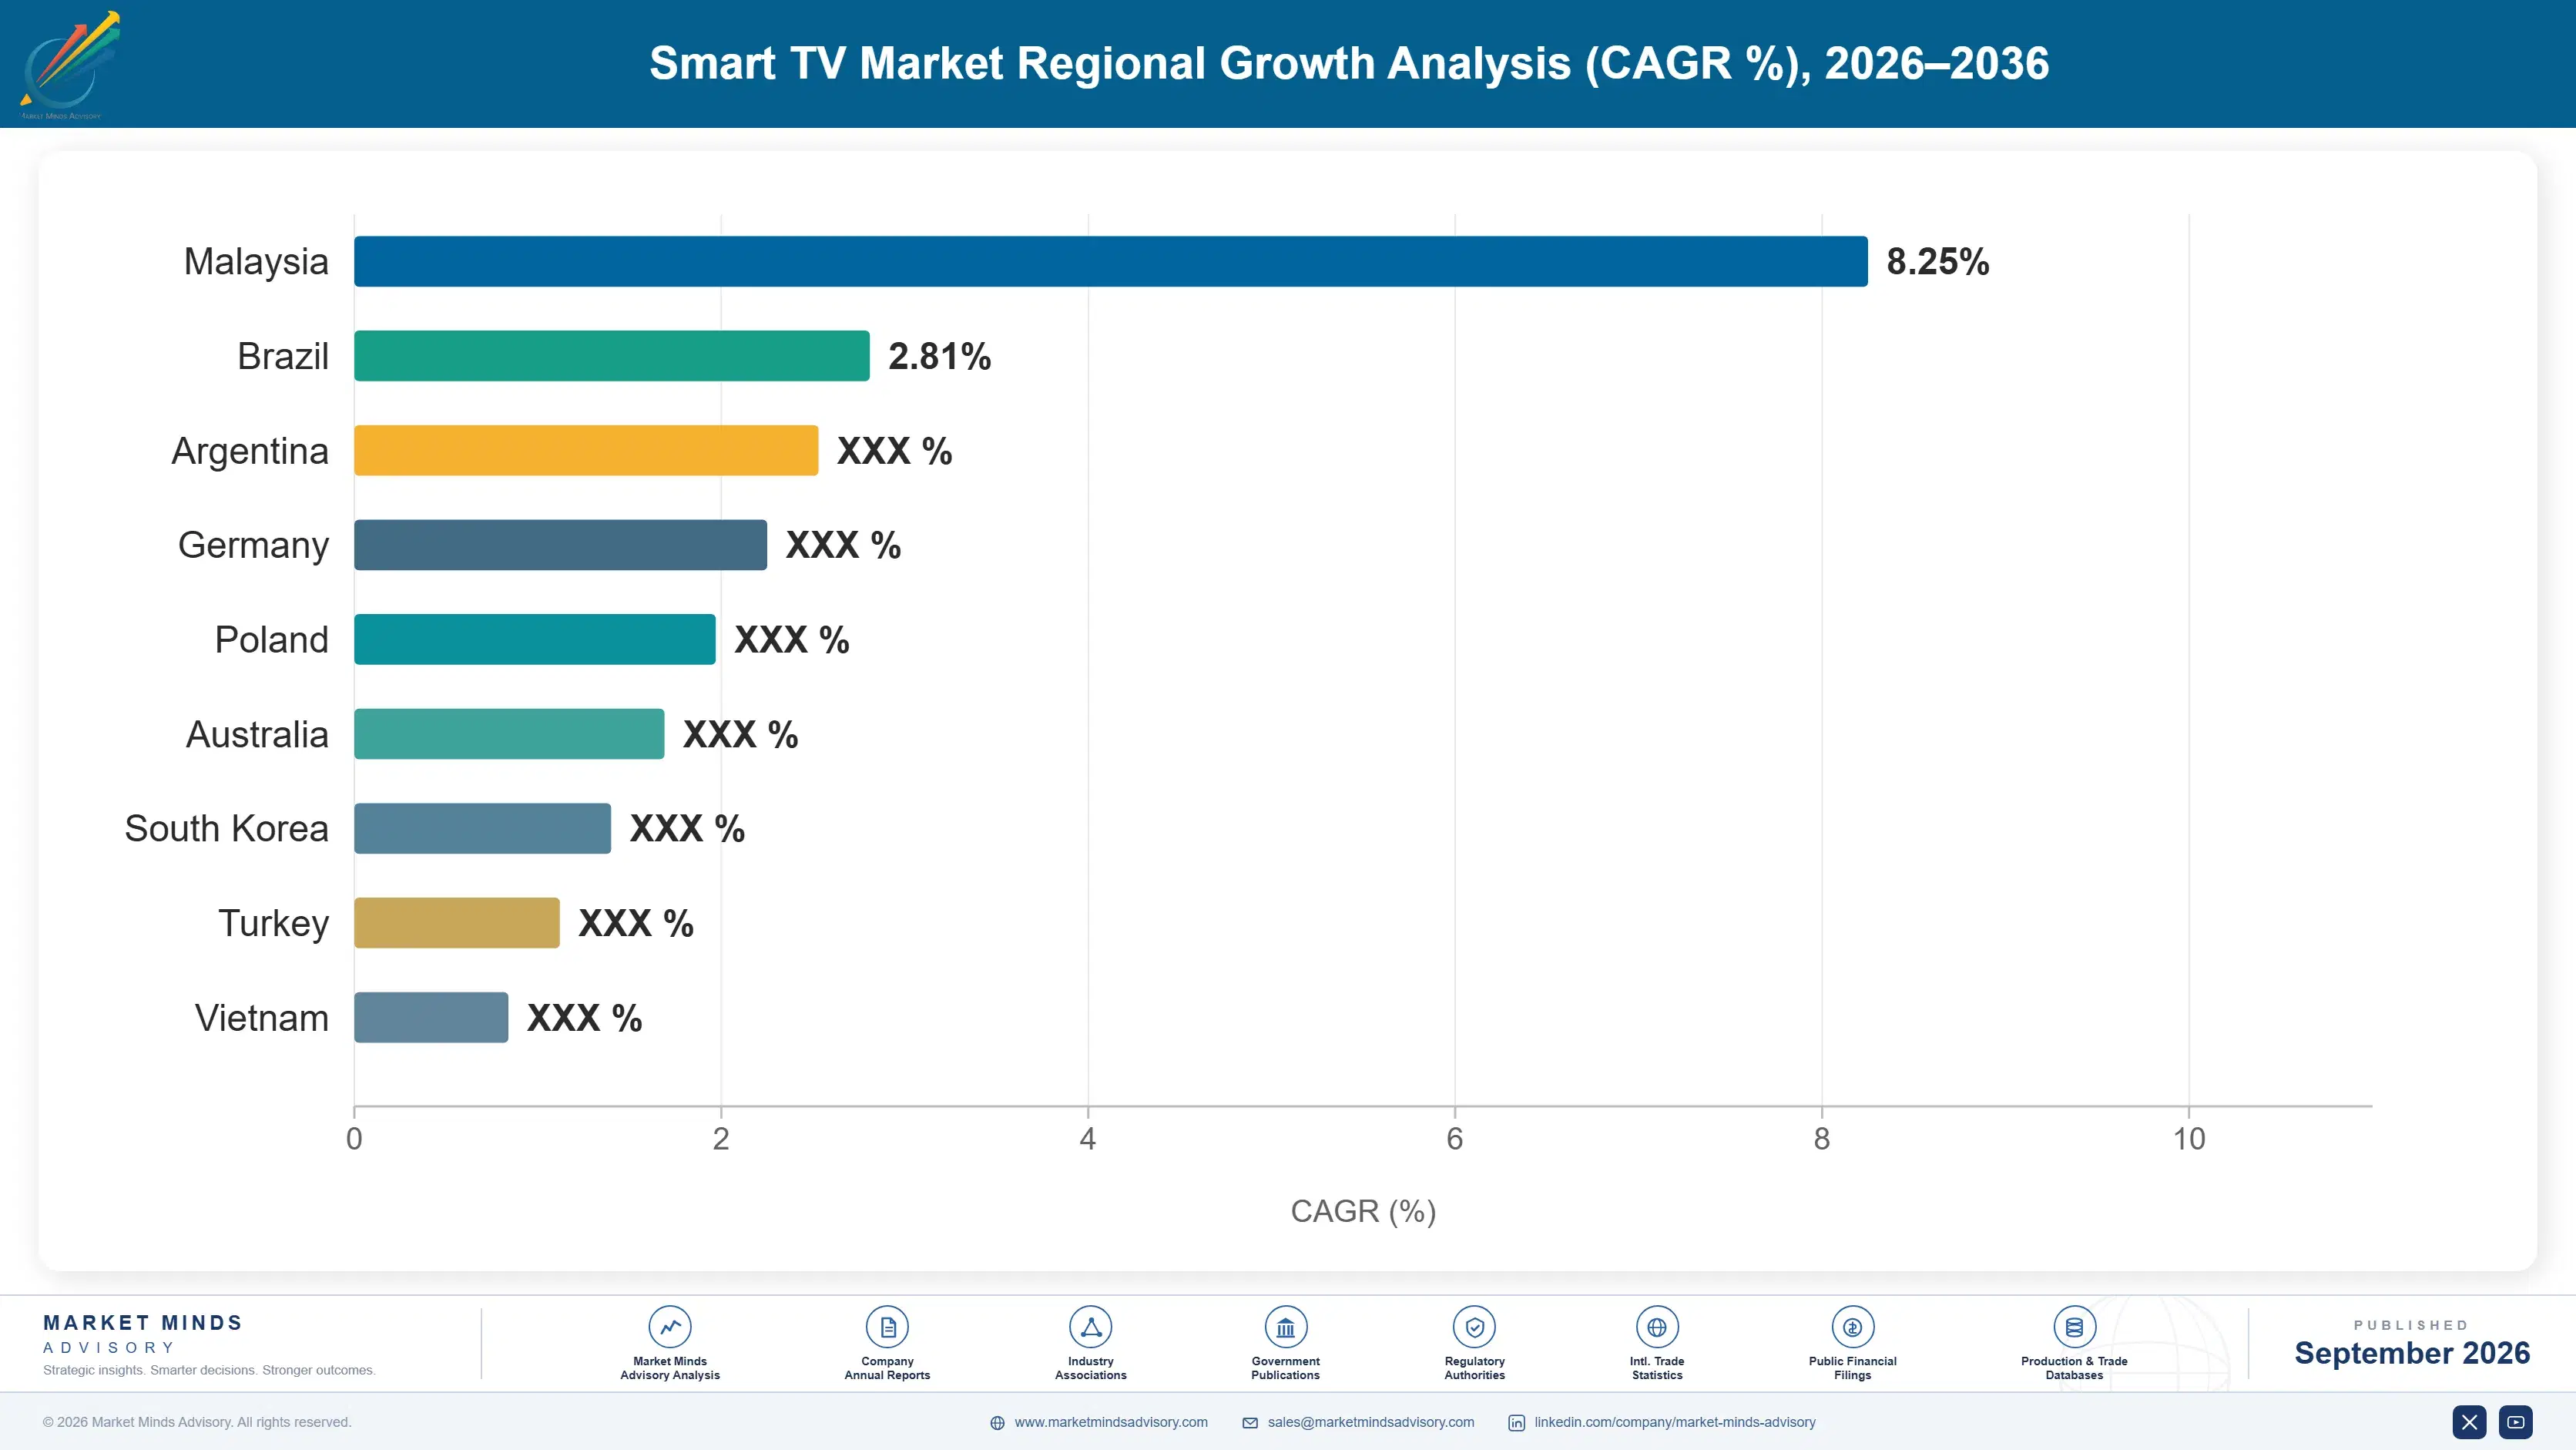
smart-tv-market-country-cagr-analysis-1788423610878

How Manufacturers Monetize the Screen After Sale

Smart TV manufacturers increasingly capture value well beyond the initial hardware sale through targeted advertising placement, content partnership revenue sharing, extended warranty support services, and premium software feature upgrade licensing that generate recurring income streams retailers and consumers alike increasingly expect bundled directly into modern television ownership and regular daily household use going forward.

Connected TV Advertising Placement and Revenue Sharing

Manufacturers sell targeted advertising placement directly on the smart TV home screen and content recommendation interface, capturing recurring advertising revenue that continues well beyond the initial hardware sale throughout the television's entire operational lifespan and beyond. This advertising revenue stream often generates more lifetime value than the original hardware margin captured at the point of sale, particularly for budget and mid-tier models sold at thin initial margins. Manufacturers report advertising revenue per unit running roughly 30% higher than three years ago as platform engagement and advertiser demand both continue expanding steadily.
Market Impact: Advertising revenue per unit grew roughly 30% overall

Premium Content Partnership and Bundling Agreements

Manufacturers negotiate exclusive content partnership and streaming service bundling agreements that generate referral revenue and subscription commission income on top of the original hardware sale margin captured at purchase from the initial retail transaction and store checkout. These partnerships typically favor manufacturers with the largest installed device base, since content partners pay premium placement fees to reach the widest possible audience of active viewers across multiple content categories. Manufacturers with strong content partnership programs report contract values running roughly 25% higher than comparable device sales lacking bundled content agreements attached.
Market Impact: Content partnership deals add roughly 25% higher value

Extended Warranty and Premium Support Services

Manufacturers sell extended warranty coverage and premium technical support services that guarantee television performance well beyond standard warranty periods, appealing particularly to consumers purchasing expensive premium OLED and mini-LED models representing significant household budget commitments and long-term financial investments made carefully and deliberately. This extended coverage typically adds meaningful recurring revenue on top of the original hardware sale, since consumers value predictable long-term cost certainty for their most expensive home entertainment purchase. Manufacturers offering this service report contract values running roughly 15% higher than comparable sales without extended warranty coverage attached.
Market Impact: Extended warranty coverage adds roughly 15% higher value

Software Feature Licensing and Platform Upgrades

Manufacturers sell software feature upgrade licenses that enable additional gaming, streaming, or smart home integration capability on existing television hardware without requiring physical equipment replacement, extending device capability well beyond its original factory specification and initial default configuration settings. This licensing revenue carries substantially higher margins than hardware sales, since software feature activation costs little to deliver once the underlying platform capability is already developed and deployed. Manufacturers adopting this upgrade path report contract values running roughly 2 times higher over the television's full operating lifespan compared to hardware-only sales.
Market Impact: Software licensing lifts lifetime value roughly 2 times

Who Controls the Margin Pool

Five participants, evaluated on annual smart TV shipment revenue across all screen sizes and panel technologies, together account for an estimated 55% of tracked market revenue, reflecting a moderately concentrated industry structure typical of mature consumer electronics categories. Samsung Electronics leads through premium panel technology and global brand recognition, while LG Electronics and TCL Technology compete closely for the mid-tier and value segments that neither has fully secured.
Current competitive activity centers on software platform advertising monetization, as manufacturers race to expand content partnership networks and viewer data collection capability before competitors capture the same advertising contract opportunities. Mini-LED technology investment has intensified over the past two years, as manufacturers pursue near-OLED picture quality at lower production cost to defend mid-tier market share against both premium and budget competitors simultaneously.

Emerging pressure comes from Chinese value brands expanding aggressively into premium panel segments once dominated exclusively by Korean and Japanese manufacturers, potentially disintermediating established players relying on brand premium alone. Rankings could shift meaningfully if a major streaming platform company acquires a television manufacturer outright, consolidating content distribution and hardware manufacturing capability that currently remains distributed across separate specialized companies.
smart-tv-market-company-positioning-matrix-1788423611395

Competitive Moat and Risk Dimensions

SAMSUNG ELECTRONICS

Moat: Premium Panel Technology Leadership

Samsung's continued investment in QLED and mini-LED panel technology gives it a persistent premium segment advantage that competitors struggle to match at comparable price points and picture quality levels. This technology leadership, combined with substantial global marketing scale, lets Samsung command premium pricing that smaller competitors cannot sustain profitably across comparable product tiers and screen size categories.
SAMSUNG ELECTRONICS

Risk: OLED Adoption Lag Versus LG

Samsung historically avoided OLED technology in favor of QLED alternatives, potentially leaving the company exposed as OLED panel costs continue falling and consumer preference increasingly favors OLED's superior contrast and viewing angle performance characteristics. Competitors with stronger OLED positioning could capture premium segment share Samsung's QLED-focused strategy struggles to fully address.
LG ELECTRONICS

Moat: Vertically Integrated OLED Manufacturing

LG's position as both a leading OLED panel manufacturer and a major television brand gives it manufacturing cost advantages and technology control that panel-buying competitors lack entirely. This vertical integration lets LG optimize panel and television design jointly while also selling OLED panels to competing television brands, capturing value across the entire value chain simultaneously.
LG ELECTRONICS

Risk: Higher Manufacturing Costs Than Rivals

LG's continued investment in OLED manufacturing capacity creates higher fixed costs than competitors relying on purchased LED/LCD panels from third-party suppliers, potentially limiting profitability if OLED demand growth slows relative to current capacity expansion plans. This cost structure could pressure margins if mini-LED alternatives continue narrowing the picture quality gap.

Players Tracked

Prominent Players

Samsung Electronics
LG Electronics
TCL Technology
Hisense
Sony

Other Key Players

Xiaomi
Skyworth
Panasonic
Sharp
Vizio
TP Vision (Philips)
Konka
Changhong
Haier
Toshiba (TVS Regza)
Roku
Amazon (Fire TV)
JVC
RCA
Insignia (Best Buy)

Recent Developments

JANUARY 2025

Samsung launched an expanded mini-LED television lineup featuring improved local dimming zone density and brightness performance, targeting the mid-to-premium segment where competitors continue narrowing the picture quality gap with OLED alternatives at meaningfully lower production cost and retail pricing across most global markets and regions.
Signal: Signals premium panel manufacturers are investing heavily in mini-LED to defend mid-tier segment share against rising competition.
MARCH 2025

LG announced a strategic partnership with a major streaming platform to pre-install exclusive content applications and advertising integration directly into its smart TV operating system, aiming to expand recurring advertising revenue beyond the initial hardware sale across its entire global product lineup and catalog offerings.
Signal: Signals television manufacturers are formalizing content partnerships to strengthen recurring software platform advertising revenue streams considerably.
JULY 2025

TCL acquired a smaller mini-LED panel technology startup last quarter, adding valuable proprietary backlighting intellectual property and engineering talent to its existing display technology portfolio as it continues expanding aggressively into premium market segments worldwide across multiple regions, product categories, price tiers, and retail channels.
Signal: Signals value-focused Chinese manufacturers are acquiring premium technology capability rather than developing it entirely from scratch internally.

Display Panel Cost Exposure

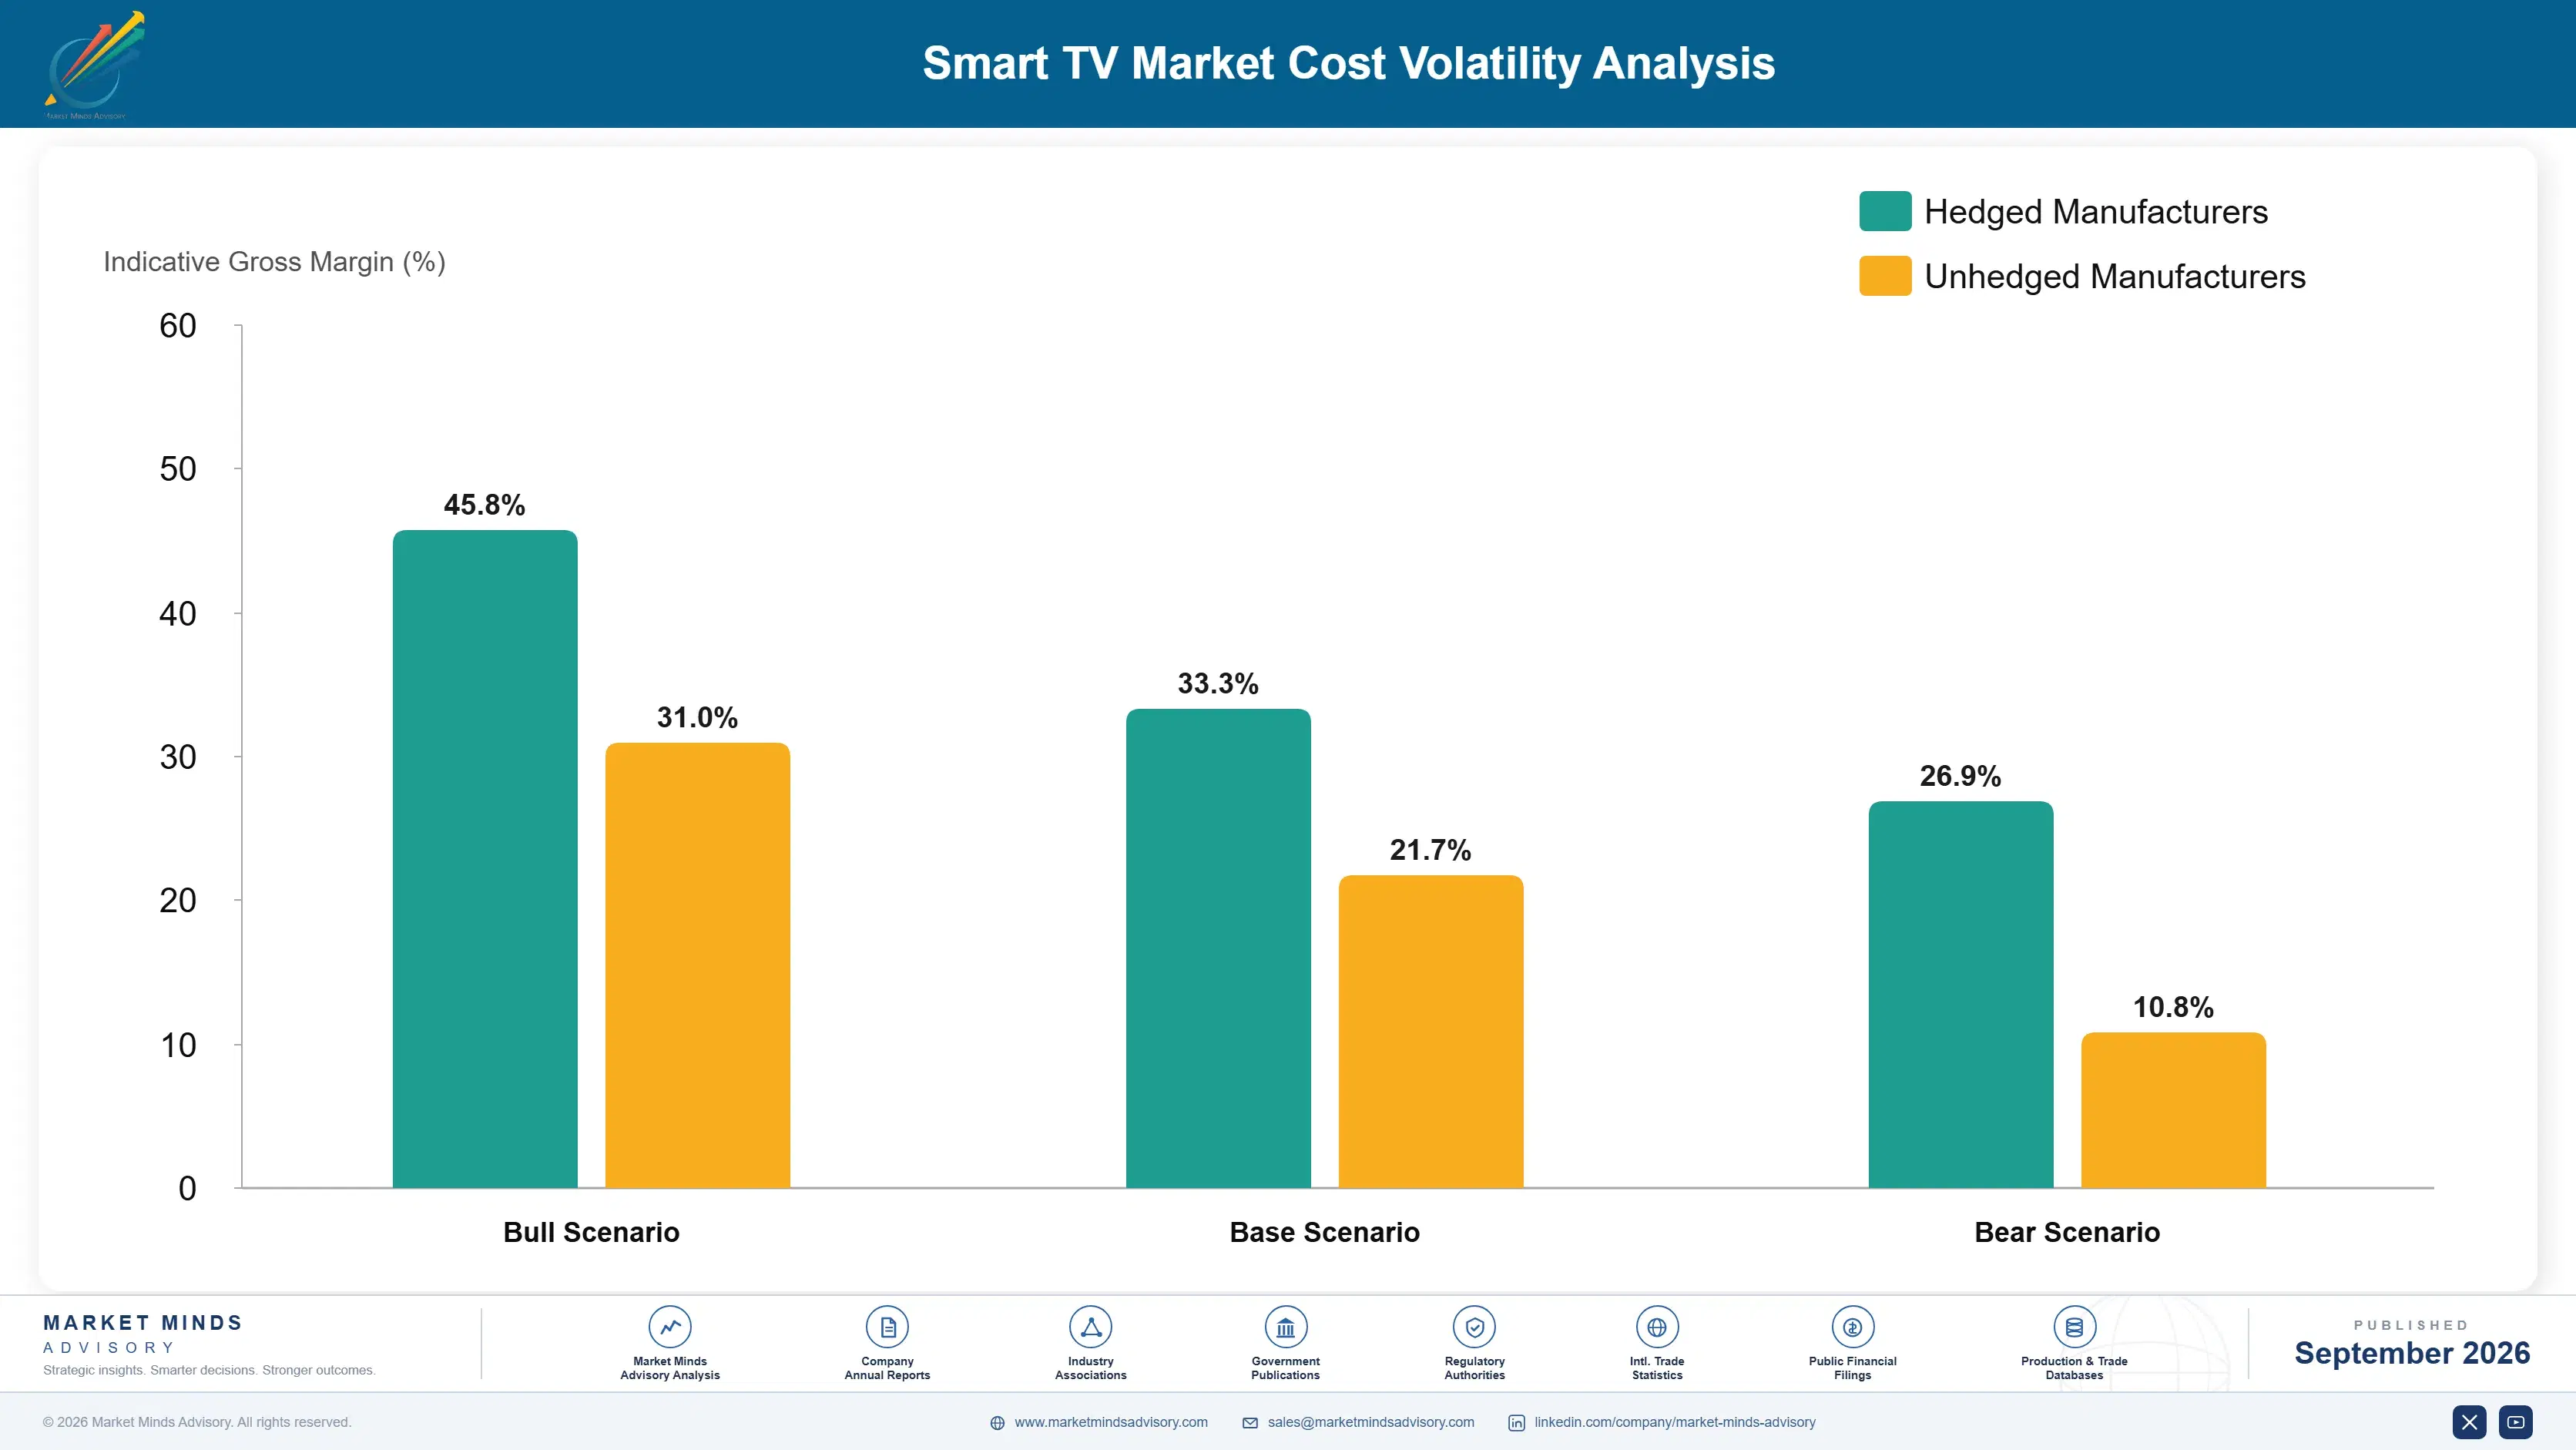
Display panels account for roughly 48% of smart TV cost of goods sold, with the large majority sourced from panel manufacturers concentrated in South Korea, China, and Taiwan operating substantial liquid crystal and OLED fabrication facilities today. Semiconductor chipsets and printed circuit boards add another 18%, sourced predominantly from East Asian component suppliers as well.
Panel pricing volatility documented in Samsung Display and LG Display quarterly investor disclosures showed panel prices swinging over 30% within a single year during the 2022 to 2023 period, driven by fluctuating global demand and periodic overcapacity in liquid crystal display manufacturing. Manufacturers absorbed pricing volatility differently depending on their vertical integration level, with panel-owning brands like LG weathering swings more comfortably than pure assembly manufacturers purchasing panels externally.

Smaller regional television assemblers carry meaningfully higher exposure than vertically integrated global brands, since they lack panel manufacturing capacity and must purchase at prevailing spot market prices during periods of tight supply. This creates a durable cost disadvantage concentrated among manufacturers lacking upstream panel production, effectively pricing many smaller regional assemblers out of premium panel segments where supply access matters most during periods of constrained availability.
smart-tv-market-cost-volatility-analysis-1788423611590

Long-Term Panel Supply Agreements

Leading brands now negotiate multi-year panel supply agreements with fixed pricing bands, reducing exposure to spot market volatility that historically compressed margins during periods of panel oversupply or shortage. This approach adds contractual complexity but meaningfully stabilizes input costs across product planning cycles, a tradeoff most large manufacturers now consider worthwhile given recent pricing volatility.

Vertical Integration Into Panel Manufacturing

Several brands have invested directly in panel manufacturing capacity or joint ventures with panel producers, capturing manufacturing margin internally rather than paying market prices to independent panel suppliers each purchasing cycle every year. This vertical integration requires substantial capital investment but provides meaningful cost and supply security advantages over competitors relying entirely on external suppliers.

Portfolio Architecture for Margin Defence

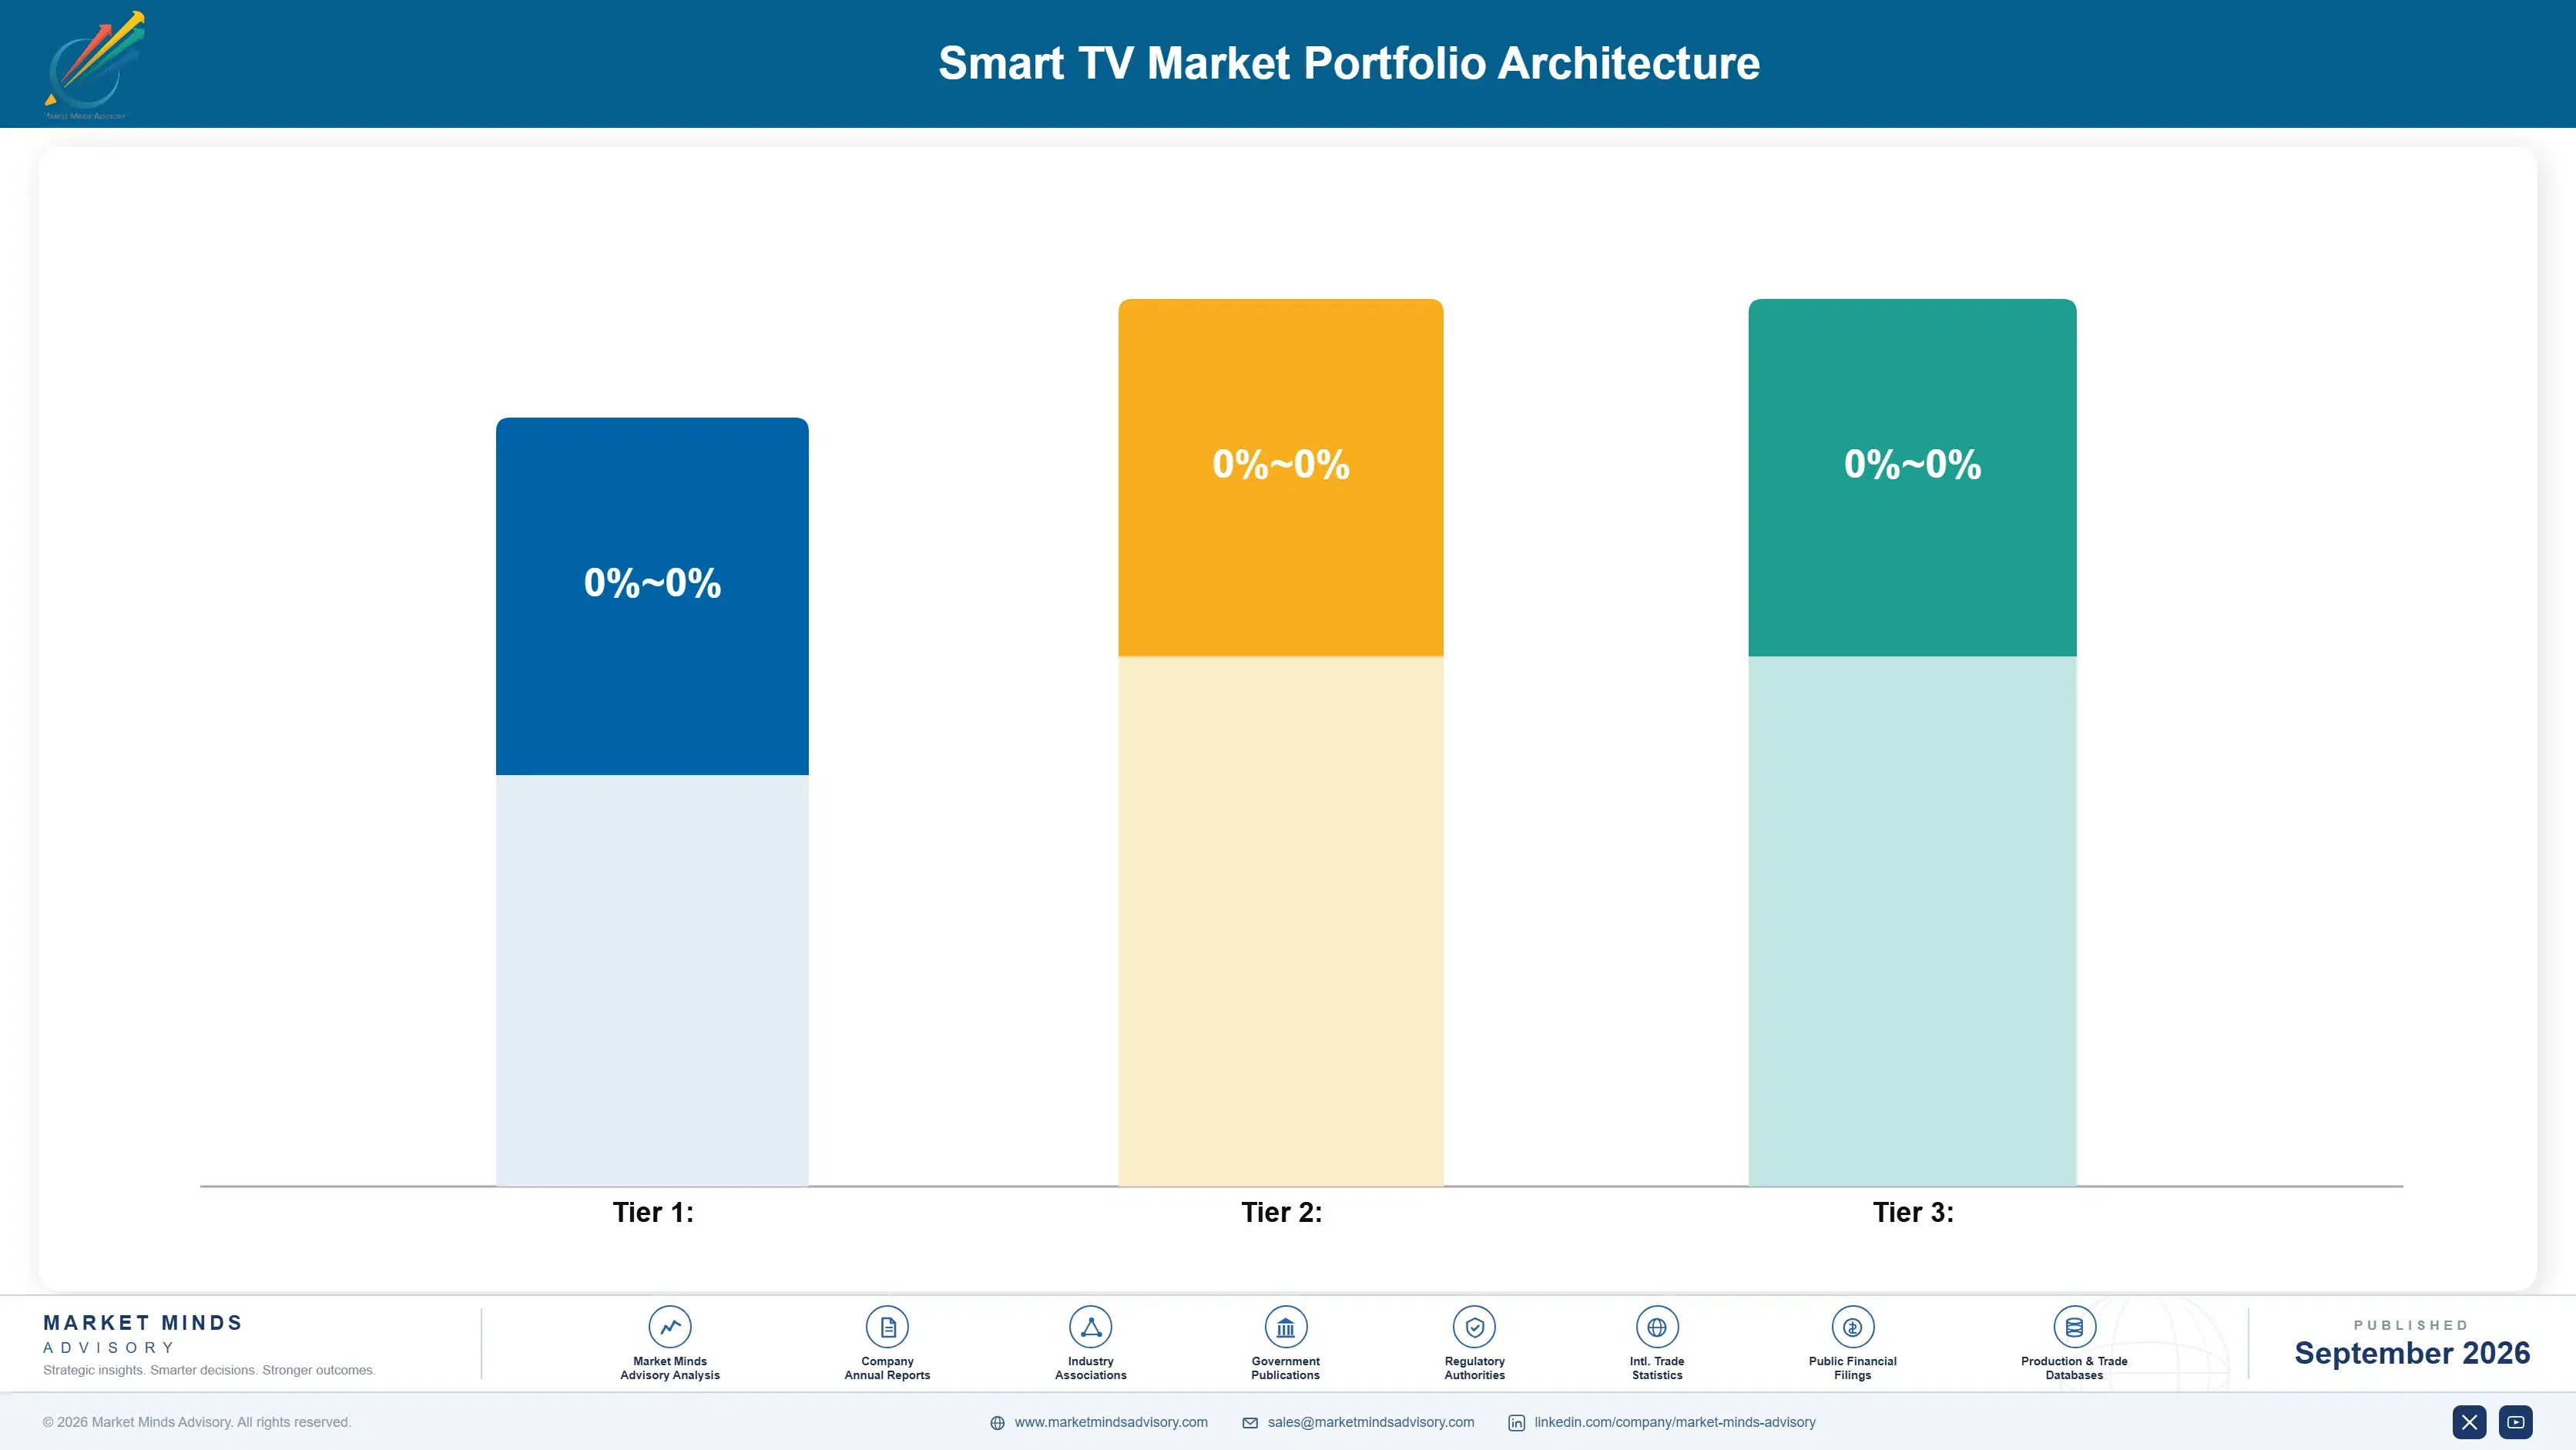
Smart TV manufacturers run a three-tier margin structure spanning entry-level standard LED/LCD models, certified premium panel televisions carrying OLED or mini-LED technology, and next-generation micro-LED and laser display designs commanding aspirational flagship pricing. Gross margins range from roughly 8% on basic commodity models to over 30% on certified premium panel televisions carrying meaningfully higher display technology and software platform integration investment.
Volume economics still dominate unit shipments, since most tracked retail categories still prioritize affordable standard panel televisions over premium feature sets, but the tension between volume and premium positioning has sharpened as OLED and mini-LED penetration accelerates across mid-tier price points previously reserved exclusively for standard panels. Manufacturers increasingly favor the premium tier, where display technology differentiation and advertising platform revenue provide more durable margin protection than commodity hardware sales alone.

High-value margin pools concentrate specifically in advertising platform revenue and premium panel technology rather than in standard commodity television sales, reflecting the broader industry shift toward software and content monetization as commodity hardware pricing pressure intensifies. Manufacturers capturing this premium panel and platform revenue early tend to retain brand loyalty and customer lifetime value longer than those competing purely on basic unit price.

Entry-level standard LED/LCD smart TVs sold primarily on price to budget-conscious consumers prioritizing basic internet connectivity over premium picture quality and advanced display technology features across most retail channels today.
Gross Margin

Certified premium panel televisions featuring OLED or mini-LED display technology, bundled with advanced software platform features that design-conscious and technology-forward consumers increasingly demand for their primary home entertainment purchase each year.
Gross Margin

Next-generation micro-LED and laser projection display designs positioning manufacturers for aspirational flagship pricing in specialized applications where advanced display technology commands premium margins from early adopter consumers willing to pay considerably more.
Gross Margin
smart-tv-market-portfolio-architecture-1788423612086

High-value Sub-segments and Strategic Watch-out

OLED Smart TVs

OLED smart TVs combine the fastest segment growth in the entire portfolio with the strongest margin expansion, as consumers pay premium pricing for superior contrast and viewing angle performance across most developed retail markets and metropolitan regions worldwide this current decade and well into the next.

Mini-LED and Micro-LED Smart TVs

Mini-LED and micro-LED smart TVs carry the second fastest growth and narrowing cost gap with OLED, generating strong margin performance as manufacturers position the technology as accessible near-premium performance for mid-tier buyers seeking genuine value overall across most retail channels, regions, price tiers, and markets.

Standard LED/LCD Smart TVs

Standard LED/LCD smart TVs remain the largest volume category by unit shipments, generating steady if unspectacular revenue even as commodity pricing pressure continues compressing hardware margins across most tracked price tiers globally this current forecast period and considerably beyond it as well into the future.

Laser Projection Smart TVs

Laser projection smart TVs warrant close monitoring, since continued OLED and mini-LED cost reduction could commoditize the ultra-large screen premium segment this niche technology currently serves relatively exclusively among affluent buyers today across most tracked markets, regions, price tiers, retail channels, and applicable product categories.

The Advertising Annuity Behind the Screen

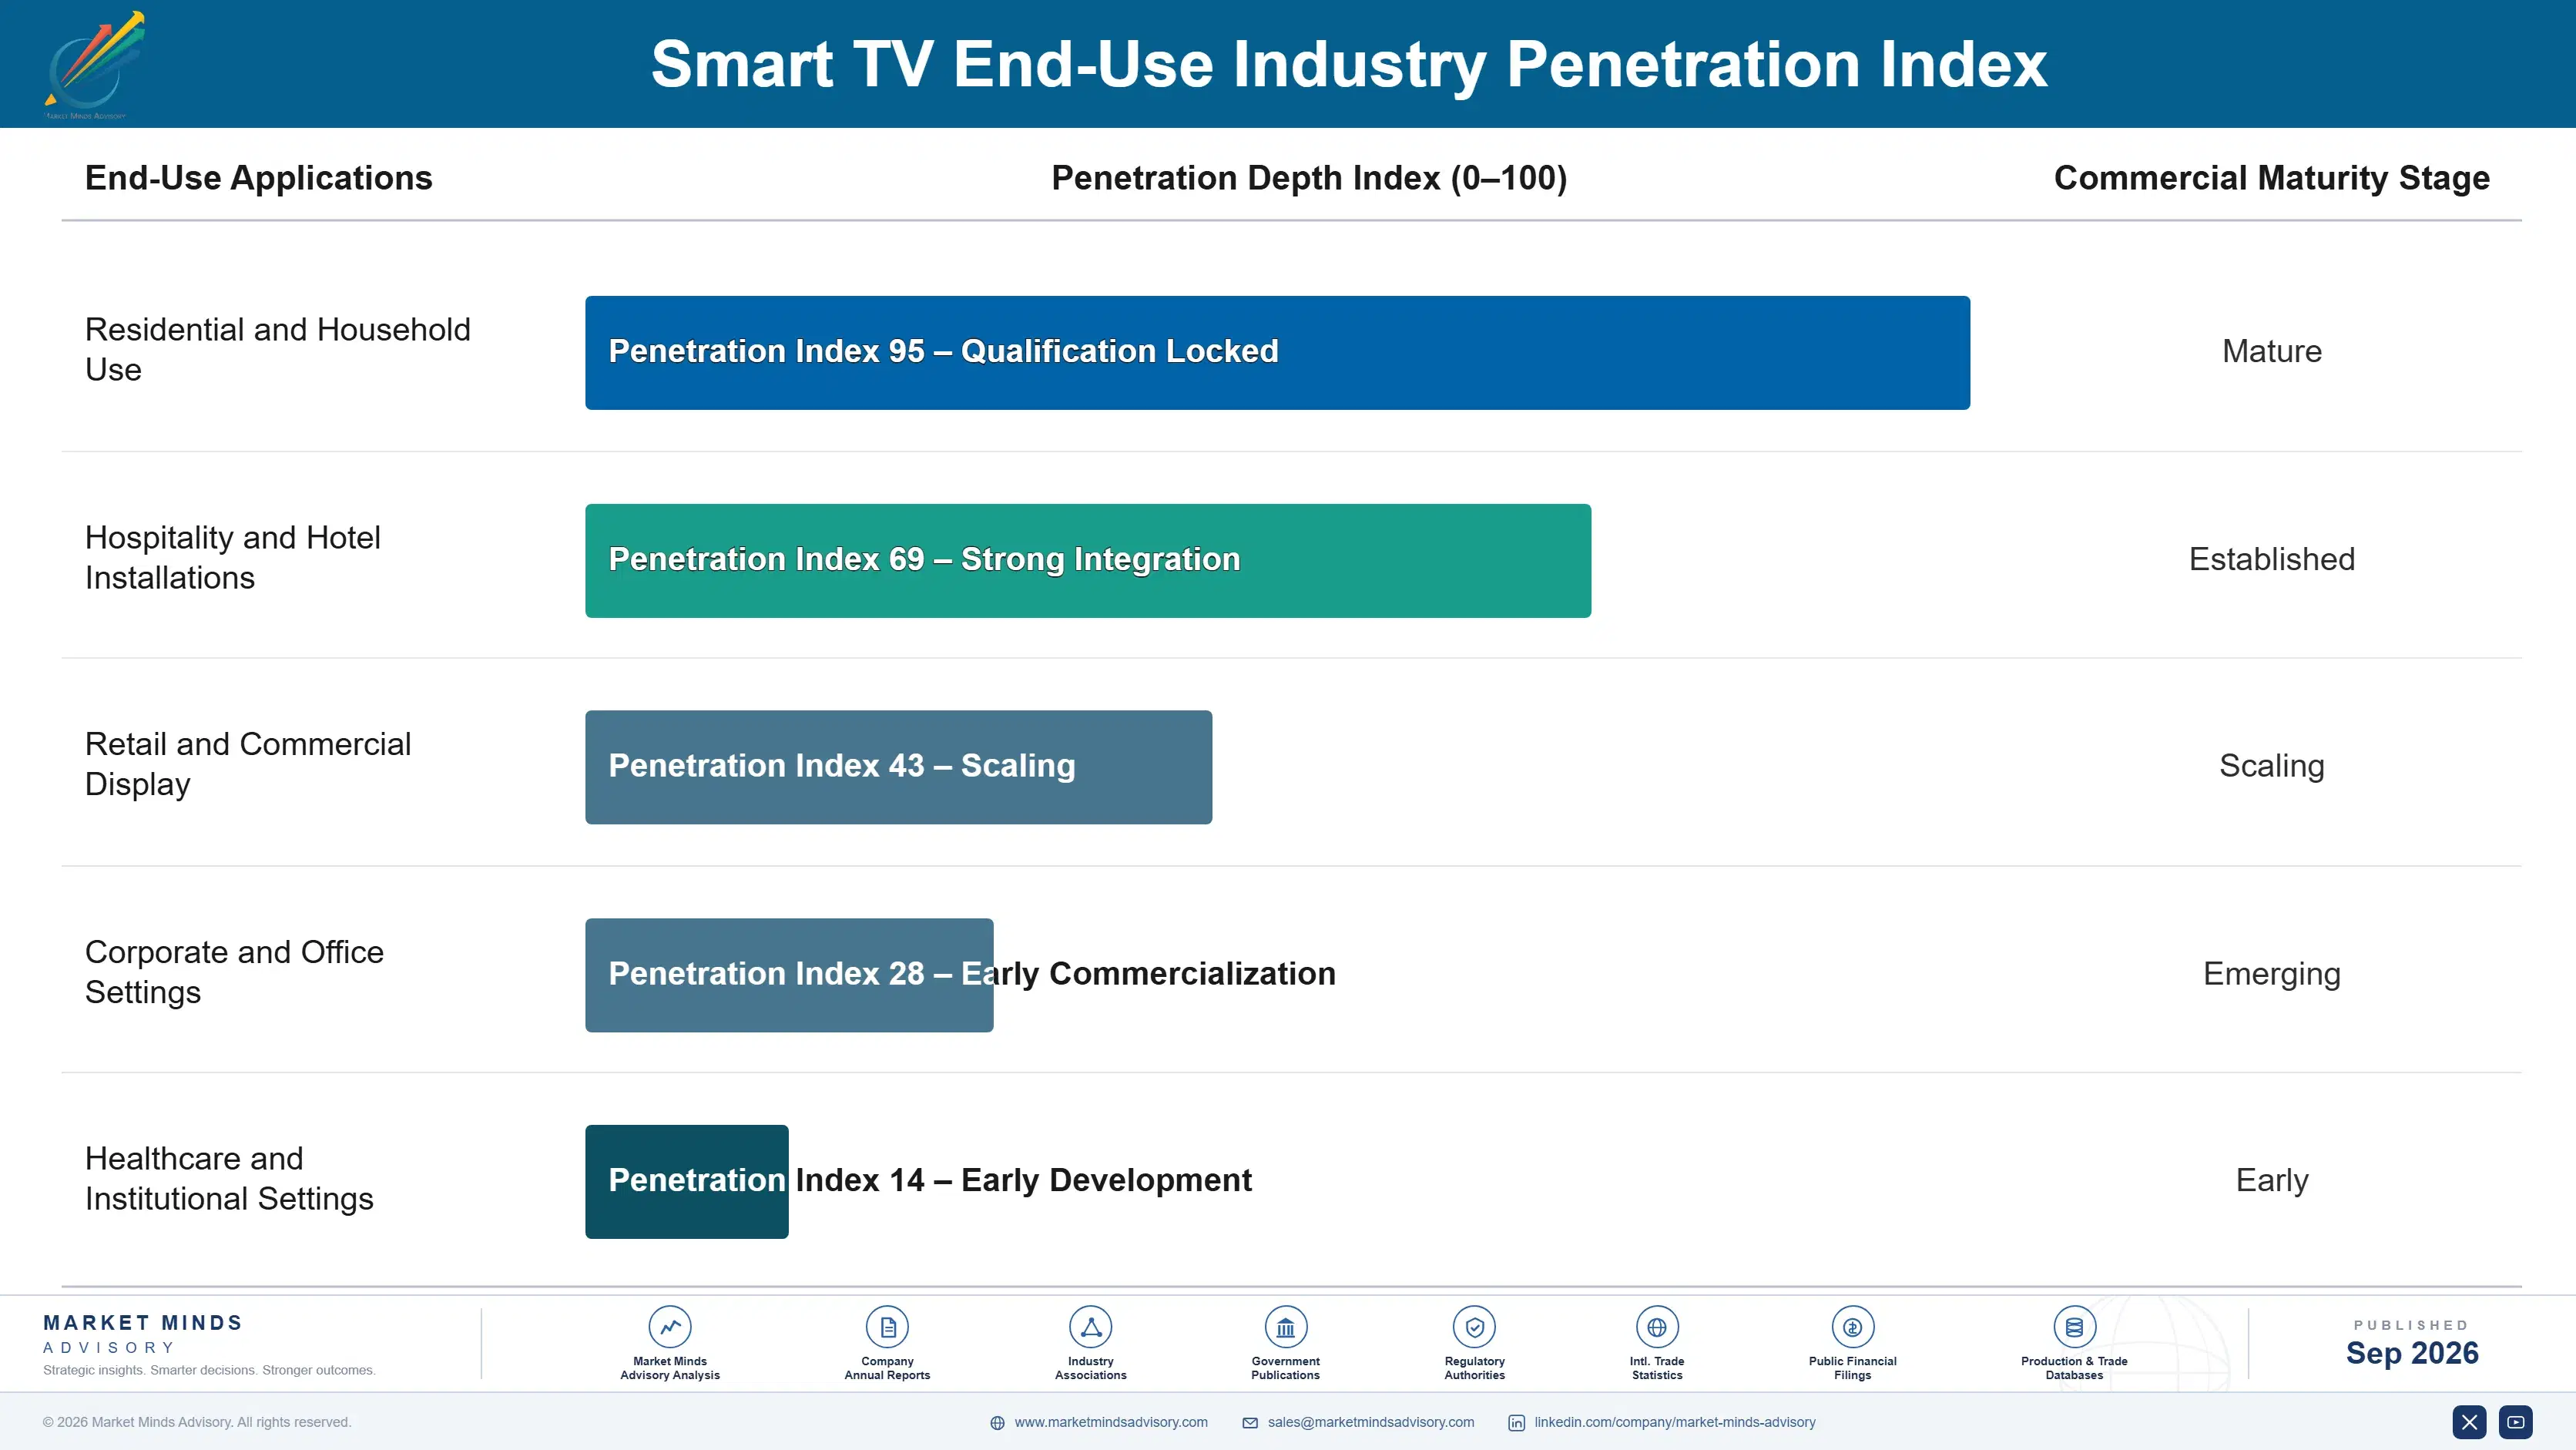
Roughly 25% of tracked manufacturer revenue now comes from recurring software platform advertising and content partnership income rather than one-time hardware margin captured at the point of sale, reflecting the annuity-style economics that increasingly define connected television ownership once a unit enters a household and remains active for many years of continuous daily use and viewing across the family.
Adoption depth varies meaningfully by end-use vertical: households in developed markets show the deepest platform engagement stickiness given established streaming habits and multi-year device ownership patterns built over successive purchase cycles spanning a decade or more, while emerging market households show comparatively shallower software platform monetization since broadband infrastructure and streaming subscription penetration remain less developed in many regions still building out digital infrastructure and connectivity access.

A generational shift in buyer profiles is underway as purchase decision responsibility moves from technically focused early adopters toward mainstream households who prioritize simplicity, content availability, and value pricing over raw display technology specifications and hardware performance metrics that once dominated buying decisions, changing how manufacturers position new products toward procurement decisions increasingly driven by streaming service compatibility rather than panel technology alone or exclusively.
smart-tv-market-end-use-penetration-index-1788423612573

Where Smart TV Value Concentrates Next

These are among the four positions where our research anticipates prominent divergence between winners and laggards over the coming forecast period. Each is grounded in the demand model, the regulatory perimeter, and the announced capacity pipeline.
01 / ADVERTISING PLATFORM INVESTMENT

Prioritize software monetization over hardware margin alone

Hardware margins on standard commodity television models continue compressing as manufacturing scale spreads across more competitors globally, leaving basic unit sales as an increasingly weak foundation for sustainable long-term profitability in this category. Manufacturers building strong advertising platform and content partnership capability capture meaningfully higher lifetime value per unit than competitors treating the television purely as a one-time hardware transaction. This platform strategy will only become more important as streaming habits deepen and advertising demand for connected television inventory continues expanding steadily worldwide.
02 / PREMIUM PANEL TECHNOLOGY RACE

Invest in mini-LED before OLED costs fall further

Mini-LED technology currently offers manufacturers a genuine window to capture near-premium pricing at meaningfully lower production cost than OLED, but this window will narrow considerably as OLED manufacturing costs continue falling toward mini-LED price parity over time. Manufacturers investing now in mini-LED capacity and marketing can capture mid-tier premium segment share before OLED becomes affordable enough to serve that same price-conscious buyer segment directly. Delaying this investment risks missing the current cost advantage window entirely as competing display technologies continue converging on price.
03 / EMERGING MARKET MANUFACTURING SCALE

Expand Southeast Asian and Indian assembly capacity now

Rising smart TV adoption across India and Southeast Asia represents the market's fastest-growing demand pool, yet most current manufacturing capacity remains concentrated in China and South Korea serving these markets primarily through export shipment. Manufacturers building local assembly capacity closer to these fast-growing emerging markets can reduce shipping costs and import tariff exposure while responding faster to shifting local consumer preferences. This regional manufacturing proximity advantage will compound as emerging market volume continues growing faster than developed market replacement demand over the coming decade.
04 / PRIVACY COMPLIANCE POSITIONING

Build transparent consent frameworks ahead of tightening rules

Data privacy regulation governing automatic content recognition and viewing behavior collection remains inconsistent across markets today but is clearly tightening in several developed jurisdictions concerned about pervasive household surveillance practices embedded in smart TV software platforms. Manufacturers that proactively adopt transparent consent frameworks now will avoid costly retrofitting later and can market privacy compliance as a genuine competitive advantage over rivals still relying on opaque data collection practices. This positioning matters most in Western Europe, where regulatory scrutiny is advancing fastest among all tracked regional markets globally.

Engagement Snapshot From the Field

A live engagement with an industry participant carrying material or product regulatory and market exposure ahead of a defining policy shift, showing how our research translates into a defensible multi-year portfolio strategy.
MARKET MINDS ADVISORY · CLIENT ENGAGEMENT SUMMARY
Smart TV Producer Strategic Portfolio Review and Transition Roadmap 2026·Investment Scenario on Smart TV Exposure Evaluation 2025-26
CLIENT PROFILE
The client is a mid-sized consumer electronics retail chain operating approximately 60 stores across the southeastern United States, selling televisions alongside broader home appliance and electronics categories. The company reported approximately $650 million (client-reported, unverified by MMA) in annual revenue, with television sales representing its largest single product category and a key driver of overall store foot traffic and cross-selling opportunities.
STRATEGIC CHALLENGE
The retailer needed to determine optimal shelf space and marketing allocation across standard LED/LCD, OLED, and mini-LED television categories, given limited retail floor space and genuine uncertainty about how quickly premium panel technology adoption would accelerate among its price-sensitive regional customer base compared to national retail chain benchmarks and industry trends.
MMA APPROACH
MMA analyzed regional consumer purchasing patterns, benchmarked premium panel adoption rates against comparable national retail chains, and interviewed the retailer's merchandising and sales leadership teams to assess realistic near-term demand shifts across panel technology tiers given the company's specific regional customer demographic profile, income distribution, and typical shopping behavior patterns.
KEY FINDINGS
  1. Mini-LED models generated meaningfully higher gross margin per unit sold compared to standard LED/LCD models occupying comparable floor space and square footage.
  2. Regional customer surveys showed price sensitivity outweighed panel technology preference for over 55% (client-reported, unverified by MMA) of the retailer's core middle-income customer segment.
  3. OLED models sold primarily to a narrow affluent customer segment representing under 15% (client-reported, unverified by MMA) of total store foot traffic across all locations.
  4. Sales staff commission structure favoring premium panel sales had inadvertently created customer trust issues, documented through post-purchase satisfaction survey feedback collected regularly.
CLIENT PROFILE
The client is a mid-sized consumer electronics retail chain operating approximately 60 stores across the southeastern United States, selling televisions alongside broader home appliance and electronics categories. The company reported approximately $650 million (client-reported, unverified by MMA) in annual revenue, with television sales representing its largest single product category and a key driver of overall store foot traffic and cross-selling opportunities.
STRATEGIC CHALLENGE
The retailer needed to determine optimal shelf space and marketing allocation across standard LED/LCD, OLED, and mini-LED television categories, given limited retail floor space and genuine uncertainty about how quickly premium panel technology adoption would accelerate among its price-sensitive regional customer base compared to national retail chain benchmarks and industry trends.
MMA APPROACH
MMA analyzed regional consumer purchasing patterns, benchmarked premium panel adoption rates against comparable national retail chains, and interviewed the retailer's merchandising and sales leadership teams to assess realistic near-term demand shifts across panel technology tiers given the company's specific regional customer demographic profile, income distribution, and typical shopping behavior patterns.
KEY FINDINGS
  1. Mini-LED models generated meaningfully higher gross margin per unit sold compared to standard LED/LCD models occupying comparable floor space and square footage.
  2. Regional customer surveys showed price sensitivity outweighed panel technology preference for over 55% (client-reported, unverified by MMA) of the retailer's core middle-income customer segment.
  3. OLED models sold primarily to a narrow affluent customer segment representing under 15% (client-reported, unverified by MMA) of total store foot traffic across all locations.
  4. Sales staff commission structure favoring premium panel sales had inadvertently created customer trust issues, documented through post-purchase satisfaction survey feedback collected regularly.
RECOMMENDED STRATEGY
Phase 1: Phase one: reallocate floor space toward mini-LED models as the primary premium offering rather than leading with full OLED displays. Phase 2: Phase two: retrain sales staff on value-based selling emphasizing total cost of ownership rather than aggressive premium panel upselling tactics. Phase 3: Phase three: launch targeted marketing campaigns highlighting mini-LED value proposition specifically to the retailer's core middle-income customer segment nationwide and regionally.
OUTCOME
The retailer reported a 14% (client-reported, unverified by MMA) increase in average television transaction value within two quarters of the merchandising shift, alongside meaningfully improved customer satisfaction survey scores related to sales staff trustworthiness and overall product recommendation quality across every one of its store locations.

Frequently Asked Questions

Foundational context covering the market sizes, CAGR, scope, country, region and competition that inform every finding below. This section is provided to cover basics and most often pre-purchase conversations, answered from the MMA Primary Research Dataset.

What is the current size of the Smart TV Market?

The global smart TV market reached an estimated $180.0 billion in 2025. Growth reflects continued panel premiumization and expanding software platform advertising revenue across most tracked regional markets.

How large will the Smart TV Market be by 2036?

MMA projects the market will reach approximately $359.85 billion by 2036. Growth is driven by continued premiumization, emerging market unit expansion, and advertising platform monetization.

What is the CAGR for the Smart TV Market 2026 to 2036?

The market is projected to grow at a compound annual growth rate of 6.5% between 2026 and 2036. This reflects a mature but still expanding consumer electronics category.

Which segment is growing fastest?

OLED smart TVs are the fastest-growing segment, expanding at roughly 11.0% annually. This significantly outpaces the overall market's projected growth rate through the forecast period.

Who are the major companies in the Smart TV Market?

Leading companies include Samsung Electronics, LG Electronics, TCL Technology, Hisense, and Sony. These five participants together account for an estimated 55% of tracked global market revenue.

Which country is growing fastest?

India is the fastest-growing country market, expanding at approximately 9.0% annually. Falling panel prices and expanding broadband infrastructure drive this sustained conversion from basic television sets.

Report Segmentation Architecture

The full report scope spans multiple orthogonal segmentation dimensions, with cross-tabulated demand data provided for each dimension pair. Coverage extends further to regional breakdowns, trend trajectories, and the competitive detail needed to support segment-level decision-making.

By Primary Market Dimension

  • Standard LED/LCD Smart TVs
  • OLED Smart TVs
  • QLED Smart TVs
  • Mini-LED and Micro-LED Smart TVs
  • Laser Projection Smart TVs
  • Curved and Specialty Display Smart TVs

By End-Use Industry

  • Residential and Household Use
  • Hospitality and Hotel Installations
  • Retail and Commercial Display
  • Corporate and Office Settings
  • Healthcare and Institutional Settings

By Commercial Dimension

  • Retail Store and E-Commerce Sales
  • Direct-to-Consumer Online Sales
  • Advertising and Content Platform Revenue
  • Extended Warranty and Support Services

By Region

  • North America
  • Western Europe
  • East Asia
  • South Asia and Pacific
  • Latin America
  • Middle East and Africa
  • Eastern Europe

Scope, Methodology, and Coverage

Every figure in this report is reproducible from documented input assumptions. The scope below maps the historical period, the forecast horizon, the segmentation dimensions, and the countries covered, alongside the underlying primary and qualitative methodology.
Historical Period
2020 to 2025
Forecast Period
2026 to 2036
Base Year
2025 (USD billions; MMA Primary Research Dataset, September 2026)
Market Definition
The Smart TV Market covers internet-connected television sets with integrated operating systems, app libraries, and content streaming capability, measured by unit shipment and hardware revenue. It excludes standalone streaming media players, dedicated projector systems, and commercial digital signage displays not intended for home entertainment use.
Quantitative Units
USD Billion, CAGR (%), Share (%), 2020 to 2036
Segmentation Dimensions
By Primary Market Dimension; By End-Use Industry; By Commercial Dimension; By Region
Regions Covered
North America, Western Europe, East Asia, South Asia and Pacific, Latin America, Middle East and Africa, Eastern Europe
Countries Covered
United States, Canada, United Kingdom, Germany, France, China, Japan, South Korea, India, Indonesia, Vietnam, Australia, Brazil, Mexico, United Arab Emirates, Saudi Arabia, South Africa, Poland
Key Companies Profiled
Samsung Electronics, LG Electronics, TCL Technology, Hisense, Sony, Xiaomi, Skyworth, Panasonic, Sharp, Vizio, TP Vision (Philips), Konka, Changhong, Haier, Toshiba (TVS Regza), Roku, Amazon (Fire TV), JVC, RCA, Insignia (Best Buy)
Quantitative Methodology
Primary survey, n=3,800 respondents, Q4 2025, six countries; demand-side model with trade association cross-validation
Qualitative Methodology
47 expert interviews, Q4 2025; applied to validate demand model assumptions, identify emerging dynamics, and assess competitive positioning
Report Format
PDF and XLSX data workbook (Word format preview document)
Publisher
Market Minds Advisory
Report Code
MMA-2026-TEC-634
Published
September 2026
Contact
sales@marketmindsadvisory.com | www.marketmindsadvisory.com

Purchase the full Smart TV Market Report (2026 to 2036).

This report provides comprehensive coverage of the global smart TV market, including detailed sizing, segmentation, and regional analysis through 2036. It profiles the leading television manufacturers and panel suppliers shaping competitive dynamics as advertising platform monetization and premium panel technology increasingly determine where industry margin concentrates. The analysis draws on primary survey data from 3,800 respondents and 47 expert interviews conducted in the fourth quarter of 2025. Readers gain actionable insight into where premium panel, advertising platform, and content partnership revenue concentrate over the coming decade.
Ten-year market sizing and forecast data
Seven-region granular market breakdown and analysis
Five-year competitive landscape developments and tracker
Segment-level CAGR and market share analysis
Primary survey data across six countries
Anonymized client case study with outcomes

Built For The People Who Decide

From boardroom strategy to bench-side execution, this report is read cover-to-cover by leaders shaping the next decade of their industry, turning demand scenarios, market dynamics and valuation benchmarks into decisions.
CXOs/ Presidents/ VPs/ Managers
M&A and Corporate Development
Strategy Teams and R&D Heads
Procurement and Product Directors
Regulatory and Compliance Leaders
Investor Relations and Equity Analysts