Market Minds Advisory
Smart Stadium Market

Smart Stadium Market: Smart Stadium Market. Connected Venues Redefine the Live Event Economy

Venue operators retrofit aging stadiums with dense Wi-Fi and fan engagement platforms as ticket revenue alone no longer justifies capital spend, pushing owners toward data-driven concession and sponsorship models legacy venues cannot support.

Lead Analyst

Published

September 2026

Make Smarter Decisions with Customized Research Insights

Request a free sample report and evaluate market opportunities, growth trends, and competitive dynamics relevant to your business needs.

2025 MARKET VALUE$8.4BMarket Size 2025
2036 FORECAST VALUE$26.5BBase Case , 2026 to 2036
CAGR 2026 TO 203611.0 %Bull 12.3% / Bear 9.8%
INCREMENTAL OPPORTUNITY$17.2BNet 10- year value creation
EXPANSION MULTIPLE2.84x2036 value over 2026 base
Strategic Levers
M&A Pipeline
Regional Outlook
Country Rankings
Competitive Intelligence
Segmental Deep-dive
Call-Us : 91 93563 13602

Executive Snapshot and Market Trajectory.

Stadium operators are treating connectivity infrastructure as revenue equipment rather than overhead, since dense Wi-Fi and IoT sensor coverage now feed the mobile ordering, dynamic pricing, and sponsorship analytics that generate more per-seat revenue than ticket sales alone ever could. Sponsors write engagement clauses directly into contracts.
Investment concentrates in three areas: fan engagement applications that drive in-seat ordering and personalized offers, security and crowd analytics platforms that insurers increasingly expect venues to run, and digital signage networks that convert static sponsorship boards into programmable, data-priced inventory. North America holds the largest share of spend, anchored by major professional sports league mandates that push venue owners toward standardized technology packages across every market they operate in.
Competitive intensity is moderate, with the top five vendors holding under forty percent of category revenue and dozens of specialized integrators winning individual venue contracts on relationship depth. Gulf state governments building new stadiums for major upcoming tournaments are pulling forward next-generation deployments that established venues elsewhere are only beginning to plan, briefly shifting technology leadership toward brand-new construction rather than retrofit projects. Rankings could shift quickly across the sector. Analysts are watching closely.
Market Definition
This report covers integrated smart stadium technology systems, including venue-wide connectivity infrastructure, fan engagement platforms, digital ticketing and access control, IoT sensor networks, digital signage, and security analytics deployed within sports and entertainment venues. It excludes stadium construction and civil engineering services, general-purpose enterprise software not venue-specific, and broadcast production equipment used only for televised coverage.
Base Year Value
$8.4B in 2025 (MMA Primary Research Dataset, September 2026)
Forecast Period
2026 to 2036, eleven discrete annual values
CAGR
11.0% base case. Bull 12.3%. Bear 9.8%.
Fastest Growth Segment
Fan Engagement Mobile Applications and Platforms: 14.5% CAGR
Fastest Growth Country
Saudi Arabia: 16.0% CAGR
Fastest Growth Region
South Asia and Pacific: 13.0% CAGR
Largest Region
North America: 30% of 2025 global value
Market Leaders
Cisco, IBM, Honeywell, Johnson Controls, and NEC. Source: MMA Primary Research Dataset, July 2026.
Primary Survey
n=3,800 procurement and R&D decision-makers, Q4 2025, six countries
Methodology
Demand-side build-up, cross-validated against public data, 47 expert interviews

Smart Stadium Market Forecast Scenarios

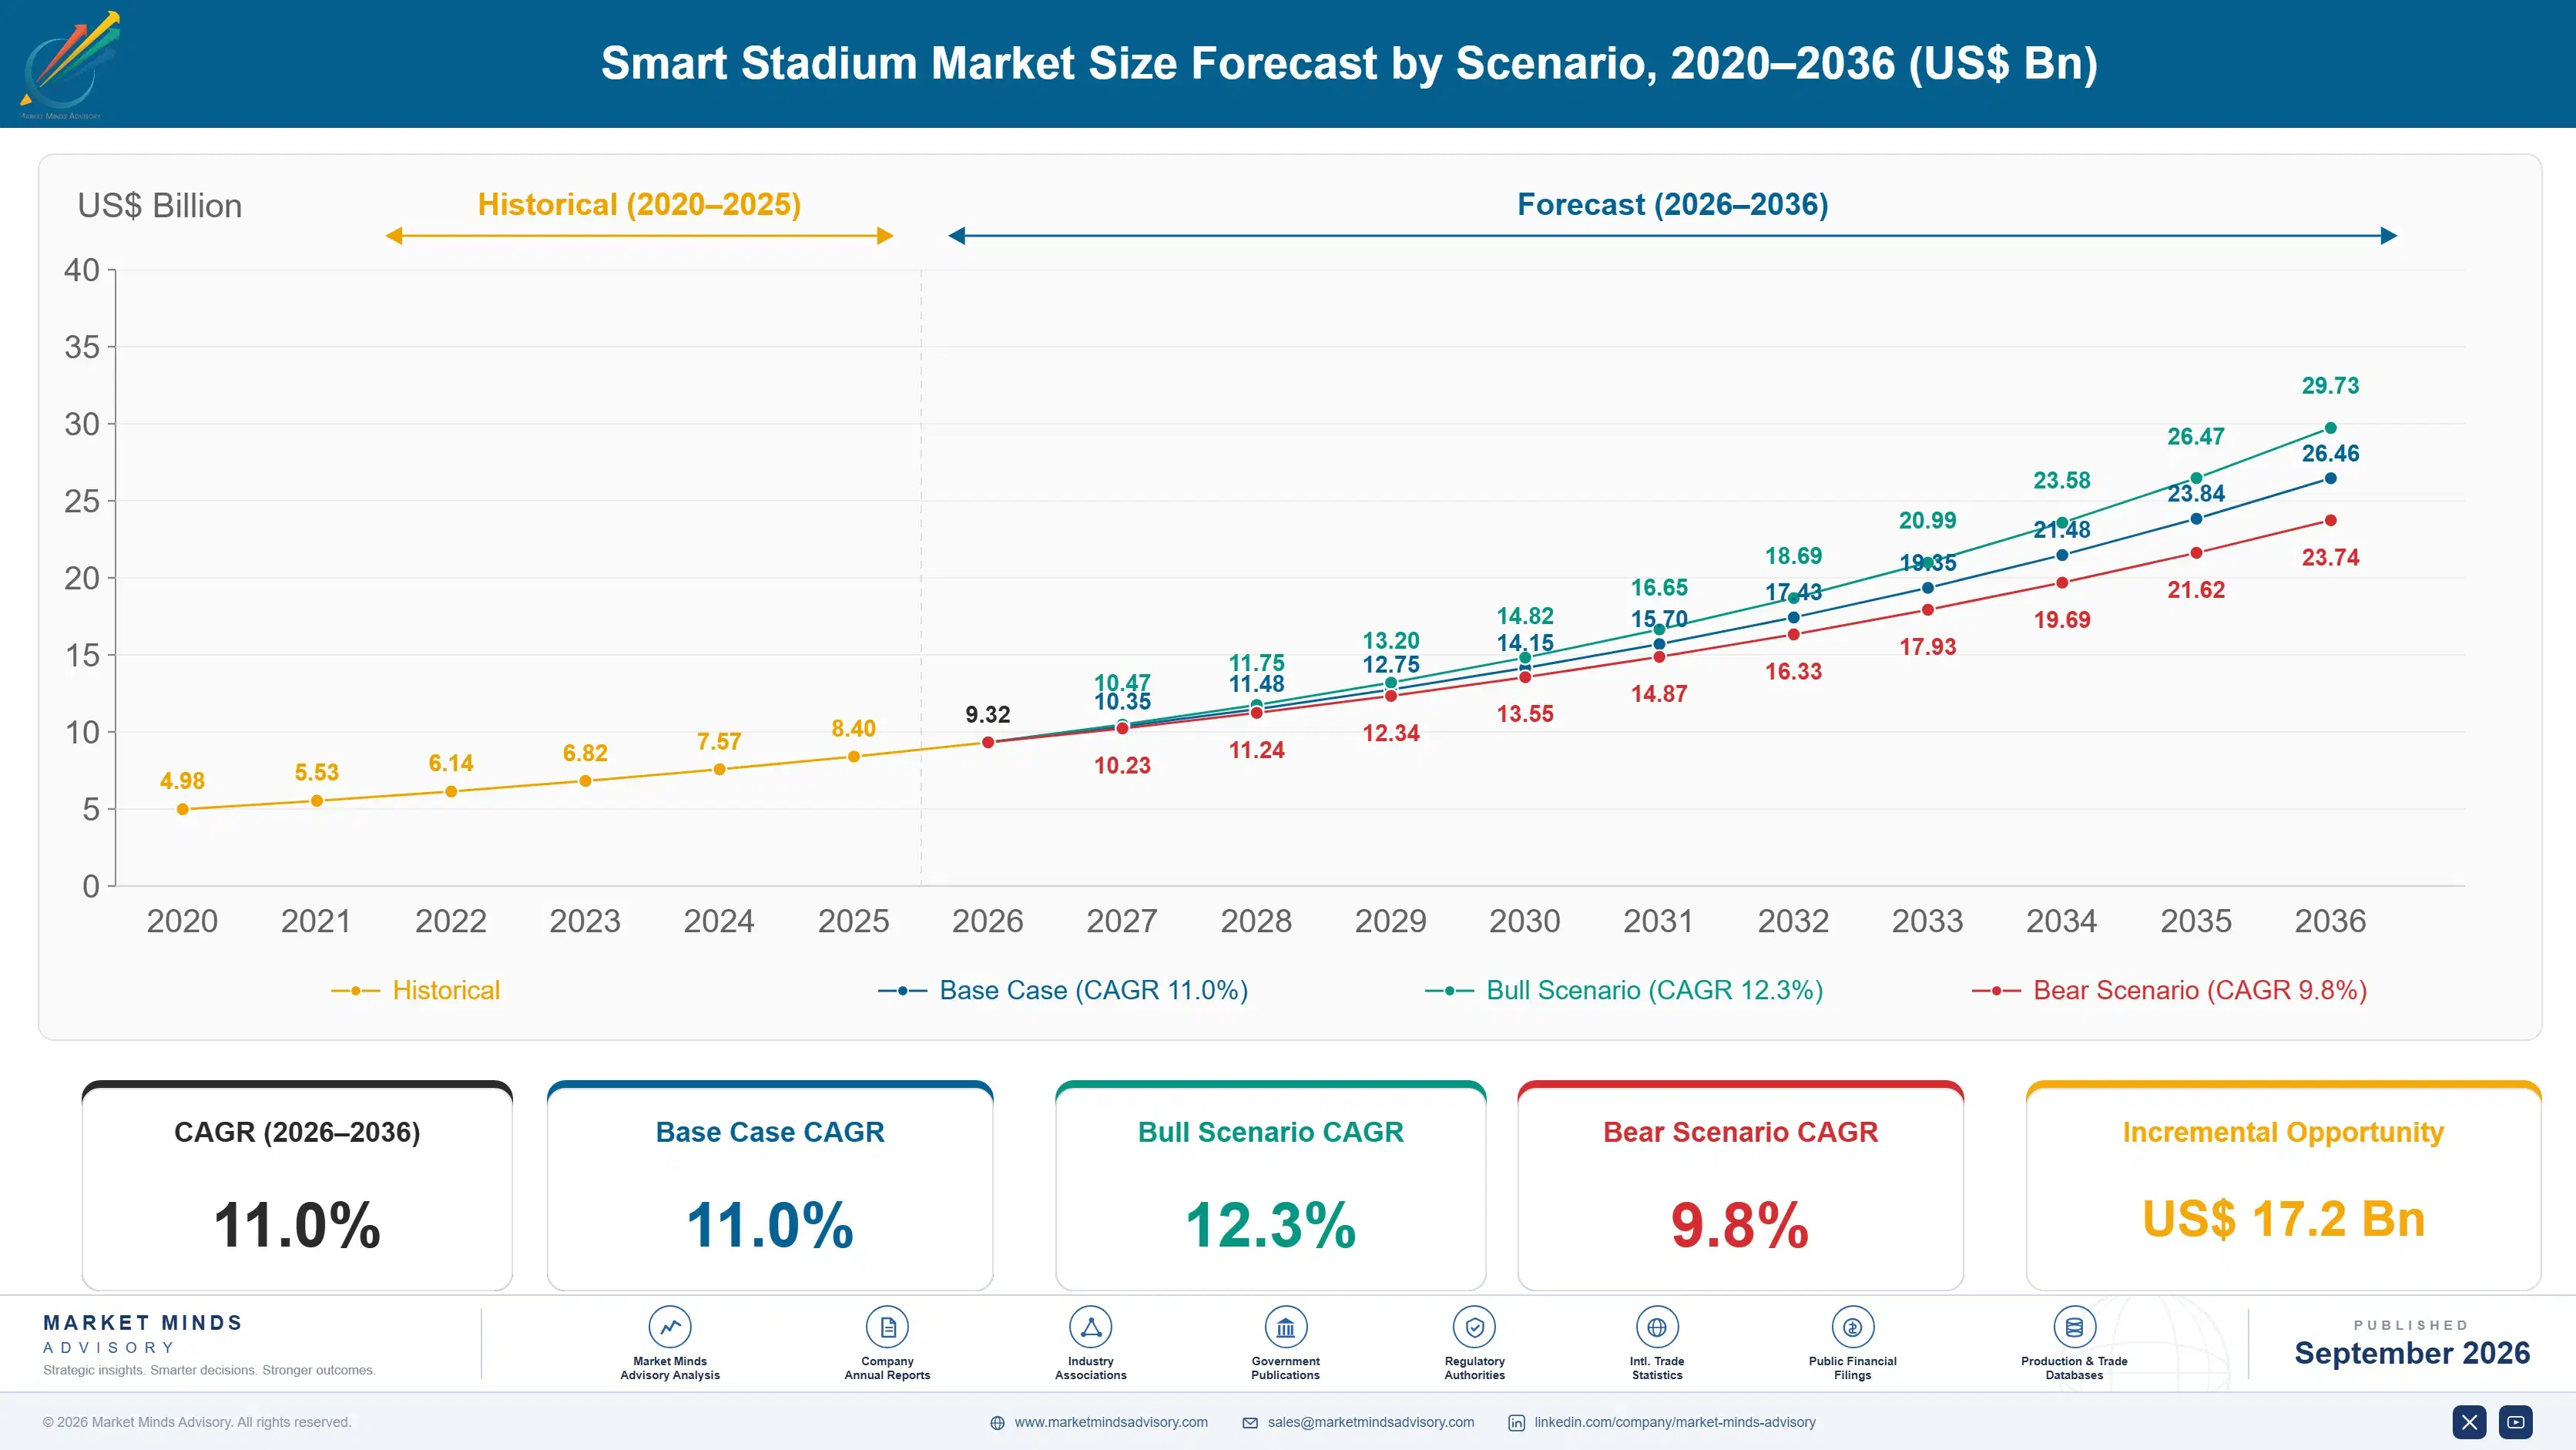
smart-stadium-market-size-forecast-scenario-1789984667626
Between 2020 and 2025 the category grew at roughly 10.0% a year, recovering unevenly as venues that had delayed technology capital spend during closures used reopening as a forcing function to modernize connectivity and ticketing systems simultaneously rather than piecemeal. Sponsorship pressure to prove measurable fan engagement data accelerated budget approval faster than pure operational need alone would have justified.
The base case assumes 11.0% annual growth through 2036, resting on three mechanisms operating together: major sports leagues standardizing minimum technology specifications across member venues, sponsorship contracts increasingly tied to measurable digital engagement data that only connected venues can supply, and new stadium construction tied to major international tournaments building next-generation systems in from day one rather than retrofitting later. None of the three mechanisms depends entirely on the others holding for growth to continue.
The bull case centers on additional major tournament hosting announcements pulling forward new-build construction spend faster than currently scheduled. The bear case turns on economic pressure on ticket and sponsorship revenue delaying discretionary technology upgrades at older venues, extending refresh cycles well past their planned replacement dates and compressing near-term unit growth across the broader retrofit segment.

Where Smart Stadium Investment Concentrates

Smart stadium technology has moved from an optional fan experience upgrade into a required revenue and compliance layer, since sponsors now write measurable digital engagement clauses directly into contracts and insurers increasingly price crowd-safety analytics into venue coverage terms. That shift changes who signs off on purchases: facilities managers still evaluate technical fit, but sponsorship and risk teams now drive budget timing around contract renewal dates.
MARKET CONCENTRATION (CR5)38%Leading vendors hold well under half of category revenue
AVERAGE DEPLOYMENT VALUE$14.2 millionFull venue retrofits require substantial multi-year capital commitments
TOP ADOPTING COUNTRY SHARE19%United States accounts for the largest single national share
CONNECTIVITY UPTIME REQUIREMENT99.9%Venues demand near continuous network availability during events
CLOUD ANALYTICS ADOPTION61%Most venues now analyze fan data through cloud platforms
NETWORK INFRASTRUCTURE COST SHARE34% of COGSConnectivity hardware remains the single costliest deployment component
Vendors compete on integration breadth as much as individual system quality, since most venues already run point-of-sale, access control, and broadcast systems that any new platform must connect to cleanly without requiring a full technology replacement. That has pushed system integrators toward long-term venue relationships spanning multiple upgrade cycles, while pure connectivity vendors increasingly partner with fan engagement software companies to offer a combined package that facilities teams can approve in a single purchase decision.
Deployment timelines stretch across full off-seasons in mature markets, since major system changes cannot risk disrupting a live event calendar. Vendors who can phase installation around existing event schedules without requiring venue closure are winning larger contracts against rivals whose systems demand extended downtime during installation.
"Nobody buys stadium Wi-Fi to make fans happy anymore. They buy it because the sponsorship contract has a clause that pays out based on app engagement data, and a venue without that data is leaving money on the table every single game."
Practice Lead, Venue Technology and Fan Engagement · MMA Construction and Industrial Equipment / Venue Technology Practice · September 2026

Market Trends

Sponsorship Contracts Tie Payment to Digital Engagement Data

Major sponsors are restructuring stadium naming rights and in-venue advertising contracts around measurable digital engagement metrics rather than flat annual fees, requiring venues to instrument fan applications, digital signage, and Wi-Fi networks well enough to prove impressions and interactions in reportable form. A handful of top-tier venues have already renegotiated sponsorship deals worth over 20% more once engagement data supported premium pricing tiers that flat-fee contracts never captured. That renegotiation pattern is spreading quickly to mid-tier venues whose sponsors now expect comparable reporting as a baseline contract term, not a premium feature reserved for flagship stadiums alone.
Market Impact: Pulls 30 venues into mandated upgrades

Major Tournament Hosting Accelerates New-Build Technology Standards

Countries hosting major upcoming international tournaments are building new stadiums with next-generation connectivity, security analytics, and fan platforms designed in from initial construction rather than retrofitted after opening, setting technology specifications that established venues elsewhere increasingly reference in their own planning. Gulf state stadium construction tied to an upcoming World Cup cycle represents one of the largest single waves of new-build smart stadium spending in the category's history. Established leagues in mature markets are studying these new-build specifications closely, worried about falling behind on fan experience benchmarks that sponsors and broadcasters now expect as standard.
Market Impact: Cuts insurance premiums by 12 percent

Market Opportunities and Growth Drivers

Sports Leagues Standardize Minimum Venue Technology Specifications

Major professional sports leagues have begun writing minimum technology specifications directly into venue membership requirements, covering connectivity density, digital ticketing compatibility, and security analytics capability that every member venue must meet within a defined compliance window. This top-down mandate pulls smaller-market venues into upgrade cycles they might otherwise have delayed for years, since league membership itself now depends on meeting the specification. Roughly thirty venues across two major leagues completed mandated upgrades within the past two years alone, a pace regulators expect other leagues to match soon. Officials expect the trend to accelerate across every remaining member venue soon.
Market Impact: Adds 15 to 20 percent cost

Crowd Safety Analytics Reduce Insurance and Liability Costs

Venue insurers are increasingly offering meaningfully reduced premiums to operators who deploy real-time crowd density and flow analytics capable of flagging dangerous congestion before it becomes a safety incident, converting a discretionary technology purchase into a direct line-item cost offset. Several major venue operators report premium reductions of 12% or more after installing certified crowd analytics systems, a savings that pays back the technology investment within a small number of event seasons. Regulators in multiple jurisdictions are also beginning to reference crowd analytics capability directly in venue safety certification requirements, adding a compliance dimension beyond the pure cost savings.
Market Impact: Extends 6 to 12 month timelines

Market Restraints and Challenges

Legacy Venue Infrastructure Complicates Retrofit Installation

Many stadiums built decades ago were not designed with cable pathways or power capacity for dense modern connectivity equipment, forcing installers into expensive structural modifications that new-build venues never face. The root cause is that concrete and structural steel installed generations ago simply cannot accommodate modern fiber and power routing without core drilling and reinforcement work that adds significant cost and schedule risk to any retrofit project. Installers are increasingly using wireless backhaul and distributed antenna systems specifically to avoid the most invasive structural work, though these alternatives generally cost more per connection point.
Market Impact: Adds 20 percent sponsorship value uplift

Fragmented Vendor Integration Slows Full Deployment

Venues typically source connectivity, ticketing, security, and signage systems from different specialized vendors, and integrating all of them into a single coherent platform often takes considerably longer than any single vendor's own installation timeline would suggest. The root cause is that no dominant single vendor covers the full technology stack convincingly, forcing venues into a systems-integrator role themselves or hiring a third party to manage that integration work directly. Vendors are responding with open application programming interfaces and published integration standards specifically intended to reduce this friction, though full industrywide standardization remains years away from actually happening.
Market Impact: Adds 6 billion new-build spending wave
3 additional market trends, 4 additional growth drivers, and 2 additional restraints and challenges are covered in the full report. Contact sales@marketmindsadvisory.com to access the complete intelligence.

Segment CAGR and Growth Architecture

Segments split by technology system type rather than by venue category, since the same core platforms serve stadiums, arenas, and large entertainment venues interchangeably, and system type is what actually separates growth rates and vendor economics across the category most clearly and consistently for every buyer segment tracked here. Every venue shares this same underlying technology stack regardless of scale.
smart-stadium-market-market-share-analysis-1789984668163

Fan Engagement Mobile Applications and Platforms

This segment covers mobile applications and supporting backend platforms that handle in-seat ordering, personalized offers, wayfinding, and loyalty rewards for stadium visitors, the fastest-growing category because sponsorship contracts increasingly tie payment directly to measurable engagement data these platforms generate. IBM and specialized venue software vendors have built substantial revenue around combining engagement data with dynamic pricing for concessions and merchandise, giving venues a direct revenue justification beyond pure fan satisfaction alone. Growth accelerates further as sponsors write engagement benchmarks directly into contract renewal terms, pushing venues that lag on platform sophistication toward rapid catch-up investment or risk losing sponsorship revenue entirely to better-instrumented competing venues nearby. Established venues that hesitate lose sponsorship ground quickly to nimbler rivals.
CAGR 14.5%

Stadium Security and Surveillance Analytics Platforms

Security and surveillance analytics platforms that combine camera networks with crowd density modeling, weapons detection, and access anomaly flagging are growing quickly as insurers and regulators both increasingly expect venues to demonstrate proactive safety monitoring rather than reactive incident response alone. Honeywell and specialized security integrators dominate large venue deployments, while smaller arenas increasingly purchase these capabilities as a managed service rather than owned infrastructure to avoid the specialized staffing that in-house monitoring would otherwise require. Growth here tracks closely with insurance premium reduction programs, since venues that can demonstrate certified analytics capability increasingly qualify for meaningfully better coverage terms than uninstrumented venues competing for the same insurance capacity. Smaller venues increasingly follow this same certification path.
CAGR 13.0%
Full segment breakdown across 6 segments available in the complete report.

Regional Architecture and Country Demand Map

North America holds the largest share on the strength of major league technology mandates, while Middle East and Africa post the fastest growth of any region as Gulf state governments build next-generation stadiums for an upcoming major international tournament over the coming years ahead of most rivals.

North America

Major professional sports leagues headquartered in the United States have written minimum technology specifications directly into venue membership requirements, pulling every member stadium into upgrade cycles on a defined compliance timeline regardless of individual market size or ownership budget preference. Sponsorship contracts increasingly tie payment to measurable fan engagement data, giving venue owners a direct revenue incentive layered on top of pure league compliance pressure alone. Canadian arenas hosting major professional franchises are following a similar upgrade trajectory roughly a season behind their American counterparts. College and university athletic programs add a further steady layer of demand as conference realignment pushes competing programs to match rival facility technology standards for recruiting purposes.
Share: 30% | CAGR: 12.0% (2026 to 2036)

Western Europe

Premier football clubs across England, Germany, and Spain are modernizing venue connectivity and fan engagement platforms to match sponsorship expectations set by North American professional leagues, though adoption trails somewhat given more conservative capital spending traditions among many historic club ownership structures. Stadium redevelopment tied to hosting major continental tournaments has pulled several flagship venues into comprehensive technology upgrades ahead of their originally planned schedules. Regulatory requirements around crowd safety analytics, tightened following past incidents at European venues, are pushing broader adoption of security platforms beyond just the largest flagship stadiums. Growth trails North America because sponsorship-driven engagement contracts remain less standardized across the region's fragmented club ownership landscape. Clubs increasingly compare technology roadmaps against rivals before committing budget.
Share: 20% | CAGR: 9.5% (2026 to 2036)
Regional intelligence for 5 additional markets available in the complete report: East Asia, South Asia and Pacific, Latin America, Middle East and Africa, Eastern Europe. Contact sales@marketmindsadvisory.com.
smart-stadium-market-country-cagr-analysis-1789984668687

Where Smart Stadium Margins Actually Build

Margin expansion concentrates around data-driven sponsorship and concession platforms rather than raw connectivity hardware, since analytics and engagement software carry far higher recurring margin than the underlying network equipment once a venue is already wired and deployed across its full footprint. Every vendor building this capability captures durable renewal advantage over rivals. Vendors ignoring this shift lose margin steadily.

Dynamic Concession Pricing Tied to Engagement Data

Venues are using fan engagement platform data to price concessions and merchandise dynamically based on real-time demand, section location, and individual purchase history, converting a previously flat-priced revenue stream into one that captures meaningfully more value during peak demand moments. Early adopters report concession revenue per attendee up 16% after implementing dynamic pricing tied to platform data, a gain that flows almost entirely to margin since the underlying product cost stays unchanged. This capability is becoming a standard expectation among venue operators evaluating new platform vendors. Vendors that build this capability first capture disproportionate renewal advantage over slower rivals.
Market Impact: Adds a 16 percent revenue lift per attendee

Sponsorship Data Packages Sold as a Premium Tier

Venues are packaging anonymized fan engagement and demographic data into premium sponsorship reporting tiers that command meaningfully higher annual contract value than traditional signage-only sponsorship deals, giving sponsors the measurable return data their own marketing teams increasingly demand. This premium tier now commands roughly 28% more annual value than comparable legacy sponsorship packages lacking equivalent reporting depth. Vendors that build detailed reporting dashboards directly into their platforms are capturing a larger share of this premium pricing than integrators offering raw data alone. Sponsors increasingly demand this reporting depth before renewing any major contract.
Market Impact: Adds a 28 percent sponsorship value premium overall

Managed Security Analytics Sold as a Subscription Service

Rather than selling security analytics hardware and software as a one-time capital purchase, vendors increasingly offer it as an ongoing managed subscription that includes continuous monitoring, software updates, and insurer-recognized certification renewal each year. This subscription model now represents close to 31% of new security analytics contracts signed, up sharply from a much smaller share several years ago, as venues prefer predictable operating expense over large upfront capital commitments. Vendors gain recurring revenue and deeper customer relationships through this structure compared to one-time sales. Vendors expect this share to keep climbing steadily over the next several years.
Market Impact: Captures 31 percent of new contracts as subscriptions

Multi-Venue Portfolio Contracts With Standardized Platforms

Vendors are signing portfolio-wide contracts with venue management companies and league operators covering multiple stadiums under a single standardized platform agreement, converting what used to be dozens of separate venue-by-venue sales cycles into one larger recurring relationship. Net revenue retention across portfolio contracts averages 118%, since venue operators expand deployment scope as they add new managed properties to their portfolio over time. This structure rewards vendors who invest in scalable platform architecture over those still selling bespoke single-venue integrations. Vendors that invest early in scalable architecture capture disproportionate expansion revenue later.
Market Impact: Sustains a strong 118 percent net revenue retention

Who Controls the Margin Pool

Five vendors control roughly 38% of global smart stadium technology revenue, a moderate concentration that leaves considerable room for specialized integrators to win individual venue contracts on relationship depth rather than brand recognition alone. Cisco and IBM lead by a meaningful margin over Honeywell, Johnson Controls, and NEC, though the gap has narrowed as security and engagement platform specialists expand scope.
Current competitive activity plays out across three fronts: connectivity vendors partnering with fan engagement software companies to offer combined packages, security analytics providers racing to earn insurer-recognized certifications ahead of rivals, and integrators building portfolio-wide relationships with major venue management companies to lock in multi-stadium contracts first. All participants are evaluated here on a deployment and contract-value basis, the metric consistently disclosed across annual reports and investor materials industrywide.

Gulf state new-build construction represents the clearest source of emerging pressure on established vendors, since new venues can specify next-generation platforms from the outset rather than integrating around legacy infrastructure the way retrofit projects must. Rankings could shift first in the new-build segment, where technology specification is set once at construction, before any comparable threat reaches the retrofit segment that still anchors most established vendors' recurring revenue base.
smart-stadium-market-company-positioning-matrix-1789984669216

Competitive Moat and Risk Dimensions

CISCO SYSTEMS INC

Moat: Dominant Venue Networking Base

Cisco's networking equipment already underpins connectivity at a large share of major stadiums globally, giving it a natural upgrade path advantage when venues refresh infrastructure rather than switching vendors entirely. That installed base also gives Cisco deep visibility into renewal timing across hundreds of venues, letting it plan account strategy well ahead of competitors.
CISCO SYSTEMS INC

Risk: Commoditizing Core Hardware Margin

Core networking hardware margin is compressing as venue operators increasingly treat connectivity equipment as a commodity purchase, pushing Cisco to justify premium pricing through software and analytics layers instead. Competitors offering comparable connectivity at lower cost are winning price-sensitive mid-market venue deals that Cisco previously won on brand strength alone.
IBM CORPORATION

Moat: Fan Engagement Data Platform Depth

IBM's fan engagement and analytics platforms carry years of accumulated venue data and sponsorship reporting integrations that newer entrants cannot replicate quickly, giving it credibility with sponsorship teams evaluating measurable engagement claims. That reputation supports premium pricing on analytics contracts even against lower-cost specialized challengers.
IBM CORPORATION

Risk: Specialized Startups Undercut Pricing

Smaller specialized fan engagement startups are undercutting IBM's pricing significantly while matching core feature sets closely enough that budget-conscious mid-market venues increasingly choose the cheaper alternative. IBM's broader enterprise sales motion can also move slower than nimbler competitors on smaller venue deals where fast implementation matters more than platform depth.

Players Tracked

Prominent Players

Cisco Systems Inc
IBM Corporation
Honeywell International Inc
Johnson Controls International plc
NEC Corporation

Other Key Players

Panasonic Holdings Corporation
Schneider Electric SE
Siemens AG
Hewlett Packard Enterprise Company
Intel Corporation
Verizon Communications Inc
AT&T Inc
Extreme Networks Inc
Boingo Wireless Inc
VenueNext Inc
Zebra Technologies Corporation
CrowdVision Ltd
Oak View Group LLC
ASM Global
Legends Hospitality LLC

Recent Developments

JANUARY 2026

Cisco Expands Stadium Wi-Fi Reference Architecture

Cisco released an updated stadium connectivity reference architecture supporting higher device density per seating section, addressing venue complaints about network congestion during peak attendance moments at major sporting events, and shortening typical deployment planning timelines for integrator partners considerably. Integrator partners welcomed the update as a meaningful friction reduction.
Signal: Signals connectivity density becoming a primary competitive specification across every major venue deployment worldwide this year.
SEPTEMBER 2025

IBM Acquires Fan Engagement Analytics Startup

IBM acquired a venture-backed startup specializing in real-time sponsorship engagement measurement, adding granular reporting capability directly into its existing venue platform rather than requiring customers to purchase and integrate a separate third-party analytics tool for sponsorship reporting. The acquired team continues operating as a dedicated unit within the larger platform.
Signal: Signals platform vendors consolidating adjacent analytics capability through acquisition rather than slower in-house development efforts overall.
APRIL 2026

Honeywell and Venue Operator Sign Portfolio Security Agreement

Honeywell signed a multi-year portfolio agreement with a major venue management company to standardize security analytics across a dozen managed stadiums, expanding distribution reach into a segment Honeywell's direct sales team had previously served one venue at a time. Venue operators increasingly prefer this portfolio approach over separate contracts.
Signal: Signals portfolio-wide contracts becoming increasingly central to multi-venue distribution strategy across the entire broader wider industry.

What Drives Smart Stadium Deployment Cost

Networking hardware and connectivity equipment account for roughly 34% of deployment cost, sourced primarily from a concentrated group of global networking equipment manufacturers whose semiconductor supply chains determine lead times for large venue orders. Installation labor and structural modification work make up a further significant share of cost, particularly for retrofit projects at older venues requiring extensive cable pathway construction.
Networking semiconductor prices rose meaningfully during 2023 amid broader chip supply constraints affecting multiple electronics categories simultaneously, a trend documented in several major networking equipment manufacturer annual reports for that fiscal year. Venue technology projects already underway absorbed several months of delayed equipment delivery before manufacturers redirected allocation toward large venue orders ahead of major scheduled sporting events. Some manufacturers redirected allocation toward large venue orders ahead of scheduled major events.

Vendors with direct semiconductor supply relationships, namely Cisco and Intel, weathered the shortage better than smaller integrators who purchase networking equipment through standard distribution channels and had far less negotiating leverage with manufacturers during the shortage period. That gap in cost exposure is pushing smaller integrators toward advance-order contracts and multi-vendor sourcing strategies that reduce dependence on any single manufacturer's allocation decisions.
smart-stadium-market-cost-volatility-analysis-1789984669411

Advance-Order Contracts With Major Networking Manufacturers

Several integrators have signed advance-order contracts that reserve networking equipment allocation months ahead of major venue deployment deadlines, trading upfront capital commitment for improved delivery certainty during periods of broader supply constraint. This approach has proven especially valuable for projects tied to fixed tournament hosting dates that cannot slip regardless of supply conditions. Buyers report improved planning confidence.

Modular Wireless Backhaul to Reduce Structural Work

Integrators are increasingly specifying wireless backhaul and distributed antenna systems in place of extensive new cable pathway construction, meaningfully reducing the structural modification cost that dominates retrofit budgets at older venues. This approach also shortens installation timelines considerably, letting projects fit within shorter off-season windows than full cabling work would allow. Crews complete phased installs faster within available maintenance windows.

Multi-Vendor Sourcing to Reduce Single-Supplier Dependence

Integrators are qualifying equipment from multiple networking manufacturers rather than standardizing entirely on one supplier, gradually reducing exposure to any single manufacturer's allocation decisions during future supply disruptions. This diversification adds some integration complexity but has proven worthwhile for integrators managing large multi-venue portfolio contracts across several years. Early results already look promising across several completed projects.

Portfolio Architecture for Margin Defence

Portfolio economics split into three tiers running from commodity connectivity hardware through certified integrated platforms to next-generation analytics and sponsorship data offerings carrying the richest margin. Volume tier products compete on price against generalist networking vendors, while premium and next-generation tiers retain pricing power tied to venue-specific integration depth and measured sponsorship reporting reliability built up over multiple seasons. That gap has held steady for years.
The tension between volume and premium tiers shows up clearest among mid-market venues, who want flagship-level fan engagement and security capability at a fraction of flagship pricing and are increasingly served by portfolio-wide vendor contracts borrowing platform capability originally built for larger venues. Vendors manage that tension by keeping the richest analytics and sponsorship reporting features exclusive to direct premium contracts for as long as commercially possible without losing volume customers entirely. Vendors that misjudge this trade-off risk losing volume to generalist rivals within a single renewal cycle.

High-value margin pools concentrate in sponsorship data packages and managed security subscriptions, both of which the top five vendors currently capture disproportionately relative to their base connectivity hardware market share alone. Smaller vendors instead compete on niche venue-type specialization where leaders choose not to invest.

Volume / Commodity-Adjacent Tier

Basic connectivity hardware and standard access control systems competing mainly on price against generalist networking vendors serving smaller venues. Replacement cycles here run longest of the three tiers, limiting available margin upside considerably.
Gross Margin: 24-32%

Premium / Certified Tier

Integrated fan engagement and security platforms with insurer-recognized certifications and dedicated venue account management trusted across major leagues. This tier anchors most vendor profitability during any given fiscal year currently.
Gross Margin: 44-52%

Sustainability / Regulatory / Next-Generation Tier

Sponsorship data packages, dynamic pricing analytics, and managed security subscriptions layered on top of base platforms, commanding the richest margin. Adoption here is still climbing steeply among large sponsorship-driven venue buyers each year.
Gross Margin: 56-64%
smart-stadium-market-portfolio-architecture-1789984669905

High-value Sub-segments and Strategic Watch-out

Sponsorship Data and Engagement Reporting Packages

This segment combines strong growth with the richest margin in the category, since engagement data already collected for platform purposes requires little incremental cost to package for sponsors. Vendor research budgets increasingly prioritize this segment over legacy connectivity features alone. This priority shows no sign of shifting soon.
Gross Margin: 56-64%

Managed Security Analytics Subscriptions

Subscription security analytics carry strong margin and steady growth tied to insurer certification requirements expanding across more venue types and jurisdictions each year. Enterprise buyers increasingly expect this capability bundled at no additional negotiation effort required. Insurers reinforce this trend through meaningful premium pricing incentives.
Gross Margin: 48-56%

Basic Connectivity and Access Control Hardware

The largest unit volume pool remains basic connectivity hardware bundled into standard venue contracts, where growth is moderate and margin is thin, but scale remains commercially essential. Vendors rarely walk away from this tier despite its comparatively thinner margin profile. Scale remains essential to funding development elsewhere.
Gross Margin: 24-32%

Legacy Analog Signage Replacement Contracts

Analog signage replacement carries decent margin today but faces a shrinking addressable base as most major venues complete their initial digital signage conversion within the next several years. Vendors are gradually sunsetting these contracts as remaining analog venues complete conversion. Revenue should decline gradually rather than collapse suddenly.
Gross Margin: 34-42%

Why Stadium Technology Contracts Compound

Smart stadium contracts behave like annuity assets rather than one-time capital purchases, since sponsorship data packages, managed security subscriptions, and portfolio expansion pricing all generate ongoing revenue against a single initial platform decision for years afterward. Vendors treating a stadium deployment as a one-time sale cede lifetime value to rivals building recurring layers on top of the same infrastructure. Vendors treating deployments as one-time sales cede lifetime value to rivals building recurring layers.
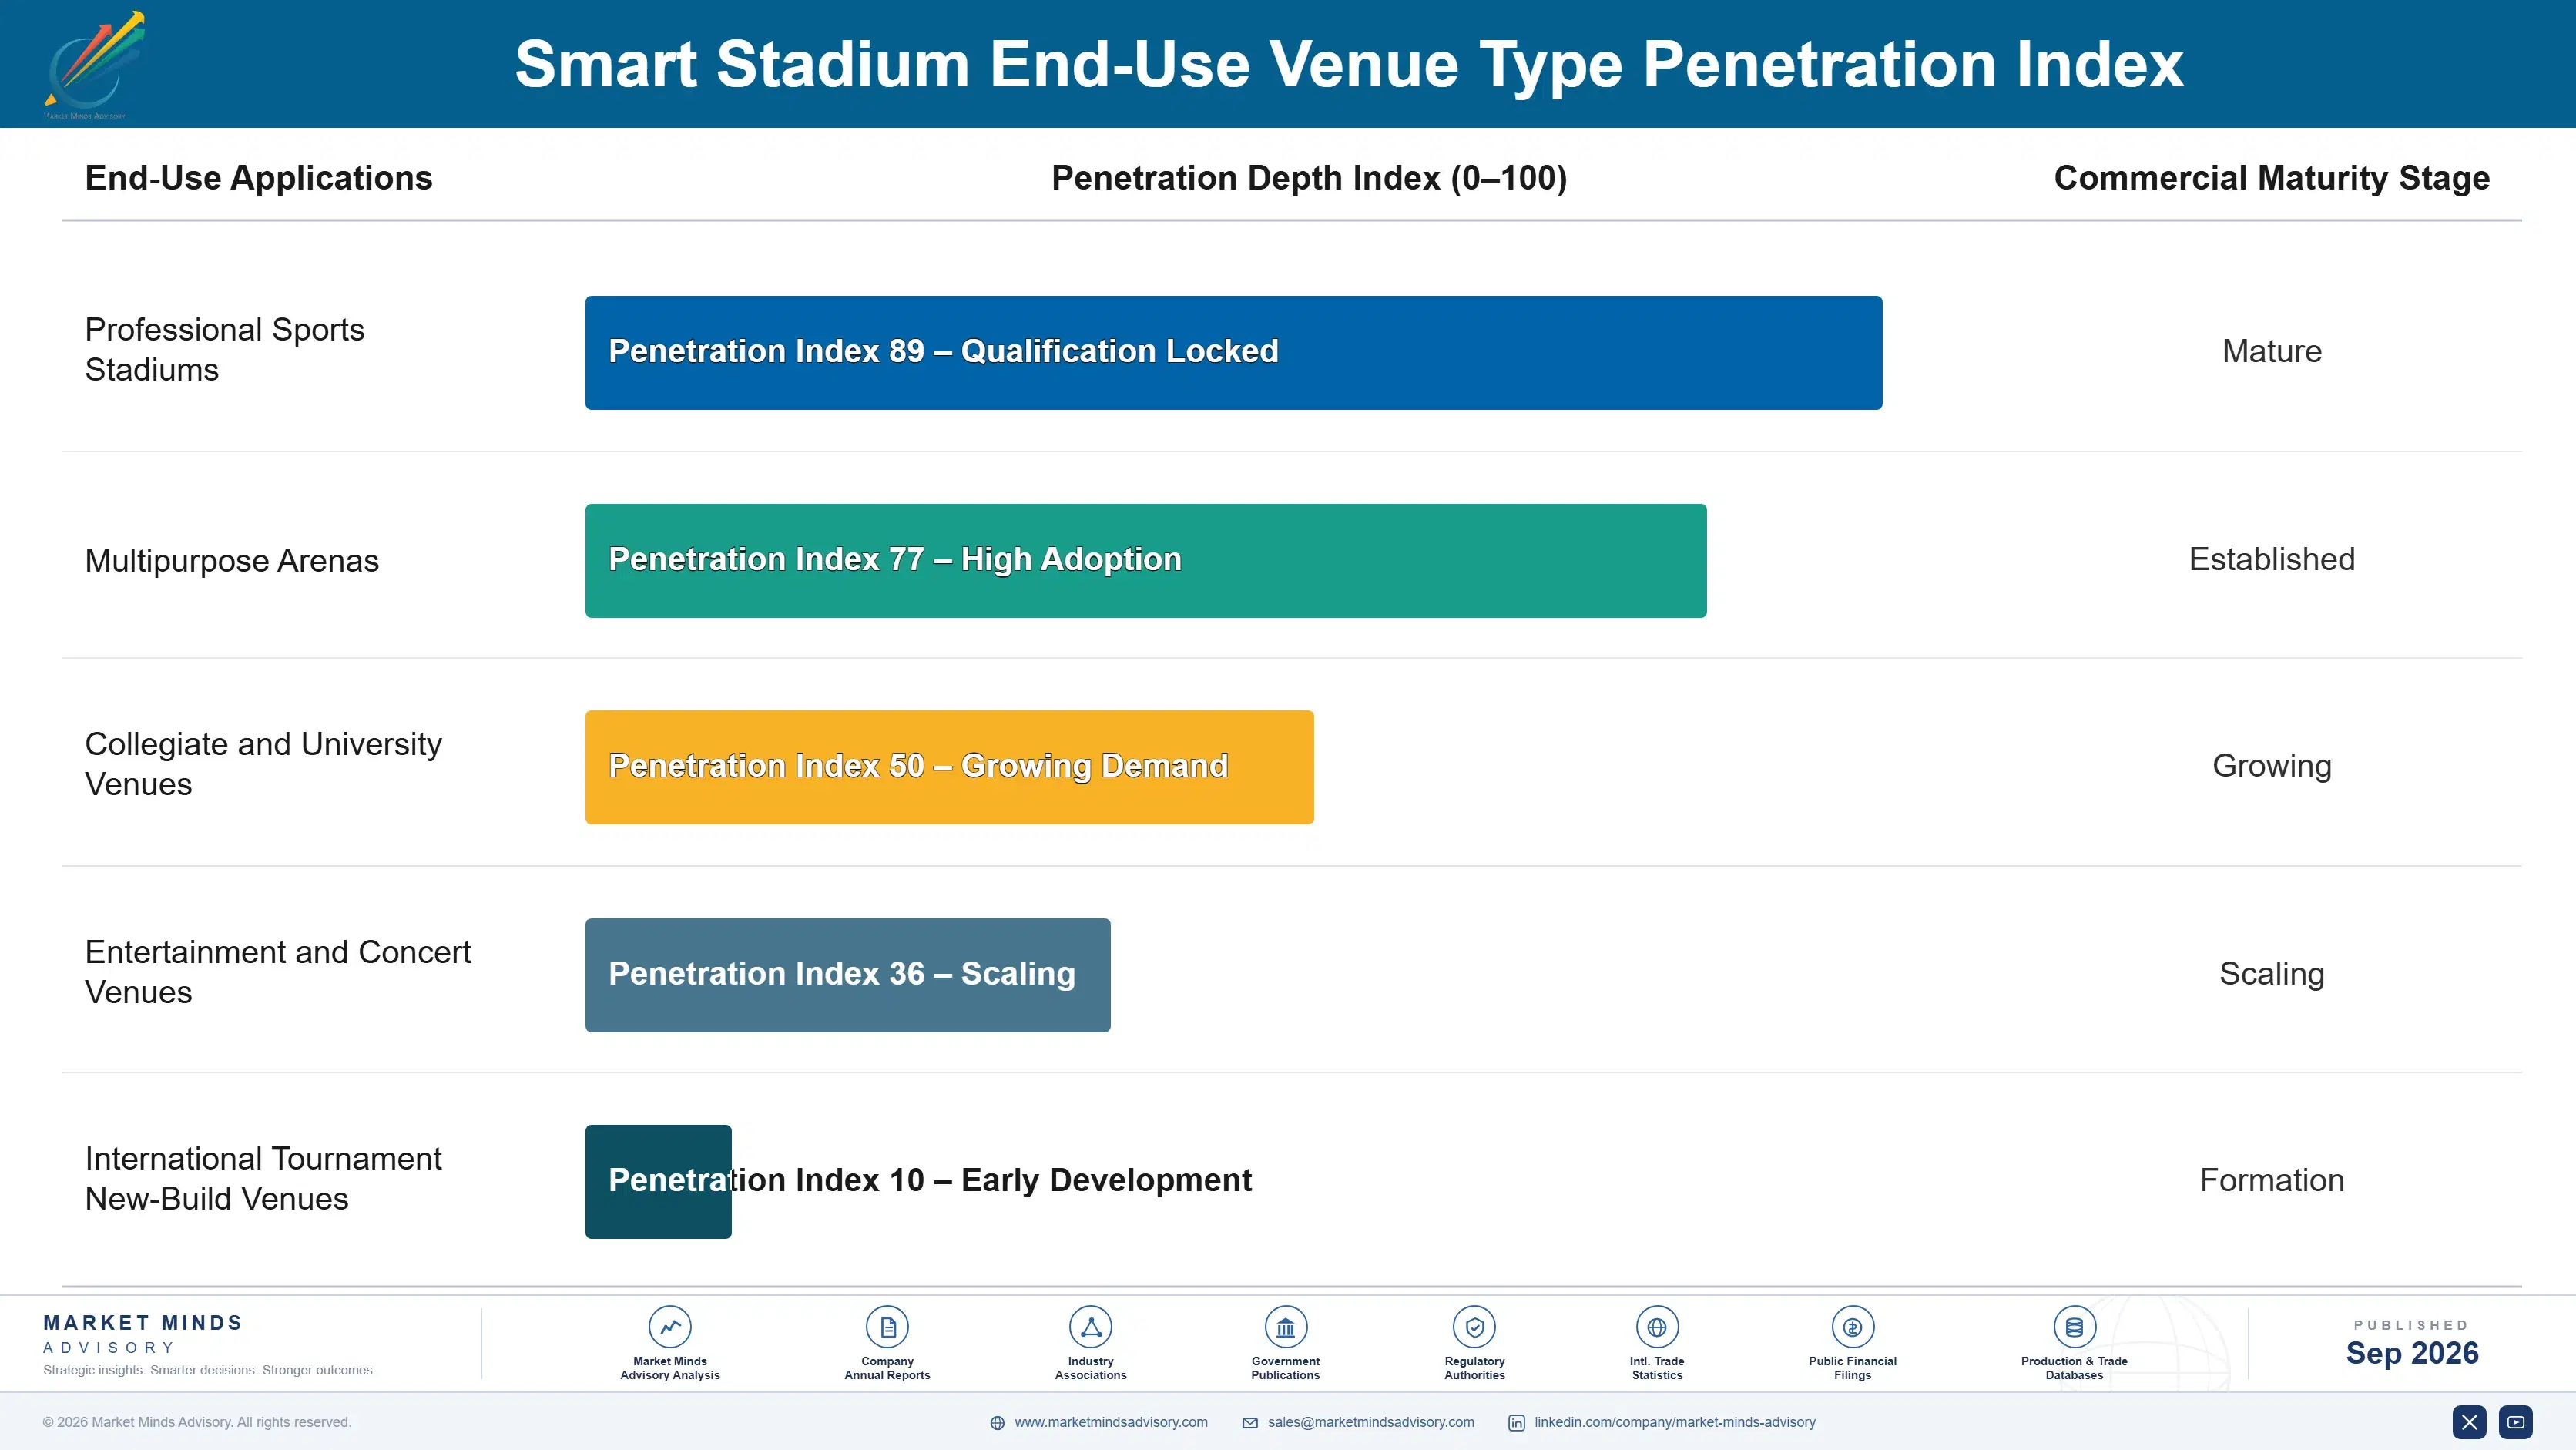
Adoption depth varies sharply by venue type. Major professional league venues integrate technology into multi-year league compliance and sponsorship programs with dedicated renewal budgets, producing deep, sticky relationships that survive individual product cycles and ownership changes alike. Smaller collegiate and community venues, by contrast, often adopt through portfolio-wide managed contracts rather than a direct vendor relationship, making that buyer segment more price-sensitive and more likely to switch when contracts renew. Vendors design tools around that stickier renewal pattern.

A generational shift is also underway as venue operators who came up entirely in the streaming and mobile era treat fan engagement platforms as the obvious default investment rather than an optional upgrade, skipping the extended pilot-program evaluation stage that older facility managers still often insist on running first.
smart-stadium-market-end-use-penetration-index-1789984670400

Where To Place Smart Stadium Bets

These are among the four positions where our research anticipates prominent divergence between winners and laggards over the coming forecast period. Each is grounded in the demand model, the regulatory perimeter, and the announced capacity pipeline.
01 / SPONSORSHIP DATA MONETIZATION

Build sponsorship reporting tooling before contract renewal cycles tighten expectations

Vendors still selling connectivity as pure hardware are leaving durable margin on the table while leaders expand sponsorship reporting and dynamic pricing features that sponsors now expect as standard contract terms rather than premium add-ons. The window to build comparable reporting tooling is narrowing as major leagues write minimum engagement measurement specifications into venue membership requirements across more markets each year. Smaller vendors should prioritize sponsorship reporting integration now, even at meaningful engineering cost, rather than compete on raw connectivity specifications alone.
02 / NEW-BUILD MARKET ENTRY

Establish new-build tournament venue relationships ahead of the next hosting cycle

Gulf state stadium construction tied to an upcoming major tournament represents the largest new-build opportunity in the category's history, and vendors slow to establish relationships with these projects risk ceding technology specification influence to rivals who moved earlier. New-build projects set technology standards once at construction that established venues elsewhere increasingly reference in their own planning decisions, making early positioning disproportionately valuable beyond the immediate contract value alone. Vendors that invest in these relationships now will shape specifications for years.
03 / RETROFIT COST ENGINEERING

Develop wireless backhaul alternatives to reduce structural retrofit expense

Legacy venue structural limitations are extending retrofit timelines and inflating costs well beyond what new-build projects require, a friction point vendors with strong wireless backhaul alternatives are exploiting effectively in competitive retrofit bids against rivals still specifying extensive cabling. Vendors that develop and certify wireless alternatives reduce the structural modification cost that dominates older venue budgets, shortening installation timelines meaningfully and compounding into won contracts over time. That capability pays back through retrofit wins rather than any single technology showcase alone.
04 / SUPPLY CHAIN RESILIENCE PLANNING

Diversify networking equipment sourcing before the next chip shortage arrives

The 2023 chip shortage demonstrated how exposed integrators without direct manufacturer supply relationships are to broader semiconductor market dynamics entirely outside their own control. Integrators should pursue advance-order contracts and multi-vendor sourcing simultaneously rather than betting on any single mitigation working alone to protect delivery timelines, since diversified sourcing now proves meaningfully more resilient than single-manufacturer reliance ever could prove on its own. Waiting for the next shortage to begin diversifying will repeat the same delivery delays smaller integrators absorbed during 2023.

Engagement Snapshot From the Field

A live engagement with an industry participant carrying material or product regulatory and market exposure ahead of a defining policy shift, showing how our research translates into a defensible multi-year portfolio strategy.
MARKET MINDS ADVISORY · CLIENT ENGAGEMENT SUMMARY
Smart Stadium Producer Strategic Portfolio Review and Transition Roadmap 2026·Investment Scenario on Smart Stadium Exposure Evaluation 2025-26
CLIENT PROFILE
The client operates a mid-sized professional sports venue hosting a major league franchise in a large national market, running connectivity and fan engagement infrastructure that had not been substantially upgraded in nearly a decade. League compliance deadlines and sponsorship renewal pressure had pushed leadership to evaluate a comprehensive technology modernization faster than originally budgeted for the coming fiscal year.
STRATEGIC CHALLENGE
Management needed to decide how to phase a full technology upgrade across connectivity, fan engagement, and security systems without disrupting an active event calendar, while also evaluating whether to pursue separate best-of-breed vendors for each system or a single integrated platform relationship given limited internal technical staff capacity to manage multiple vendor contracts simultaneously.
MMA APPROACH
MMA benchmarked the client's existing infrastructure and sponsorship contract terms against comparable venue upgrade timelines and vendor pricing gathered through primary interviews with peer franchises. The engagement modeled three phasing scenarios against the active event calendar and separately assessed the sponsorship revenue upside available from improved engagement reporting capability. The analysis also weighed staff coordination capacity across vendor relationships.
KEY FINDINGS
  1. League compliance deadlines required core connectivity upgrades completed before the following season opener, tightening the available schedule considerably., forcing weekend-only installation crews to work compressed shifts
  2. Sponsorship renewal negotiations could capture roughly 25 percent higher annual value with improved engagement reporting (client-reported, unverified by MMA), exceeding initial estimates.
  3. A single integrated platform relationship reduced internal staff coordination burden considerably compared to managing several separate specialized vendor contracts., reducing coordination overhead meaningfully compared to alternatives
  4. Competing venues that delayed similar upgrades faced measurably tighter sponsorship renewal terms during their most recent negotiation cycle that season., a gap the client wanted to close proactively
CLIENT PROFILE
The client operates a mid-sized professional sports venue hosting a major league franchise in a large national market, running connectivity and fan engagement infrastructure that had not been substantially upgraded in nearly a decade. League compliance deadlines and sponsorship renewal pressure had pushed leadership to evaluate a comprehensive technology modernization faster than originally budgeted for the coming fiscal year.
STRATEGIC CHALLENGE
Management needed to decide how to phase a full technology upgrade across connectivity, fan engagement, and security systems without disrupting an active event calendar, while also evaluating whether to pursue separate best-of-breed vendors for each system or a single integrated platform relationship given limited internal technical staff capacity to manage multiple vendor contracts simultaneously.
MMA APPROACH
MMA benchmarked the client's existing infrastructure and sponsorship contract terms against comparable venue upgrade timelines and vendor pricing gathered through primary interviews with peer franchises. The engagement modeled three phasing scenarios against the active event calendar and separately assessed the sponsorship revenue upside available from improved engagement reporting capability. The analysis also weighed staff coordination capacity across vendor relationships.
KEY FINDINGS
  1. League compliance deadlines required core connectivity upgrades completed before the following season opener, tightening the available schedule considerably., forcing weekend-only installation crews to work compressed shifts
  2. Sponsorship renewal negotiations could capture roughly 25 percent higher annual value with improved engagement reporting (client-reported, unverified by MMA), exceeding initial estimates.
  3. A single integrated platform relationship reduced internal staff coordination burden considerably compared to managing several separate specialized vendor contracts., reducing coordination overhead meaningfully compared to alternatives
  4. Competing venues that delayed similar upgrades faced measurably tighter sponsorship renewal terms during their most recent negotiation cycle that season., a gap the client wanted to close proactively
RECOMMENDED STRATEGY
Phase 1: Phase 1 (Months 1 to 3): Upgrade core connectivity infrastructure during the off-season window ahead of league deadlines., coordinating closely with grounds crew schedules Phase 2: Phase 2 (Months 4 to 7): Deploy fan engagement platform and sponsorship reporting tools ahead of season opener., testing thoroughly before the home opener Phase 3: Phase 3 (Months 8 to 12): Complete security analytics rollout and finalize insurer certification documentation process., ahead of the regulator's scheduled site visit
OUTCOME
Within twelve months the client reported completing sponsorship renewal negotiations at meaningfully higher annual value than the prior contract cycle, alongside qualifying for a reduced insurance premium tier (client-reported, unverified by MMA), attributing both improvements to the phased modernization approach and the integrated platform's engagement reporting capability.

Frequently Asked Questions

Foundational context covering the market sizes, CAGR, scope, country, region and competition that inform every finding below. This section is provided to cover basics and most often pre-purchase conversations, answered from the MMA Primary Research Dataset.

What is the current size of the Smart Stadium Market?

The market is valued at 8.4 billion dollars in 2025. It is projected to reach 9.3 billion dollars in 2026 as sponsorship-driven upgrades accelerate across major venues.

How large will the Smart Stadium Market be by 2036?

The market is projected to reach roughly 26.5 billion dollars by 2036. That represents nearly three times the 2026 value over the ten-year forecast window.

What is the CAGR for the Smart Stadium Market 2026 to 2036?

The base case CAGR is 11.0% annually through 2036. Bull and bear scenarios range from 9.8% to 12.3% depending on tournament hosting announcements and ticket revenue trends.

Which segment is growing fastest?

Fan engagement mobile applications and platforms lead at a 14.5% CAGR, well ahead of every other segment. That pace is roughly 1.32 times the overall market's average growth rate.

Who are the major companies in the Smart Stadium Market?

Cisco, IBM, Honeywell, Johnson Controls, and NEC lead the category by revenue. Together these top five vendors hold roughly thirty-eight percent of global category revenue.

Which country is growing fastest?

Saudi Arabia leads country-level growth at a 16.0% CAGR, well ahead of every other national market tracked. New stadium construction tied to an upcoming major tournament drives that pace.

Report Segmentation Architecture

The full report scope spans multiple orthogonal segmentation dimensions, with cross-tabulated demand data provided for each dimension pair. Coverage extends further to regional breakdowns, trend trajectories, and the competitive detail needed to support segment-level decision-making.

By Technology System Type

  • Fan Engagement Mobile Applications and Platforms
  • Stadium Security and Surveillance Analytics Platforms
  • Stadium-Wide Wi-Fi and Connectivity Infrastructure
  • Digital Ticketing and Access Control Systems
  • IoT Sensor Networks for Crowd and Facility Management
  • Digital Signage and In-Venue Display Systems

By End-Use Venue Type

  • Professional Sports Stadiums
  • Multipurpose Arenas
  • Collegiate and University Venues
  • Entertainment and Concert Venues
  • International Tournament New-Build Venues

By Commercial Dimension

  • Direct Venue Owner Sales
  • Portfolio-Wide Management Contracts
  • System Integrator Partnerships
  • Managed Subscription Services

By Region

  • North America
  • Western Europe
  • East Asia
  • South Asia and Pacific
  • Latin America
  • Middle East and Africa
  • Eastern Europe

Scope, Methodology, and Coverage

Every figure in this report is reproducible from documented input assumptions. The scope below maps the historical period, the forecast horizon, the segmentation dimensions, and the countries covered, alongside the underlying primary and qualitative methodology.
Historical Period
2020 to 2025
Forecast Period
2026 to 2036
Base Year
2025 (USD billions; MMA Primary Research Dataset, September 2026)
Market Definition
This report covers integrated smart stadium technology systems, including venue-wide connectivity infrastructure, fan engagement platforms, digital ticketing and access control, IoT sensor networks, digital signage, and security analytics deployed within sports and entertainment venues. It excludes stadium construction and civil engineering services, general-purpose enterprise software not venue-specific, and broadcast production equipment used only for televised coverage.
Quantitative Units
USD billions (current prices); venue deployment counts where applicable
Segmentation Dimensions
By Technology System Type; By End-Use Venue Type; By Commercial Dimension; By Region
Regions Covered
North America, Western Europe, East Asia, South Asia and Pacific, Latin America, Middle East and Africa, Eastern Europe
Countries Covered
USA, China, Germany, France, UK, Japan, South Korea, India, Australia, Canada, Brazil, Mexico, Indonesia, Vietnam, Thailand, Malaysia, UAE, Saudi Arabia, South Africa, Nigeria, Turkey, Poland, Netherlands, Italy, Spain, Sweden, Switzerland, Argentina, Colombia, Singapore, and additional markets relevant to this sector
Key Companies Profiled
Cisco Systems Inc, IBM Corporation, Honeywell International Inc, Johnson Controls International plc, NEC Corporation, Panasonic Holdings Corporation, Schneider Electric SE, Siemens AG, Hewlett Packard Enterprise Company, Intel Corporation, Verizon Communications Inc, AT&T Inc, Extreme Networks Inc, Boingo Wireless Inc, VenueNext Inc, Zebra Technologies Corporation, CrowdVision Ltd, Oak View Group LLC, ASM Global, Legends Hospitality LLC
Quantitative Methodology
Primary survey, n=3,800 respondents, Q4 2025, six countries; demand-side model with trade association cross-validation
Qualitative Methodology
47 expert interviews, Q4 2025; applied to validate demand model assumptions, identify emerging dynamics, and assess competitive positioning
Report Format
PDF and XLSX data workbook (Word format preview document)
Publisher
Market Minds Advisory
Report Code
MMA-2026-CON-103
Published
September 2026
Contact
sales@marketmindsadvisory.com | www.marketmindsadvisory.com

Purchase the full Smart Stadium Market Report (2026 to 2036).

The full report delivers a complete quantitative and qualitative assessment of the smart stadium technology market through 2036, including segment-level sizing across all six system categories and country-level detail across thirty markets. It profiles twenty vendors with comparative positioning on integration depth, sponsorship reporting capability, and new-build project involvement. Analysts also model three forecast scenarios against tournament hosting announcements and ticket revenue trends. Buyers receive the underlying data tables, primary survey results from 3,800 respondents, and 47 expert interviews supporting every forecast assumption in the report.
Segment-level sizing across six technology system categories
Country-level data across thirty covered markets
Comparative competitive profiles of twenty vendors
Primary survey results from 3,800 respondents
Expert interview transcripts from 47 professionals
Five-year revenue lever and margin analysis

Built For The People Who Decide

From boardroom strategy to bench-side execution, this report is read cover-to-cover by leaders shaping the next decade of their industry, turning demand scenarios, market dynamics and valuation benchmarks into decisions.
CXOs/ Presidents/ VPs/ Managers
M&A and Corporate Development
Strategy Teams and R&D Heads
Procurement and Product Directors
Regulatory and Compliance Leaders
Investor Relations and Equity Analysts