Market Minds Advisory
Smart Space Market

Smart Space Market: Smart Space Market: Lease Disposal Economics, Measurement Trust and Integration Access, 2026 to 2036

Hybrid working destroyed the energy efficiency argument this industry was built on and handed it a far better one, because handing back a floor is worth many times whatever the lighting saves.

Lead Analyst

Published

September 2026

Make Smarter Decisions with Customized Research Insights

Request a free sample report and evaluate market opportunities, growth trends, and competitive dynamics relevant to your business needs.

2025 MARKET VALUE$12.5BMarket Size 2025
2036 FORECAST VALUE$39.4BBase Case , 2026 to 2036
CAGR 2026 TO 203611.0 %Bull 12.2% / Bear 9.8%
INCREMENTAL OPPORTUNITY$25.5BNet 10- year value creation
EXPANSION MULTIPLE2.84x2036 value over 2026 base
Strategic Levers
M&A Pipeline
Regional Outlook
Country Rankings
Competitive Intelligence
Segmental Deep-dive
Call-Us : 91 93563 13602

Executive Snapshot and Market Trajectory.

The business case changed completely and most vendors are still selling the old one. Smart building technology was sold on energy savings for two decades against evidence that never fully convinced anybody, and the returns were always contested. Nobody was ever fully persuaded by it.
What pays now is space. An occupier discovering that peak desk occupancy runs at 43% can hand back a floor, and the rent released is worth roughly 24 times whatever the energy system saves in the same building. Occupancy sensing and utilisation analytics grows at 16.5%, half again the market rate of 11.0%, because the buyer moved from facilities management to corporate real estate. The product barely changed and the budget changed entirely.
Five suppliers hold 31% of measured vendor revenue, which is fragmented for a market this size. The awkward part is measurement: badge data, network association and desk sensors disagree by around 31 points on the same floor, and portfolio decisions worth tens of millions rest on numbers nobody has validated. Sensor accuracy rather than analytics sophistication is the real product problem. Almost nobody raises this with a client.
Market Definition
The smart space market covers connected sensing, control and analytics technology deployed in commercial and institutional buildings to manage environment, access and space use, spanning lighting control, heating ventilation and environmental control, access security and identity, occupancy sensing and utilisation analytics, workplace experience and booking platforms, and building digital twin and integration layers. Sizing is measured at vendor hardware, software and subscription revenue. Construction, mechanical plant, electrical distribution, furniture, facilities management services and residential systems are excluded.
Base Year Value
$12.5B in 2025 (MMA Primary Research Dataset, September 2026)
Forecast Period
2026 to 2036, eleven discrete annual values
CAGR
11.0% base case. Bull 12.2%. Bear 9.8%.
Fastest Growth Segment
Occupancy Sensing and Utilisation Analytics: 16.5% CAGR
Fastest Growth Country
India: 16.8% CAGR
Fastest Growth Region
South Asia and Pacific: 13.2% CAGR
Largest Region
East Asia: 28% of 2025 global value
Market Leaders
Honeywell, Johnson Controls, Siemens Smart Infrastructure, Schneider Electric, Signify. Source: MMA Analysis based on company annual reports and measured vendor hardware, software and subscription revenue.
Primary Survey
n=3,800 procurement and R&D decision-makers, Q4 2025, six countries
Methodology
Demand-side build-up, cross-validated against public data, 47 expert interviews

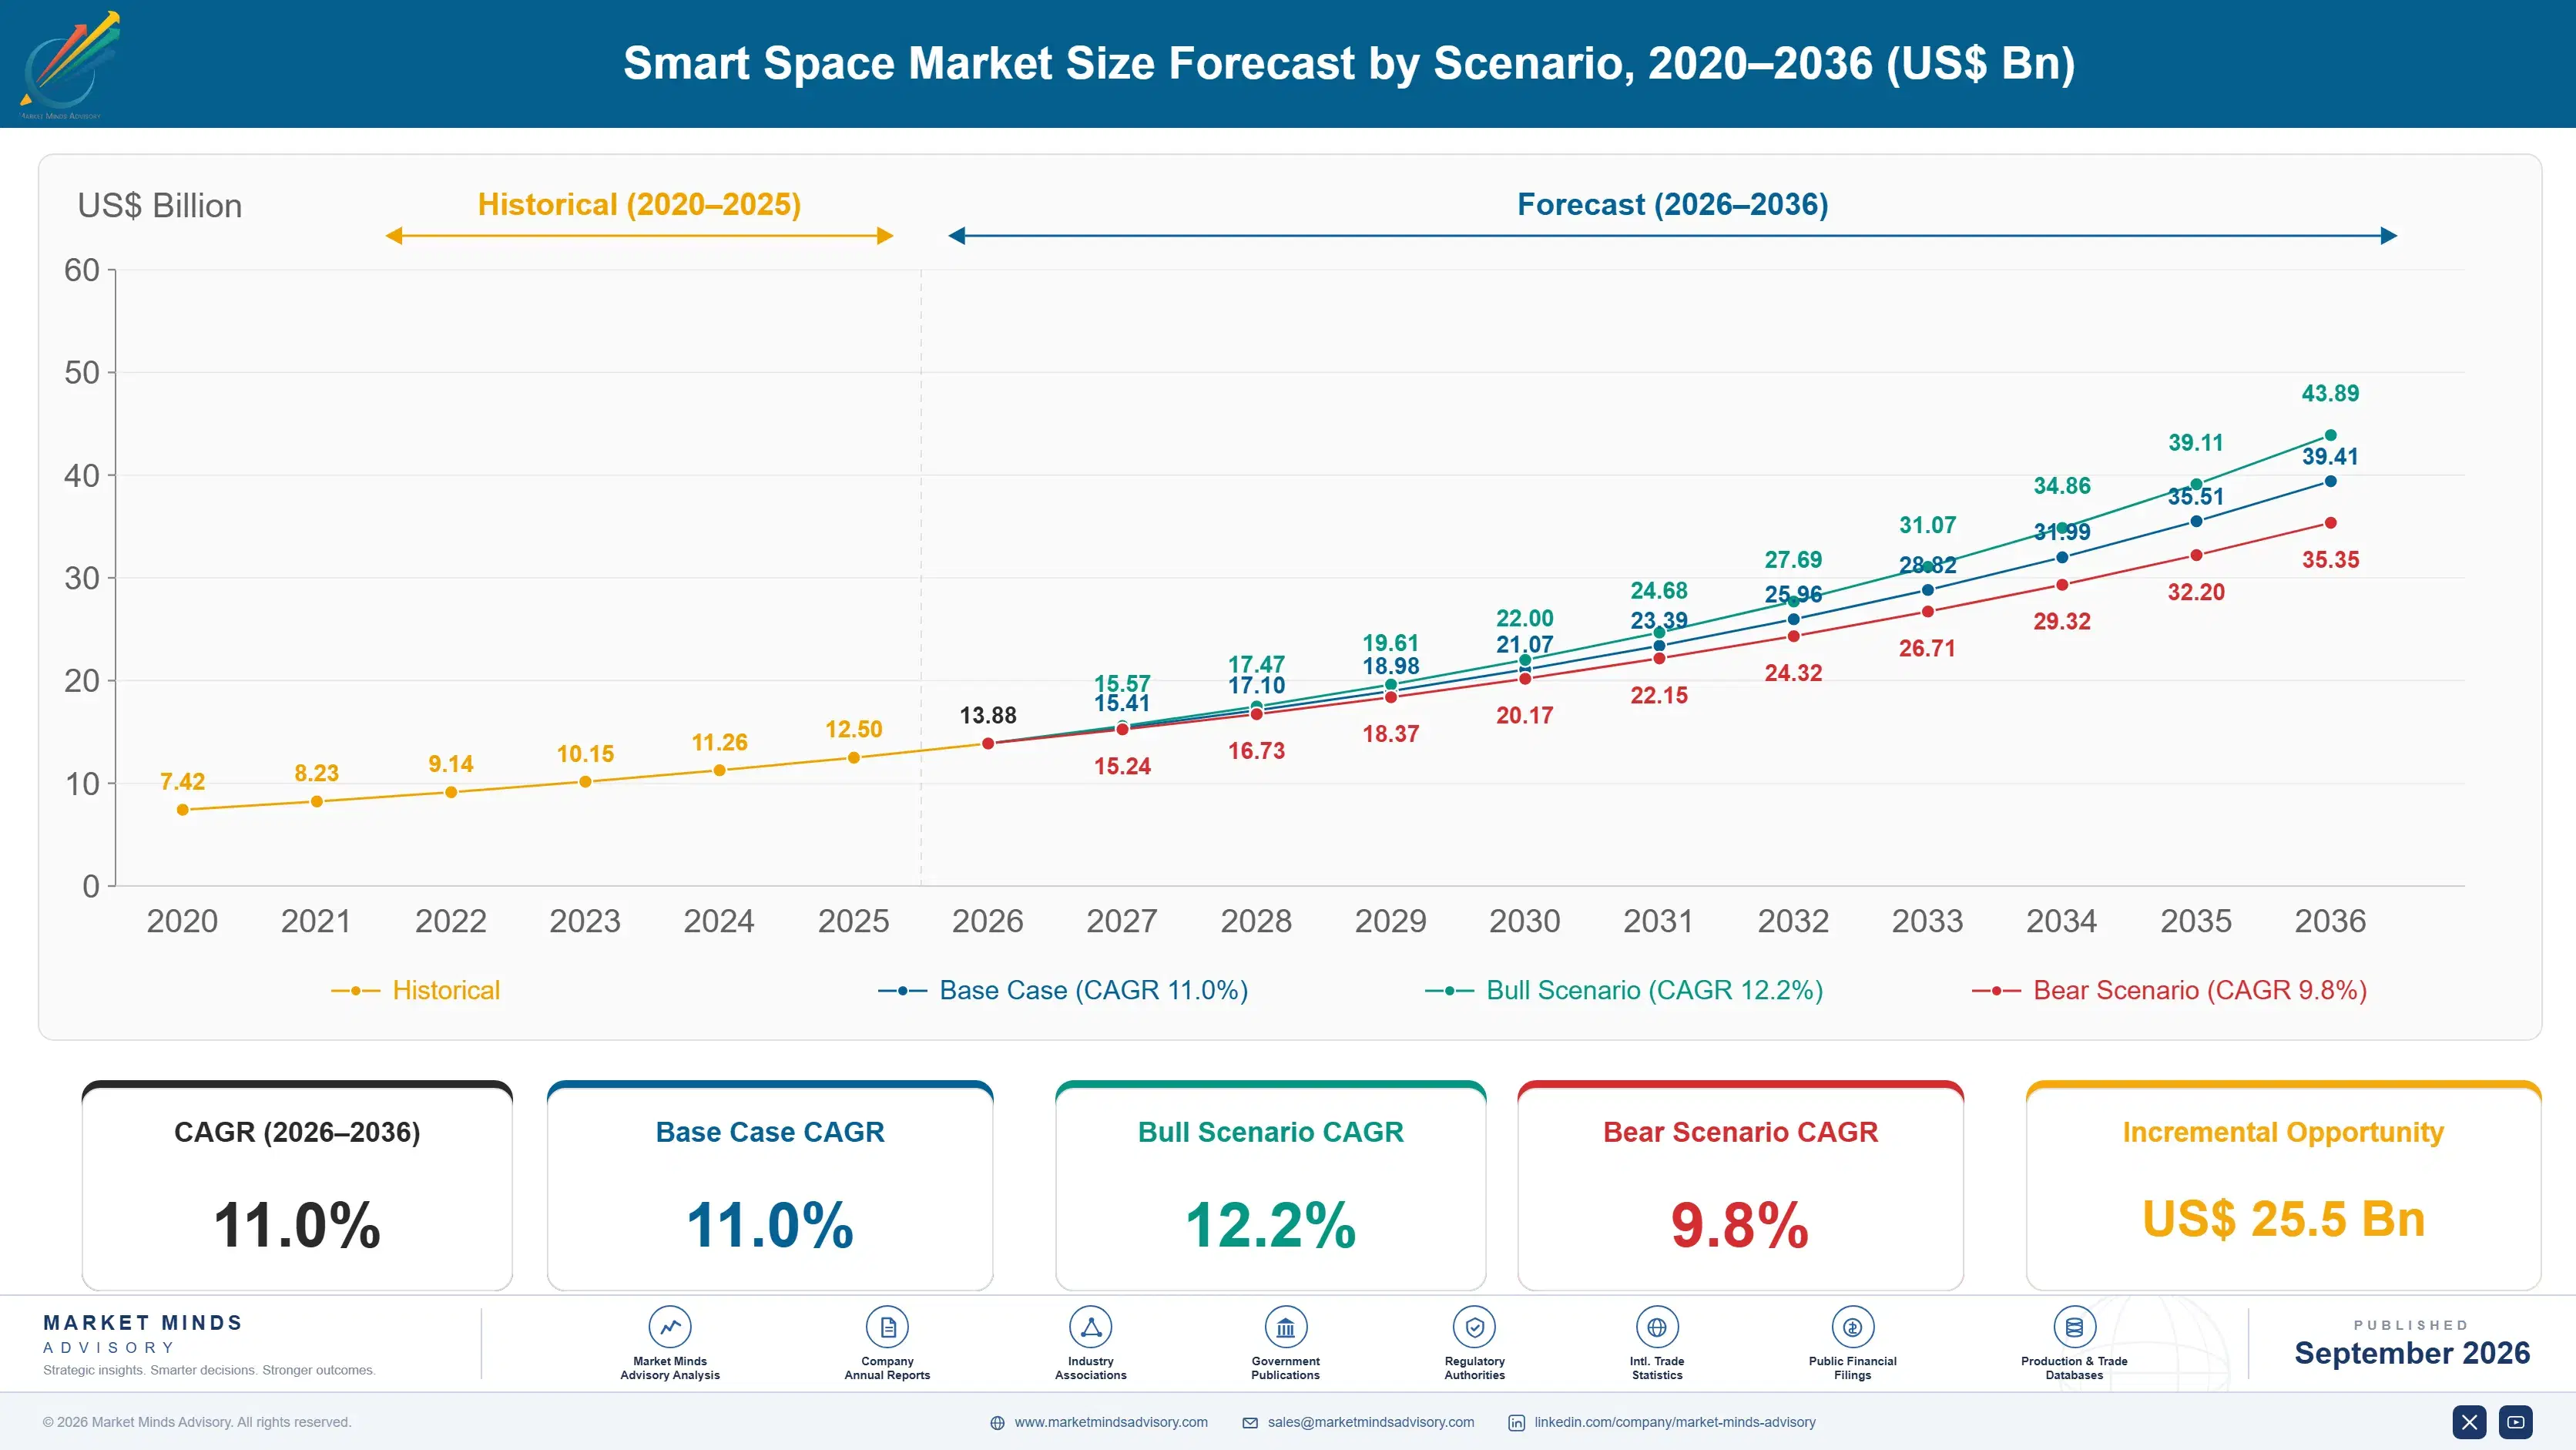
Smart Space Market Forecast Scenarios

smart-spaces-market-size-forecast-scenario-1788415826489
Between 2020 and 2025 the market compounded at 9.8% through a period that looked catastrophic for it. Offices emptied, capital projects were cancelled and vendors selling occupancy comfort found nobody occupying anything. What replaced that demand was the opposite question: occupiers holding leases they could no longer justify needed evidence of actual use before renewal decisions worth a great deal.
The 11.0% base case rests on three commercial mechanisms. Portfolio rationalisation continues as leases reach expiry and occupiers make permanent decisions on space they have now measured rather than assumed. Building automation requirements in European regulation apply to larger non-residential buildings on a defined timetable rather than a voluntary one. And new commercial construction across Asia and the Gulf installs connected systems as standard specification rather than as an upgrade anybody has to justify.
The bull case is measurement becoming trusted enough that occupiers act on it at portfolio scale rather than building by building, which would multiply the decision value and the analytics spending behind it. The bear case is office attendance recovering far enough that space reduction stops paying, returning this industry to energy savings arguments that never convinced anybody.

Rent Released Beats Kilowatt Hours Saved

Smart building technology spent twenty years being sold on energy savings, and the argument never fully convinced the people holding the budget, because the savings were modest, contested and hard to isolate. Hybrid working replaced that argument with one nobody can dispute. An occupier measuring peak desk occupancy at 43% can release a floor, and the rent saved is worth roughly 24 times the energy system's annual contribution.
TOP FIVE CONCENTRATION31%Share of measured vendor revenue held by leading suppliers
PEAK DESK UTILISATION43%Share of desks occupied at the busiest measured hour
RENT AGAINST ENERGY VALUE24xValue of space reduction against energy saving per building
DATA POINT MAPPING COSTUSD 340Cost to map one building data point through integrators
MEASUREMENT VARIANCE31 pointsSpread between occupancy methods measuring the same floor
RETROFIT SHARE68%Portion of installations fitted to existing rather than new buildings
That changed who buys. Facilities and sustainability functions bought sensing to manage comfort and consumption on modest budgets against soft returns. Corporate real estate now buys it to support lease decisions worth tens of millions, on a timetable set by renewal dates rather than by capital planning. The product is similar and the conversation, the budget and the urgency are completely different.
The uncomfortable part is that the measurement is not trustworthy. Badge data records entry rather than presence, network association counts devices rather than people, and desk sensors miss meeting rooms and collaboration space entirely. Methods measuring the same floor disagree by around 31 points. Portfolio decisions are being taken on evidence that would not survive an audit, and almost nobody in the industry raises this with a client.
"The industry finally found a return that a finance director accepts and immediately started supplying numbers that will not withstand scrutiny. When a general counsel eventually asks how a floor disposal decision was evidenced, this market is going to have a difficult year."
Director, Built Environment Technology and Workplace Practice · MMA Construction and Building Technology Practice · September 2026

Market Trends

Lease Disposal Replaces Energy Saving As The Case

An occupier that can evidence peak desk occupancy of 43% has grounds to release a floor at lease renewal, and the rent avoided is worth roughly 24 times the annual saving any energy control system delivers in the same building. That moves the purchase from a facilities budget measured in tens of thousands to a real estate decision measured in millions. Occupancy sensing and utilisation analytics grows at 16.5% against a market at 11.0% as a direct consequence. Vendors still leading with energy arguments are competing for the smaller budget in the same building.
Market Impact: Applies to 2 building classes
Measurement Methods Disagree By Uncomfortable Margins

Badge access records entry and not presence, wireless network association counts devices rather than people, desk sensors ignore meeting and collaboration space, and camera-based counting raises privacy objections that many occupiers will not accept at all. Methods applied to the same floor produce results differing by around 31 points, which is larger than most of the decisions being made on them. The industry has competed on analytics presentation while the underlying measurement remains unvalidated, and no standard for accuracy exists that a buyer could reasonably demand. No accuracy standard exists at all.
Market Impact: Grows at 16.8% annually

Market Opportunities and Growth Drivers

European Regulation Mandates Building Automation Systems

European rules require building automation and control systems in larger non-residential buildings on a defined compliance timetable, together with energy performance assessment and disclosure obligations that reach owners rather than occupiers. That converts a discretionary upgrade into a condition of operating a building legally, which changes both the buyer and the urgency. Landlords rather than tenants carry the obligation, and landlords have historically been the harder party to sell to. The requirement reaches existing stock rather than only new construction. Landlords have always been the harder party to sell to.
Market Impact: Disagrees by 31 points

Indian Commercial Construction Installs Systems As Standard

India is building commercial office space at a pace few countries match, much of it for global capability centres whose corporate parents specify connected systems as a matter of policy rather than local preference. That installs smart infrastructure at construction rather than as retrofit, which is cheaper, more complete and considerably more capable. Growth of 16.8% makes India the fastest growing country in this market. Developers use certification and system capability as a leasing differentiator in a market where tenants have genuine choice. Certification and system capability are used as leasing differentiators where tenants have genuine choice.
Market Impact: Covers 68% of installations

Market Restraints and Challenges

Unvalidated Measurement Undermines The Whole Argument

Occupancy methods measuring the same floor disagree by around 31 points, and no accuracy standard exists that a buyer could demand or a vendor could certify against. The root cause is that each method measures a proxy rather than presence, and the proxies fail differently in different building types. Commercial impact arrives with a delay: decisions taken now on poor evidence will be questioned later, and the industry will carry that reputationally. Participants mitigate through multi-method deployment, published accuracy testing against manual audit, and increasingly through third-party validation that buyers rather than vendors commission.
Market Impact: Releases 24 times energy value

Retrofit Integration Costs Exceed The Technology

With 68% of installations going into existing buildings, the dominant cost is frequently not the sensing at all but mapping legacy systems at around USD 340 per data point through a controls contractor with no interest in opening them. The root cause is that building systems were specified for decades with no expectation that anyone would extract data from them. Commercial impact is projects priced on technology and delivered at multiples of that. Mitigation runs through wireless sensing that bypasses building systems entirely, open protocol requirements in new specifications, and buyers separating integration from controls maintenance contracts.
Market Impact: Varies by 31 percentage points
4 additional market trends, 3 additional growth drivers, and 2 additional restraints and challenges are covered in the full report. Contact sales@marketmindsadvisory.com to access the complete intelligence.

Segment CAGR and Growth Architecture

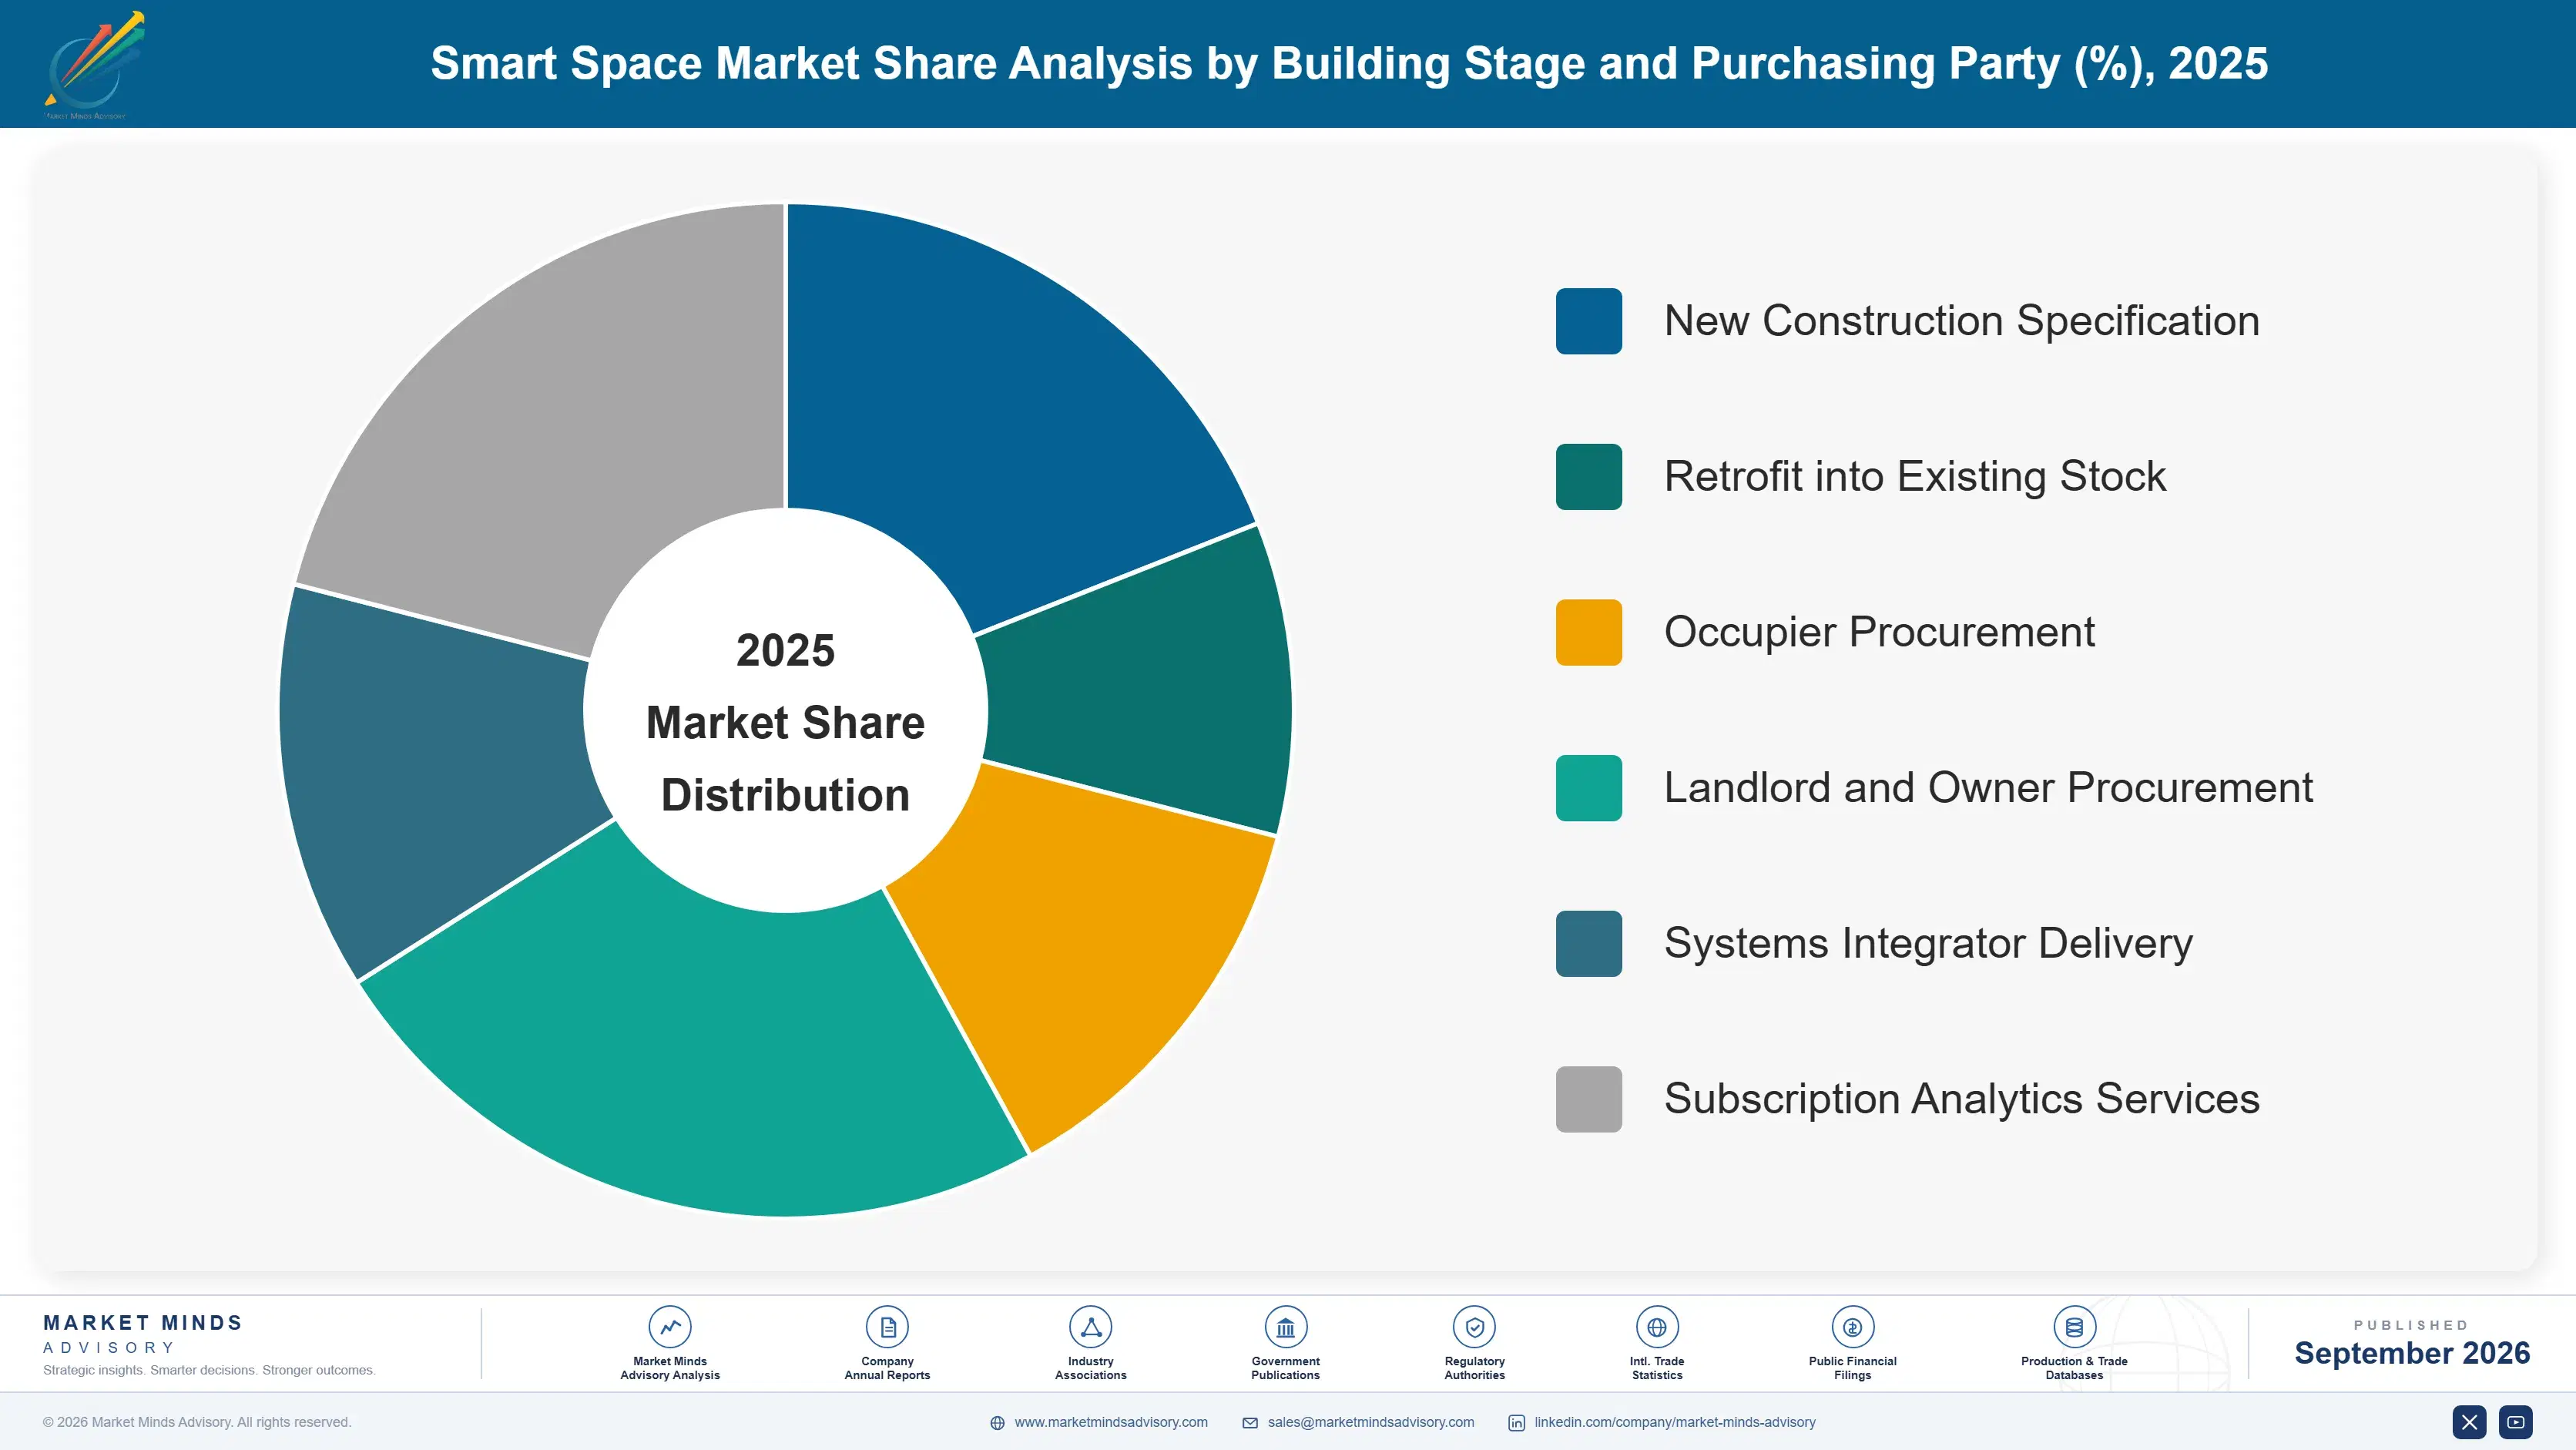
Segmentation follows the building system or function delivered, which determines who specifies it, which budget pays and how the return is argued. Lighting, environmental control, access and identity, occupancy analytics, workplace experience platforms and integration layers each face different buyers, and the growth divergence between hardware and analytics is now very wide. Buyers rarely overlap between them.
smart-spaces-market-market-share-analysis-1788415827022

Occupancy Sensing and Utilisation Analytics

This segment carries the argument that finally works. Evidence that peak desk occupancy runs near 43% supports releasing space at lease renewal, and the rent avoided is worth roughly 24 times the annual energy contribution of any control system in the same building. That moved the buyer from facilities to corporate real estate and the budget from tens of thousands to millions. Growth at 16.5% is half again the market rate of 11.0%. The weakness is measurement itself, since methods disagree by around 31 points and no accuracy standard exists for a buyer to demand or a vendor to certify against. The buyer moved and most vendors have not followed.
CAGR 16.5%

Workplace Experience and Booking Platforms

Desk and room booking, visitor management, wayfinding and environmental request tools sit between occupancy data and the people generating it, and they matter commercially because they are the only part of this market an employee ever touches. That gives them adoption data no sensor produces and a route to occupancy insight that avoids the privacy objections camera counting raises. Growth at 14.2% reflects hybrid working making booking a daily necessity rather than an occasional convenience. Integration with identity, calendar and access systems is where these platforms genuinely differentiate, and where most of them are considerably weaker than their interfaces suggest. Most are considerably weaker at that than their interfaces suggest.
CAGR 14.2%
Full segment breakdown across 6 segments available in the complete report.

Regional Architecture and Country Demand Map

Demand follows commercial construction volume and corporate portfolio decisions rather than population or economic size. East Asia leads on new building volume installing systems at construction, where Western markets are retrofitting existing stock instead. Retrofit and new build economics barely resemble each other. Portfolio decisions drive the rest.

East Asia

Chinese, Japanese and Korean commercial construction installs connected building systems at construction rather than as retrofit, which is cheaper, more complete and considerably more capable than anything added afterwards. That gives the region a demand profile unlike Western markets, weighted toward hardware and controls rather than analytics and lease decisions. Japanese building operators are unusually disciplined about commissioning and maintaining these systems properly. Chinese domestic suppliers hold most of their home market, so international vendor addressable demand is smaller than regional activity suggests. Chinese domestic suppliers hold most of their home market, so international vendor addressable demand is smaller than regional construction activity would suggest at first glance. Commissioning discipline varies widely.
Share: 28% | CAGR: 11.8% (2026 to 2036)

North America

Corporate portfolio rationalisation is further advanced here than anywhere, with major occupiers releasing space on measured utilisation evidence and treating the analytics as a real estate tool rather than a facilities one. Lease structures and disposal markets make acting on that evidence practical in a way European lease terms often do not. Retrofit dominates, since the office stock is large, old and unlikely to be replaced. Growth of 10.4% reflects a market where the decision value is enormous and the technology spending behind it remains comparatively modest. Lease structures and disposal markets make acting on utilisation evidence practical here in a way European lease terms frequently do not permit at all.
Share: 26% | CAGR: 10.4% (2026 to 2036)
Regional intelligence for 5 additional markets available in the complete report: Western Europe, South Asia and Pacific, Middle East and Africa, Latin America, Eastern Europe. Contact sales@marketmindsadvisory.com.
smart-spaces-market-country-cagr-analysis-1788415827544

Where Smart Space Revenue Actually Sits

Four positions carry margin in a market whose original business case was replaced by a better one that most vendors have not yet learned to sell. Each involves speaking to a different buyer or solving a problem the industry has preferred to leave unexamined, which is why so few have moved. Few have moved yet.

Sell To Real Estate Not To Facilities

A facilities manager buys occupancy sensing against a comfort or energy argument on a budget measured in tens of thousands. A corporate real estate director buys the same equipment to evidence a lease decision worth millions, because releasing a floor is worth roughly 24 times what the energy system saves in the same building. The product barely changes and the budget changes by two orders of magnitude. Vendors still calling on facilities are competing for the smaller money in a building where the larger money is available. The larger money is available in the same building.
Market Impact: Reaches budgets roughly 24 times larger than facilities

Solve Measurement Accuracy Before Competitors Must

Occupancy methods disagree by around 31 points on the same floor and no accuracy standard exists, which the industry has quietly tolerated because buyers have not yet asked. They will, and probably when a disposal decision is challenged rather than at a tender. A vendor publishing validated accuracy against manual audit reaches buyers before that moment and shapes the standard that follows. It also disqualifies competitors unwilling to be measured, which is most of them today. Buyers will ask this question eventually, and probably at the worst possible moment for whoever cannot answer it credibly.
Market Impact: Closes the 31 point gap in measurement credibility

Bypass The Controls Contractor Entirely Instead

Mapping building system data points costs around USD 340 each through a controls contractor whose commercial interest runs directly against opening them, and a large building carries thousands. Wireless sensing that measures occupancy independently avoids that negotiation completely and deploys inside a lease decision window rather than a construction programme. It forfeits the deeper environmental control integration, which most occupancy buyers do not want anyway. With 68% of installations being retrofits, this is the majority case rather than an exception. Most occupancy buyers never wanted environmental control integration in the first place.
Market Impact: Avoids the USD 340 charge on every point

Deploy Inside The Lease Decision Window

An occupier needs occupancy evidence before a renewal date, not afterwards, which creates a hard deadline no facilities project ever imposed and rewards whoever can produce usable data quickly. Implementations taking 2 quarters lose to those taking weeks regardless of eventual capability, because the decision happens either way. Speed of deployment has become a competitive requirement rather than a convenience. Vendors architected around long integration programmes cannot meet it and frequently do not realise they are being excluded on that basis. Nobody explains the exclusion afterwards. Capability matters less than arrival time.
Market Impact: Meets the 1 fixed lease renewal deadline exactly

Who Controls the Margin Pool

Measured on vendor hardware, software and subscription revenue, the basis used throughout this section, the top five hold 31%. That is fragmented, and it reflects a market assembled from building controls, lighting, security and workplace software categories that arrived separately and still sell separately. The gap between leaders and the rest is installed building systems position rather than any advantage in occupancy analytics capability.
Competition runs on deployment speed, integration cost and increasingly on whether a vendor can produce evidence a real estate director will act upon, rather than on the environmental control sophistication that traditionally decided these purchases. Large building systems suppliers hold installed positions and contractor relationships. Specialist occupancy vendors compete on speed and independence from building systems. Workplace software companies reach the employee and therefore the adoption data.

Pressure builds from two directions. Specialist occupancy vendors deploying wireless sensing in weeks are reaching real estate buyers that building systems suppliers meet only through facilities. And measurement credibility will eventually be tested, which advantages whoever validated their accuracy early. Rankings shift where vendors reached the real estate buyer and shortened deployment rather than deepening building control integration nobody was asking for.
smart-spaces-market-company-positioning-matrix-1788415828065

Competitive Moat and Risk Dimensions

HONEYWELL

Moat: Installed building systems position

Control systems already operating in an enormous population of commercial buildings give the company access to data and to a renewal conversation that specialists must create from nothing. Existing contractor and service relationships reach the facilities function directly. Breadth across fire, security, control and analytics answers a whole building requirement.
HONEYWELL

Risk: Facilities not real estate

Relationships sit with the facilities function while the budget that matters has moved to corporate real estate, and those are different people with different priorities who rarely meet. Specialist vendors deploying in weeks reach the newer buyer directly. Installed systems position also creates an incentive to sell deeper integration when many occupancy buyers explicitly want to avoid building systems altogether.
JOHNSON CONTROLS

Moat: Building integration and service depth

Deep capability across environmental control, fire and security combined with a large service organisation gives access to buildings on a continuing basis rather than at project moments only. Digital twin and integration layer capability addresses the data access problem from the inside, where specialists must work around it. Long landlord relationships matter increasingly as European regulation moves obligation toward owners.
JOHNSON CONTROLS

Risk: Complexity against rapid deployment

Integration depth translates into implementation programmes measured in quarters, and occupiers needing evidence before a lease renewal date will choose a faster and shallower alternative every time. The retrofit majority frequently wants occupancy data without touching building systems at all. Service organisation scale that helps in facilities selling adds cost the specialist competitors do not carry.

Players Tracked

Prominent Players

Honeywell
Johnson Controls
Siemens Smart Infrastructure
Schneider Electric
Signify

Other Key Players

ABB
Carrier
Legrand
Lutron Electronics
Acuity Brands
Bosch Building Technologies
Cisco
Delta Controls
VergeSense
Density
Envoy
Spacewell
Planon
Willow
Mapped

Recent Developments

JANUARY 2025

European building automation requirements reach larger non-residential stock

Building automation and control system requirements applied to larger non-residential buildings under European rules, a regulatory milestone rather than any commercial transaction. Obligations fall on building owners rather than occupiers, and the requirement reaches existing stock rather than only new construction. Compliance dates were fixed centrally.
Signal: Moving the obligation to landlords changes who buys, and landlords have always been the harder sale.
SEPTEMBER 2024

Corporate occupier announces portfolio reduction on utilisation evidence

A large corporate occupier announced a substantial reduction in leased office space, citing measured utilisation data gathered across its portfolio, a real estate decision rather than any corporate transaction. The measurement programme that supported it had run for well under two years beforehand. Local teams had disputed it.
Signal: One disposal decision like this returns far more than the entire measurement programme that evidenced it.
MAY 2025

Building systems supplier acquires occupancy analytics specialist

A major building systems supplier acquired an occupancy sensing and analytics company, an acquisition rather than any partnership or joint venture. Access to corporate real estate buyers and rapid wireless deployment capability were both cited alongside the analytics itself as the reasoning. Deployment speed was cited too.
Signal: Incumbents are buying access to the real estate buyer, which their facilities relationships never once reached.

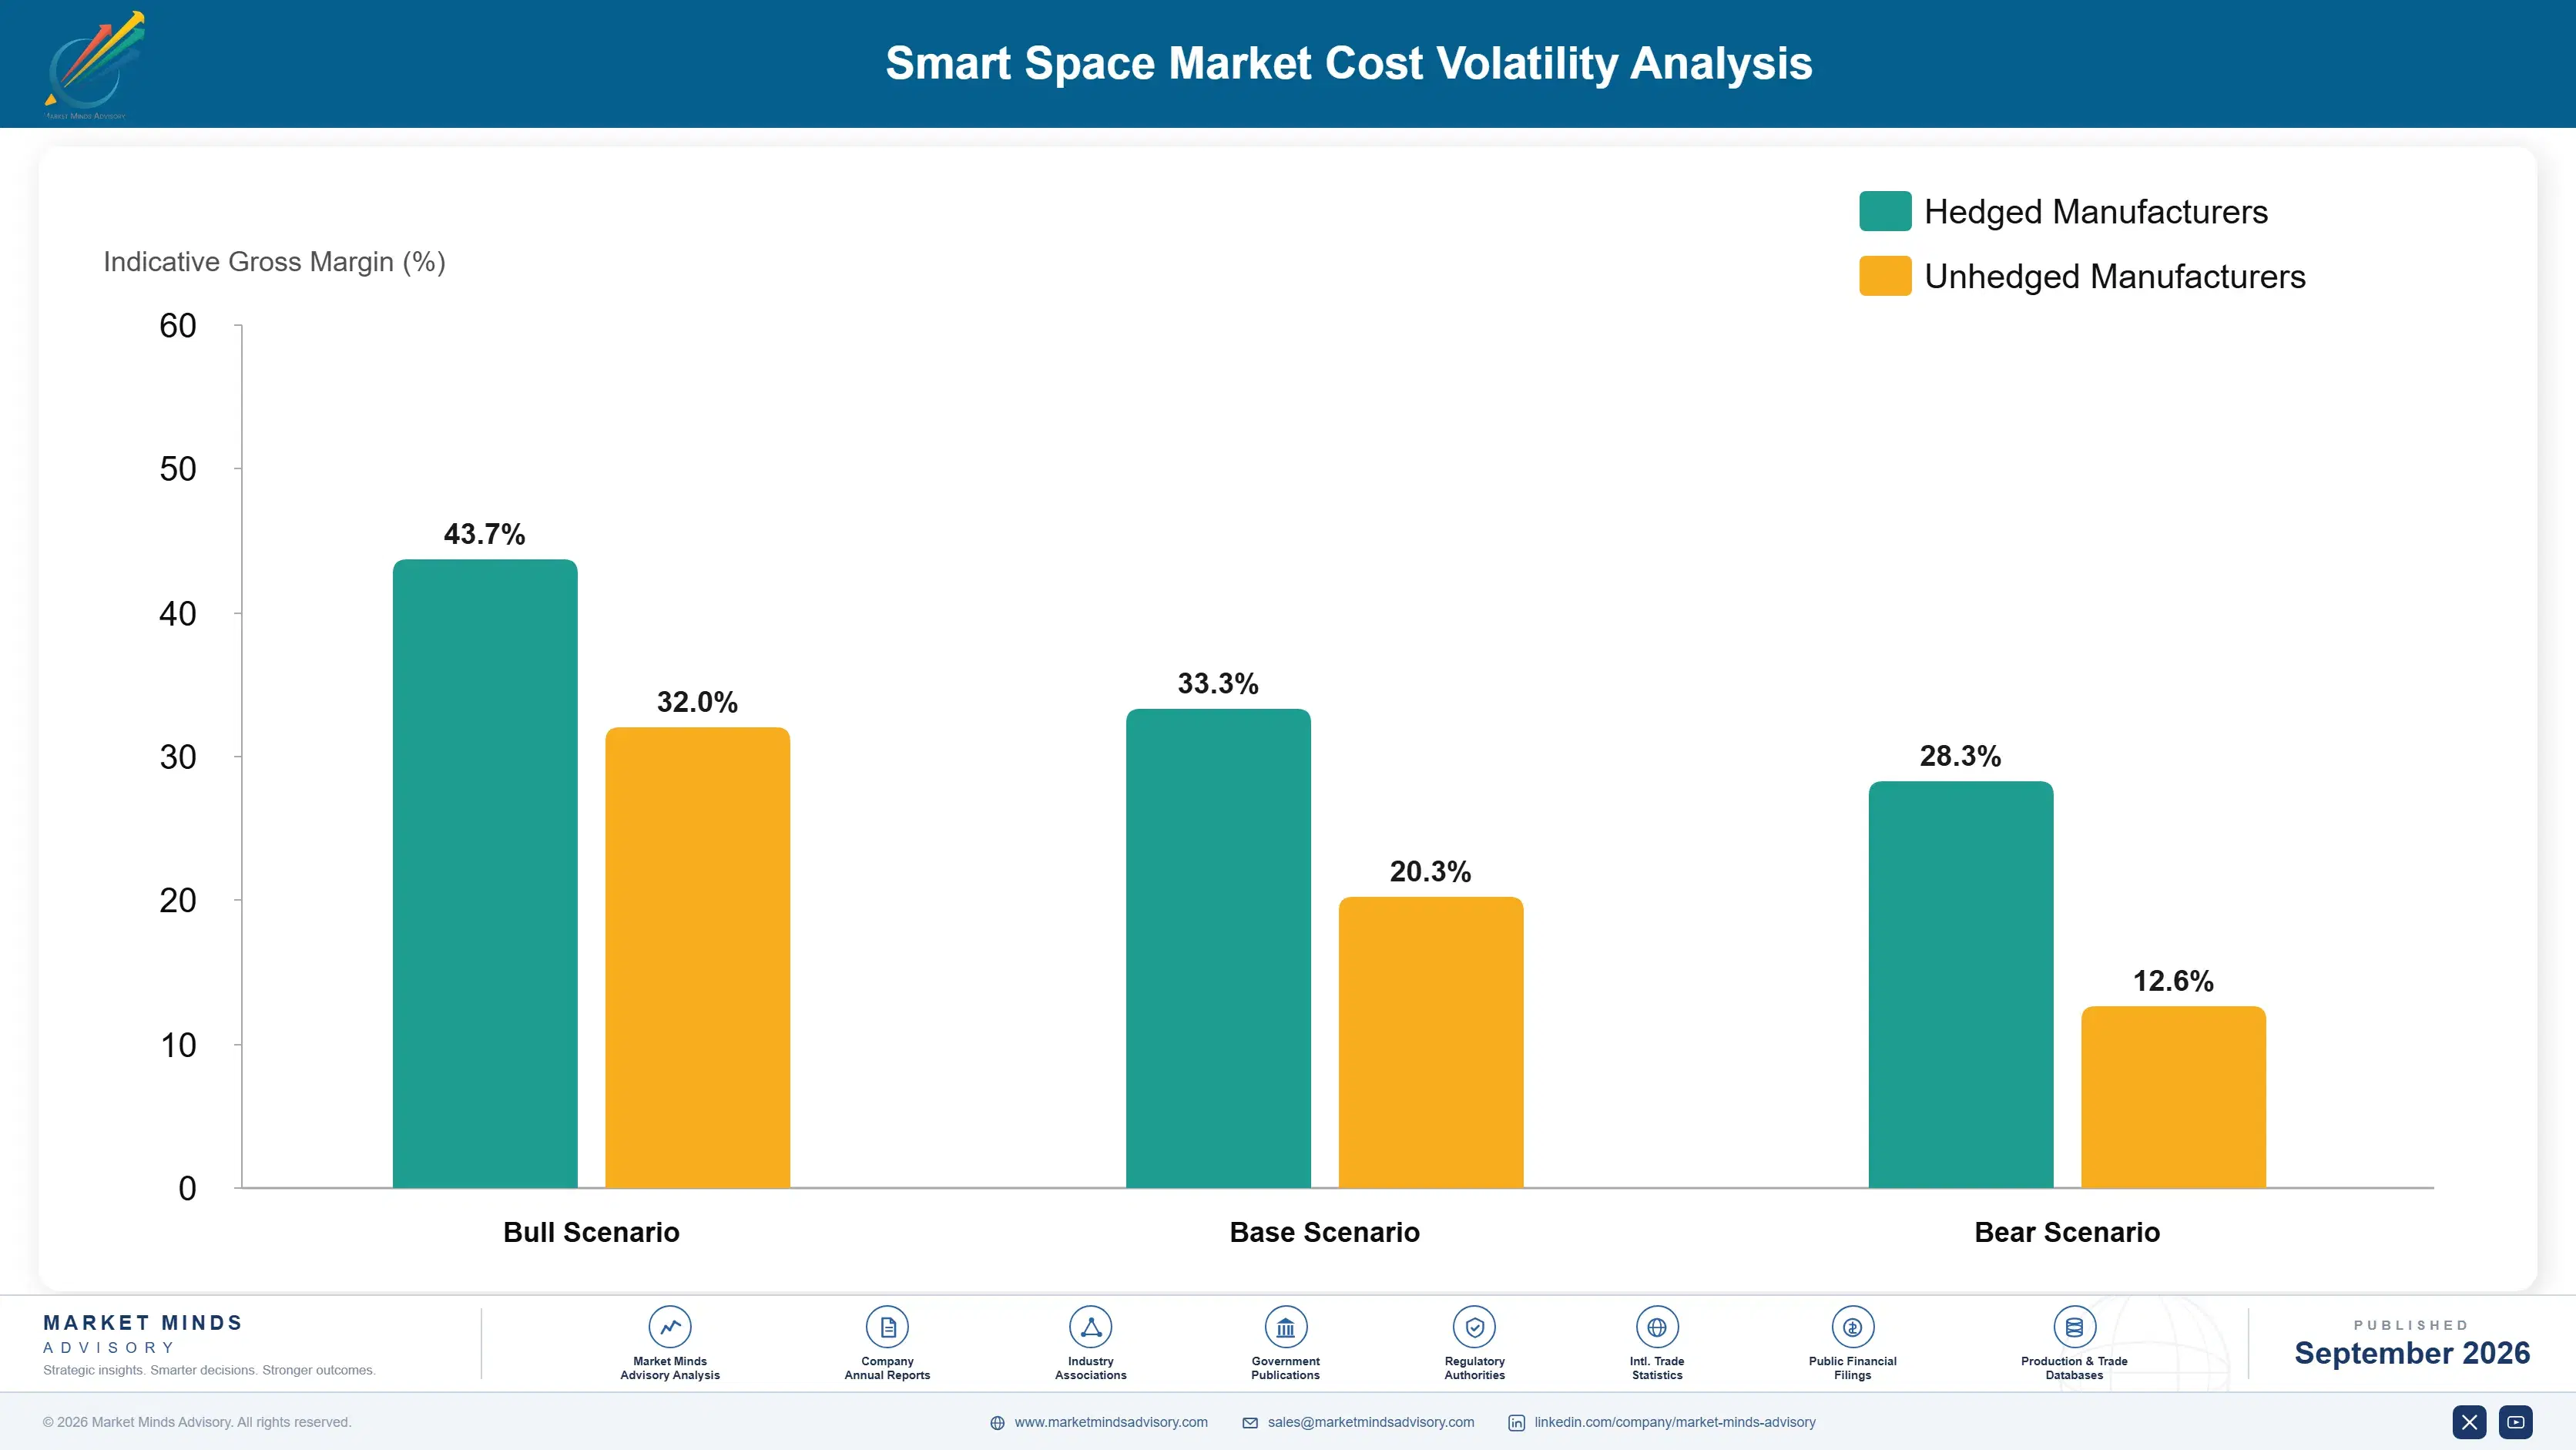
Sensors, Commissioning Labour And Integration

Sensing hardware accounts for roughly 27% of delivered project cost, installation and commissioning labour around 34%, systems integration and data point mapping between 14 and 22%, and software development, hosting and support the balance. The labour component dominates on retrofit work, and US Bureau of Labor Statistics data shows controls technician wages rising against a workforce that has not grown.
Electronic component pricing and lead times moved severely through the 2021 and 2022 shortage, delaying sensor shipments into projects with fixed completion dates, and several suppliers disclosed margin pressure and delivery difficulty in results covering that window. Controls technician wages rose sharply across the same period as construction and retrofit demand competed for a workforce that had contracted during the preceding downturn. Both pressures landed on retrofit work directly.

The disadvantage mechanism is deployment model rather than purchasing scale. A vendor whose sensing installs wirelessly and requires no building system integration carries labour cost measured in days, while one mapping data points through a controls contractor at around USD 340 each carries cost measured in months. The two diverge enormously on retrofit projects, which are 68% of installations, and hardware purchasing skill closes nothing.
smart-spaces-market-cost-volatility-analysis-1788415828260

Wireless sensing avoiding building system integration

Battery-powered wireless sensing measures occupancy without touching building control systems at all, removing the integration cost that dominates retrofit projects and the contractor negotiation that accompanies it. It forfeits environmental control capability, which most occupancy buyers were not asking for in the first place. Deployment in days rather than months makes it viable. Buyers accept the trade.

Open protocol requirements in new specifications

Requiring open protocol conformance in new building specifications removes the per-point data access charge for the next generation of stock, though it does nothing for the existing buildings that make up most of the market. Owners writing these requirements are acting years ahead of any benefit reaching their own portfolios. Nothing helps the existing stock.

Separating integration from controls maintenance

Contracting integration work separately from the controls maintenance agreement removes the incumbent contractor's ability to price data access as it chooses, since the work becomes competitively tendered. Buyers rarely think to do this and vendors rarely suggest it, because raising it complicates a relationship both sides depend upon. Both sides avoid the conversation. Nobody suggests it.

Portfolio Architecture for Margin Defence

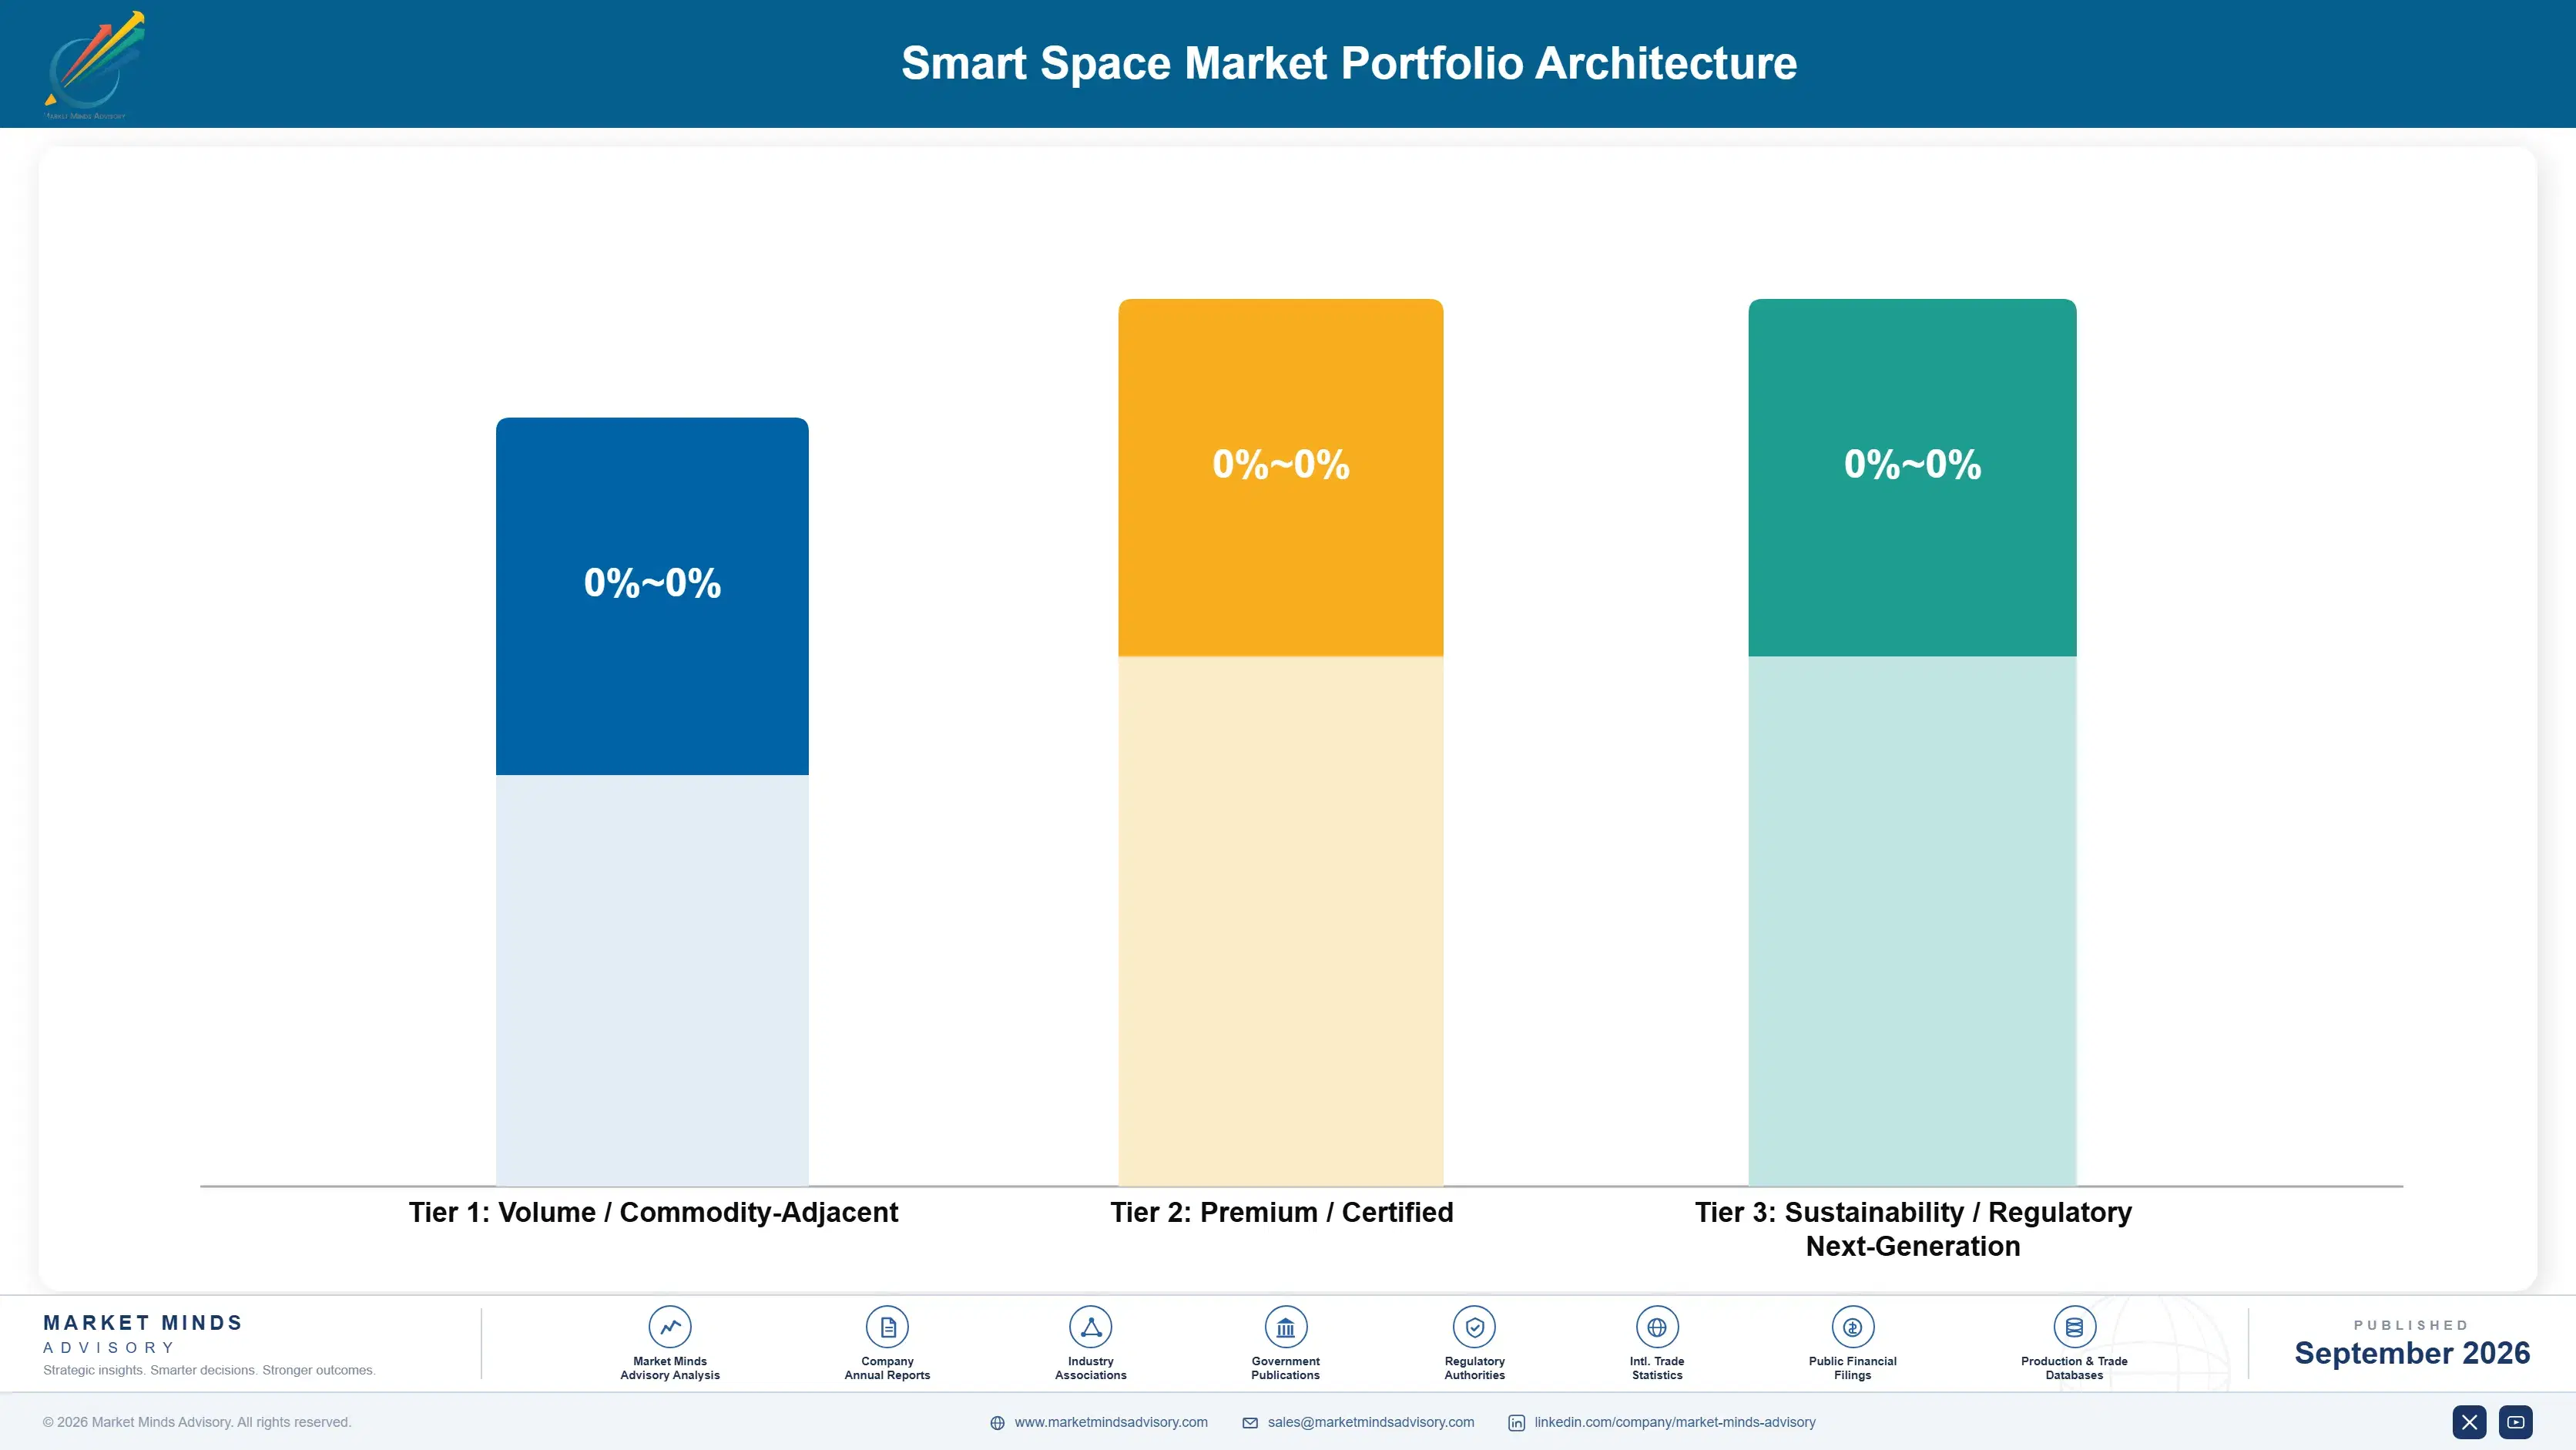
Margin separates by which budget pays. Environmental control and lighting hardware is bought by facilities against energy arguments on tight budgets, competed through contractors, and priced accordingly. Occupancy analytics supporting a lease decision is bought by corporate real estate against a return worth roughly 24 times the energy case, on a timetable that makes price a secondary consideration to whether the data arrives before the renewal date.
The volume against premium tension runs through the installed base. Hardware and controls revenue gives a vendor presence in the building, which is how the higher value analytics conversation eventually arises, so abandoning it forfeits the access. But it is sold to the wrong function on the wrong budget, and defending it consumes attention that reaching real estate buyers requires. Most incumbents are managing this the wrong way round.

High-value pools sit where a decision worth millions depends on the output: occupancy evidence supporting portfolio disposal, validated measurement that survives scrutiny, and integration layers underpinning landlord regulatory compliance. Each is bought by somebody who is not a facilities manager. The pools are smaller in installed volume and carry a disproportionate share of the profit available in this market.

Volume / Commodity-Adjacent

Lighting control and environmental sensing hardware sold through contractors into facilities budgets on energy arguments. Competed on price against comparable products, and the contractor rather than the vendor frequently holds the customer relationship.
Gross Margin: 24 to 34%

Premium / Certified

Access, identity and workplace experience platforms sold on subscription with employee adoption behind them. The 12 point range reflects how much integration each deployment requires and whether the vendor or an integrator performs it.
Gross Margin: 42 to 54%

Sustainability / Regulatory / Next-Generation

Occupancy analytics supporting lease decisions, validated measurement services and regulatory compliance integration for landlords. The 16 point range reflects how completely a million-pound decision changes what a buyer will pay for evidence.
Gross Margin: 52 to 68%
smart-spaces-market-portfolio-architecture-1788415828758

High-value Sub-segments and Strategic Watch-out

Portfolio Disposal Evidence Services

Supports decisions worth roughly 24 times the energy case, bought by corporate real estate on a lease timetable rather than a capital cycle. Price becomes secondary to whether the data arrives before the renewal date. Nothing else in this market prices against a decision this large.
Gross Margin: 56 to 68%

Validated Measurement And Audit

Barely exists today because buyers have not yet demanded it, and methods disagree by around 31 points on the same floor. The vendor that establishes credible accuracy first will shape the standard everyone else must meet. Buyers have not yet demanded it, and they will.
Gross Margin: 50 to 62%

Landlord Compliance Integration

Driven by regulation placing building automation and disclosure obligations on owners rather than occupiers, which is a harder sale and a considerably more durable one once the relationship has actually been established. Regulation rather than economics created this position entirely, which makes it unusually durable.
Gross Margin: 46 to 58%

Lighting And Environmental Hardware

Sold through contractors into facilities budgets against energy arguments that never fully convinced anybody. Necessary for building presence rather than attractive on returns, and the contractor usually owns the relationship. Building presence is the only genuine argument for holding it, and it is a real one.
Gross Margin: 24 to 34%

Who Signs Off The Building Spend

Annuity economics arrive from subscription analytics rather than from any hardware replacement cycle, since sensing installed today runs for a decade without further purchase. What renews is the data service, and it renews only while somebody is making decisions with it. Portfolios that completed rationalisation and settled on a footprint stop needing continuous measurement, which is a churn risk vendors selling into disposal programmes consistently understate to themselves.
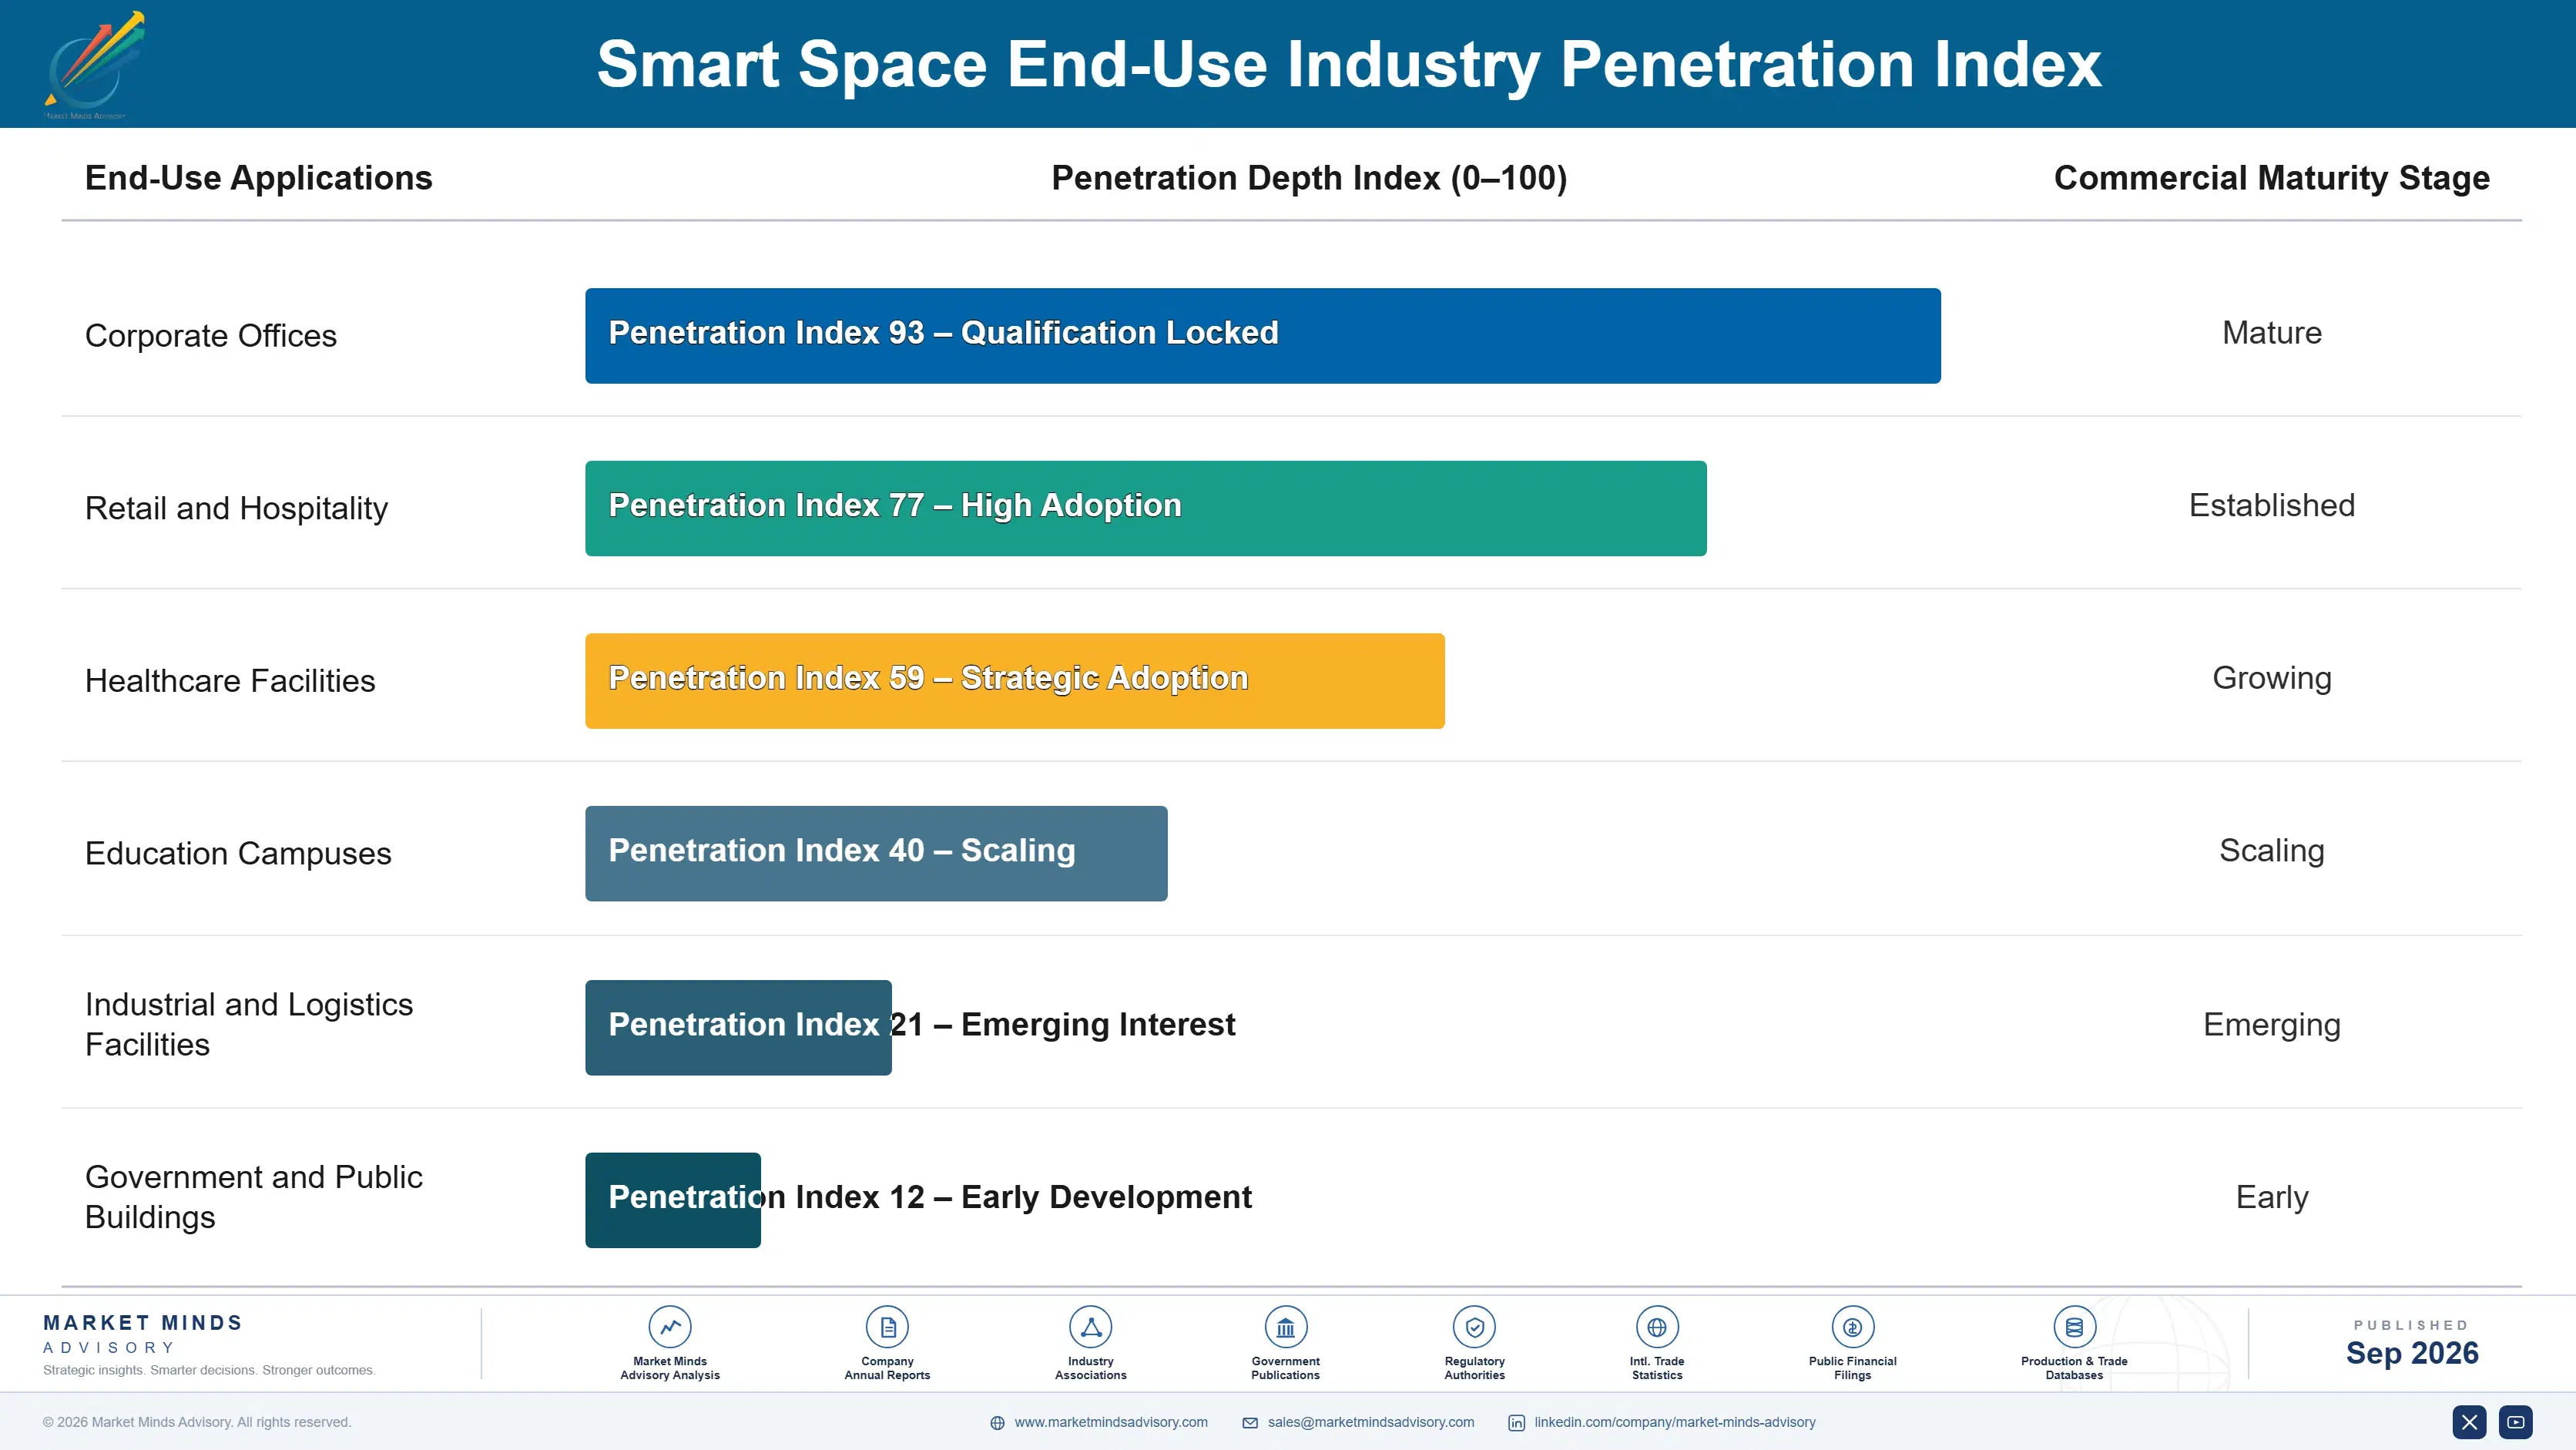
Adoption depth varies sharply by occupier type. Large corporate occupiers with professional real estate functions specify deeply, run validation and act on the data at portfolio scale. Mid-size occupiers buy workplace booking tools for employee convenience and discover the occupancy data afterwards. Landlords buy against regulatory obligation and want the minimum that demonstrates compliance, which is a completely different specification from anything an occupier requires.

The buyer profile has moved decisively and most of this industry has not followed. Purchasing sat with facilities and sustainability functions managing comfort and consumption. It now sits with corporate real estate directors evidencing lease decisions and, increasingly in Europe, with landlords meeting regulatory obligations. Both ask what a decision can be defended on rather than what a building can be tuned to.
smart-spaces-market-end-use-penetration-index-1788415829243

Where Vendors Should Compete

These are among the four positions where our research anticipates prominent divergence between winners and laggards over the coming forecast period. Each is grounded in the demand model, the regulatory perimeter, and the announced capacity pipeline.
01 / REAL ESTATE BUYER ACCESS

Call on the lease decision, not the facilities budget

A facilities manager buys occupancy sensing on a comfort or energy argument against a budget measured in tens of thousands, while a corporate real estate director buys the same equipment to evidence a lease decision worth millions. Releasing a floor is worth roughly twenty four times what the energy system saves in that same building over a year. The product barely changes and the budget changes by two orders of magnitude, yet most vendors still call on the smaller money.
02 / MEASUREMENT VALIDATION TIMING

Publish accuracy before a disposal decision is challenged

Occupancy methods measuring the same floor disagree by around thirty one points and no accuracy standard exists that a buyer could demand or a vendor could reasonably certify against, which this industry has quietly tolerated because nobody has asked yet. Somebody will ask, and probably when a floor disposal decision is challenged rather than during any competitive tender. A vendor that publishes validated accuracy against manual audit reaches buyers first and and shapes the standard that eventually follows for everybody.
03 / INTEGRATION AVOIDANCE STRATEGY

Route around the controls contractor wherever possible

Mapping building data points costs around USD 340 each through a controls contractor whose commercial interest runs directly against ever opening them, and a large building carries several thousand of those points in total. Wireless sensing that measures occupancy independently avoids that negotiation entirely and deploys inside a lease decision window rather than inside any construction programme at all. With fully 68% of all installations being retrofits, this is the majority case rather than any kind of unusual exception to it.
04 / DEPLOYMENT SPEED REQUIREMENT

Produce usable data inside weeks, not quarters

An occupier needs occupancy evidence before a lease renewal date rather than afterwards, which creates a hard commercial deadline that no facilities project has ever imposed on anyone in this industry. Implementations measured in quarters lose to those measured in weeks regardless of their eventual capability, because the decision gets taken anyway on whatever evidence is available at the time. Vendors architected around long integration programmes are simply being excluded on that basis alone, without ever learning the reason why.

Engagement Snapshot From the Field

A live engagement with an industry participant carrying material or product regulatory and market exposure ahead of a defining policy shift, showing how our research translates into a defensible multi-year portfolio strategy.
MARKET MINDS ADVISORY · CLIENT ENGAGEMENT SUMMARY
Smart Space Producer Strategic Portfolio Review and Transition Roadmap 2026·Investment Scenario on Smart Space Exposure Evaluation 2025-26
CLIENT PROFILE
A global professional services firm occupying leased office space across forty separate markets with annual revenue reported at approximately USD 7.8 billion (client-reported, unverified by MMA). Workplace technology had been procured locally by individual facilities teams against local energy and comfort objectives, and no consistent occupancy measurement existed anywhere across the whole portfolio at all.
STRATEGIC CHALLENGE
A substantial share of leases reached renewal within two years and the firm could not evidence how much space it actually used, so decisions were being taken on assumption. Local teams reported conflicting utilisation figures using different methods. Management had no basis for deciding which offices to keep, shrink or release.
MMA APPROACH
MMA compared occupancy measurement methods against manual audit in six representative offices, quantified the rent value at stake against the energy value the existing systems delivered, and assessed which deployment approaches could produce reliable data inside the lease decision windows the firm actually faced. Lease expiry timetables were mapped alongside.
KEY FINDINGS
  1. Badge, network and desk sensor methods disagreed by around 31 points on the same floors, and none had ever been validated against a manual count anywhere in the portfolio.
  2. Peak desk utilisation measured 43% against manual audit in the six offices assessed, well below every figure local facilities teams had been reporting to the centre.
  3. Rent at stake across the renewing portfolio was worth roughly 24 times the annual energy saving the existing building systems delivered across the same buildings.
  4. Integration through incumbent controls contractors would have cost around USD 340 per data point and taken far longer than the lease decision windows allowed for.
CLIENT PROFILE
A global professional services firm occupying leased office space across forty separate markets with annual revenue reported at approximately USD 7.8 billion (client-reported, unverified by MMA). Workplace technology had been procured locally by individual facilities teams against local energy and comfort objectives, and no consistent occupancy measurement existed anywhere across the whole portfolio at all.
STRATEGIC CHALLENGE
A substantial share of leases reached renewal within two years and the firm could not evidence how much space it actually used, so decisions were being taken on assumption. Local teams reported conflicting utilisation figures using different methods. Management had no basis for deciding which offices to keep, shrink or release.
MMA APPROACH
MMA compared occupancy measurement methods against manual audit in six representative offices, quantified the rent value at stake against the energy value the existing systems delivered, and assessed which deployment approaches could produce reliable data inside the lease decision windows the firm actually faced. Lease expiry timetables were mapped alongside.
KEY FINDINGS
  1. Badge, network and desk sensor methods disagreed by around 31 points on the same floors, and none had ever been validated against a manual count anywhere in the portfolio.
  2. Peak desk utilisation measured 43% against manual audit in the six offices assessed, well below every figure local facilities teams had been reporting to the centre.
  3. Rent at stake across the renewing portfolio was worth roughly 24 times the annual energy saving the existing building systems delivered across the same buildings.
  4. Integration through incumbent controls contractors would have cost around USD 340 per data point and taken far longer than the lease decision windows allowed for.
RECOMMENDED STRATEGY
Phase 1: Phase one: deploy validated wireless occupancy sensing in the twenty offices reaching renewal soonest, bypassing building systems integration work entirely. Phase 2: Phase two: move workplace technology procurement from local facilities teams to the corporate real estate function that actually holds the decision. Phase 3: Phase three: validate all measurement against manual audit annually so that disposal decisions can be defended if they are ever questioned.
OUTCOME
Within nine months the firm had measured twenty offices, released space in seven of them, and reported annual occupancy cost down 14% across the measured portfolio (client-reported, unverified by MMA). Measurement now runs centrally, and every disposal decision carries a proper audit trail behind it.

Frequently Asked Questions

Foundational context covering the market sizes, CAGR, scope, country, region and competition that inform every finding below. This section is provided to cover basics and most often pre-purchase conversations, answered from the MMA Primary Research Dataset.

What is the current size of the Smart Space Market?

The market was valued at USD 12.5 billion in 2025 and reaches USD 13.88 billion in 2026. Lease disposal economics rather than energy savings now drive most of the growth.

How large will the Smart Space Market be by 2036?

MMA forecasts USD 39.41 billion by 2036, an increase of USD 25.53 billion over the 2026 base. That represents an expansion multiple of 2.84 times.

What is the CAGR for the Smart Space Market 2026 to 2036?

The base case CAGR is 11.0%, with a bull case of 12.2% and a bear case of 9.8%. The historical rate between 2020 and 2025 was 9.8%.

Which segment is growing fastest?

Occupancy sensing and utilisation analytics grows at 16.5%, half again the market rate of 11.0%. It supports lease decisions worth many times any energy saving.

Who are the major companies in the Smart Space Market?

Honeywell, Johnson Controls, Siemens Smart Infrastructure, Schneider Electric and Signify lead on measured vendor revenue. Together they account for roughly 31% of a fragmented market.

Which country is growing fastest?

India grows fastest at 16.8%, on commercial office construction for global capability centres whose corporate parents specify connected systems as a matter of standing policy.

Report Segmentation Architecture

The full report scope spans multiple orthogonal segmentation dimensions, with cross-tabulated demand data provided for each dimension pair. Coverage extends further to regional breakdowns, trend trajectories, and the competitive detail needed to support segment-level decision-making.

By Building System Function

  • Lighting Control Systems
  • Heating Ventilation and Environmental Control
  • Access, Security and Identity
  • Occupancy Sensing and Utilisation Analytics
  • Workplace Experience and Booking Platforms
  • Digital Twin and Integration Layers

By End-Use Industry

  • Corporate Offices
  • Retail and Hospitality
  • Healthcare Facilities
  • Education Campuses
  • Industrial and Logistics Facilities
  • Government and Public Buildings

By Building Stage and Purchasing Party

  • New Construction Specification
  • Retrofit into Existing Stock
  • Occupier Procurement
  • Landlord and Owner Procurement
  • Systems Integrator Delivery
  • Subscription Analytics Services

By Region

  • East Asia
  • North America
  • Western Europe
  • South Asia and Pacific
  • Middle East and Africa
  • Latin America
  • Eastern Europe

Scope, Methodology, and Coverage

Every figure in this report is reproducible from documented input assumptions. The scope below maps the historical period, the forecast horizon, the segmentation dimensions, and the countries covered, alongside the underlying primary and qualitative methodology.
Historical Period
2020 to 2025
Forecast Period
2026 to 2036
Base Year
2025 (USD billions; MMA Primary Research Dataset, September 2026)
Market Definition
The smart space market covers connected sensing, control and analytics technology deployed in commercial and institutional buildings to manage environment, access and space use, spanning lighting control, heating ventilation and environmental control, access security and identity, occupancy sensing and utilisation analytics, workplace experience and booking platforms, and building digital twin and integration layers. Sizing is measured at vendor hardware, software and subscription revenue. Construction, mechanical plant, electrical distribution, furniture, facilities management services and residential systems are excluded.
Quantitative Units
USD billions at vendor hardware, software and subscription revenue, with supporting building counts and instrumented floor area by region
Segmentation Dimensions
Building system function, end-use industry, building stage and purchasing party, region
Regions Covered
East Asia, North America, Western Europe, South Asia and Pacific, Middle East and Africa, Latin America, Eastern Europe
Countries Covered
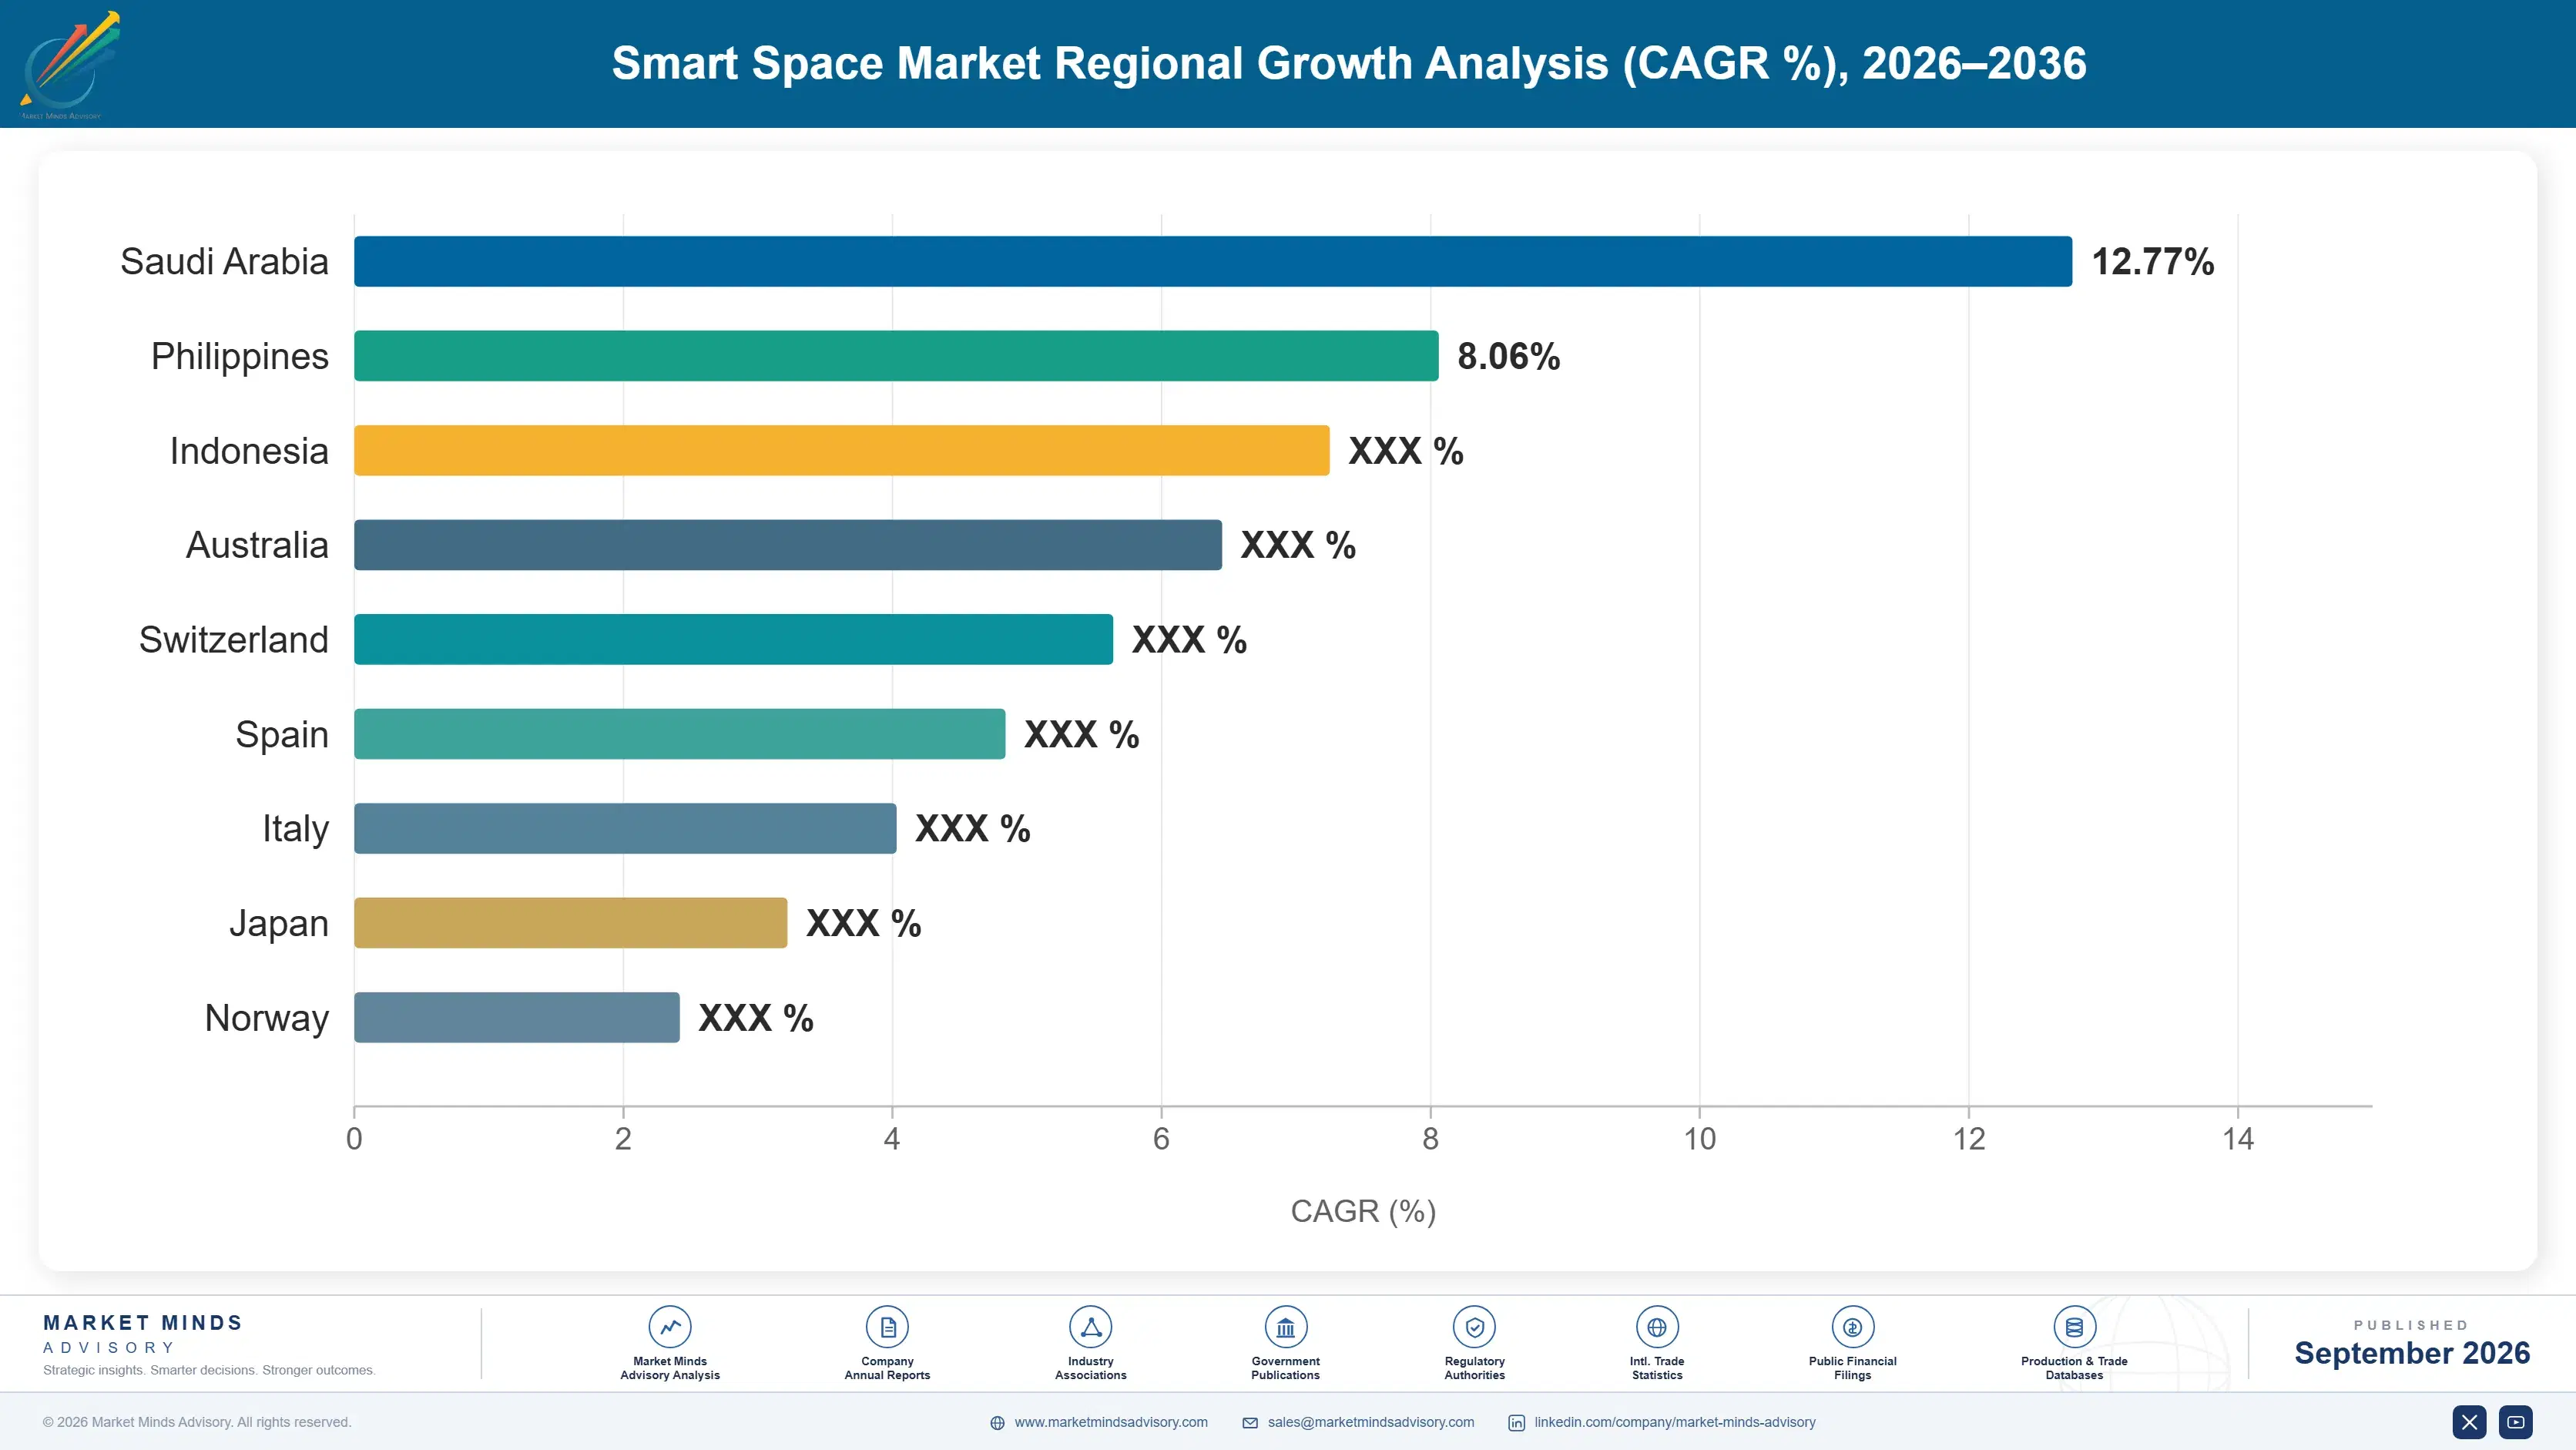
China, Japan, South Korea, Singapore, India, Australia, Vietnam, United States, Canada, Mexico, Brazil, United Kingdom, Germany, France, Netherlands, Poland, Saudi Arabia, United Arab Emirates
Key Companies Profiled
Honeywell, Johnson Controls, Siemens Smart Infrastructure, Schneider Electric, Signify, ABB, Carrier, Legrand, Lutron Electronics, Acuity Brands, Bosch Building Technologies, Cisco, Delta Controls, VergeSense, Density, Envoy, Spacewell, Planon, Willow, Mapped
Quantitative Methodology
Primary survey, n=3,800 respondents, Q4 2025, six countries; demand-side model with trade association cross-validation
Qualitative Methodology
47 expert interviews, Q4 2025; applied to validate demand model assumptions, identify emerging dynamics, and assess competitive positioning
Report Format
PDF and XLSX data workbook (Word format preview document)
Publisher
Market Minds Advisory
Report Code
MMA-2026-CON-571
Published
September 2026
Contact
sales@marketmindsadvisory.com | www.marketmindsadvisory.com

Purchase the full Smart Space Market Report (2026 to 2036).

The full report values this market against lease economics rather than energy savings, which is the reframing that explains why demand grew through a period when offices stood empty. It sizes six building system functions with individual growth rates, seven regions built from construction volume and portfolio decision activity, and the measurement variance that makes current occupancy evidence far weaker than buyers assume. Competitive analysis covers twenty vendors on a consistent revenue basis, with real estate buyer access and deployment speed treated as the decisive variables. Input cost modelling breaks out sensing, commissioning labour and integration exposure by deployment model.
Six building functions with individual growth rates
Lease disposal value compared against energy savings
Occupancy measurement methods benchmarked against manual audit
Integration cost per data point across building types
Twenty vendors on consistent revenue basis
Sensing, labour and integration cost exposure

Built For The People Who Decide

From boardroom strategy to bench-side execution, this report is read cover-to-cover by leaders shaping the next decade of their industry, turning demand scenarios, market dynamics and valuation benchmarks into decisions.
CXOs/ Presidents/ VPs/ Managers
M&A and Corporate Development
Strategy Teams and R&D Heads
Procurement and Product Directors
Regulatory and Compliance Leaders
Investor Relations and Equity Analysts