Market Minds Advisory
Smart Shopping Cart Market

Smart Shopping Cart Market: Smart Shopping Cart Market. Computer Vision Adoption Redraws Automated Checkout Standards.

Rapid computer vision advances and rising grocery labor cost pressure are pushing retail chains toward automated checkout smart carts at an accelerating commercial pace across major supermarket and warehouse club operations.

Lead Analyst

Published

September 2026

Make Smarter Decisions with Customized Research Insights

Request a free sample report and evaluate market opportunities, growth trends, and competitive dynamics relevant to your business needs.

2025 MARKET VALUE$0.5BMarket Size 2025
2036 FORECAST VALUE$2.7BBase Case , 2026 to 2036
CAGR 2026 TO 203617.5 %Bull 18.8% / Bear 16.2%
INCREMENTAL OPPORTUNITY$2.1BNet 10- year value creation
EXPANSION MULTIPLE5.02x2036 value over 2026 base
Strategic Levers
M&A Pipeline
Regional Outlook
Country Rankings
Competitive Intelligence
Segmental Deep-dive
Call-Us : 91 93563 13602

Executive Snapshot and Market Trajectory.

Grocery retailers are moving past pilot programs this year, committing real capital to fleet-wide smart cart rollouts as computer vision checkout accuracy finally crosses the threshold chains required before scaling past flagship stores into standard-format supermarket locations nationwide, a shift few vendors expected to happen this quickly.
Labor cost inflation and chronic staffing shortfalls at checkout lanes remain the primary commercial force behind adoption, with computer vision-based carts growing fastest as vendors bundle real-time promotions, loss-prevention alerts, and basket-level personalization into a single monthly subscription fee retailers can budget easily against existing store IT spend lines. North America leads deployment volume by a wide margin, anchored by Kroger, Walmart, and Amazon Fresh format expansion across large-format grocery and club stores nationwide.
Competitive intensity is rising as incumbent cart manufacturers add vision software mainly through partnerships rather than building it internally, while retailers negotiate multi-year hardware refresh cycles that lock in a single vendor across an entire store fleet for the contract term. Data privacy rules governing in-store biometric capture and continuous shopper tracking are starting to shape which vision architectures vendors can legally deploy across differing state and provincial jurisdictions.
Market Definition
The smart shopping cart market covers hardware and embedded software systems that enable automated item recognition, weighing, or scanning within a physical retail cart, including computer vision, RFID, and weight-sensor variants. It excludes standalone mobile scan-and-go apps that do not attach to a physical cart chassis, and excludes general warehouse robotics.
Base Year Value
$0.5B in 2025 (MMA Primary Research Dataset, September 2026)
Forecast Period
2026 to 2036, eleven discrete annual values
CAGR
17.5% base case. Bull 18.8%. Bear 16.2%.
Fastest Growth Segment
Computer Vision-Based Smart Carts: 22.0% CAGR
Fastest Growth Country
India: 19.5% CAGR
Fastest Growth Region
South Asia and Pacific: 19.5% CAGR
Largest Region
North America: 31% of 2025 global value
Market Leaders
Instacart Caper, Veeve, Zippin, Pensa Systems, Toshiba Global Commerce Solutions lead the field. Source: MMA Primary Research Dataset, July 2026.
Primary Survey
n=3,800 procurement and R&D decision-makers, Q4 2025, six countries
Methodology
Demand-side build-up, cross-validated against public data, 47 expert interviews

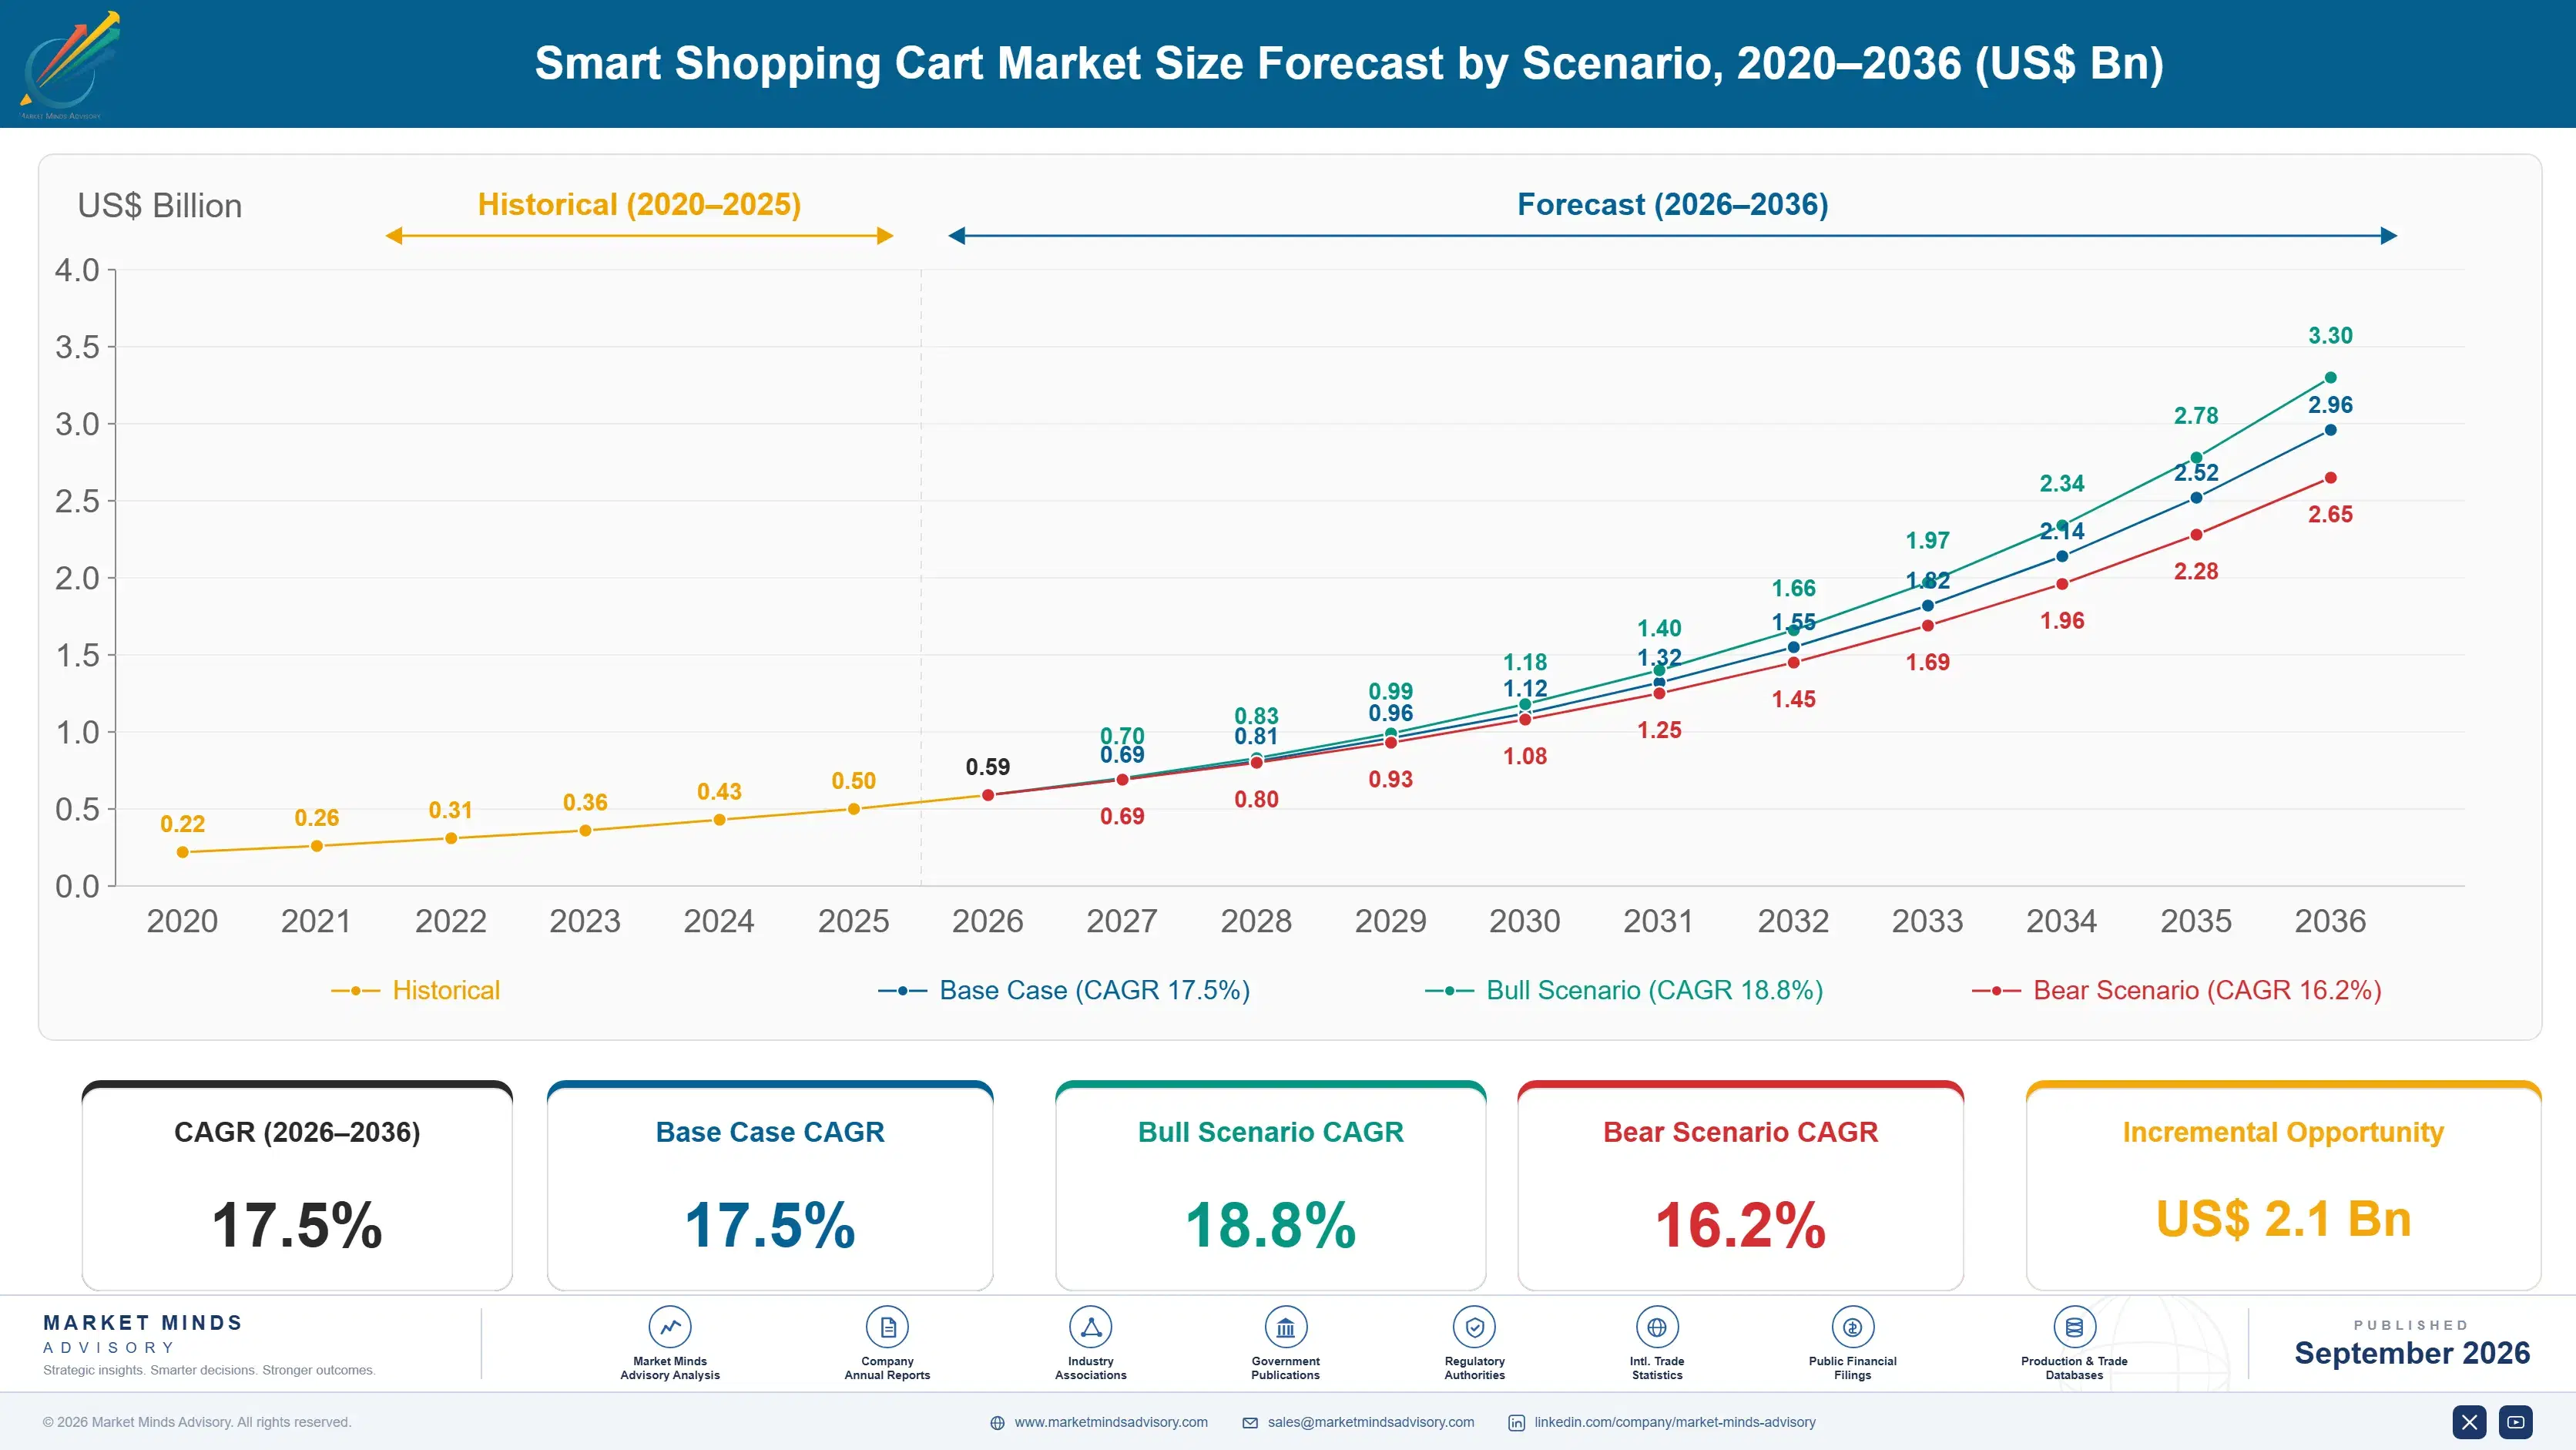
Smart Shopping Cart Market Forecast Scenarios

smart-shopping-cart-market-size-forecast-scenario-1788419252022
Between 2020 and 2025 the smart shopping cart category moved from single-store novelty pilots to multi-region commercial rollouts, as computer vision accuracy, sensor durability, and battery life all improved enough for daily heavy-duty retail use. Adoption stayed concentrated among large chains willing to absorb early hardware costs and integration risk, holding the historical annual growth rate near 16.3 percent through the period.
The base case assumes computer vision hardware costs keep falling roughly 8 percent a year, retailer procurement standardizes around two or three preferred vendors per format, and grocery labor shortages persist across large urban markets, pushing chains toward fleet-wide refresh cycles rather than isolated flagship pilots. These three mechanisms together sustain a forecast compound annual growth rate near 17.5 percent through 2036, with club and warehouse formats adding incremental volume alongside traditional supermarkets.
The bull case assumes major grocery banners commit to chain-wide refresh programs faster than currently planned, pushing growth toward 18.8 percent if computer vision accuracy gains keep outpacing regulatory friction across key states. The bear case assumes state-level biometric privacy restrictions slow deployment approvals meaningfully, capping growth near 16.2 percent as chains delay procurement decisions pending compliance clarity and legal review.

Vision Hardware Meets Recurring Software Economics

Retailer economics for smart carts hinge on a straightforward trade: hardware and subscription costs against measurable reductions in checkout labor hours and theft-related shrink. Chains running pilot fleets report meaningful throughput gains once staff redeploy from lanes to restocking and customer assistance duties across the sales floor, a shift store managers describe as immediately visible. Finance teams now track those savings as a standard line item in annual budget reviews.
MARKET CONCENTRATION44% CR5Top five suppliers hold under half installed units
AVERAGE SELLING PRICE$2,850 per unitVision-enabled cart hardware priced per fully equipped unit
TOP DEPLOYING COUNTRY SHARE38%United States accounts for largest single-country installed base
FLEET UTILIZATION RATE71%Share of deployed carts in active daily store rotation
HARDWARE COST SHARE58%Vision sensors and processing units dominate unit cost
REPLACEMENT CYCLE LENGTH6 yearsAverage years before chains retire cart hardware chassis
Vendor concentration remains moderate, with the top five suppliers controlling under half of installed units, leaving room for regional integrators to win contracts through service and financing terms rather than hardware specification alone. Cart-as-a-service financing models are spreading quickly because they let smaller grocery chains avoid large upfront capital outlays entirely while still testing fleet-wide deployment against real store traffic.
Replacement cycles run longer than typical consumer electronics because carts endure heavy daily physical use outdoors and in cold storage aisles, meaning vendors compete as much on durability and service contracts as on vision accuracy. Chains increasingly demand modular sensor packages that can be upgraded without replacing the entire cart chassis, extending useful equipment life well beyond initial contract terms and lowering total ownership cost.
"Retailers keep underestimating how much of this category's value sits in the subscription software, not the cart itself. The chains that treat vision carts as a data platform rather than a checkout gadget will capture most of the margin over the next decade."
Lead Analyst, Retail Technology Practice · MMA Technology Practice · September 2026

Market Trends

Vision Accuracy Gains Push Full Fleet Rollouts

Computer vision item-recognition accuracy crossed 98.5 percent in leading commercial deployments during 2025, clearing the threshold most grocery chains had set before approving fleet-wide rollouts beyond flagship pilot stores. Retailers had spent several years testing smaller batches while accuracy hovered near 94 to 96 percent, a range too error-prone for unattended checkout. Vendors closed the remaining gap using larger training datasets pulled from actual store traffic rather than lab conditions, and chains report shrink reductions of roughly 30 percent once carts replace a meaningful share of staffed lanes across a store's daily throughput.
Market Impact: Vacancy near 12 percent drives urgency
Cart-as-a-Service Financing Steadily Lowers Chain Adoption Barriers

Vendors increasingly offer cart-as-a-service financing, replacing large upfront hardware purchases with a per-cart monthly fee that bundles maintenance, software updates, and hardware refresh into one predictable line item. This model has let mid-size regional chains with fewer than 200 stores enter the category for the first time, since capital budgets that could not absorb a seven-figure hardware order can approve a recurring operating expense instead. Roughly 40 percent of new fleet contracts signed in 2025 used this financing structure rather than outright purchase, according to primary vendor interviews conducted this year.
Market Impact: Adds 18 dollars monthly media revenue

Market Opportunities and Growth Drivers

Grocery Labor Shortages Accelerate Checkout Automation Demand

Persistent staffing shortfalls at grocery checkout lanes, running near 12 percent vacancy rates across large chains in 2025, are pushing operations leaders to treat smart carts as a staffing solution rather than a novelty feature. Each fully deployed vision cart fleet lets a mid-size store reassign three to four former checkout staff to restocking and customer service roles, improving both labor utilization and measured customer satisfaction scores. Chains facing the tightest local labor markets are moving fastest, often approving fleet contracts within two budget cycles instead of the previous three-year evaluation timeline.
Market Impact: Compliance delays add 6 months

Basket Personalization Drives New Retail Media Revenue

Smart carts double as an in-store retail media channel, letting brands bid for placement on cart screens tied to a shopper's real-time basket contents rather than generic aisle signage. Early chain deployments report retail media revenue per cart averaging 18 dollars a month, a figure that materially improves the payback period on hardware and subscription costs. This revenue stream is drawing consumer packaged goods brands into direct commercial negotiations with cart vendors, a dynamic that barely existed two years ago and now actively shapes vendor product roadmaps and screen placement decisions.
Market Impact: Integration costs exceed 12 months subscription

Market Restraints and Challenges

Biometric Privacy Rules Slow Vendor Deployment Approvals

State-level biometric privacy statutes, most notably in Illinois and expanding to several other states in 2025, require explicit shopper consent before cart cameras can process facial or gait data, even when discarded immediately after item recognition. The root cause is that most vision architectures were built for accuracy first, with consent workflows bolted on afterward, creating legal exposure chains are reluctant to accept without clear guidance. Vendors are responding by shifting toward edge processing that discards biometric data on-device within milliseconds, a mitigation path several major suppliers now market as a standard compliance feature.
Market Impact: Accuracy gains cut shrink 30 percent

High Upfront Integration Cost Deters Smaller Chains

Beyond the recurring subscription fee, chains face substantial one-time integration costs tied to point-of-sale connectivity, in-store wifi density upgrades, and staff retraining, which together can exceed the first year of subscription payments combined. The root cause is that most store networks were never designed for dozens of continuously connected vision-enabled devices operating simultaneously across a single retail floor. This discourages chains under roughly 50 stores from committing to full fleets, and vendors are mitigating the friction by offering phased rollout financing that spreads integration cost across the first eighteen months of a contract term.
Market Impact: 40 percent of contracts now subscription-based
3 additional market trends, 2 additional growth drivers, and 3 additional restraints and challenges are covered in the full report. Contact sales@marketmindsadvisory.com to access the complete intelligence.

Segment CAGR and Growth Architecture

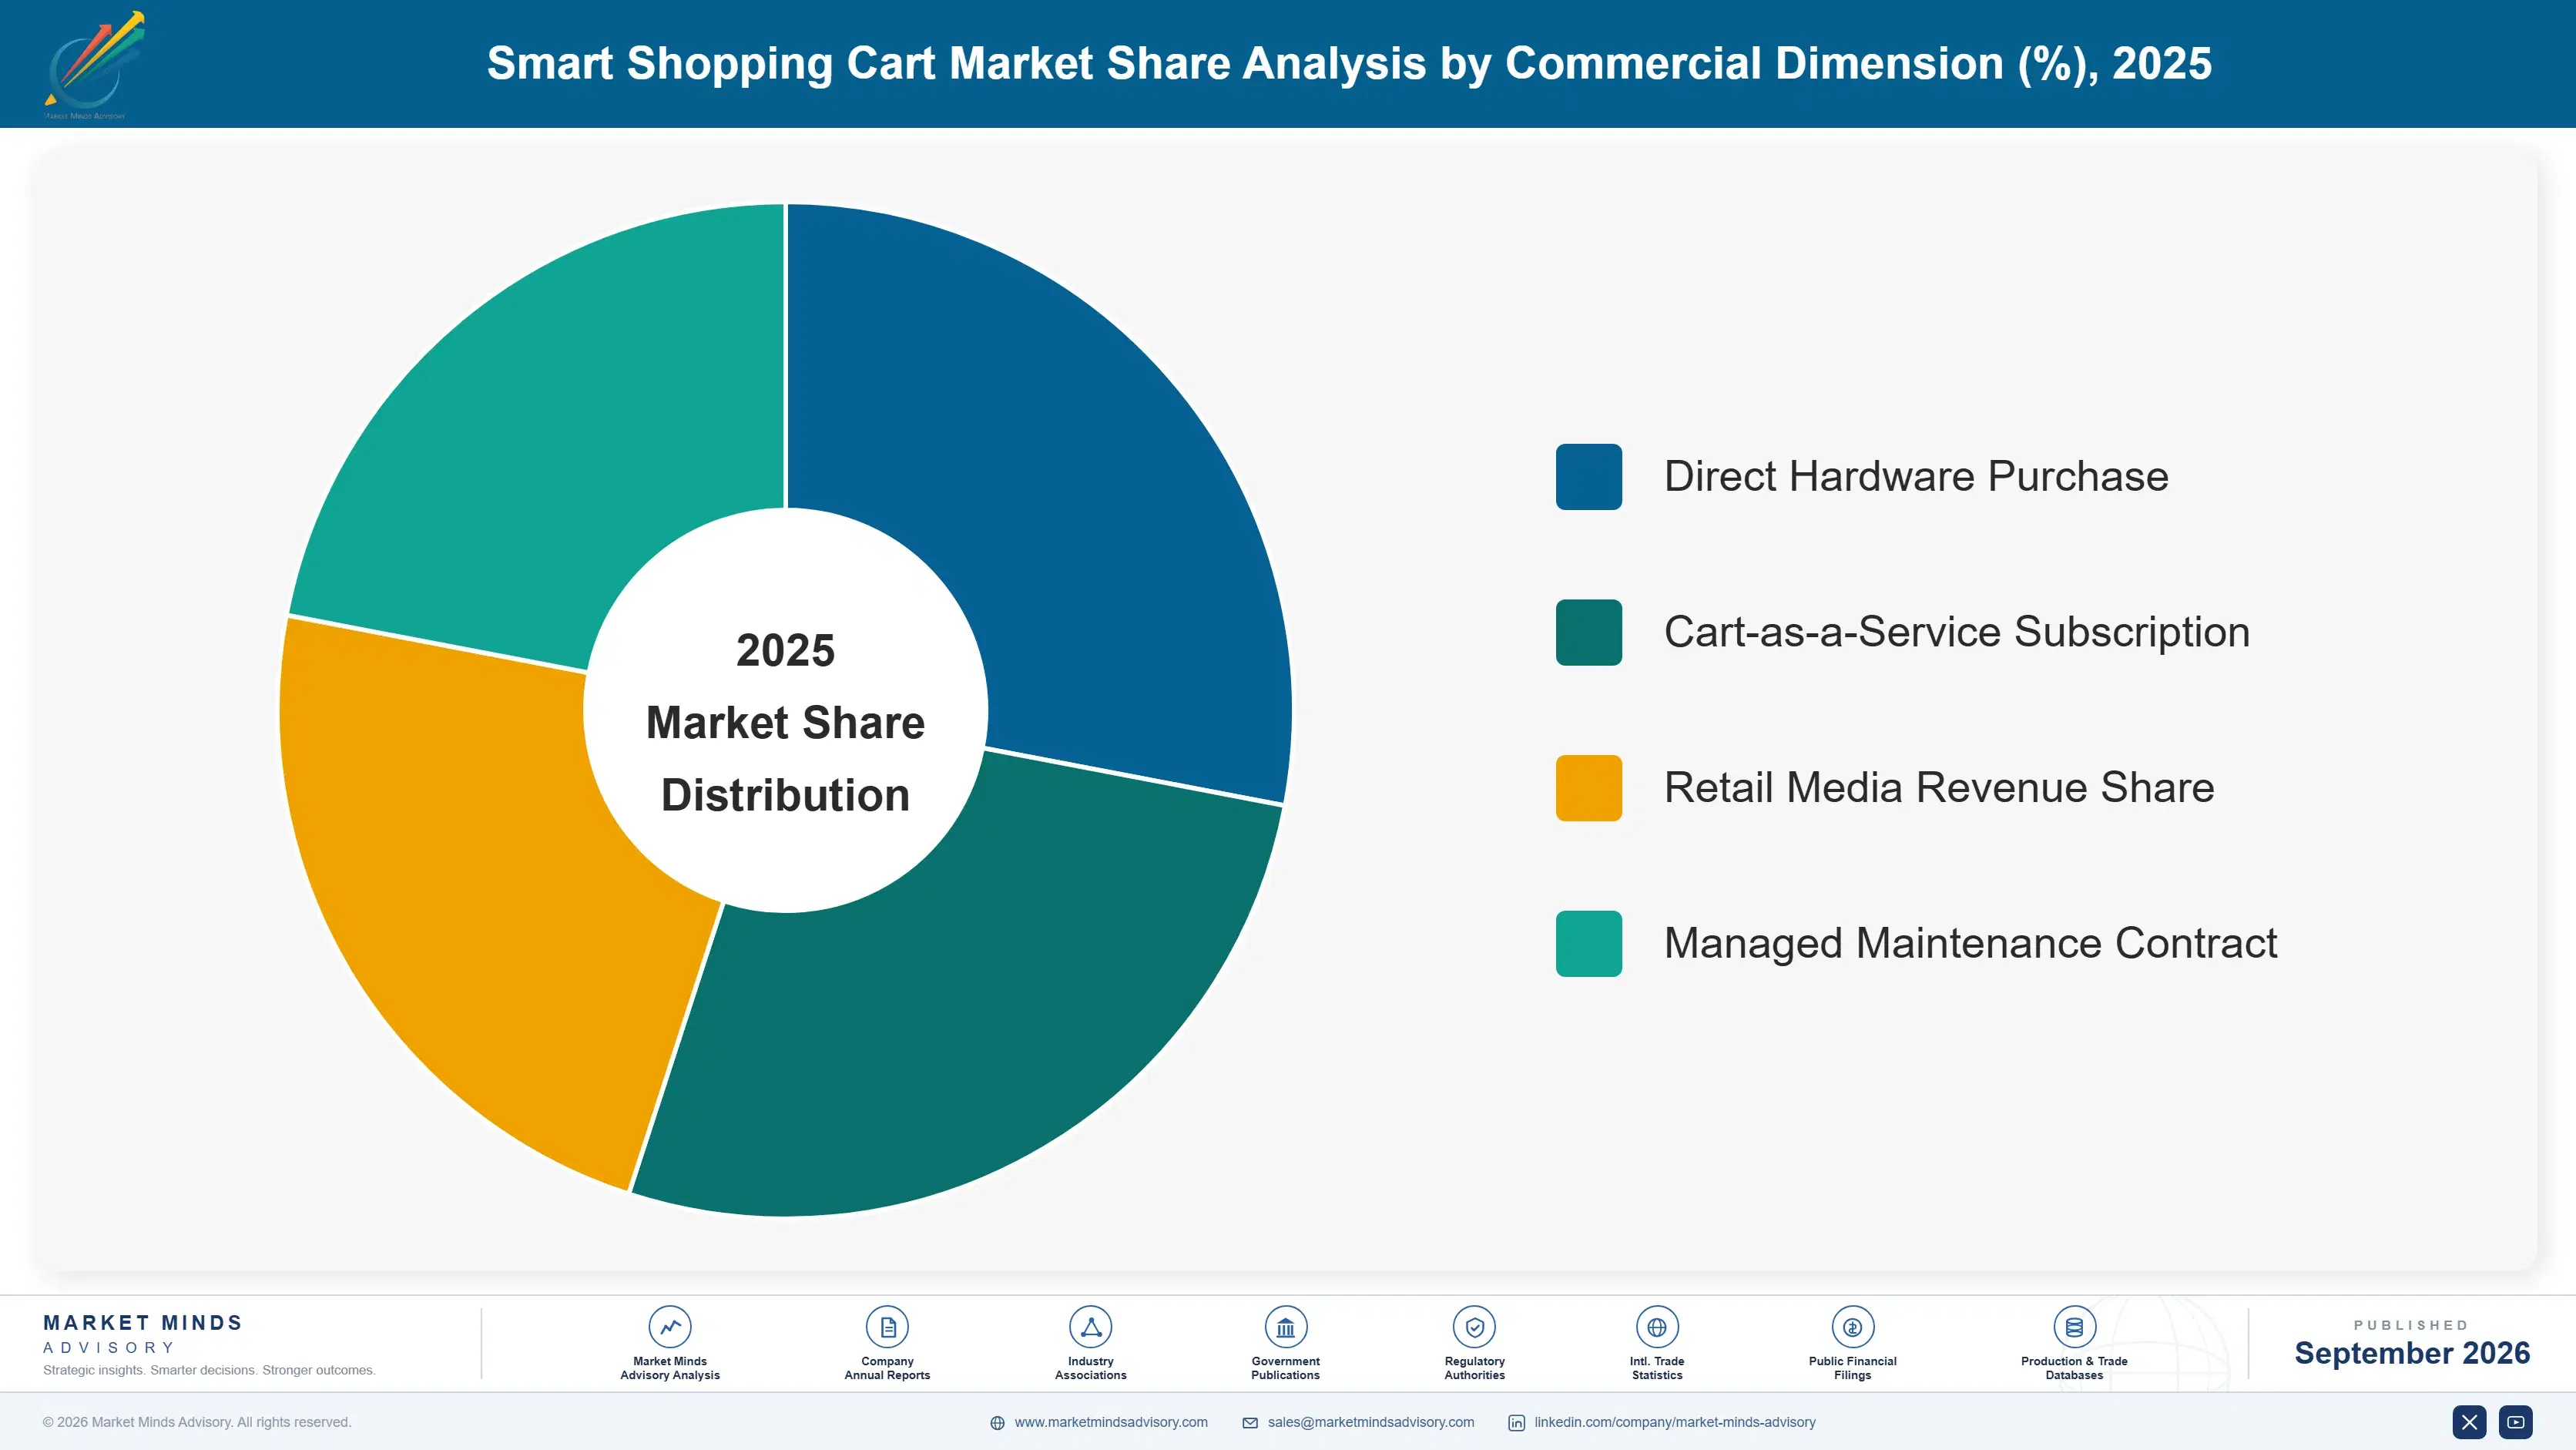
Smart shopping carts segment by the core technology used for item recognition and checkout automation, spanning computer vision, RFID tagging, weight-sensor scales, self-checkout basket systems, cart-mounted navigation and signage software, and loyalty or personalization software layers that support the automated checkout workflow inside a single physical retail cart chassis across store formats. each evaluated separately.
smart-shopping-cart-market-market-share-analysis-1788419252553

Computer Vision-Based Smart Carts

Computer vision-based carts use onboard cameras and edge processors to identify items visually as shoppers place them in the basket, eliminating the need for barcode scanning or RFID tags on individual products. This segment is growing fastest because it requires no packaging changes from consumer goods manufacturers, unlike RFID, which needs a tag embedded on every unit sold. Vendors have pushed recognition accuracy above 98 percent for common grocery items, closing the gap that previously limited deployment to pilot stores. Retailers favor this approach because it scales across an entire product catalog without negotiating tagging programs with hundreds of suppliers. Chains report the shortest payback period on this segment among all six categories tracked.
CAGR 22.0%

RFID-Enabled Carts

RFID-enabled carts read tags embedded in product packaging as items pass through an antenna zone built into the cart frame, offering near-perfect read accuracy once tagging programs are fully in place across a supplier base. Adoption concentrates in categories with high per-unit value, particularly premium packaged goods and pharmacy items, where tagging cost is easily justified against measured shrink reduction over a full fiscal year. Growth trails computer vision because tagging requires supplier cooperation and packaging line changes that take years to roll out fully across an entire catalog. Several major manufacturers have committed to source tagging pilots in 2025, expanding the addressable catalog meaningfully over the next two years.
CAGR 19.0%
Full segment breakdown across 7 segments available in the complete report.

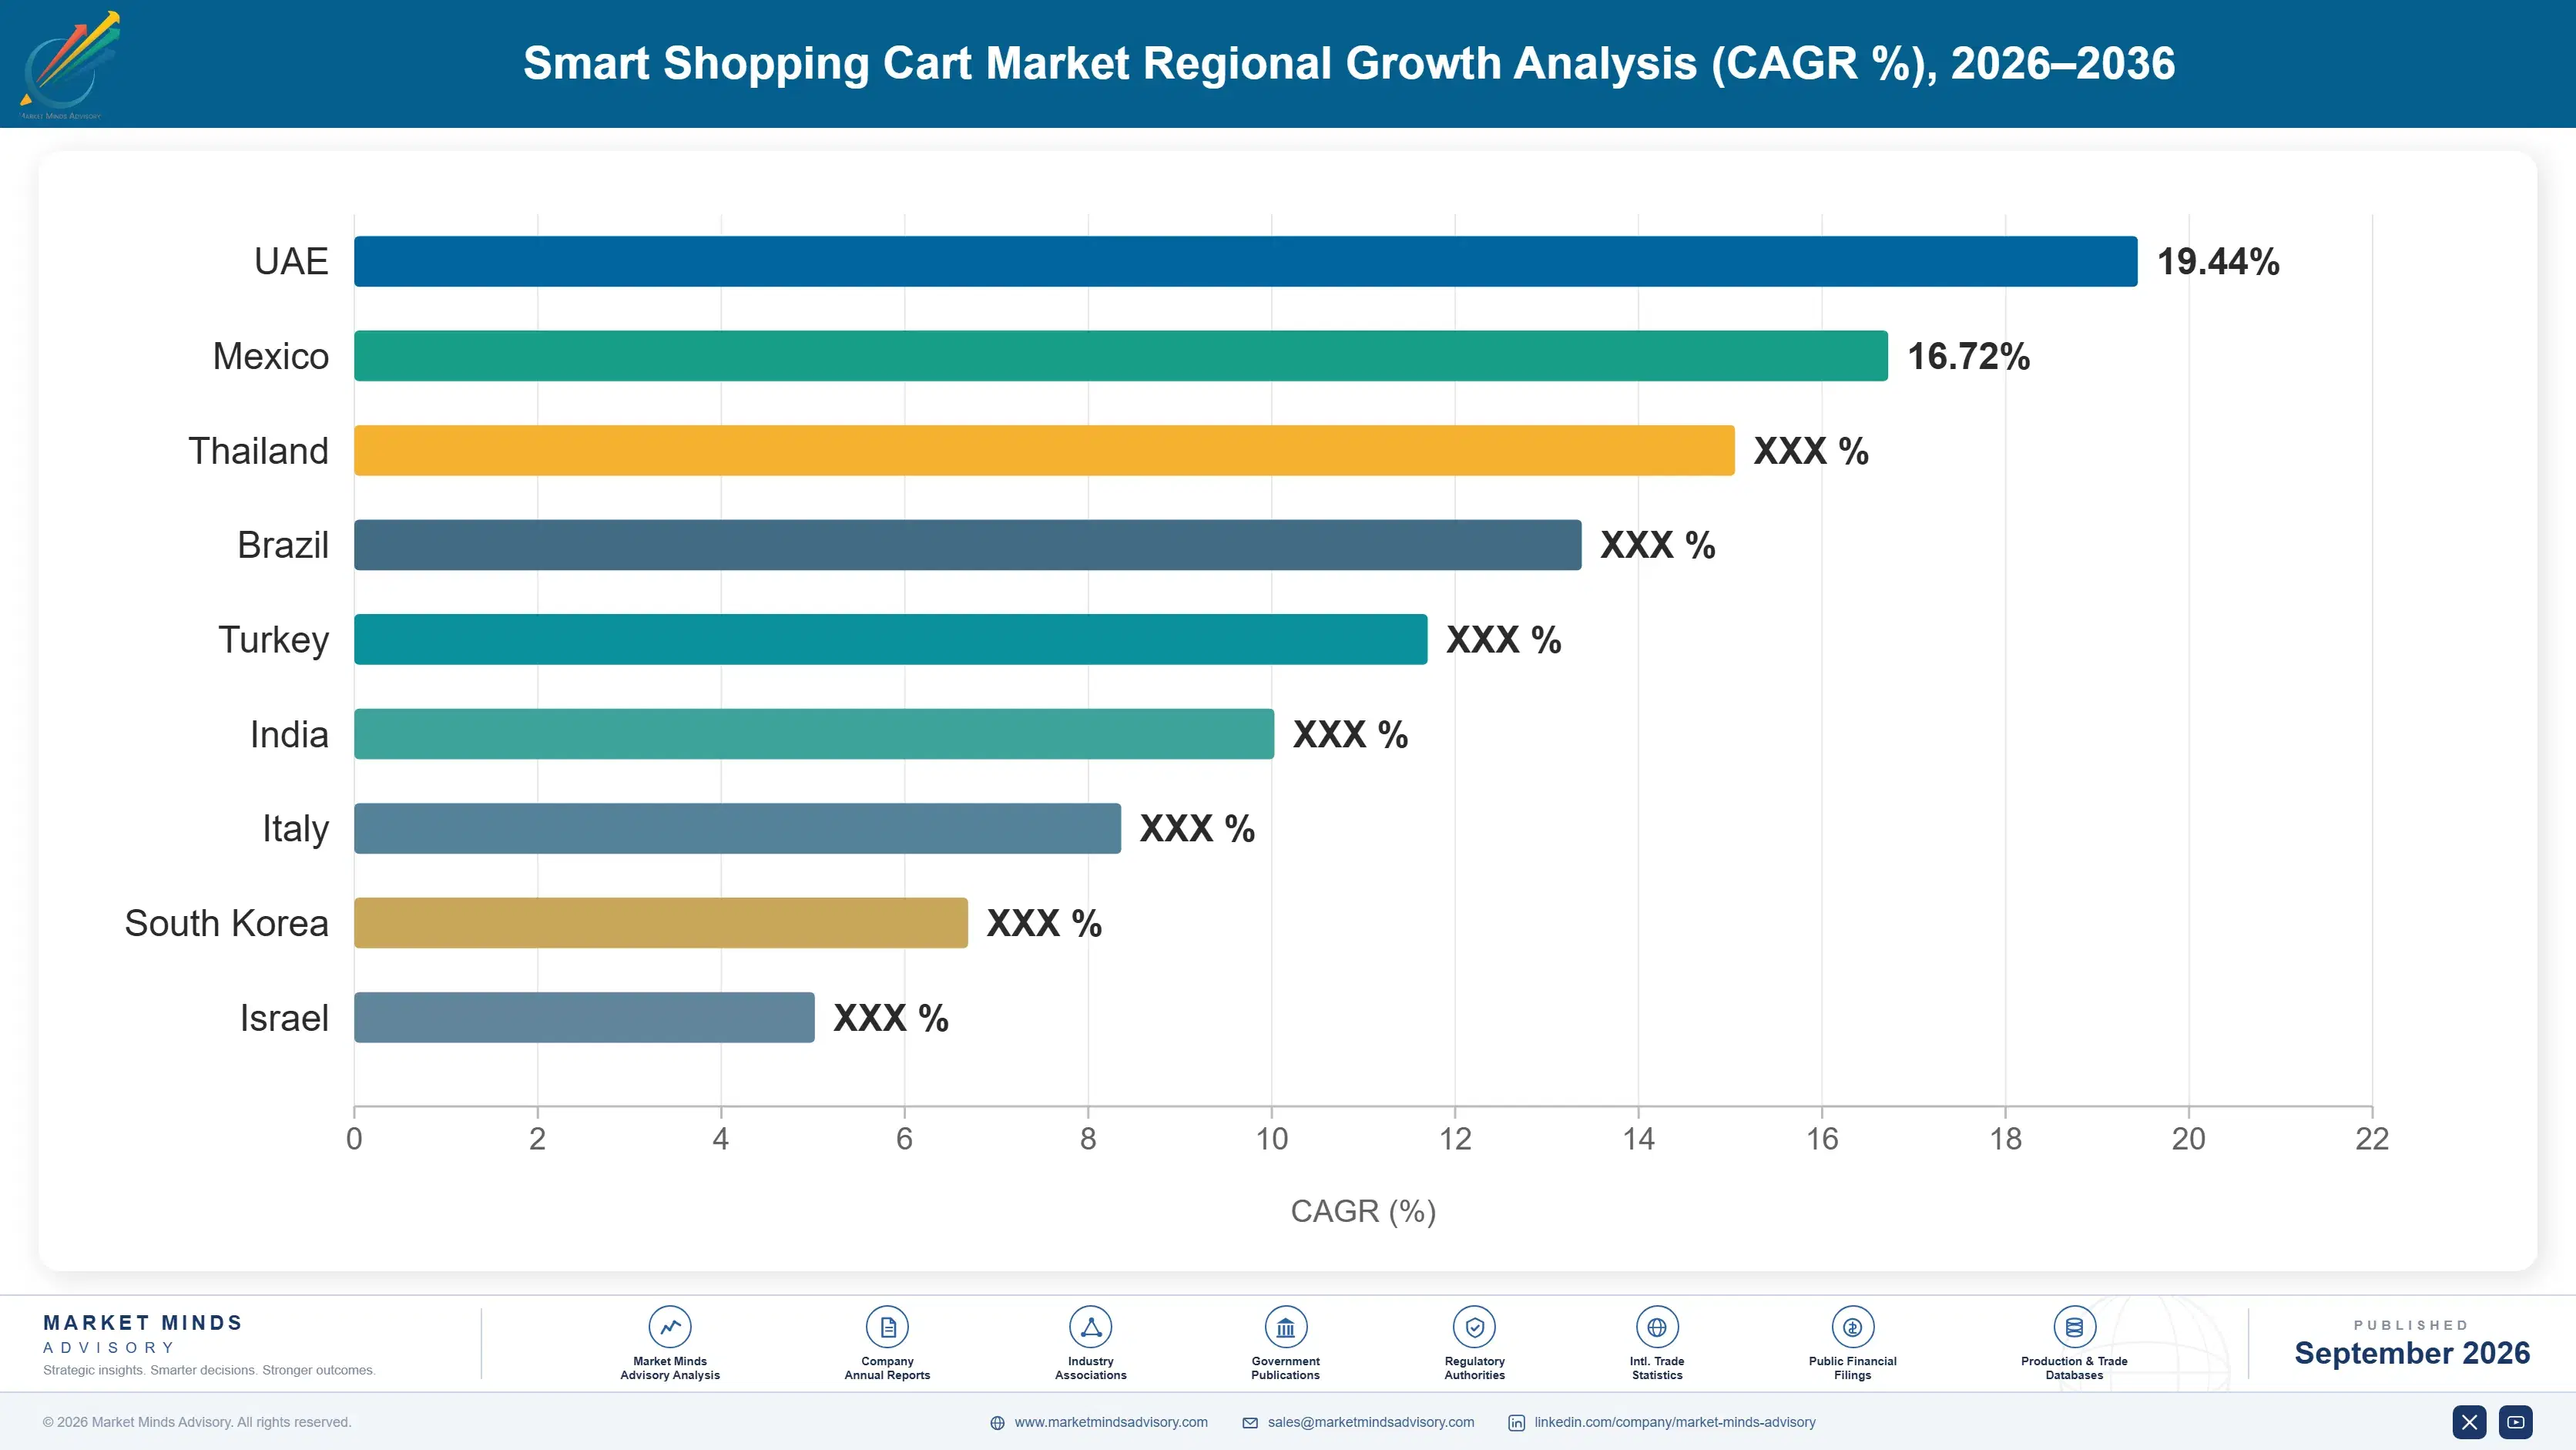
Regional Architecture and Country Demand Map

North America leads deployment volume on major grocery chain scale and early hardware commitment, while East Asia and Western Europe follow closely behind on retail modernization spending, with South Asia and Pacific posting the fastest regional growth rate off a considerably smaller current installed base of deployed carts.

North America

Kroger, Walmart, and Amazon Fresh together operate the largest deployed smart cart fleet of any region, having moved past pilot phases into standard-format store rollouts across most major metropolitan markets. Grocery labor cost inflation and persistent checkout staffing shortfalls give US chains the strongest commercial incentive to commit capital quickly, and several regional banners have followed the majors into procurement decisions this year. Canada trails the United States in deployment scale but follows a similar adoption curve through its own major grocery banners. Vendor headquarters concentration in this region also shortens integration timelines, since most major suppliers maintain primary engineering operations domestically. Financing structures here let mid-size regional banners join without heavy balance sheet strain.
Share: 31% | CAGR: 18.5% (2026 to 2036)

Western Europe

Retail modernization spending across German, French, and British supermarket chains supports the region's second-largest installed base, though data privacy rules under GDPR meaningfully shape which vision architectures vendors can legally deploy in-store. Chains here favor RFID and weight-sensor variants over pure computer vision more than any other region, partly to sidestep biometric data handling questions entirely. Germany's discount grocery format, led by chains competing heavily on operating cost, has emerged as an unexpectedly strong adopter given the labor savings involved. The region's growth rate trails North America and East Asia because integration costs run higher under stricter compliance obligations. Consumer trust concerns around in-store cameras also slow rollout pace here.
Share: 22% | CAGR: 16.0% (2026 to 2036)
Regional intelligence for 5 additional markets available in the complete report: East Asia, South Asia and Pacific, Latin America, Middle East and Africa, Eastern Europe. Contact sales@marketmindsadvisory.com.
smart-shopping-cart-market-country-cagr-analysis-1788419253066

Where Smart Cart Vendor Margins Actually Concentrate

Vendor profitability increasingly concentrates in recurring software and data revenue rather than one-time hardware sales, as chains renegotiate contracts to bundle analytics, retail media placement, loyalty integration, and predictive maintenance into a single monthly fee that grows steadily larger across the contract term. Layered fee structures now separate leading vendors from pure hardware suppliers.

Bundling Retail Media Placement Into Cart Screens

Vendors that add retail media auction capability to cart display screens capture an incremental revenue stream directly from consumer packaged goods brands rather than solely from the retailer relationship. This shifts vendor economics from a pure hardware margin model toward a data and advertising platform model with materially higher gross margin potential. Early adopters report retail media revenue averaging 18 dollars per cart monthly, often exceeding the underlying hardware margin within eighteen months of deployment. Vendors that move fastest into this lever are winning renewal negotiations even when competitors quote lower base subscription pricing.
Market Impact: Adds up to 18 dollars monthly per cart

Extending Contracts Through Predictive Maintenance Services

Offering predictive maintenance as a paid add-on, using sensor telemetry to flag battery and wheel-bearing failures before carts go out of service, lets vendors extend average contract length and reduce customer churn at renewal. Chains value this because unplanned cart downtime directly reduces checkout throughput during peak shopping hours, a cost retailers weigh heavily against the modest monthly service fee involved. Vendors offering this service report renewal rates nearly 15 percentage points higher than those without it, turning what was once a pure hardware relationship into a longer, stickier managed service contract that competitors struggle to displace.
Market Impact: Lifts contract renewal rates by 15 full points

Charging Suppliers For Shelf Compliance Analytics

Vendors can sell packaged goods manufacturers access to anonymized basket-composition analytics showing which promotional placements actually drive incremental purchases, a data product retailers themselves rarely have the analytics staff to build internally. This creates a three-way commercial relationship where the vendor sits between retailer and supplier, collecting a fee from each side of the transaction rather than just one. Early pilots with major consumer goods manufacturers show suppliers willing to pay roughly 9 percent above initial vendor pricing assumptions, since the data closes a measurement gap traditional point-of-sale reporting cannot address at the individual basket level.
Market Impact: Supplier analytics fees add 9 percent margin here

Upselling Loyalty Integration For Deeper Personalization

Vendors that integrate cart software directly with a retailer's existing loyalty program can charge an incremental fee for real-time personalized offer delivery tied to purchase history, rather than generic promotions shown to every shopper regardless of profile. This deepens the switching cost for retailers considering a competing vendor at contract renewal, since loyalty integration work would need to be rebuilt entirely with a new supplier. Chains report basket sizes roughly 7 percent higher when personalized offers appear on cart screens compared to static promotional signage, giving vendors leverage in renewal pricing conversations.
Market Impact: Raises basket size roughly 7 percent per trip

Who Controls the Margin Pool

Competitive concentration sits at a moderate 44 percent CR5, well short of an oligopoly structure, leaving room for regional integrators to win contracts on service quality rather than brand recognition. Participants are evaluated here on installed cart unit count, the most commercially consistent basis across vendors of very different sizes. The gap between the leader and the fifth challenger stays narrow, unlike mature categories where one vendor dominates unit share.
Current activity centers on financing innovation, as vendors race to offer cart-as-a-service subscriptions that lower the capital barrier for mid-size chains previously locked out entirely. Several vendors have also begun bundling retail media capability into cart screens, turning a hardware sale into an advertising negotiation involving consumer packaged goods brands. Partnership announcements with point-of-sale providers have accelerated recently as vendors seek faster integration paths.

Emerging pressure is coming from point-of-sale incumbents like NCR Voyix and Diebold Nixdorf, adding vision capability to existing terminal relationships rather than building standalone cart hardware. This threatens pure-play vendors lacking a retailer footprint to expand from. Rankings are most likely to shift as retail media revenue becomes a larger share of vendor economics, favoring companies with stronger data science capability over pure hardware engineering strength.
smart-shopping-cart-market-company-positioning-matrix-1788419253590

Competitive Moat and Risk Dimensions

INSTACART CAPER

Moat: Deep Grocery Chain Relationships

Instacart Caper's parent company already maintains relationships with hundreds of grocery banners through its delivery and e-commerce platform, giving the cart hardware division a warm introduction path standalone competitors lack. This existing account relationship shortens sales cycles meaningfully and gives negotiating leverage during renewal discussions that newer entrants without an established retailer footprint cannot match.
INSTACART CAPER

Risk: Execution Dependent On Parent Priorities

Because the cart hardware unit sits inside a much larger e-commerce parent, capital allocation and engineering priority decisions are made relative to the parent's broader strategic goals rather than the cart business alone. A shift in corporate focus toward delivery logistics could starve the hardware division of resources precisely when competitors accelerate vision accuracy and fleet expansion plans.
VEEVE INC

Moat: Purpose Built Vision Engineering Team

Veeve was founded specifically to solve cart-based computer vision rather than adapting general retail technology, giving its engineering team a narrower but deeper focus than competitors managing broader hardware lines across multiple retail categories. This specialization shows up in faster iteration cycles on recognition accuracy, a metric retailers weigh heavily during vendor selection. This depth continues expanding.
VEEVE INC

Risk: Limited Balance Sheet For Scale

As a venture-funded specialist without a large parent balance sheet, Veeve faces real constraints financing the working capital needed for rapid fleet-wide hardware rollouts across dozens of large grocery chains simultaneously. Competitors backed by larger parent companies or point-of-sale relationships can offer more generous financing terms, a disadvantage that grows more pronounced as deal sizes increase.

Players Tracked

Prominent Players

Instacart Caper
Veeve Inc
Zippin Corporation
Pensa Systems
Toshiba Global Commerce Solutions

Other Key Players

Focal Systems
AiFi Inc
Diebold Nixdorf
NCR Voyix
Grabango
Shopic
Imagr
Trigo Vision
Wanzl GmbH
Caper AI
Cust2Mate
CartTrack Solutions
SES-imagotag
Retail Business Services
Aila Technologies

Recent Developments

MARCH 2026

Zippin Signs Regional Grocery Chain Fleet Deal

Zippin Corporation announced a new supply agreement with a major regional grocery chain in the northeastern United States to deploy computer vision smart carts across roughly 60 stores over an eighteen-month rollout period, including ongoing subscription and maintenance services bundled into a single monthly fee.
Signal: Signals regional grocery chains are now committing to fleet-wide rollouts that extend well beyond flagship pilot store locations.
NOVEMBER 2025

Toshiba Acquires Vision Recognition Startup

Toshiba Global Commerce Solutions formally acquired a smaller computer vision startup specializing in shelf-edge recognition technology, adding item-detection capability to its existing point-of-sale hardware portfolio and strengthening its ability to compete against pure-play cart vendors by bundling vision technology with its already-installed checkout terminal base.
Signal: Signals point-of-sale incumbents are building vision capability through acquisition rather than slower internal development or partnership deals.
JANUARY 2026

Veeve Announces Retail Media Partnership With Consumer Brand

Veeve Inc announced a new partnership with a major consumer packaged goods brand to pilot targeted retail media placements on cart screens across roughly 25 stores in a single metropolitan test market, ahead of a planned wider national rollout across several additional grocery chains next year.
Signal: Signals vendors are moving quickly to monetize retail media before rivals establish similar exclusive brand partnerships.

Vision Hardware Component Exposure

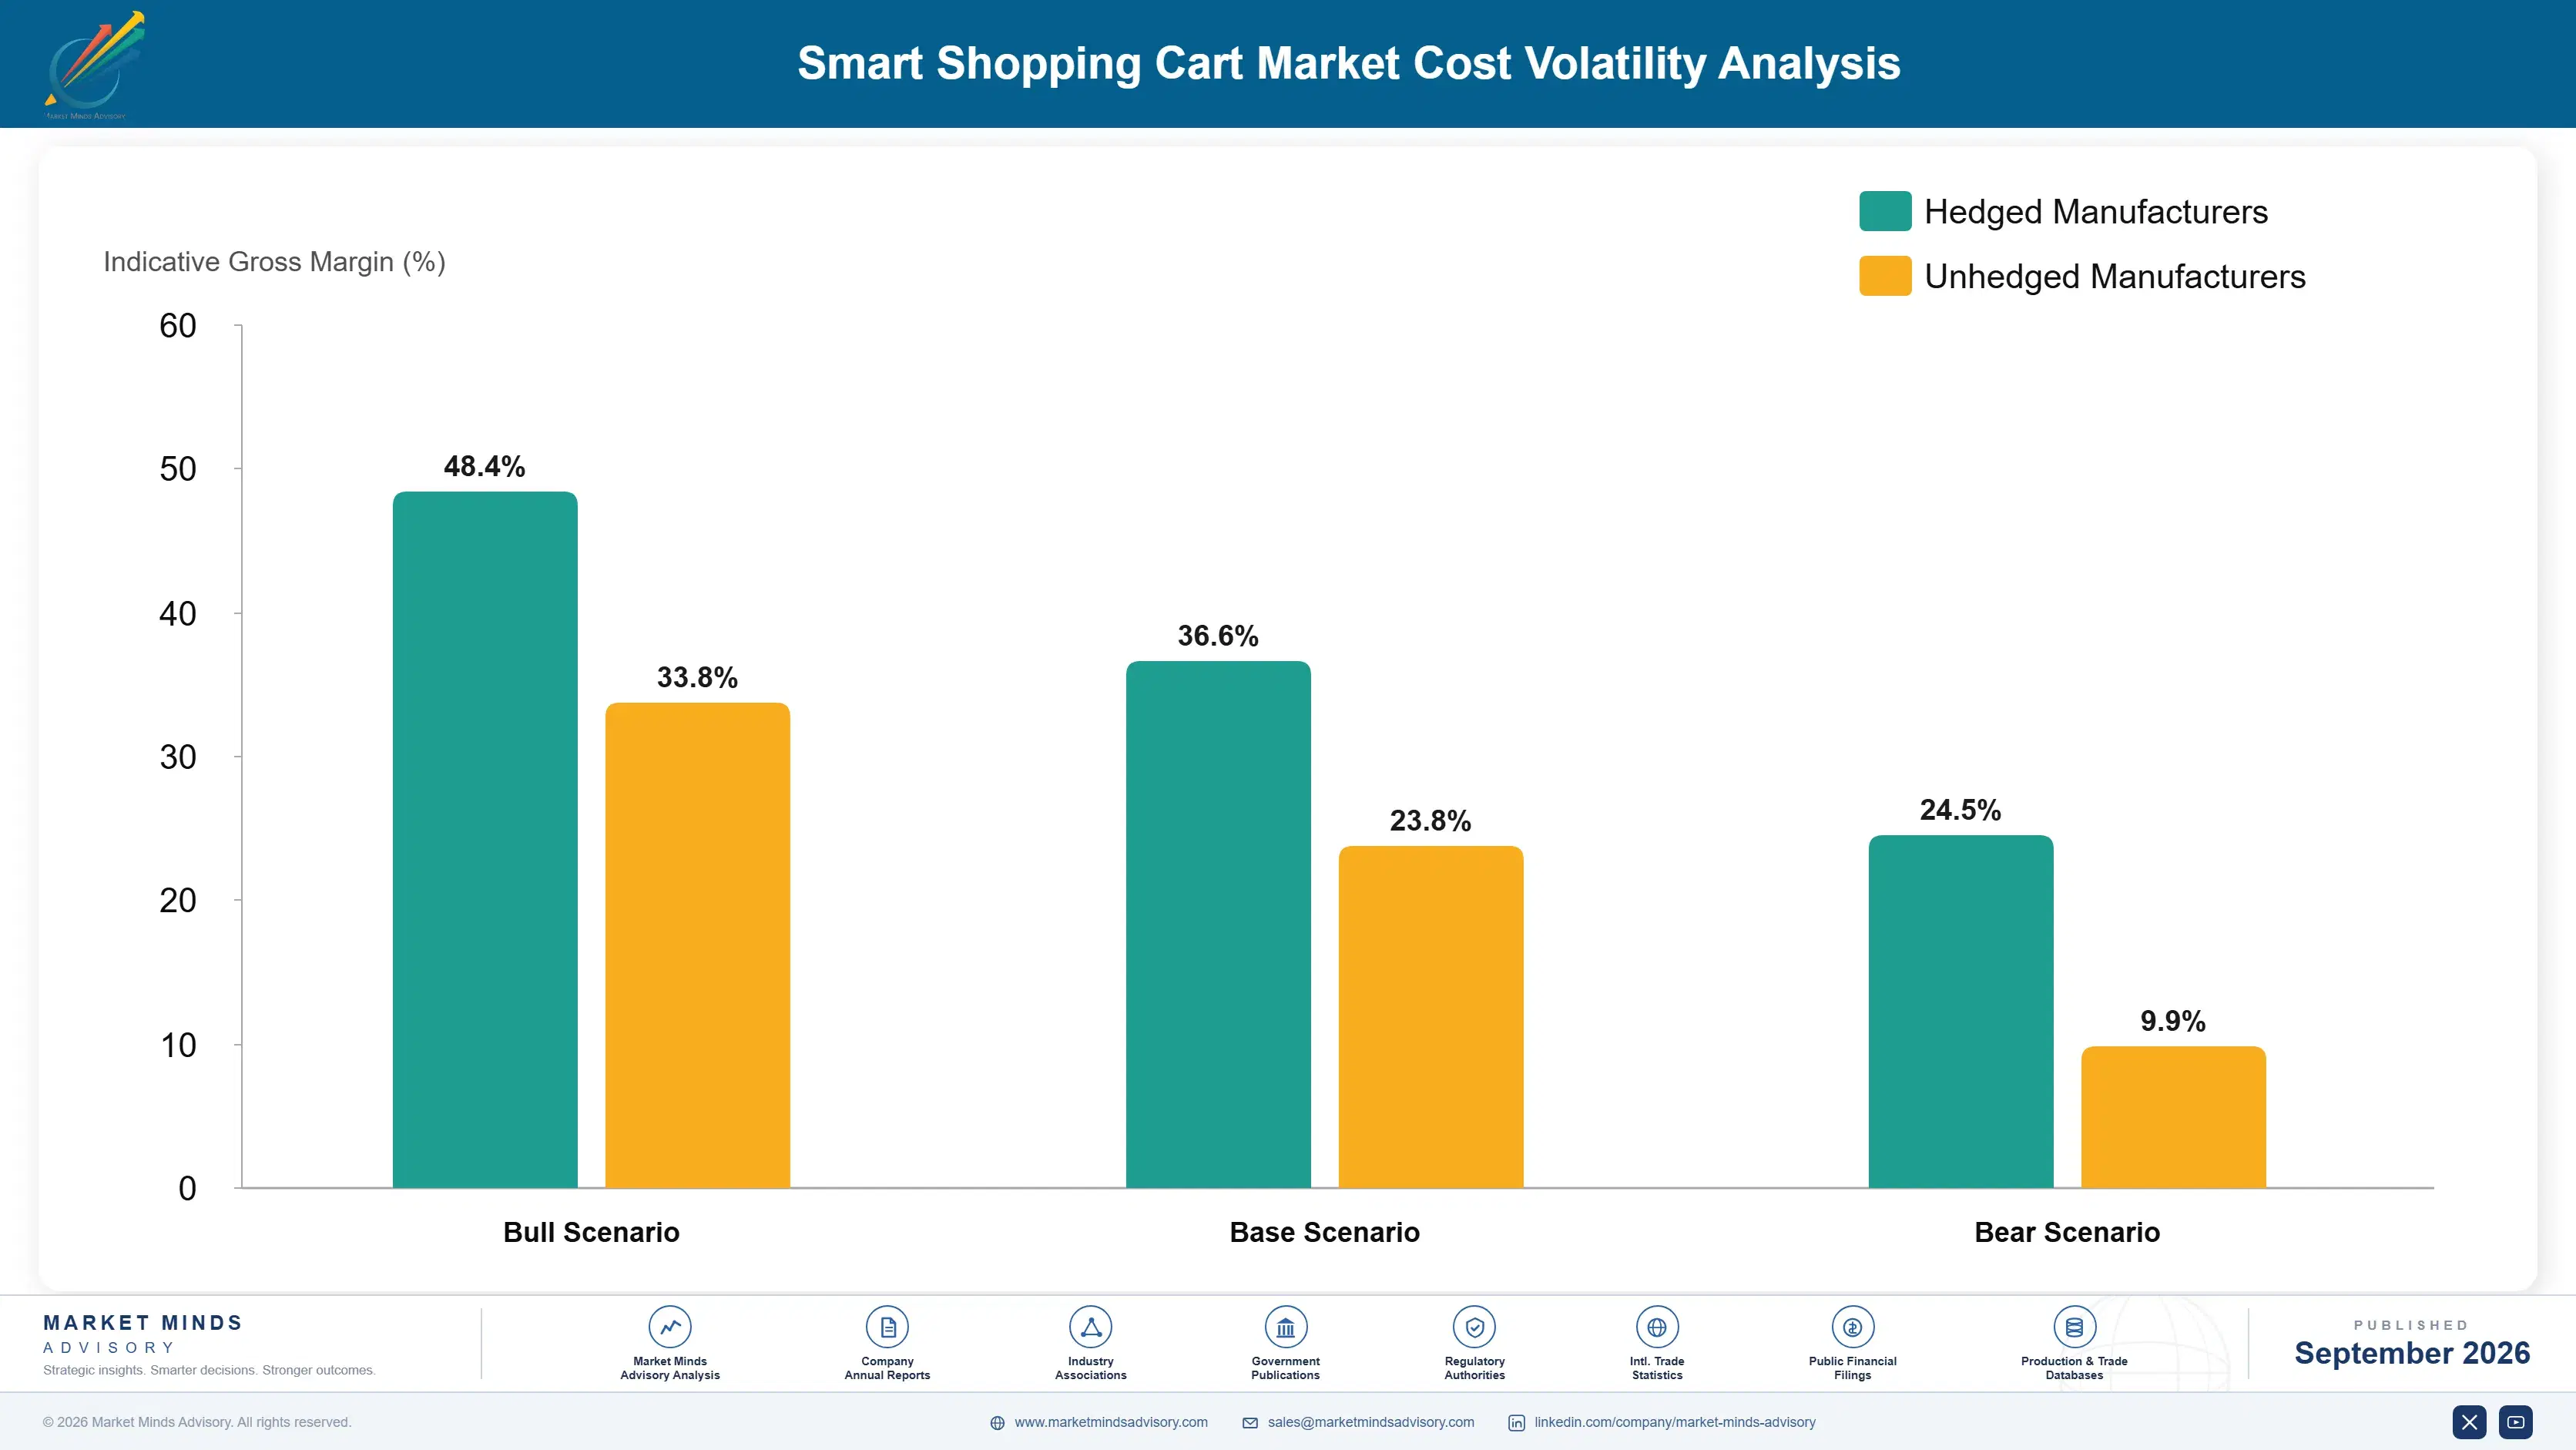
Vision processing chips and camera modules together account for roughly 45 percent of total hardware cost of goods sold, with battery packs and display screens making up most of the remainder. The majority of these components originate from Taiwanese and South Korean semiconductor foundries and Chinese camera module assemblers, concentrating supply risk in a narrow set of manufacturing regions vulnerable to trade disruption or capacity shortfalls.
The 2021 to 2022 global semiconductor shortage, documented extensively by the US Department of Commerce and referenced in Toshiba's own annual report disclosures, delayed several vendor hardware shipments by four to six months and forced at least two smaller cart vendors to pause new fleet contracts entirely during the worst of the shortage. Component lead times for vision processors remain longer than pre-shortage baseline levels even now.

Vendors without direct semiconductor foundry relationships face a meaningful competitive disadvantage during any future supply tightening, since larger players like Toshiba can lean on existing enterprise procurement relationships that smaller venture-funded cart specialists simply do not have access to. This exposure varies by geography too: vendors sourcing primarily through Chinese assemblers face different tariff and logistics risk than those sourcing through Korean or Taiwanese suppliers.
smart-shopping-cart-market-cost-volatility-analysis-1788419253785

Diversifying Vision Processor Sourcing Across Multiple Foundries

Leading vendors are qualifying second and third semiconductor foundry sources for vision processing chips rather than relying on a single supplier, a lesson drawn directly from the 2021 shortage disruption. This adds qualification cost upfront but meaningfully reduces the risk of a single-point supply failure halting fleet deployment schedules across a vendor's customer base.

Building Component Safety Stock Ahead Of Contract Signing

Several vendors now maintain three to four months of critical component inventory before signing new fleet contracts, rather than ordering components only after a contract is finalized. This buffer adds working capital cost but protects delivery timelines that retailers increasingly write into contracts with financial penalty clauses attached, giving vendors a credible commitment they can make to nervous procurement teams.

Portfolio Architecture for Margin Defence

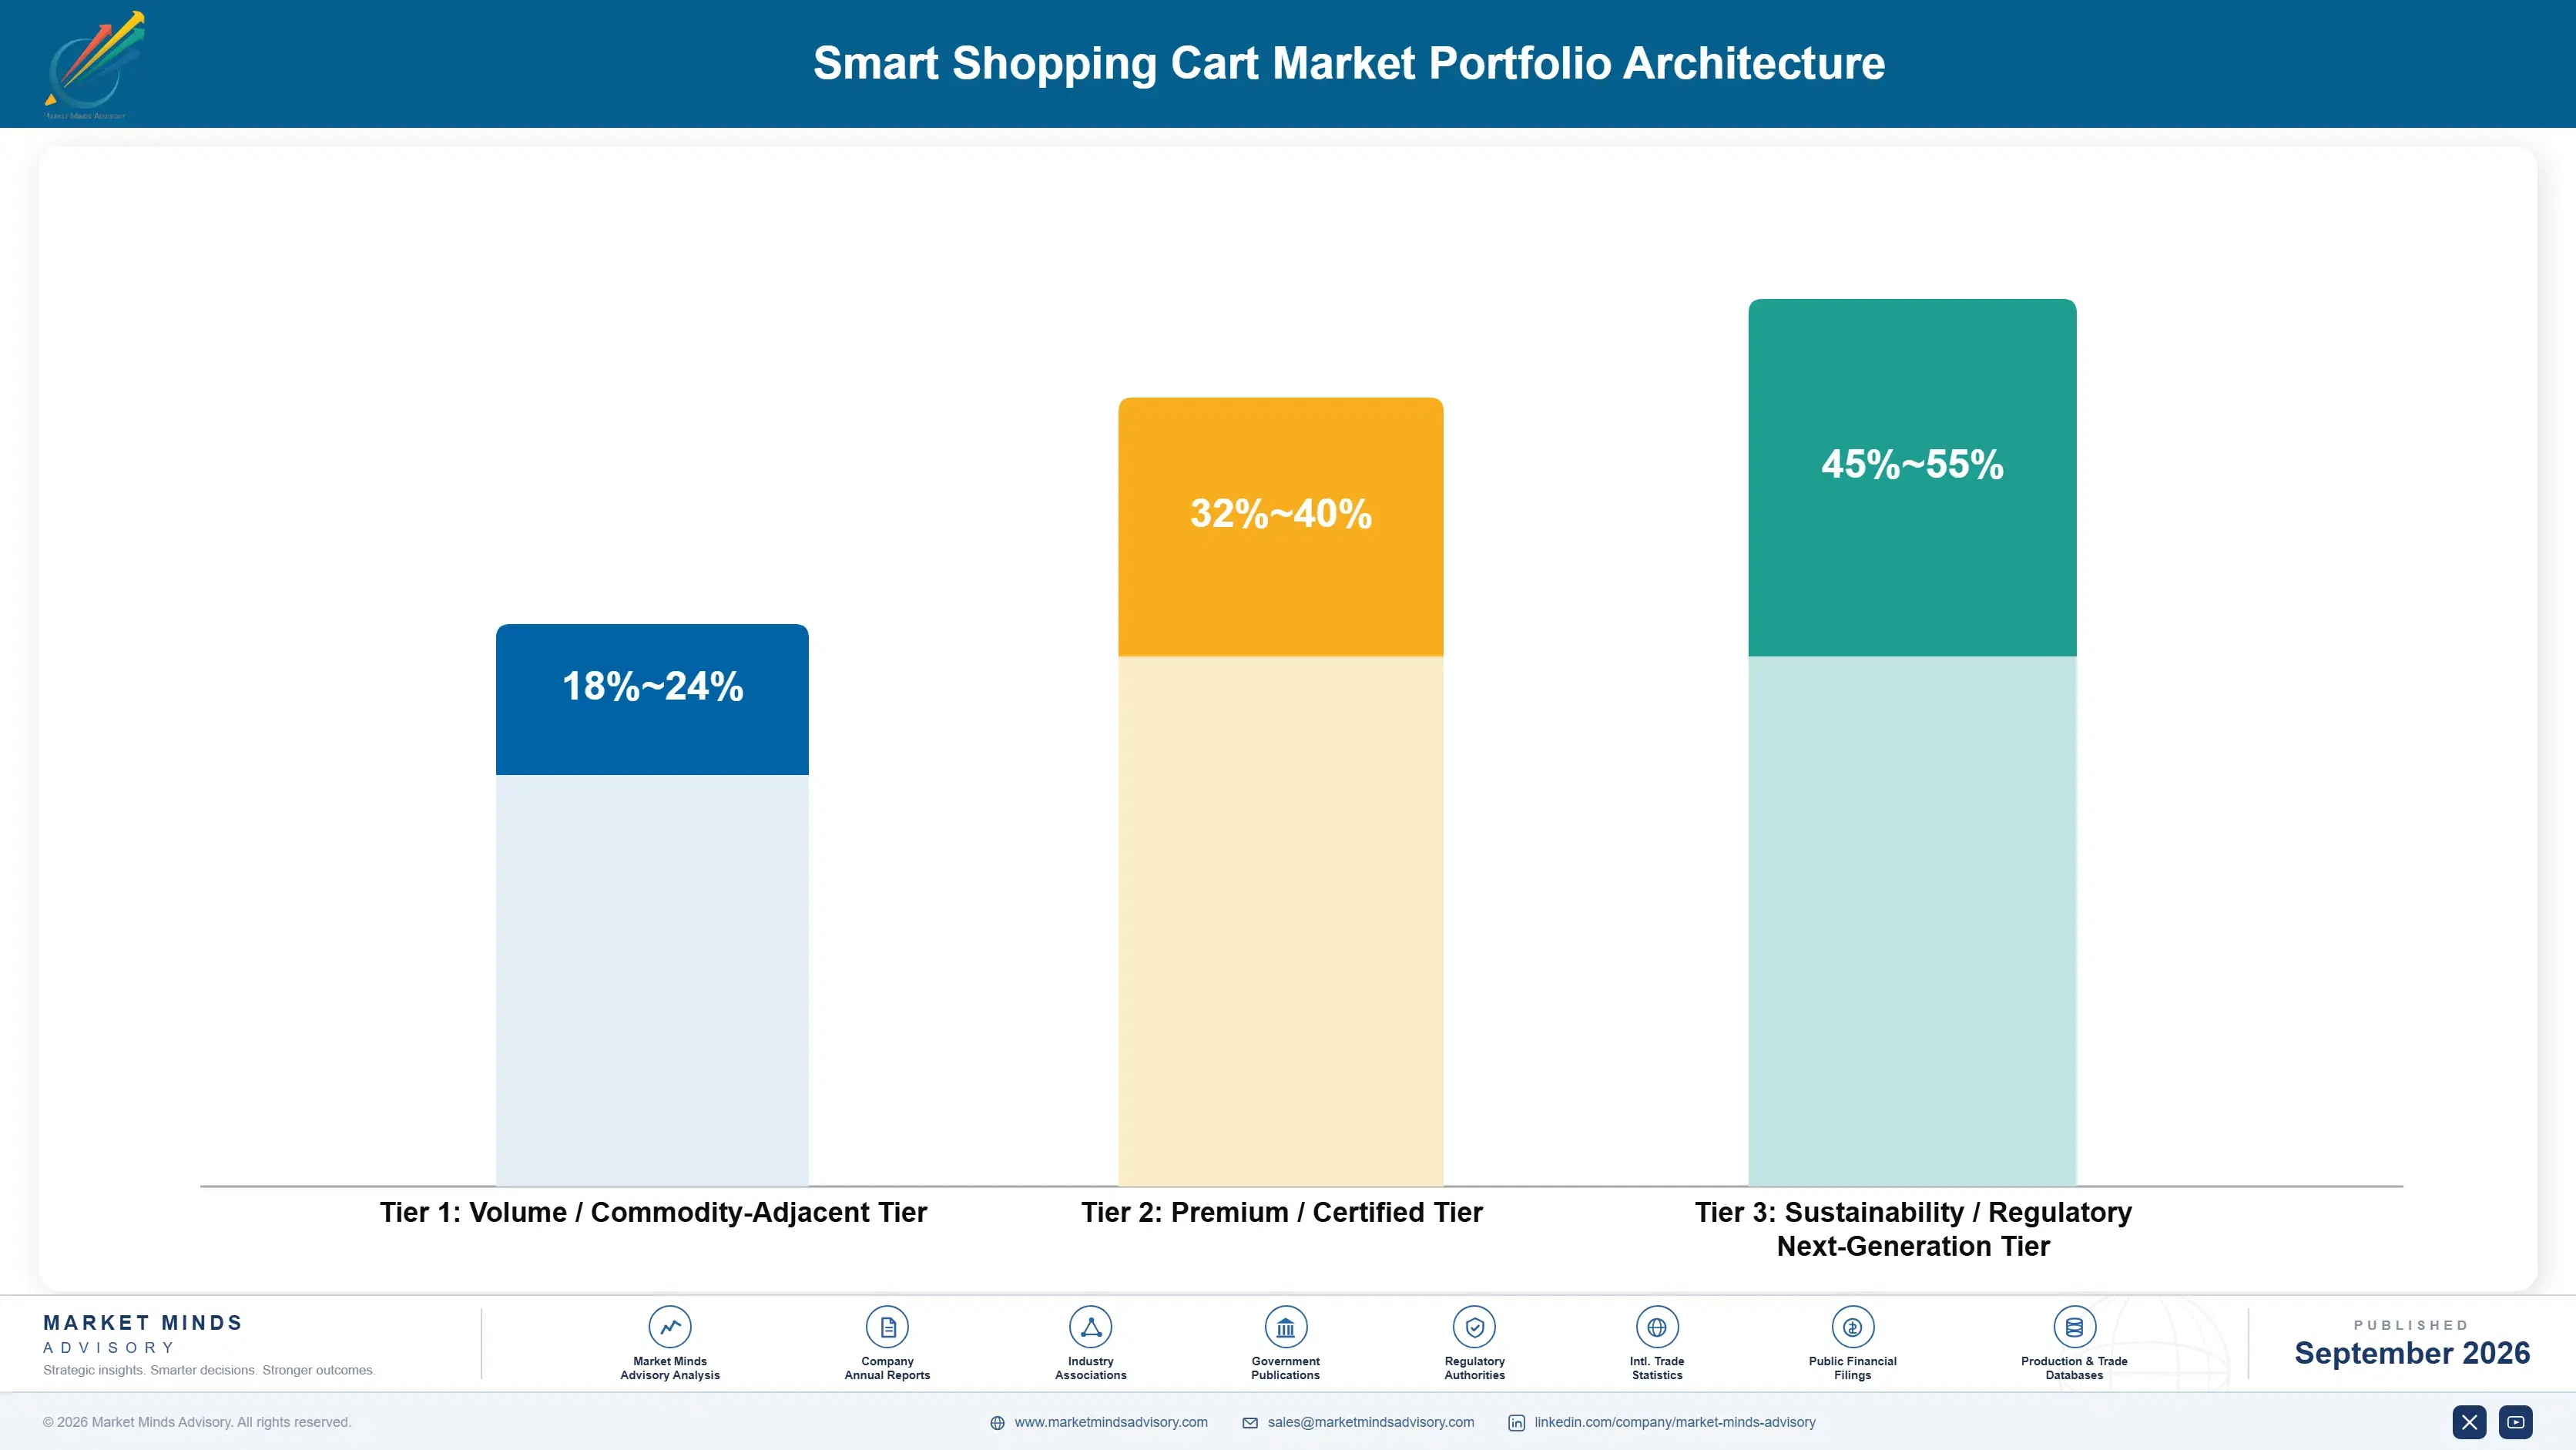
Portfolio economics split across three tiers running from basic weight-sensor carts sold near commodity hardware pricing up through certified computer vision systems and next-generation carts bundling retail media and predictive analytics software. Gross margin widens meaningfully moving up this ladder, since software and data revenue carry far less marginal cost than additional hardware units shipped, and vendors increasingly design contracts to migrate customers upward over time.
Volume tier carts compete almost entirely on unit price and durability, leaving vendors with thin margins that depend on scale to remain profitable across large fleet orders placed by budget-conscious chains. Premium tier carts instead compete on recognition accuracy and integration depth, letting vendors charge meaningfully more per unit while facing far less price pressure during contract renewal negotiations with major retail chains.

High-value margin pools concentrate almost entirely in the next-generation tier, where retail media placement and predictive maintenance subscriptions generate recurring revenue streams unavailable to vendors still selling standalone hardware. Vendors positioned only in the volume tier face real profitability ceilings that next-generation-tier competitors simply do not share, regardless of unit volume shipped across any given fiscal year.

Volume / Commodity-Adjacent Tier

Basic weight-sensor and RFID carts sold mainly to smaller regional chains prioritizing checkout automation over advanced personalization features, competing largely on unit price and hardware durability against several established suppliers.
Gross Margin: 18-24%

Premium / Certified Tier

Computer vision carts with certified recognition accuracy above 98 percent, bundling loyalty program integration and analytics dashboards that command premium per-unit and subscription pricing from mid-size and major grocery chains.
Gross Margin: 32-40%

Sustainability / Regulatory / Next-Generation Tier

Next-generation carts bundling retail media auction capability, predictive maintenance services, and regulatory-compliant edge biometric processing, positioned for chains prioritizing recurring data and advertising revenue streams over hardware cost alone entirely across the full contract term.
Gross Margin: 45-55%
smart-shopping-cart-market-portfolio-architecture-1788419254299

High-value Sub-segments and Strategic Watch-out

Computer Vision-Based Smart Carts

Retail media-enabled computer vision carts sit in the high-value high-growth quadrant, combining the fastest unit growth rate of any segment tracked with the widest gross margin band once advertising revenue layers on top of subscription fees, making this the clearest priority for vendor capital allocation over the next several years.
Gross Margin: 45-55%

RFID-Enabled Carts

RFID-enabled premium carts occupy the high-value moderate-growth quadrant, generating strong per-unit margin from pharmacy and packaged goods deployments even though growth trails computer vision, because supplier tagging cooperation and packaging line changes take years to scale fully across an entire retail catalog and supplier base.
Gross Margin: 32-40%

Weight-Sensor/Scale-Integrated Carts

Basic weight-sensor carts remain the volume core segment, generating the bulk of current unit shipments at thinner margins, still essential for vendor scale economics and fleet servicing revenue even as growth slows relative to vision-based alternatives entering the category more aggressively with each passing budget cycle.
Gross Margin: 18-24%

Cart-Mounted Navigation and Signage Software

Cart-mounted navigation and signage software is the strategic watch-out segment, facing real commoditization risk as bundled vision platforms increasingly absorb this functionality natively at no added cost, threatening standalone vendors that never expanded beyond simple signage display capability into richer software and analytics layers over time.
Gross Margin: 20-28%

Recurring Contracts Anchor Cart Vendor Revenue

Smart cart contracts increasingly bundle hardware, software, and maintenance into a single recurring fee, giving vendors annuity-like revenue instead of one-time equipment sales that used to dominate the category's early years. This recurring structure lets vendors fund continuous vision-model improvements while retailers avoid large capital expenditure spikes tied to periodic hardware refresh cycles, smoothing budget planning across multi-year store fleet rollouts.
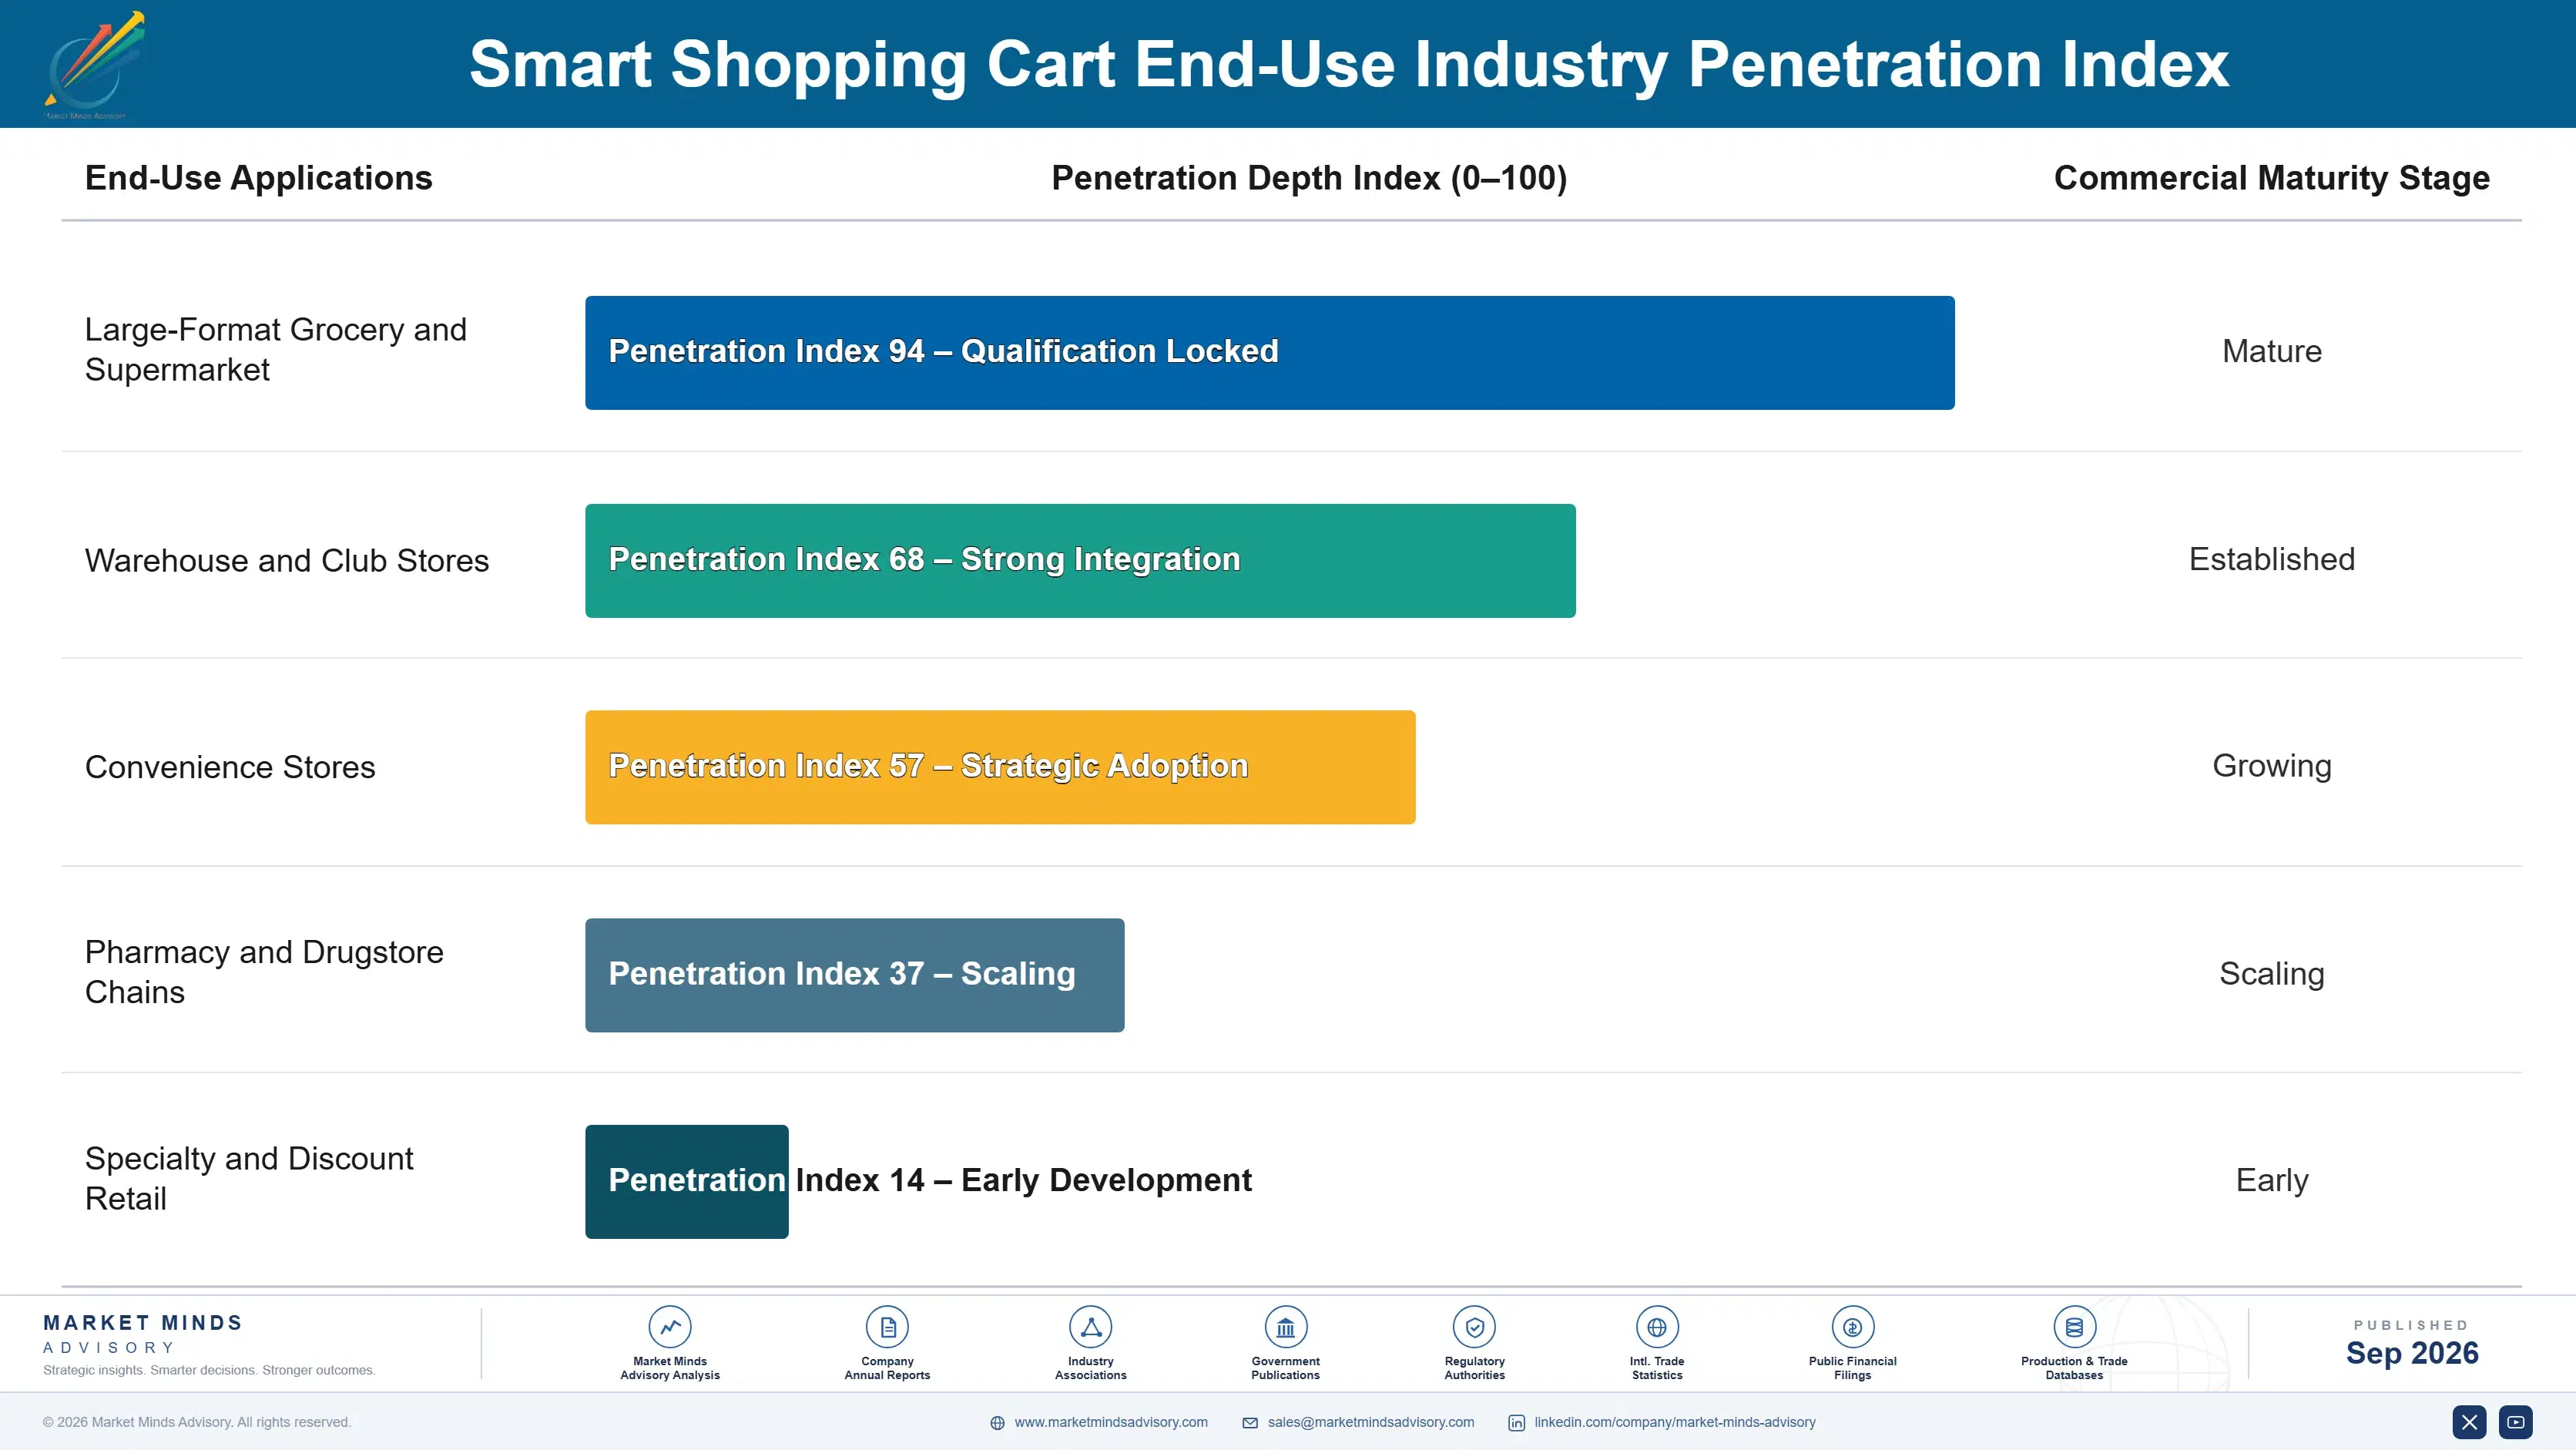
Adoption depth varies sharply by end-use vertical: large-format grocery and club stores run near-full fleet deployment once they commit, while convenience and drugstore formats stick with smaller pilot counts because average basket sizes rarely justify the added hardware cost per checkout lane. Warehouse clubs show the deepest stickiness of any format, rarely churning vendors once cart integration with loyalty and payment systems is fully complete.

Buyer profiles are shifting generationally as digitally native store operations managers replace traditional loss-prevention leads inside vendor selection committees, favoring data-rich platforms over pure hardware specifications and price comparisons alone. Younger procurement teams push harder for open integration standards and shorter contract lock-in periods, reshaping how vendors package their offerings for the next wave of chain-wide contract renewals across the industry.
smart-shopping-cart-market-end-use-penetration-index-1788419254786

Where Cart Vendors Should Focus Next

These are among the four positions where our research anticipates prominent divergence between winners and laggards over the coming forecast period. Each is grounded in the demand model, the regulatory perimeter, and the announced capacity pipeline.
01 / FINANCING MODEL DESIGN

Prioritize Subscription Financing To Win Mid-Size Chains

Vendors that still require large upfront hardware purchases are steadily losing bids to competitors offering cart-as-a-service financing, since mid-size chains under 200 stores rarely have capital budget flexibility for a seven-figure order placed all at once. This financing shift is not optional anymore; it has become table stakes across roughly 40 percent of new fleet contracts signed in 2025 alone. Vendors slow to build a comparable financing arm risk losing an entire tier of the market to faster-moving competitors within the next two contract renewal cycles.
02 / RETAIL MEDIA MONETIZATION

Build Retail Media Capability Before Competitors Lock In Brands

Retail media placement on cart screens is emerging as the single highest-margin revenue line available to vendors today, averaging roughly 18 dollars per cart monthly in early chain deployments tracked this year. Vendors without this capability are ceding a growing share of total contract value to rivals already running brand auctions through existing supplier relationships built over several years. Building this now, even at a modest pilot scale, secures early brand relationships before larger competitors consolidate advertiser demand across their own considerably larger store fleets entirely.
03 / REGULATORY COMPLIANCE ARCHITECTURE

Design Edge Biometric Processing Into Every New Product

State-level biometric privacy statutes are expanding faster than most vendors anticipated just two years ago, and retrofitting compliance into an existing vision architecture costs considerably more than building it in from the start of product design. Vendors that ship edge processing as a default feature avoid the six-month compliance delays now hitting competitors caught flat-footed by new state rules across several major markets. This is becoming a genuine competitive differentiator in contract negotiations with legally cautious retail chains nationwide, not simply a defensive cost center to absorb quietly.
04 / VENDOR CONSOLIDATION POSITIONING

Prepare For Point-of-Sale Incumbents Entering Through Acquisition

Point-of-sale incumbents like NCR Voyix and Diebold Nixdorf are adding vision capability through acquisition rather than slower internal development, and this consolidation wave will likely accelerate meaningfully over the next two to three years. Smaller pure-play vendors without a clear differentiation story beyond basic hardware specification risk becoming acquisition targets themselves rather than remaining independent long-term competitors in their own right. Vendors should decide now whether to pursue a defensible niche market position or instead position deliberately for a favorable acquisition outcome down the road.

Engagement Snapshot From the Field

A live engagement with an industry participant carrying material or product regulatory and market exposure ahead of a defining policy shift, showing how our research translates into a defensible multi-year portfolio strategy.
MARKET MINDS ADVISORY · CLIENT ENGAGEMENT SUMMARY
Smart Shopping Cart Producer Strategic Portfolio Review and Transition Roadmap 2026·Investment Scenario on Smart Shopping Cart Exposure Evaluation 2025-26
CLIENT PROFILE
The client operates roughly 140 supermarket locations across the mid-Atlantic United States, competing against larger national chains on service quality and community presence rather than scale. Facing persistent checkout staffing shortages, leadership had approved two small pilot deployments of computer vision carts but lacked a clear framework for expanding the program across the full store footprint. Annual revenue was reported at approximately 2.1 billion dollars (client-reported, unverified by MMA).
STRATEGIC CHALLENGE
Leadership needed to decide between three competing vendor proposals with materially different financing structures, hardware specifications, and contract lock-in terms, without clear internal expertise to evaluate long-term total cost of ownership. Store-level staff were skeptical the technology would actually reduce workload rather than simply adding new maintenance tasks to already stretched teams. The board wanted a defensible decision framework before committing capital.
MMA APPROACH
MMA conducted structured interviews with store managers across twelve locations alongside a comparative total cost of ownership model spanning all three vendor proposals over a five-year horizon. The analysis incorporated primary survey data on checkout labor reallocation patterns from comparable regional chains already running mature deployments. Findings were presented to the board alongside a phased rollout recommendation rather than a single go or no-go verdict.
KEY FINDINGS
  1. The cart-as-a-service financing structure reduced required upfront capital by roughly 70 percent compared to outright hardware purchase across the entire proposed fleet order.
  2. Store managers who had run the pilot reported staff reallocation to restocking duties improved measured on-shelf availability scores within the first quarter.
  3. The vendor with strongest retail media capability offered a payback period nearly a year shorter than competitors once advertising revenue was modeled in.
  4. Integration cost estimates from all three vendors understated required wifi density upgrades by a meaningful margin based on comparable chain deployment data.
CLIENT PROFILE
The client operates roughly 140 supermarket locations across the mid-Atlantic United States, competing against larger national chains on service quality and community presence rather than scale. Facing persistent checkout staffing shortages, leadership had approved two small pilot deployments of computer vision carts but lacked a clear framework for expanding the program across the full store footprint. Annual revenue was reported at approximately 2.1 billion dollars (client-reported, unverified by MMA).
STRATEGIC CHALLENGE
Leadership needed to decide between three competing vendor proposals with materially different financing structures, hardware specifications, and contract lock-in terms, without clear internal expertise to evaluate long-term total cost of ownership. Store-level staff were skeptical the technology would actually reduce workload rather than simply adding new maintenance tasks to already stretched teams. The board wanted a defensible decision framework before committing capital.
MMA APPROACH
MMA conducted structured interviews with store managers across twelve locations alongside a comparative total cost of ownership model spanning all three vendor proposals over a five-year horizon. The analysis incorporated primary survey data on checkout labor reallocation patterns from comparable regional chains already running mature deployments. Findings were presented to the board alongside a phased rollout recommendation rather than a single go or no-go verdict.
KEY FINDINGS
  1. The cart-as-a-service financing structure reduced required upfront capital by roughly 70 percent compared to outright hardware purchase across the entire proposed fleet order.
  2. Store managers who had run the pilot reported staff reallocation to restocking duties improved measured on-shelf availability scores within the first quarter.
  3. The vendor with strongest retail media capability offered a payback period nearly a year shorter than competitors once advertising revenue was modeled in.
  4. Integration cost estimates from all three vendors understated required wifi density upgrades by a meaningful margin based on comparable chain deployment data.
RECOMMENDED STRATEGY
Phase 1: Phase 1 (Months 1 to 3): Finalize vendor selection and negotiate financing terms incorporating retail media revenue share provisions into the base contract. Phase 2: Phase 2 (Months 4 to 9): Deploy fleet across twenty flagship stores while building internal wifi and staff retraining infrastructure ahead of wider rollout. Phase 3: Phase 3 (Months 10 to 18): Expand to remaining store footprint using lessons from flagship deployment, renegotiating vendor terms at proven scale.
OUTCOME
The client selected the recommended vendor and financing structure, avoiding an estimated 4.5 million dollars (client-reported, unverified by MMA) in upfront capital expenditure versus the original proposal under evaluation. Store-level staff redeployment proceeded roughly on schedule, and early flagship results matched the modeled labor reallocation benefit closely enough that the board approved full-footprint expansion ahead of schedule.

Frequently Asked Questions

Foundational context covering the market sizes, CAGR, scope, country, region and competition that inform every finding below. This section is provided to cover basics and most often pre-purchase conversations, answered from the MMA Primary Research Dataset.

What is the current size of the Smart Shopping Cart Market?

The smart shopping cart market reached approximately 0.53 billion dollars in 2026, according to MMA Primary Research Dataset, July 2026. This figure reflects hardware and subscription software revenue combined across all cart technology types tracked.

How large will the Smart Shopping Cart Market be by 2036?

MMA projects the market will reach approximately 2.66 billion dollars by 2036 under the base case scenario. That represents roughly a 5.02 times expansion over the ten-year forecast period from 2026 through 2036.

What is the CAGR for the Smart Shopping Cart Market 2026 to 2036?

The base case compound annual growth rate is 17.5 percent through 2036. Bull and bear scenarios range from 18.8 percent to 16.2 percent depending on regulatory and procurement conditions.

Which segment is growing fastest?

Computer vision-based smart carts are growing fastest at 22.0 percent CAGR, roughly 1.26 times the overall market rate. Falling hardware costs and rising recognition accuracy are driving this segment's outsized expansion versus RFID and weight-sensor alternatives.

Who are the major companies in the Smart Shopping Cart Market?

Leading companies include Instacart Caper, Veeve Inc, Zippin Corporation, Pensa Systems, and Toshiba Global Commerce Solutions. These five players hold a combined 44 percent share on an installed cart unit basis.

Which country is growing fastest?

India is growing fastest at approximately 19.5 percent CAGR, driven by Reliance Retail and DMart expanding fleet pilots off a comparatively small current installed base. This outpaces the United States and other mature markets considerably.

Report Segmentation Architecture

The full report scope spans multiple orthogonal segmentation dimensions, with cross-tabulated demand data provided for each dimension pair. Coverage extends further to regional breakdowns, trend trajectories, and the competitive detail needed to support segment-level decision-making.

By Primary Market Dimension

  • Computer Vision-Based Smart Carts
  • RFID-Enabled Carts
  • Weight-Sensor/Scale-Integrated Carts
  • Self-Checkout Basket Systems
  • Cart-Mounted Navigation and Signage Software
  • Loyalty and Personalization Software

By End-Use Industry

  • Large-Format Grocery and Supermarket
  • Warehouse and Club Stores
  • Convenience Stores
  • Pharmacy and Drugstore Chains
  • Specialty and Discount Retail

By Commercial Dimension

  • Direct Hardware Purchase
  • Cart-as-a-Service Subscription
  • Retail Media Revenue Share
  • Managed Maintenance Contract

By Region

  • North America
  • Western Europe
  • East Asia
  • South Asia and Pacific
  • Latin America
  • Middle East and Africa
  • Eastern Europe

Scope, Methodology, and Coverage

Every figure in this report is reproducible from documented input assumptions. The scope below maps the historical period, the forecast horizon, the segmentation dimensions, and the countries covered, alongside the underlying primary and qualitative methodology.
Historical Period
2020 to 2025
Forecast Period
2026 to 2036
Base Year
2025 (USD billions; MMA Primary Research Dataset, September 2026)
Market Definition
The smart shopping cart market covers hardware and embedded software systems enabling automated item recognition, weighing, or scanning within a physical retail cart, spanning computer vision, RFID, and weight-sensor variants. It excludes standalone mobile scan-and-go applications not attached to a physical cart chassis and excludes general warehouse robotics.
Quantitative Units
USD billions (current prices); unit shipments where applicable
Segmentation Dimensions
By Cart Technology Type; By End-Use Industry; By Commercial Dimension; By Region
Regions Covered
North America, Western Europe, East Asia, South Asia and Pacific, Latin America, Middle East and Africa, Eastern Europe
Countries Covered
USA, China, Germany, France, UK, Japan, South Korea, India, Australia, Canada, Brazil, Mexico, Indonesia, Vietnam, Thailand, Malaysia, UAE, Saudi Arabia, South Africa, Nigeria, Turkey, Poland, Netherlands, Italy, Spain, Sweden, Switzerland, Argentina, Colombia, Singapore, and additional markets relevant to this sector
Key Companies Profiled
Instacart Caper, Veeve Inc, Zippin Corporation, Pensa Systems, Toshiba Global Commerce Solutions, Focal Systems, AiFi Inc, Diebold Nixdorf, NCR Voyix, Grabango, Shopic, Imagr, Trigo Vision, Wanzl GmbH, Caper AI, Cust2Mate, CartTrack Solutions, SES-imagotag, Retail Business Services, Aila Technologies
Quantitative Methodology
Primary survey, n=3,800 respondents, Q4 2025, six countries; demand-side model with trade association cross-validation
Qualitative Methodology
47 expert interviews, Q4 2025; applied to validate demand model assumptions, identify emerging dynamics, and assess competitive positioning
Report Format
PDF and XLSX data workbook (Word format preview document)
Publisher
Market Minds Advisory
Report Code
MMA-2026-TEC-601
Published
September 2026
Contact
sales@marketmindsadvisory.com | www.marketmindsadvisory.com

Purchase the full Smart Shopping Cart Market Report (2026 to 2036).

This report delivers a comprehensive assessment of the global smart shopping cart market, covering historical performance from 2020 through 2025 and forecasts through 2036 across all seven major world regions. It profiles the twenty leading vendors shaping computer vision, RFID, and weight-sensor cart technology, including detailed competitive positioning and recent corporate developments. The analysis quantifies segment-level growth across six technology categories and evaluates revenue diversification opportunities including retail media and predictive maintenance. Primary research draws on a 3,800-respondent survey and 47 expert interviews conducted in Q4 2025.
Ten-year revenue forecast by segment and region
Competitive benchmarking of twenty profiled vendors
Regional demand driver analysis across seven markets
Input cost and supply chain risk assessment
Revenue diversification and retail media lever analysis
Anonymized client case study with strategic recommendations

Built For The People Who Decide

From boardroom strategy to bench-side execution, this report is read cover-to-cover by leaders shaping the next decade of their industry, turning demand scenarios, market dynamics and valuation benchmarks into decisions.
CXOs/ Presidents/ VPs/ Managers
M&A and Corporate Development
Strategy Teams and R&D Heads
Procurement and Product Directors
Regulatory and Compliance Leaders
Investor Relations and Equity Analysts