

Market Minds Advisory
Smart Shoes Market

Smart Shoes Market: Smart Shoes Market. Health Monitoring Sensors Reshape Connected Footwear Manufacturing

Embedded health-monitoring sensor arrays are colliding with decades of purely mechanical footwear design, forcing established athletic brands to qualify connected-device production fast enough to defend shelf space against agile tech entrants.

Lead Analyst

Published

September 2026

Make Smarter Decisions with Customized Research Insights

Request a free sample report and evaluate market opportunities, growth trends, and competitive dynamics relevant to your business needs.

2025 MARKET VALUE$1.8BMarket Size 2025
2036 FORECAST VALUE$5.4BBase Case , 2026 to 2036
CAGR 2026 TO 203610.5 %Bull 11.8% / Bear 9.2%
INCREMENTAL OPPORTUNITY$3.4BNet 10- year value creation
EXPANSION MULTIPLE2.71x2036 value over 2026 base
Strategic Levers
M&A Pipeline
Regional Outlook
Country Rankings
Competitive Intelligence
Segmental Deep-dive
Call-Us : 91 93563 13602

Executive Snapshot and Market Trajectory.

Smart shoe manufacturers face genuine pressure to qualify embedded health-monitoring sensor arrays while still sustaining basic fitness-tracking production lines that built the category's earliest retail credibility across most major markets and price tiers, a tension reshaping product roadmaps across the sector this coming year.
Health monitoring smart shoes are growing fastest of six product categories as consumers pursue gait and pressure analysis beyond simple step counting across most demographic segments, while self-lacing models follow closely on convenience-driven demand built over several years. North America concentrates the bulk of demand given Nike and Under Armour's outsized athletic brand manufacturing base specifically. China's expanding sensor manufacturing capacity is also shaping which brands can scale connected production fast enough to matter.
Five manufacturers hold roughly forty-five percent of market revenue, a moderately concentrated structure reflecting how established athletic brand heritage and sensor integration expertise matter for high-value retail shelf placements across the category broadly. China's manufacturing scale-up is driving the fastest national growth as domestic brands export connected footwear internationally at increasing volume. Smaller regional manufacturers without comparable production scale increasingly struggle to compete on multi-sensor pricing specifically.
Market Definition
This report covers revenue from fitness tracking, self-lacing, GPS-enabled navigation, health monitoring, app-connected athletic performance, and smart safety and industrial footwear sold through retail, e-commerce, and specialty athletic channels. It excludes standard athletic footwear without embedded electronics or connectivity features.
Base Year Value
$1.8B in 2025 (MMA Primary Research Dataset, August 2026)
Forecast Period
2026 to 2036, eleven discrete annual values
CAGR
10.5% base case. Bull 11.8%. Bear 9.2%.
Fastest Growth Segment
Health Monitoring Smart Shoes: 15.0% CAGR
Fastest Growth Country
China: 13.0% CAGR
Fastest Growth Region
South Asia and Pacific: 12.5% CAGR
Largest Region
North America: 30% of 2025 global value
Market Leaders
Nike, Under Armour, Xiaomi, Digitsole, Puma. Source: MMA Analysis based on company disclosures and wearable technology industry data.
Primary Survey
n=3,800 procurement and R&D decision-makers, Q4 2025, six countries
Methodology
Demand-side build-up, cross-validated against public data, 47 expert interviews

Smart Shoes Market Forecast Scenarios

smart-shoe-market-size-forecast-scenario-1788166876235
Between 2020 and 2025 the smart shoes market grew at roughly 9.5 percent annually, accelerating as consumers responded to rising interest in wearable health monitoring that traditional standalone fitness trackers could not integrate as naturally into daily footwear use. Manufacturers used this period to build sensor integration capacity ahead of broader retail adoption across most major athletic retail channels.
The base case assumes 10.5 percent annual growth through 2036, anchored in three mechanisms: expanding health monitoring sensor adoption as consumers pursue gait and pressure analysis across fitness and medical wellness channels, rising self-lacing demand as consumers seek convenience beyond manual fastening, and growing Chinese sensor manufacturing capacity that is lowering production costs for multi-feature devices globally. Manufacturers with established sensor integration platforms are best placed to capture this combined growth.
A bull scenario built on faster health monitoring retail adoption and expanding self-lacing demand could push growth toward 11.8 percent, led by manufacturers already scaled on flagship retail programs. A bear scenario tied to sensor component cost volatility and softer discretionary athletic spending could instead pull growth down toward 9.2 percent. Manufacturing capacity constraints remain a secondary swing factor either way.

Sensor Integration and Convenience Economics

Smart shoe manufacturing sits at a genuine inflection point where embedded health-monitoring sensors are generating demand for integrated electronics engineering that decades of purely mechanical footwear production were never designed to deliver, forcing manufacturers to rethink product design entirely across every manufacturing facility. Few athletic footwear categories have faced this rapid a functional shift after generations of comparatively stable mechanical construction.
TOP-5 MANUFACTURER CONCENTRATION45%Global revenue share held by five largest smart shoe manufacturers
NORTH AMERICA REVENUE SHARE30%Global revenue tied to established athletic brand manufacturing base
HEALTH MONITORING REVENUE SHARE18%Total revenue tied specifically to gait and pressure sensors
AVERAGE PRODUCT DEVELOPMENT CYCLE14 monthsTypical duration required to bring a new shoe to market
SENSOR AND BATTERY COST38%Embedded sensor and battery components as share of total cost
DIRECT-TO-CONSUMER REVENUE SHARE44%Total revenue tied to online and direct retail sales channels
Established manufacturers still dominate the highest-value retail shelf placements because years of sensor calibration expertise and battery safety certification matter enormously for products where health-tracking accuracy claims carry genuine reputational consequences, letting incumbents defend share even as smaller brands pursue novel sensor combinations. This dynamic increasingly determines which manufacturers can grow their retail relationships profitably versus which must retrench toward niche direct-to-consumer positioning instead.
Two forces will reshape the next decade. Health monitoring adoption will keep expanding gait and pressure analysis expectations across every new product launch and retail category simultaneously, while self-lacing demand keeps generating steady growth that standard fitness-tracking models alone could never fully satisfy. Manufacturers positioned to serve both traditional fitness demand and emerging health-monitoring specification simultaneously carry a genuine advantage over slower-moving competitors.
"A smart shoe used to mean a chip that counted your steps and little else. Now it analyzes your gait and flags an injury risk before you feel it, and that changes which brands actually keep customers loyal."
Director, Wearable Technology and Athletic Footwear Practice · MMA Smart Footwear Technology Practice · August 2026

Market Trends

Health Monitoring Sensors Enable Gait Analysis

Manufacturers now integrate pressure-mapping sensors that let consumers track gait patterns, weight distribution, and injury risk indicators directly through companion smartphone apps, a capability traditional standalone fitness trackers could never offer at comparable accuracy or convenience. This shift has proven considerably more durable than a passing wellness trend alone would suggest, given how many consumers now treat health monitoring footwear as a genuine preventive care tool rather than a novelty feature reserved for premium price tiers only. Manufacturers with established sensor calibration infrastructure are best positioned to capture this accelerating demand.
Market Impact: Narrows price gap to 30 percent

Self-Lacing Technology Expands Consumer Convenience Demand

Manufacturers increasingly integrate motorized lacing mechanisms that adjust fit automatically through companion app controls, a capability traditional manual lacing systems could never offer at comparable convenience for consumers with mobility limitations or active lifestyle demands across most demographic segments. Roughly forty-four percent of category revenue now flows through direct-to-consumer online channels, with self-lacing formats accounting for a disproportionate share of that revenue given the format's appeal to younger, tech-oriented consumers. Manufacturers investing in motorized lacing infrastructure are winning disproportionate share of this fast-growing segment as connectivity demand continues rising steadily nationwide.
Market Impact: Adds 12 percent performance segment growth

Market Opportunities and Growth Drivers

Preventive Healthcare Trend Drives Sensor Adoption

Consumers increasingly view smart shoes as preventive healthcare tools rather than pure fitness accessories, narrowing the price gap between standard athletic footwear and sensor-equipped models to within roughly thirty percent per pair at comparable performance tiers. This preference shift has proven considerably more durable than a single wellness cycle alone would suggest, given how many consumers now treat health monitoring footwear as a genuine value upgrade rather than a discretionary indulgence reserved only for fitness enthusiasts. Manufacturers with established sensor calibration capability are best positioned to capture this accelerating demand.
Market Impact: Adds 8 percent input cost pressure

Athletic Performance Culture Expands Connected Footwear Demand

Athletes and fitness enthusiasts increasingly demand app-connected performance tracking integrated directly into footwear rather than relying on separate wearable devices, a shift that traditional standalone fitness tracker manufacturers could never fully address at comparable convenience or accuracy across most training environments. Roughly thirty percent of category revenue already flows through channels serving this combined performance-tracking demand, with app-connected models commanding meaningfully higher average selling prices than basic fitness-tracking alternatives. Manufacturers with established athletic performance partnerships are winning disproportionate share of this expanding demand pool as participation continues rising steadily nationwide.
Market Impact: Caps battery life near 18 hours

Market Restraints and Challenges

Sensor Component Cost Volatility Pressures Margin

Pressure sensors, batteries, and specialty electronics components, which represent roughly thirty-eight percent of total device cost, face genuine price volatility tied to concentrated global semiconductor supply and geopolitical trade tensions affecting several major producing countries simultaneously and without much advance warning. The root cause is genuine commodity market concentration rather than any manufacturer-specific pricing failure, since sensor sourcing options remain limited regardless of individual manufacturer scale or negotiating position. Manufacturers are mitigating this through long-term component supply agreements and increasing investment in alternative sensor sourcing that reduces dependency on the most constrained supply category.
Market Impact: Grows health monitoring revenue 15 percent

Battery Life Limitations Constrain Daily Usability

Many consumers remain skeptical that embedded battery systems can sustain all-day usage without frequent recharging, a perception that limits how quickly manufacturers can shift retail mix toward premium sensor-equipped models even as battery efficiency genuinely improves across most product generations. The root cause is genuine battery capacity constraints within compact footwear form factors rather than any actual manufacturing quality gap, since manufacturers with larger battery compartments report satisfaction comparable to standalone wearable devices. Manufacturers are mitigating this through low-power sensor design and expanded battery capacity that reduces charging hesitation gradually across most consumer segments.
Market Impact: Drives 44 percent of revenue online
4 additional market trends, 3 additional growth drivers, and 3 additional restraints and challenges are covered in the full report. Contact sales@marketmindsadvisory.com to access the complete intelligence.

Segment CAGR and Growth Architecture

Segmentation follows embedded functionality, the dimension manufacturers and retailers use to plan development runs and pricing tiers across every distribution channel and geography served worldwide today. Six categories cover the market: fitness tracking, self-lacing, GPS-enabled navigation, health monitoring, app-connected athletic performance, and smart safety and industrial footwear. This mirrors how retailers organize shelf categories.
smart-shoe-market-market-share-analysis-1788166876767

Health Monitoring Smart Shoes

Health monitoring smart shoes are the fastest-growing segment as consumers increasingly seek gait and pressure analysis that traditional standalone fitness trackers cannot deliver at comparable accuracy or convenience during daily activity. Consumers increasingly view health monitoring footwear as a genuine preventive care upgrade rather than a novelty feature, given considerable improvements in pressure-sensor calibration that newer manufacturing techniques now deliver relative to earlier generations that struggled with inconsistent readings. Manufacturers with established sensor calibration history are winning disproportionate share of this demand, since the specialized sensor integration and validation testing required creates genuine barriers for newer entrants lacking comparable development experience. Preventive-care-seeking consumer segments are pulling forward purchasing decisions that buyers might otherwise have deferred.
CAGR 15.0%

Self-Lacing Smart Shoes

Self-lacing smart shoes are the second-fastest segment as consumers increasingly specify motorized convenience that traditional manual lacing systems cannot deliver at comparable speed or accessibility for users with mobility limitations. Consumers increasingly view self-lacing technology as a genuine lifestyle upgrade rather than a premium indulgence, given considerable improvements in motor reliability that newer designs now deliver relative to earlier generations that struggled with mechanical failure. Manufacturers with established motorized lacing engineering history are winning disproportionate share of this demand, since the specialized mechanical and software integration required creates genuine barriers for newer entrants lacking comparable design experience. Convenience-seeking lifestyles are pulling forward purchasing decisions that consumers might otherwise have deferred.
CAGR 13.0%
Full segment breakdown across 6 segments available in the complete report.

Regional Architecture and Country Demand Map

North America leads on Nike and Under Armour's outsized athletic brand manufacturing base, followed closely by East Asia given China's rapidly expanding sensor manufacturing capacity nationwide. Western Europe follows on established athletic retail distribution, while South Asia and Pacific posts the fastest proportional growth overall.

North America

The United States anchors regional demand through Nike and Under Armour's outsized athletic brand manufacturing base and established e-commerce accessory retail infrastructure, a capability both companies have built deep expertise around over the past decade of platform investment and sensor refinement across most retail formats served. These established brand relationships give domestic manufacturers privileged access to demand that international competitors without comparable retail infrastructure struggle to match regardless of product quality or turnaround speed. Canadian demand tracks the broader North American pattern closely, adding incremental volume without shifting the region's overall competitive structure meaningfully across most product categories tracked in this comprehensive global industry assessment and full report covering every region.
Share: 30% | CAGR: 10.5% (2026 to 2036)

Western Europe

Germany and France anchor significant regional demand through established athletic retail infrastructure and long-standing fitness culture, supported by Puma and several specialized European manufacturers maintaining deep relationships across regional specialty retail networks built over generations of category leadership and design credibility. The region's mature athletic footwear retail infrastructure reflects its historical role as an early European wearable technology qualification hub predating most newer regional markets globally. Regional growth trails East Asia and South Asia somewhat given Europe's more mature, slower adoption pace relative to faster-expanding emerging manufacturing markets elsewhere globally currently across most comparable emerging manufacturing markets tracked in this comprehensive global industry report and full assessment across most comparable regional markets.
Share: 20% | CAGR: 9.0% (2026 to 2036)
Regional intelligence for 5 additional markets available in the complete report: East Asia, South Asia and Pacific, Latin America, Middle East and Africa, Eastern Europe. Contact sales@marketmindsadvisory.com.
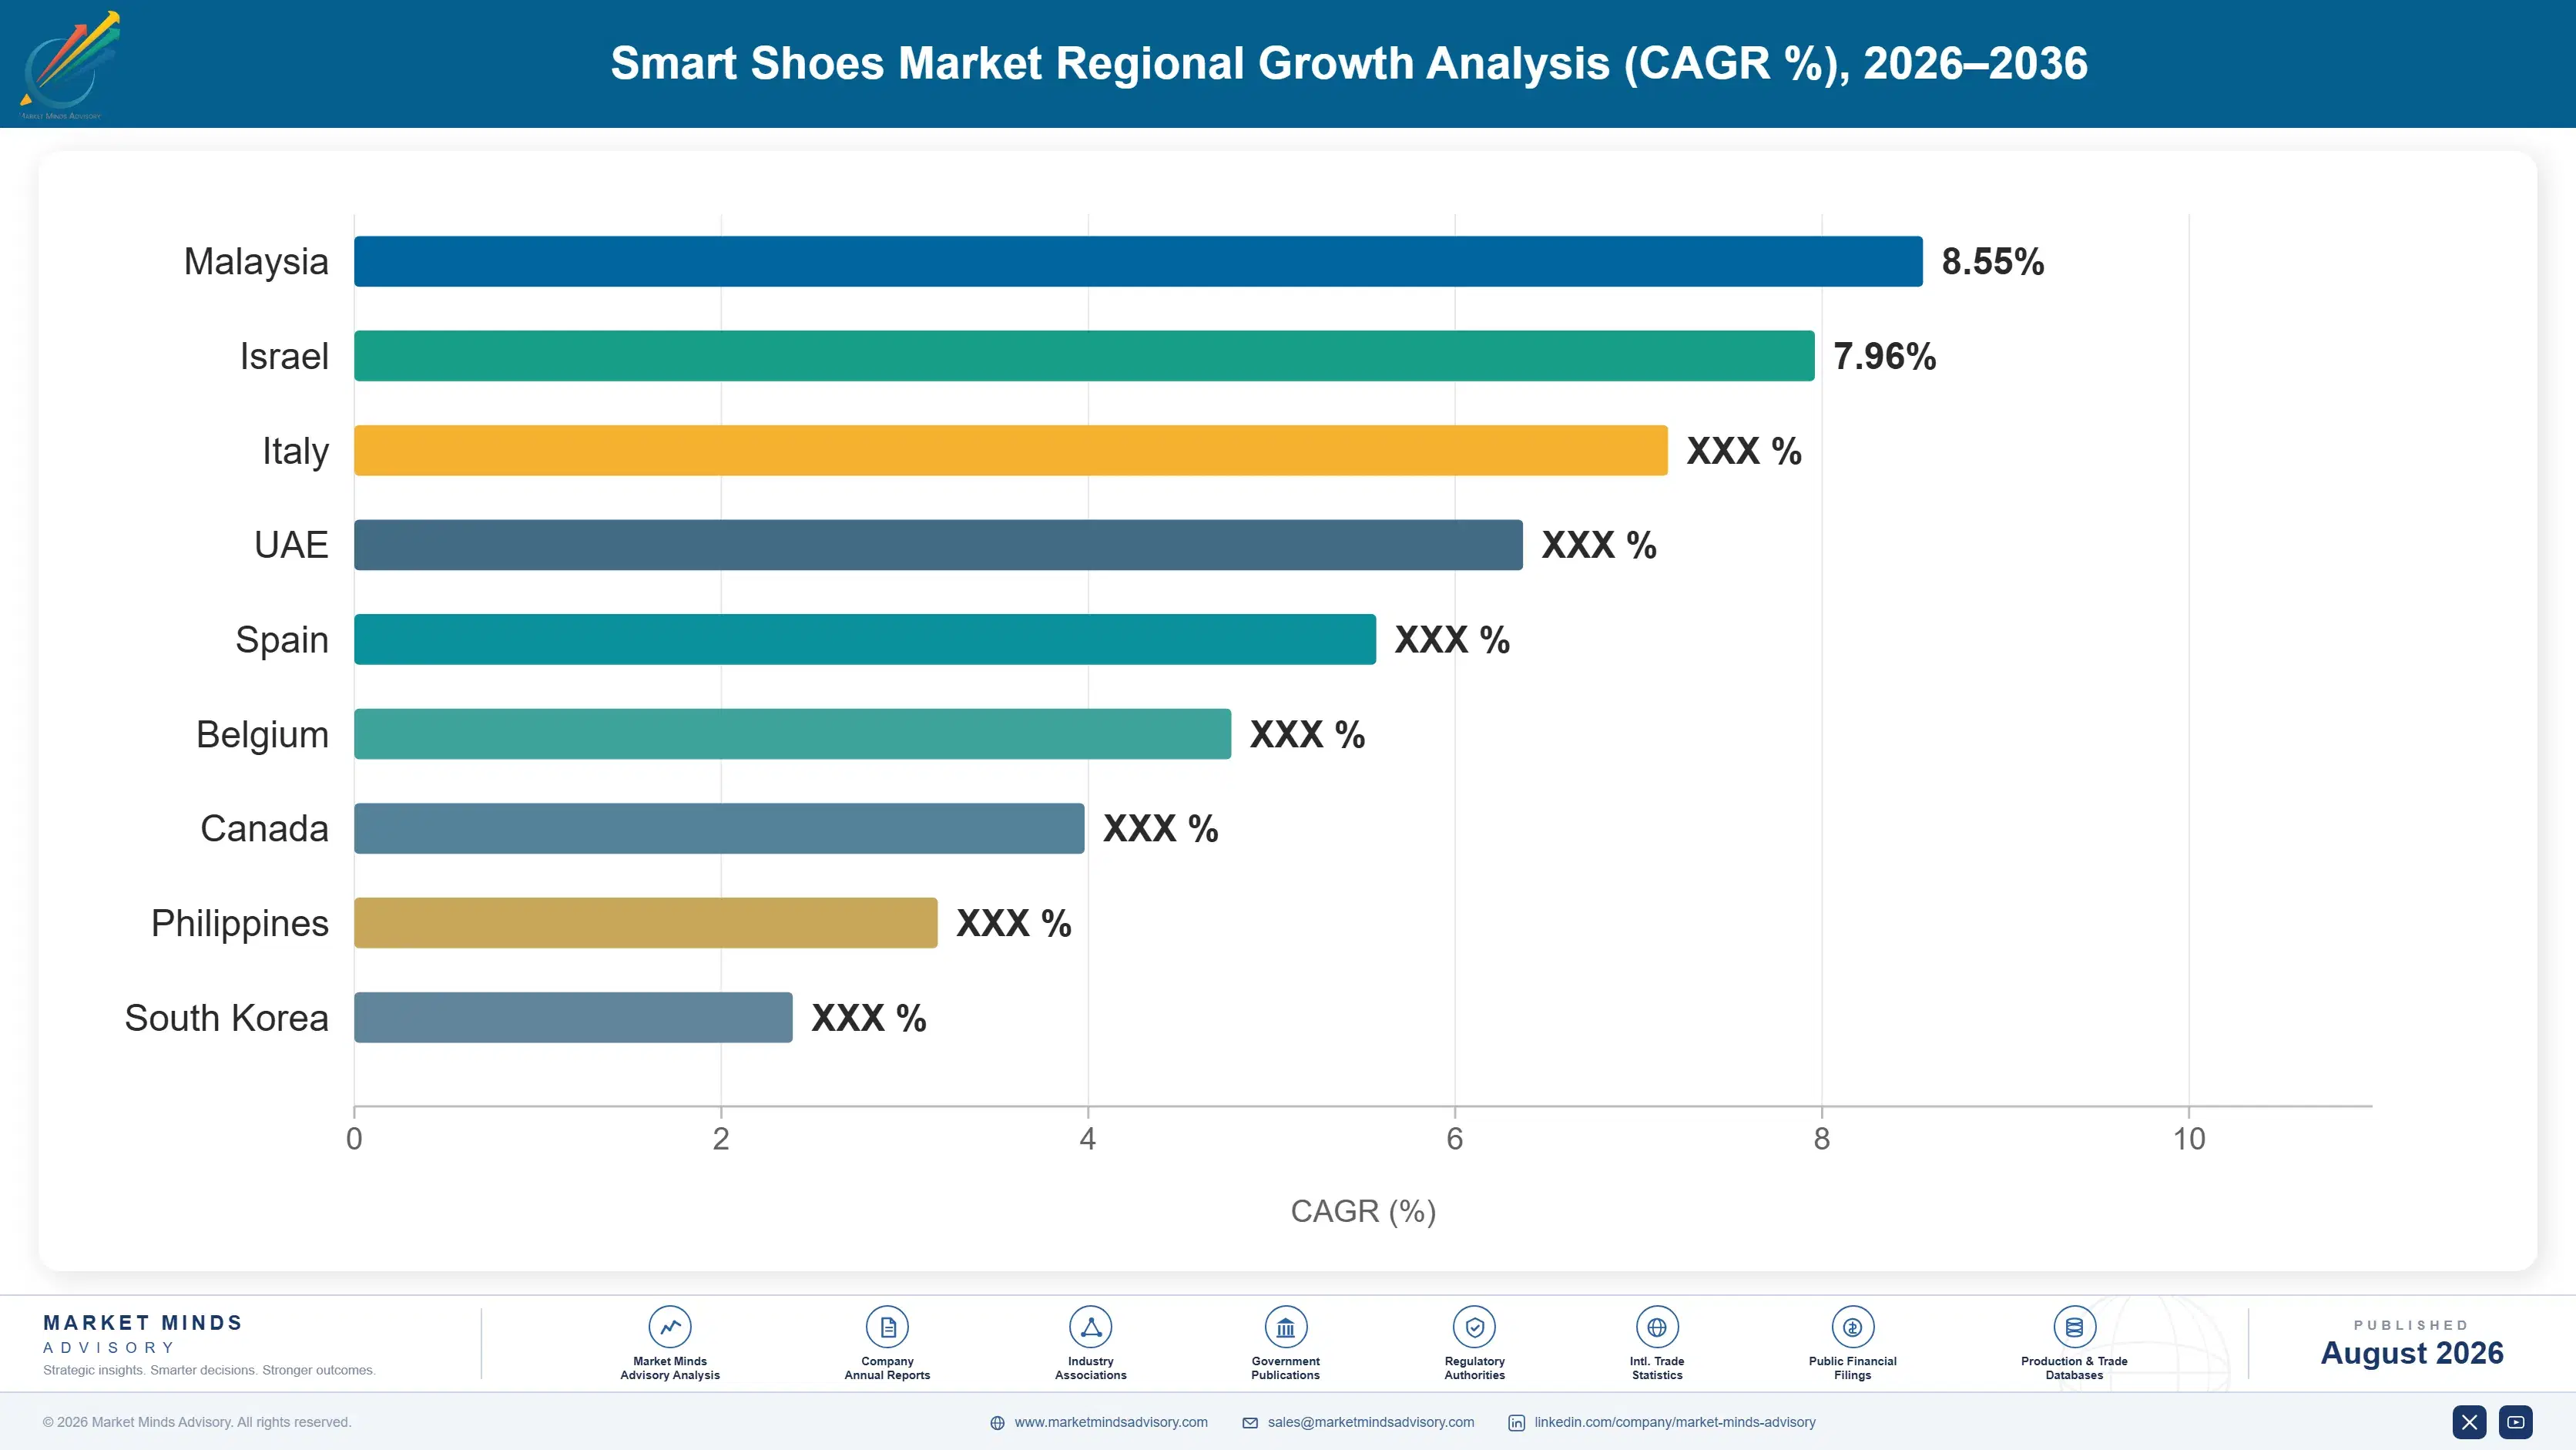
smart-shoe-market-country-cagr-analysis-1788166877278

Where Smart Shoe Manufacturers Capture Margin

Four levers stand out for manufacturers navigating a market shifting toward health monitoring sensors and self-lacing technology across nearly every channel today and geography served. Each trades traditional fitness-tracking scale for either sensor differentiation, convenience economics, or emerging market manufacturing access. Each requires different capabilities, but all four remain available to manufacturers already operating profitably.

Build Health Monitoring Sensor Calibration Capability

Manufacturers investing in proprietary pressure-mapping sensor calibration and validation technology that delivers accurate gait analysis capture meaningfully higher margin than those relying solely on basic step-counting formats sold at commodity pricing across most retail channels, price tiers, and geographic markets served worldwide. Calibration capability also generates valuable health data that informs future product development and clinical partnership decisions across product lines and future roadmaps. Manufacturers with established calibration capability are capturing roughly 18 percent of category revenue through this segment, considerably higher than basic-format average pricing power across comparable basic-format competitors tracked.
Market Impact: Captures roughly 18 percent of total category revenue

Expand Motorized Self-Lacing Engineering Investment Fast

Manufacturers investing in proprietary motorized lacing mechanisms that adjust fit automatically through companion app controls are capturing disproportionate share of the fastest-growing convenience segment, which continues expanding as consumers with mobility limitations pursue accessible footwear at scale across most demographic groups and income brackets. This capability requires sustained mechanical engineering investment that smaller competitors without dedicated research teams struggle to replicate quickly. Self-lacing revenue is growing at roughly 13 percent yearly, well ahead of the broader category average growth rate across all other formats combined across every measured retail channel tracked.
Market Impact: Grows self-lacing revenue share to 13 percent overall

Pursue Chinese Sensor Manufacturing Partnership Access

Manufacturers establishing production partnerships with Chinese sensor formulators capture meaningfully lower component and labor costs than competitors manufacturing exclusively in higher-cost Western facilities, while still serving both domestic Chinese demand and growing international export orders profitably across multiple continents, price tiers, retail formats, and consumer segments served. This capability requires sustained capital investment in quality assurance infrastructure that smaller regional competitors without comparable balance sheets struggle to justify quickly or confidently. Chinese manufacturing capacity is expanding at roughly 13 percent yearly, considerably faster than production capacity growth anywhere else globally.
Market Impact: Cuts production costs by roughly 13 percent overall

Develop Low-Power Battery Engineering Expertise Fast

Manufacturers that build proven low-power sensor design and extended battery capacity history can win retailer contracts considerably faster than competitors lacking comparable experience, since retailers increasingly prefer working with manufacturers already familiar with all-day battery-life documentation requirements from prior product launches spanning several years of consistent execution. Battery-ready manufacturers reduce average adoption hesitation timelines by roughly 4 months compared to first-time entrants navigating unfamiliar battery-life skepticism without established engineering relationships already in place. This capability compounds meaningfully across multiple simultaneous retail launches across several major regions and retail channels at once.
Market Impact: Cuts adoption hesitation timelines by roughly 4 months

Who Controls the Margin Pool

Five manufacturers hold roughly forty-five percent of market revenue, a moderately concentrated level reflecting how established athletic brand heritage and sensor integration expertise matter for high-value retail shelf placements. Nike and Under Armour lead on established athletic footwear and sensor technology expertise, with a modest gap separating them from Xiaomi's fast-growing manufacturing scale. No single manufacturer dominates across every product category and geographic market simultaneously.
Current competitive activity centers on three fronts: health monitoring sensor calibration investment as manufacturers race to capture preventive-care demand, motorized self-lacing engineering expansion aimed at winning convenience-focused consumer segments, and Chinese sensor manufacturing partnership development aimed at capturing lower-cost production advantages. Several manufacturers are also investing in dedicated low-power battery engineering teams separate from their established core manufacturing operations.

Emerging pressure comes from specialized wearable-tech entrants bringing sensor-integration capability that traditional mechanical-footwear-focused manufacturers find difficult to match without significant electronics investment. Rankings could shift meaningfully as health monitoring specification eventually rivals traditional fitness-tracking spending, since manufacturers currently over-indexed on legacy step-counting production may find their sensor pipeline underdeveloped once that shift accelerates further. Manufacturers slow to diversify beyond traditional fitness-tracking formats risk losing relevance within a few years.
smart-shoe-market-company-positioning-matrix-1788166877799

Competitive Moat and Risk Dimensions

NIKE

Moat: Broadest Athletic Brand Distribution Network

Nike maintains the broadest athletic footwear distribution network and brand recognition in the category, giving it shelf access that smaller sensor-native competitors struggle to replicate without years of brand relationship building across comparable national footprints and consumer trust built carefully over many decades of delivery.
NIKE

Risk: Slow Health Monitoring Sensor Pivot

Nike's self-lacing-first heritage has left its health monitoring sensor development less developed than newer sensor-native competitors, exposing it to gradual share erosion as preventive-care functionality increasingly determines premium retail shelf placement outcomes across most developed athletic markets globally, regionally, and locally over the coming years.
UNDER ARMOUR

Moat: Deep Athletic Performance Data Platform

Under Armour maintains an established athletic performance data platform spanning multiple connected device categories, giving it privileged access to recurring customer engagement that competitors without comparable data infrastructure struggle to access regardless of manufacturing scale or pricing flexibility currently extended to prospective buyers nationwide and abroad.
UNDER ARMOUR

Risk: Exposure to Sensor Cost Concentration

Under Armour's revenue concentration across a limited number of sensor component sourcing relationships leaves it more exposed than diversified competitors to any prolonged semiconductor supply disruption affecting production schedules across multiple facilities simultaneously and without adequate contingency planning currently in place across its entire network.

Players Tracked

Prominent Players

Nike
Under Armour
Xiaomi
Digitsole
Puma

Other Key Players

Adidas
New Balance
ASICS
Salomon
Sensoria
Moticon
RunScribe
Feetme
Zhor-Tech
Li-Ning
Anta Sports
Skechers
Reebok
Vivobarefoot
Orpyx

Recent Developments

MAY 2025

Under Armour Launches Health Monitoring Sensor Line

Under Armour launched a new health monitoring smart shoe line combining pressure-mapping sensors with gait analysis capability, targeting consumers pursuing preventive care insights across new product launches nationwide. The new formulation completed calibration testing ahead of schedule following an accelerated development partnership. Initial consumer interest has reportedly been strong.
Signal: Confirms that established manufacturers continue winning the largest overall share of health monitoring specification currently across most channels.
SEPTEMBER 2024

Nike Expands Motorized Self-Lacing Production Capacity

Nike expanded its motorized self-lacing production capacity specifically for premium retail applications, targeting retailers prioritizing convenience across new product launches nationwide and internationally. The expanded capacity specifically supports growing demand from consumers pursuing accessible footwear options. Full capacity comes online within the coming fiscal year.
Signal: Shows established manufacturers are investing directly in self-lacing production rather than ceding this ground to newer entrants.
JANUARY 2025

Xiaomi Announces Chinese Sensor Manufacturing Partnership

Xiaomi announced a manufacturing partnership with a domestic sensor formulator specifically to lower component costs, targeting growing demand from retailers seeking competitively priced smart shoe formats across most retail categories. The partnership specifically supports growing demand from cost-conscious retailers. Full production integration completes within the coming year.
Signal: Signals that established manufacturers are prioritizing Chinese manufacturing access ahead of anticipated demand growth considerably across export markets.

Sensor and Battery Cost Exposure

Pressure sensors, batteries, and specialty electronics components represent the largest cost-to-serve components for manufacturers, running roughly thirty-six to forty percent of total unit cost, with sensor calibration testing and firmware engineering labor adding a further fourteen percent on top of that base cost. Nearly all specialized pressure sensor stock originates from a concentrated group of producers in China, Japan, and South Korea.
Global semiconductor price volatility during 2022 pushed component costs higher across the wearable technology supply chain, a constraint several manufacturers' investor disclosures specifically cited as affecting margin on multiple product lines during that sustained period of elevated pricing across most regions and markets served. Manufacturers with diversified component sourcing navigated this period considerably more comfortably than those dependent on single-region suppliers exclusively for their needs.

Smaller regional manufacturers face proportionally heavier exposure to this cost pressure because they lack the purchasing volume that Nike, Under Armour, and Xiaomi can secure more easily through global procurement scale built over decades. Specialists without comparable purchasing power pay meaningfully higher per-unit component costs, compressing margin on price-sensitive retail contracts specifically, particularly where local currency weakness compounds the underlying cost pressure further.
smart-shoe-market-cost-volatility-analysis-1788166877995

Diversify Sensor Component Suppliers

Establishing relationships with multiple sensor suppliers across different producing regions rather than concentrating with a single vendor reduces exposure to shortages and pricing spikes, letting manufacturers shift orders when any single vendor faces capacity constraints during periods of tight global supply and rising freight costs. Manufacturers maintaining several supplier relationships weather shortages more comfortably.

Pursue Long-Term Component Supply Agreements

Negotiating multi-year component supply agreements ahead of anticipated demand surges protects against lead-time and pricing spikes that shorter-term procurement arrangements leave manufacturers exposed to during periods of industry-wide supply tightness and elevated freight costs across most regions, markets, and retail formats served broadly. Several smaller manufacturers have pursued exactly this kind of agreement successfully.

Invest in Low-Power Sensor Technology

Investing in low-power sensor technology that reduces dependency on the most constrained specialty component categories gives manufacturers genuine flexibility to manage supply disruptions without compromising device performance or battery life requirements across most product lines and formats offered. This approach also reduces long-term dependency on any single component supplier specifically and its associated pricing risk.

Portfolio Architecture for Margin Defence

Manufacturers architect their offering across three tiers that trade sensor complexity for margin in fairly predictable steps across the category. Standard fitness tracking and GPS-enabled devices anchor the volume tier at thin margin, app-connected athletic performance and smart safety devices occupy a premium middle tier, and health monitoring and self-lacing devices sit at the top as the smallest but fastest-expanding category overall.
The tension between volume and premium tiers reflects genuine technical difficulty rather than positioning alone: standard fitness tracking devices require comparatively conventional accelerometer integration and generate steady but thin-margin revenue, while health monitoring and self-lacing devices require considerably deeper sensor calibration and mechanical engineering expertise that only the most capable manufacturers can deliver reliably, which is why margin concentrates so heavily at the top.

The highest-value pools concentrate in health monitoring and self-lacing devices, both benefiting from genuine technical barriers that smaller, less capitalized manufacturers cannot easily replicate without years of dedicated engineering and validation investment. Manufacturers that misjudge this balance risk margin erosion in the volume tier or missed share in the premium tier. Getting this specific allocation exactly right across both requires disciplined capital planning informed by realistic demand forecasts.

Volume / Commodity-Adjacent Tier

Standard fitness tracking and GPS-enabled devices requiring comparatively conventional accelerometer integration, sold widely across mass retail channels with limited customization. Established manufacturers with long-standing brand recognition hold most of this volume base securely.
Gross Margin: 22-26%

Premium / Certified Tier

App-connected athletic performance and smart safety devices requiring deeper software integration and safety certification expertise than standard formats demand, sold mainly to specialty retail and commercial buyers. Certification depth separates this tier from lower-cost commodity competitors decisively.
Gross Margin: 32-36%

Sustainability / Regulatory / Next-Generation Tier

Health monitoring and self-lacing devices built on years of sensor calibration and mechanical engineering investment that smaller, less capitalized manufacturers cannot quickly replicate. Manufacturers positioned early in this tier gain durable qualification advantages as adoption accelerates.
Gross Margin: 40-46%
smart-shoe-market-portfolio-architecture-1788166878496

High-value Sub-segments and Strategic Watch-out

Health Monitoring Smart Shoes

Fastest-growing and highest-margin pool in the portfolio, driven by preventive-care demand, with margin concentrated among the handful of manufacturers building genuine sensor calibration capability across their entire product line and catalog. Manufacturers already qualified on flagship retail programs hold a durable multi-year advantage over new entrants.
Gross Margin: 40-46%

Self-Lacing Smart Shoes

High-value segment growing steadily on convenience demand, with margin concentrated among manufacturers offering established motorized engineering history across major retail channels nationwide and across several international markets as well. Regional distribution partnerships increasingly determine which manufacturers capture this expanding demand pool over the coming decade.
Gross Margin: 32-36%

Fitness Tracking Smart Shoes

Largest volume core segment by installed base, serving mass retail channels broadly across most developed and several emerging markets simultaneously, with margin moderate due to standardized pricing pressure across manufacturers. Pricing discipline and manufacturing efficiency, not innovation, determine competitive standing within this stable volume base.
Gross Margin: 22-26%

Basic Format Transition Risk

Strategic watch-out tied closely to consumer discretionary spending cycles, where a slowdown in retail demand could compress volume for manufacturers dependent on this basic-format manufacturing transition specifically across several major product categories. Manufacturers slow to diversify away from basic-format dependency face meaningful revenue concentration risk within a few years.
Gross Margin: 24-28%

Replacement Cycle Repeat Economics

Demand behaves closer to a replacement-cycle annuity than a single purchase once a consumer commits, because most consumers replace smart shoes only every twelve to eighteen months given sole wear alongside battery and sensor degradation, which locks manufacturers into a shorter replenishment window than standard footwear that supports steady accessory sales, app subscription revenue, and eventual full-unit upgrade purchases across multiple product generations.
Adoption stickiness varies meaningfully by end-use vertical: health-conscious consumers see the deepest retention because gait-tracking data accumulation becomes embedded in personal wellness routines that are difficult to abandon once established, while occasional fitness users churn more unpredictably based on seasonal exercise habits, and competitive athletes sit in between with moderate retention supported by performance-tracking continuity needs.

Generational buyer shifts favor health monitoring and self-lacing formats meaningfully: younger consumers expect app-based tracking and motorized convenience as a baseline purchase criterion rather than an optional upgrade reserved for higher budgets, whereas older buyers historically satisfied with basic fitness-tracking formats are gradually being pulled toward the same convenience format as manufacturers phase out limited standalone offerings entirely. This generational transition is reshaping retail merchandising strategy industry-wide.
smart-shoe-market-end-use-penetration-index-1788166878984

Where Value Concentrates Next

These are among the four positions where our research anticipates prominent divergence between winners and laggards over the coming forecast period. Each is grounded in the demand model, the regulatory perimeter, and the announced capacity pipeline.
01 / SENSOR CALIBRATION INVESTMENT

Health Monitoring Defines Category Leadership

Manufacturers that fail to build genuine pressure-sensor calibration and gait-analysis capability will lose share to health monitoring specialists over the next several years across nearly every retail channel tracked in this report. This segment already commands the fastest growth in the category, and its margin profile rewards the research investment that legacy fitness-tracking manufacturers have been slow to make even as consumer demand shifts decisively toward preventive care. Winning here requires sustained sensor spending across multiple product cycles, not a single feature addition.
02 / SELF-LACING ENGINEERING INVESTMENT

Motorized Convenience Rewards Early Investment

Self-lacing smart shoes offer the second-fastest growth trajectory in this market, anchored by convenience-driven consumer demand and mechanical engineering that most standard manufacturers have not yet mastered fully across comparable product lines and price tiers. Manufacturers without established motorized capability risk missing this expansion entirely as competitors increasingly capture accessibility-focused demand directly through dedicated product lines and marketing campaigns. Building this engineering capability now, well ahead of peak demand, positions early movers for durable share gains that late entrants will struggle to replicate quickly.
03 / CHINESE MANUFACTURING ACCESS

Production Cost Advantage Determines Global Competitiveness

China offers the fastest national growth trajectory in this market, anchored by expanding sensor manufacturing capacity and lower component and labor costs than most Western facilities can match today. Manufacturers without established Chinese production partnerships risk missing this cost advantage entirely as competitors increasingly relocate capacity to capture it directly and pass savings to retail buyers. Building these manufacturing relationships now, well ahead of peak demand, positions early movers for durable margin gains that late entrants will struggle to replicate quickly.
04 / BATTERY ENGINEERING DEPTH

Low-Power Design Separates Category Leaders

Manufacturers carrying deeper low-power sensor design and extended battery capacity history win retailer contracts meaningfully faster than competitors lacking comparable engineering experience or testing relationships built over considerable time and effort across multiple markets. Manufacturers underinvesting in battery engineering expertise will find themselves increasingly confined to smaller regional contracts while competitors expand across multiple retail chains at a considerably faster pace nationwide. Building this battery-engineering credibility takes years, making it a durable barrier once established rather than something new entrants replicate quickly.

Engagement Snapshot From the Field

A live engagement with an industry participant carrying material or product regulatory and market exposure ahead of a defining policy shift, showing how our research translates into a defensible multi-year portfolio strategy.
MARKET MINDS ADVISORY · CLIENT ENGAGEMENT SUMMARY
Smart Shoes Producer Strategic Portfolio Review and Transition Roadmap 2026·Investment Scenario on Smart Shoes Exposure Evaluation 2025-26
CLIENT PROFILE
A mid-sized athletic footwear manufacturer with an established presence in traditional fitness-tracking devices sought to evaluate entry into the health monitoring smart shoe category ahead of an anticipated retail demand acceleration and rising consumer expectations for preventive care. The client had strong retail distribution relationships but no existing pressure-sensor calibration or gait-analysis firmware experience in this specific device category whatsoever.
STRATEGIC CHALLENGE
The client needed to determine whether to acquire a small sensor-calibration engineering team or partner with an existing health-tech development contractor, while facing genuine uncertainty about which retail tier, mass market or premium, would command stronger long-term shelf positioning given the category's rapid health-monitoring shift accelerating across the broader industry.
MMA APPROACH
MMA conducted primary interviews with athletic footwear retailers and analyzed sensor calibration development timelines across comparable wearable technology categories, benchmarking the client's existing manufacturing capability against the specific development pathway required for health monitoring shoes at each retail tier under consideration for near-term product launch and broader multi-year expansion planning.
KEY FINDINGS
  1. Sensor calibration partnership arrangements generated meaningfully faster time-to-market, roughly five months, compared to the fourteen-plus months an internal team build would have required from a standing start.
  2. Premium retail tier positioning commanded measurably stronger sell-through interest among the client's core customer demographic than mass-market pricing across every store location tested during the pilot program.
  3. Partnership development costs ran approximately eight to ten percentage points (client-reported, unverified by MMA) below what internal sensor team building would have eventually required once fully staffed.
  4. Existing retail distribution relationships translated into meaningful shelf-placement advantages once sensor functionality was integrated, reducing the client's expected go-to-market timeline by several months relative to a new-entrant scenario.
CLIENT PROFILE
A mid-sized athletic footwear manufacturer with an established presence in traditional fitness-tracking devices sought to evaluate entry into the health monitoring smart shoe category ahead of an anticipated retail demand acceleration and rising consumer expectations for preventive care. The client had strong retail distribution relationships but no existing pressure-sensor calibration or gait-analysis firmware experience in this specific device category whatsoever.
STRATEGIC CHALLENGE
The client needed to determine whether to acquire a small sensor-calibration engineering team or partner with an existing health-tech development contractor, while facing genuine uncertainty about which retail tier, mass market or premium, would command stronger long-term shelf positioning given the category's rapid health-monitoring shift accelerating across the broader industry.
MMA APPROACH
MMA conducted primary interviews with athletic footwear retailers and analyzed sensor calibration development timelines across comparable wearable technology categories, benchmarking the client's existing manufacturing capability against the specific development pathway required for health monitoring shoes at each retail tier under consideration for near-term product launch and broader multi-year expansion planning.
KEY FINDINGS
  1. Sensor calibration partnership arrangements generated meaningfully faster time-to-market, roughly five months, compared to the fourteen-plus months an internal team build would have required from a standing start.
  2. Premium retail tier positioning commanded measurably stronger sell-through interest among the client's core customer demographic than mass-market pricing across every store location tested during the pilot program.
  3. Partnership development costs ran approximately eight to ten percentage points (client-reported, unverified by MMA) below what internal sensor team building would have eventually required once fully staffed.
  4. Existing retail distribution relationships translated into meaningful shelf-placement advantages once sensor functionality was integrated, reducing the client's expected go-to-market timeline by several months relative to a new-entrant scenario.
RECOMMENDED STRATEGY
Phase 1: Phase one: partner with an established health-tech development contractor rather than building internal sensor capability from a standing start immediately. Phase 2: Phase two: prioritize premium retail tier positioning in initial product launches given demonstrated stronger customer demand across pilot test locations. Phase 3: Phase three: evaluate internal sensor engineering team investment only once partnership volume justifies the required capital equipment and staffing commitment.
OUTCOME
The client proceeded with a sensor calibration development partnership, reaching retail shelf placement roughly seven months faster than the internal-build pathway would have allowed under any realistic timeline. Early sell-through data (client-reported, unverified by MMA) suggested premium positioning outperformed the client's initial mass-market product concept meaningfully across every tracked store location.

Frequently Asked Questions

Foundational context covering the market sizes, CAGR, scope, country, region and competition that inform every finding below. This section is provided to cover basics and most often pre-purchase conversations, answered from the MMA Primary Research Dataset.

What is the current size of the Smart Shoes Market?

The market reached approximately 1.8 billion dollars in 2025. This figure reflects global revenue from fitness tracking, self-lacing, GPS, health monitoring, and app-connected smart shoes.

How large will the Smart Shoes Market be by 2036?

The market is projected to reach approximately 5.4 billion dollars by 2036, up from 1.99 billion dollars in 2026. That represents roughly a 2.71-fold expansion over the ten-year forecast period.

What is the CAGR for the Smart Shoes Market 2026 to 2036?

The market is expected to grow at a compound annual rate of 10.5 percent between 2026 and 2036. Bull and bear scenarios range from 9.2 to 11.8 percent.

Which segment is growing fastest?

Health monitoring smart shoes lead at 15.0 percent CAGR, well ahead of the 10.5 percent market average. Self-lacing smart shoes follow as the second-fastest segment at 13.0 percent.

Who are the major companies in the Smart Shoes Market?

Nike, Under Armour, Xiaomi, Digitsole, and Puma lead the category on a revenue-consistent basis. Together these five manufacturers hold roughly forty-five percent of global market revenue.

Which country is growing fastest?

China leads at 13.0 percent CAGR, driven by expanding sensor manufacturing capacity and rising domestic wearable technology adoption. This outpaces the broader East Asia regional average meaningfully.

Report Segmentation Architecture

The full report scope spans multiple orthogonal segmentation dimensions, with cross-tabulated demand data provided for each dimension pair. Coverage extends further to regional breakdowns, trend trajectories, and the competitive detail needed to support segment-level decision-making.
  • Fitness Tracking Smart Shoes
  • Self-Lacing Smart Shoes
  • GPS-Enabled Navigation Smart Shoes
  • Health Monitoring Smart Shoes
  • App-Connected Athletic Performance Shoes
  • Smart Safety and Industrial Footwear
  • Consumer Athletic and Fitness
  • Healthcare and Preventive Wellness
  • Industrial and Occupational Safety
  • Online Direct-to-Consumer
  • Retail and Specialty Distribution
  • Corporate and Institutional Procurement

By Region

  • North America
  • Western Europe
  • East Asia
  • South Asia and Pacific
  • Latin America
  • Middle East and Africa
  • Eastern Europe

Scope, Methodology, and Coverage

Every figure in this report is reproducible from documented input assumptions. The scope below maps the historical period, the forecast horizon, the segmentation dimensions, and the countries covered, alongside the underlying primary and qualitative methodology.
Historical Period
2020 to 2025
Forecast Period
2026 to 2036
Base Year
2025 (USD billions; MMA Primary Research Dataset, August 2026)
Market Definition
This report covers fitness tracking, self-lacing, GPS-enabled navigation, health monitoring, app-connected athletic performance, and smart safety and industrial footwear sold through retail, e-commerce, and specialty athletic channels. Standard athletic footwear without embedded electronics or connectivity features is excluded from this scope.
Quantitative Units
USD billions (current prices); unit shipment volume where disclosed
Segmentation Dimensions
By Embedded Functionality; By End-Use Industry; By Commercial Dimension; By Region
Regions Covered
North America, Western Europe, East Asia, South Asia and Pacific, Latin America, Middle East and Africa, Eastern Europe
Countries Covered
USA, China, Germany, France, UK, Japan, South Korea, India, Australia, Canada, Brazil, Mexico, Indonesia, Vietnam, Thailand, Malaysia, UAE, Saudi Arabia, South Africa, Nigeria, Turkey, Poland, Netherlands, Italy, Spain, Sweden, Switzerland, Argentina, Colombia, Singapore, and additional markets relevant to this sector
Key Companies Profiled
Nike, Under Armour, Xiaomi, Digitsole, Puma, Adidas, New Balance, ASICS, Salomon, Sensoria, Moticon, RunScribe, Feetme, Zhor-Tech, Li-Ning, Anta Sports, Skechers, Reebok, Vivobarefoot, Orpyx
Quantitative Methodology
Primary survey, n=3,800 respondents, Q4 2025, six countries; demand-side model with trade association cross-validation
Qualitative Methodology
47 expert interviews, Q4 2025; applied to validate demand model assumptions, identify emerging dynamics, and assess competitive positioning
Report Format
PDF and XLSX data workbook (Word format preview document)
Publisher
Market Minds Advisory
Report Code
MMA-2026-TEC-122
Published
August 2026
Contact
sales@marketmindsadvisory.com | www.marketmindsadvisory.com

Purchase the full Smart Shoes Market Report (2026 to 2036).

The full report delivers a comprehensive assessment of the smart shoes market across embedded functionality, end-use industry, and commercial distribution dimensions. It draws on primary survey data from 3,800 respondents and 47 expert interviews conducted in the fourth quarter of 2025. The report profiles twenty leading manufacturers with revenue-based competitive positioning, moat and risk analysis for the two category leaders, and detailed regional forecasts across all seven global regions. It also includes input cost analysis, portfolio margin architecture, and a strategic verdict identifying where value concentrates through 2036.
Ten-year revenue forecasts by product type
Regional market sizing across seven regions
Competitive benchmarking of twenty named manufacturers
Sensor and battery cost risk analysis
Portfolio margin architecture by product tier
Anonymized client case study with strategic recommendations

Built For The People Who Decide

From boardroom strategy to bench-side execution, this report is read cover-to-cover by leaders shaping the next decade of their industry, turning demand scenarios, market dynamics and valuation benchmarks into decisions.
CXOs/ Presidents/ VPs/ Managers
M&A and Corporate Development
Strategy Teams and R&D Heads
Procurement and Product Directors
Regulatory and Compliance Leaders
Investor Relations and Equity Analysts