Market Minds Advisory
Smart Sensor Market

Smart Sensor Market: Smart Sensor Market: Calibration Drift, Edge Processing Economics And Data Nobody Reads 2026 to 2036

Adding intelligence to a sensor moved the problem rather than solving it. A drifting sensor that reports confidently is worse than a dumb one, and calibration is what nobody budgeted for.

Lead Analyst

Published

September 2026

Make Smarter Decisions with Customized Research Insights

Request a free sample report and evaluate market opportunities, growth trends, and competitive dynamics relevant to your business needs.

2025 MARKET VALUE$47.3BMarket Size 2025
2036 FORECAST VALUE$124.7BBase Case , 2026 to 2036
CAGR 2026 TO 20369.2 %Bull 10.4% / Bear 8.0%
INCREMENTAL OPPORTUNITY$73.0BNet 10- year value creation
EXPANSION MULTIPLE2.41x2036 value over 2026 base
Strategic Levers
M&A Pipeline
Regional Outlook
Country Rankings
Competitive Intelligence
Segmental Deep-dive
Call-Us : 91 93563 13602

Executive Snapshot and Market Trajectory.

Adding intelligence to a sensor moved the problem rather than solving it. A drifting sensor that reports confidently is worse than a simple one that reports nothing, and calibration is the part almost nobody budgeted for at purchase. Roughly 11% of units are replaced annually for drift.
The market reaches USD 51.7 billion in 2026 and USD 124.7 billion by 2036, a 2.41 times expansion at 9.2% annually. Edge processing sensors with on-device inference grow at 13.8%, half again the market rate of 9.2%, because sending raw data upward costs more in bandwidth than the data is usually worth. East Asia holds 33% of shipment value on manufacturing concentration. Concentration across suppliers is unusually low.
Five suppliers hold 37% of shipment value, low for a components category, because industrial, automotive, consumer and medical sensing buyers rarely evaluate the same products. Bosch Sensortec, STMicroelectronics, TE Connectivity, Honeywell and Texas Instruments lead. Calibration stability over service life decides more repeat specifications than accuracy at delivery. Only around 19% of what these devices report reaches a system that acts on it. Multi-year field drift evidence is what wins the repeat specification.
Market Definition
This report covers smart sensors: sensing devices integrating signal conditioning, digital output and on-device processing within the sensor package. It spans edge processing sensors with on-device inference, self-calibrating and diagnostic sensors, wireless smart sensor nodes, digital output pressure, temperature and flow sensors, inertial and motion sensing modules, and gas and environmental sensing modules. It excludes raw sensing elements without integrated conditioning, machine vision cameras, controllers and gateways, sensor fusion software sold separately, and complete instrumentation systems.
Base Year Value
$47.3B in 2025 (MMA Primary Research Dataset, September 2026)
Forecast Period
2026 to 2036, eleven discrete annual values
CAGR
9.2% base case. Bull 10.4%. Bear 8.0%.
Fastest Growth Segment
Edge Processing Sensors With On-Device Inference: 13.8% CAGR
Fastest Growth Country
India: 15.3% CAGR
Fastest Growth Region
South Asia and Pacific: 11.4% CAGR
Largest Region
East Asia: 33% of 2025 global value
Market Leaders
Bosch Sensortec, STMicroelectronics, TE Connectivity, Honeywell and Texas Instruments lead on smart sensor shipment value. Source: MMA Analysis.
Primary Survey
n=3,800 procurement and R&D decision-makers, Q4 2025, six countries
Methodology
Demand-side build-up, cross-validated against public data, 47 expert interviews

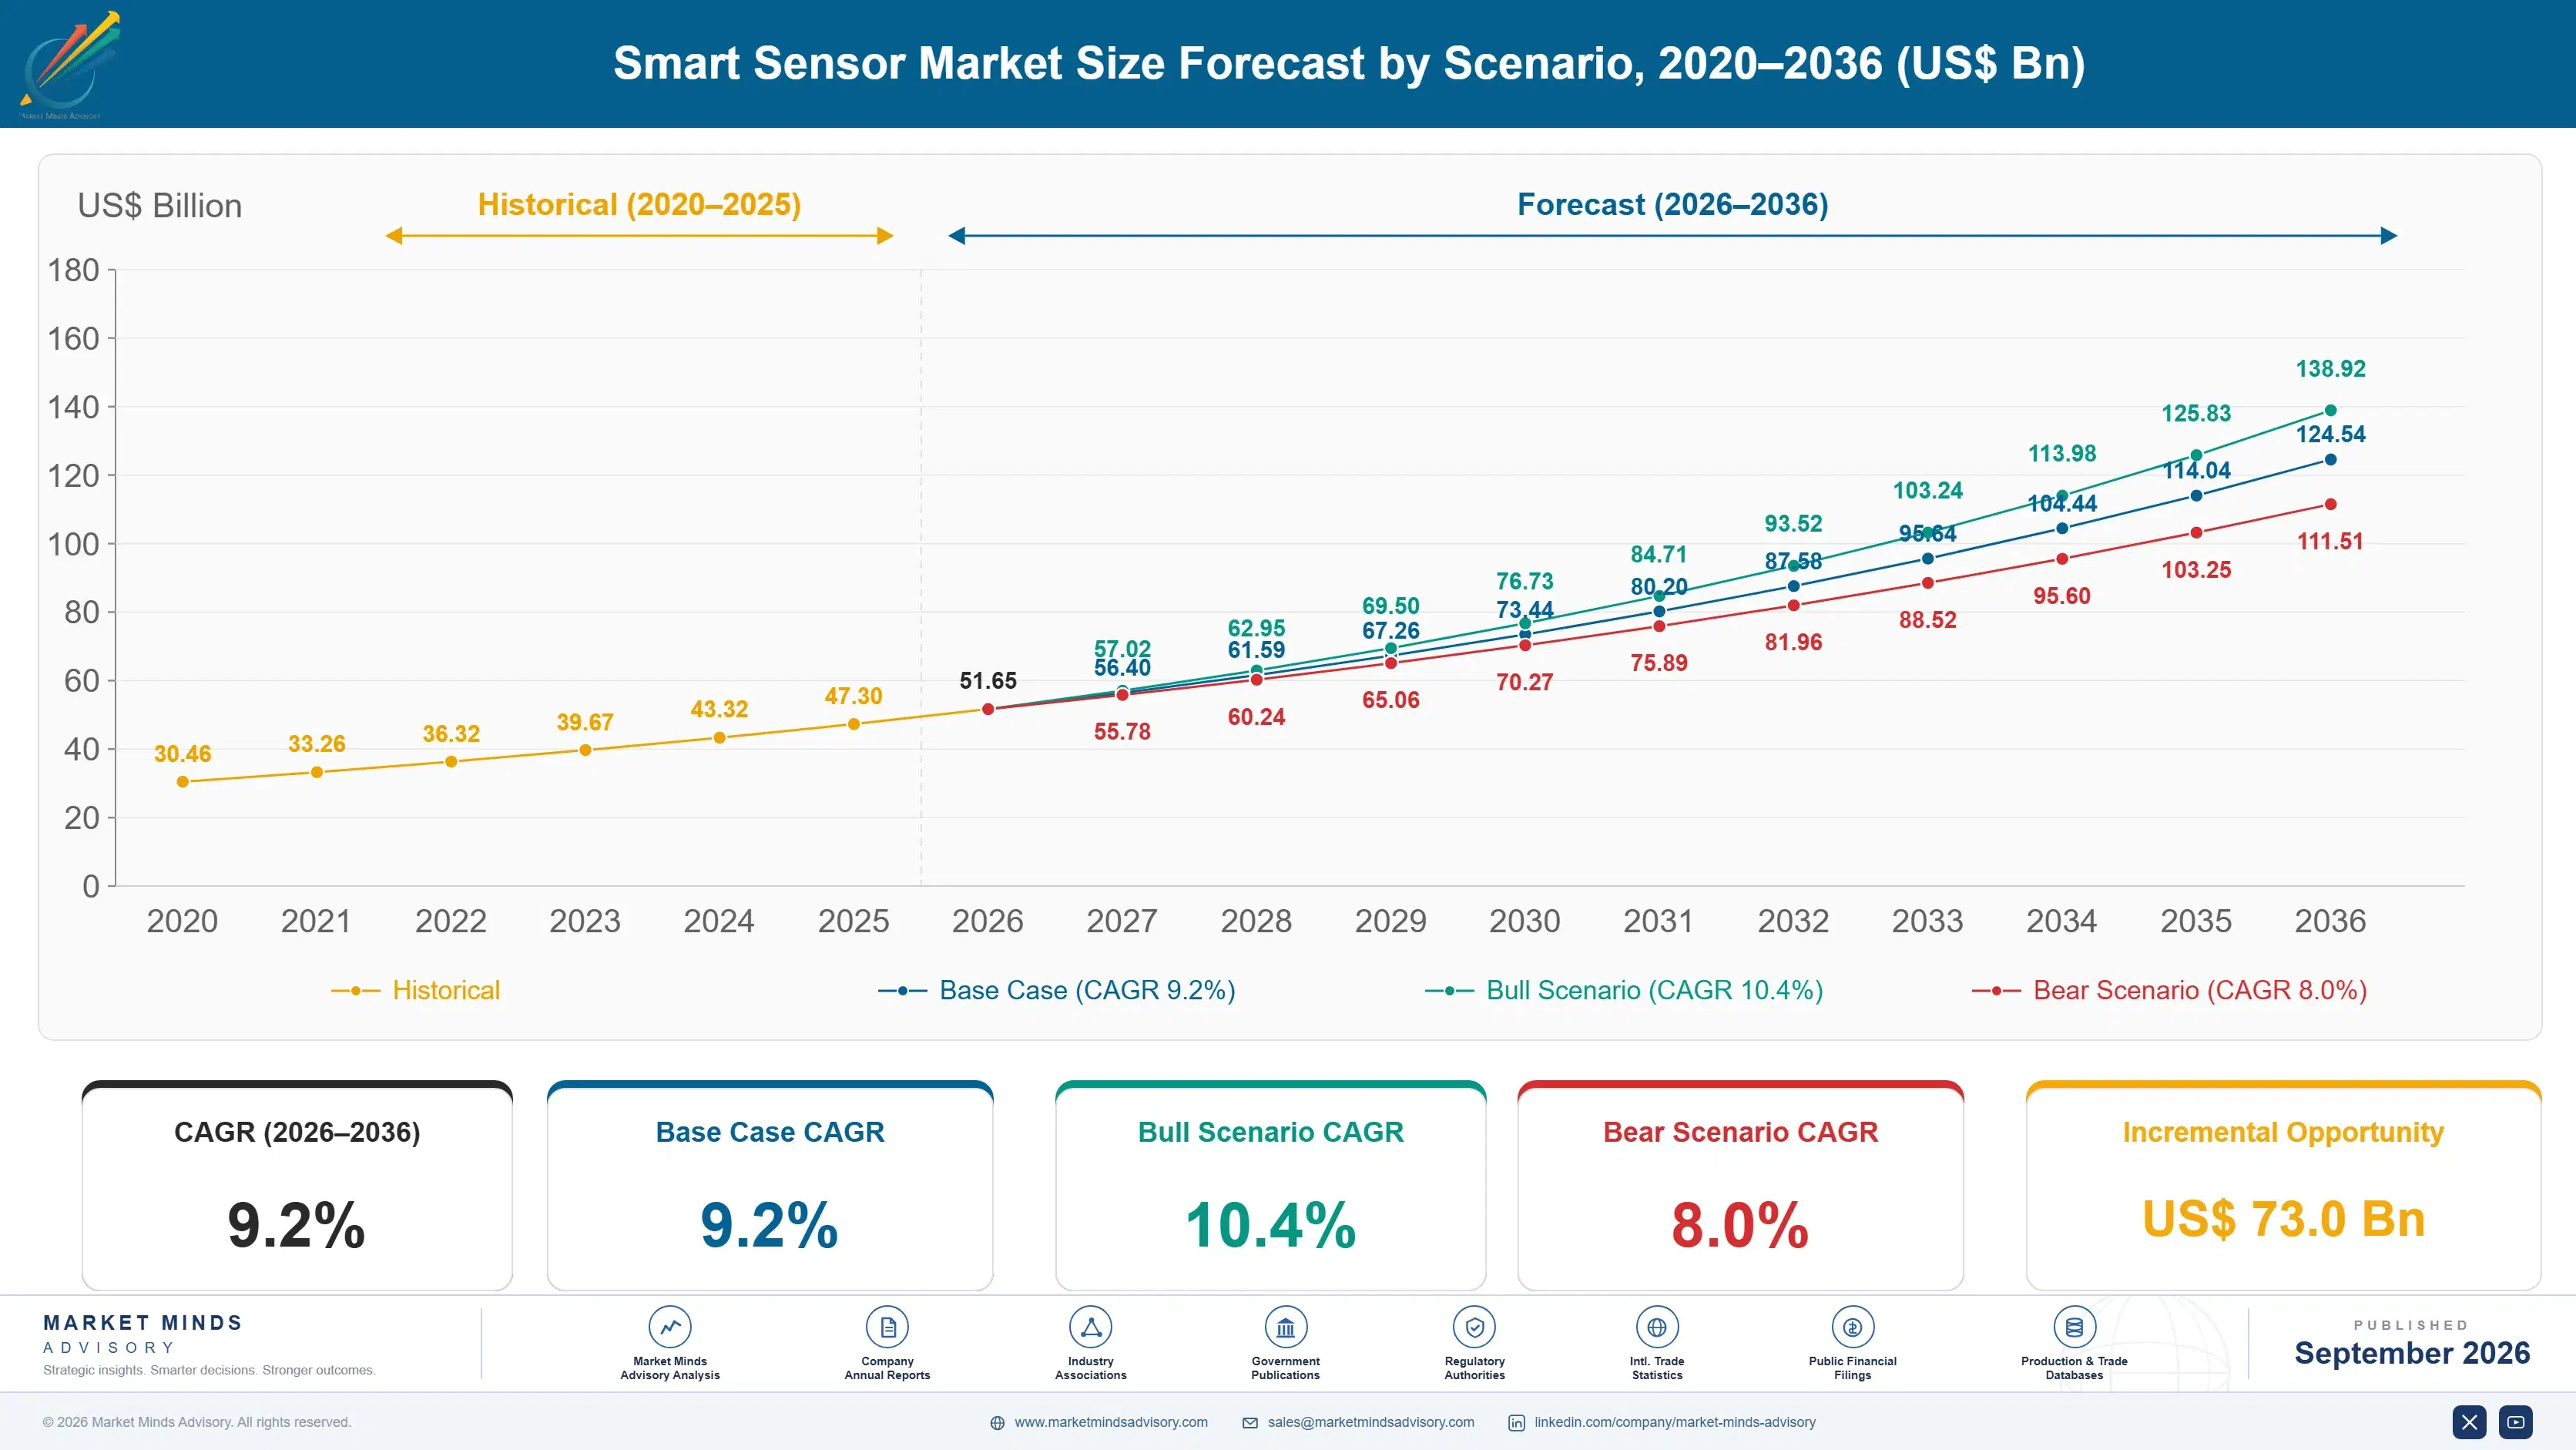
Smart Sensor Market Forecast Scenarios

smart-sensor-market-size-forecast-scenario-1789999121568
Between 2020 and 2025 the category compounded at 8.1%, and adoption ran ahead of usefulness. Buyers installed sensors that produced far more data than anything downstream could consume, and the parameters that would have justified the intelligence went unread. That gap did not slow purchasing, because the sensors were cheap and the alternative was measuring nothing. It did shape what buyers eventually asked for next time.
The base case holds 9.2% on three mechanisms. Edge processing keeps growing because transmitting raw data costs more in bandwidth and power than the data is usually worth. Self-calibration and diagnostics keep mattering as buyers discover what drift costs them across a service life. And automotive and industrial content per unit keeps rising in markets adding manufacturing and vehicle production rather than merely maintaining it. Those three mechanisms run largely independently of one another.
The bull case at 10.4% assumes on-device inference reaches price points that consumer and building applications can absorb at volume, which would expand the addressable base considerably. The bear case at 8.0% is component pricing compression, where Asian suppliers competing hard in digital output sensing pull average selling prices down faster than unit growth compensates for across the category.

Confident And Wrong Is Worse

A sensor that drifts while reporting confidently is worse than one that fails outright, because the failure is visible and the drift is not. Measurement error exceeds specified tolerance within around 14 months on typical devices, and roughly 11% of installed units are replaced annually for drift rather than failure. Buyers who specified on accuracy at delivery discover that accuracy at delivery was the wrong thing to specify on.
TOP FIVE CONCENTRATION37%Low for components, reflecting buyers evaluating different products
SENSOR DATA CONSUMED19%Parameters actually reaching a system that acts on them
CALIBRATION DRIFT WINDOW14 monthsBefore measurement error exceeds the tolerance a specification assumed
EDGE PROCESSING SHARE28%Devices performing inference locally rather than transmitting raw output
FIELD REPLACEMENT RATE11%Installed units replaced annually for drift rather than outright failure
AUTOMOTIVE CONTENT GROWTH7%Annual rise in sensing devices fitted per vehicle produced
Most of the data goes nowhere. Only around 19% of parameters a smart sensor produces reach a system that acts on them, because the intelligence was added to the sensor while nothing downstream was built to consume it. That is not a sensor problem. It explains why edge processing grows at 13.8% against 9.2% for the market: a sensor that decides locally needs nothing downstream at all.
Concentration is unusually low and stays that way. Five suppliers hold 37% of shipment value because industrial, automotive, consumer and medical buyers rarely evaluate the same devices, and qualification requirements differ enough that strength in one segment transfers poorly to another. Automotive sensing content per vehicle rises around 7% annually, which is where the most durable specifications and the longest supply commitments both sit.
"Buyers ask about accuracy at delivery and almost never about drift over three years. Then they replace eleven percent of the installed base annually and call it wear. The suppliers who win repeat business are the ones whose sensors are still telling the truth in year three."
Director, Sensing and Measurement Technology Practice · MMA Technology Practice · September 2026

Market Trends

Drift Rather Than Failure Drives Replacement Volume

Measurement error exceeds specified tolerance within around 14 months on typical devices, and roughly 11% of installed units are replaced annually for drift rather than outright failure. A sensor reporting confidently while wrong is worse than one that stops, because the failure is visible and the drift is not. Buyers specifying on accuracy at delivery discover they specified the wrong property, and suppliers whose devices hold calibration across a service life win the repeat specification. Field drift evidence takes years of installed base to accumulate, which favours incumbents over capable new entrants more decisively than any specification advantage does.
Market Impact: Vehicle content rises 7% annually
Edge Processing Removes The Downstream Dependency

Only around 19% of parameters a smart sensor produces reach a system that acts on them, because intelligence went into the sensor while nothing downstream was built to consume it. Edge processing sensors with on-device inference grow at 13.8% against 9.2% for the market precisely because a sensor deciding locally needs nothing downstream at all. Transmitting raw data also costs more in bandwidth and power than the data is usually worth to anybody. Suppliers selling parameter richness are selling something the customer's architecture cannot absorb at all. Local decisions need nothing at all.
Market Impact: India compounds at 15.3% yearly

Market Opportunities and Growth Drivers

Vehicle Sensing Content Rises Every Model Cycle

Sensing devices fitted per vehicle rise around 7% annually as driver assistance, electrification and cabin monitoring each add measurement points that previous vehicle generations never carried. Automotive qualification takes years and commits a supplier across a model programme, which makes those specifications the most durable in this category. India compounds at 15.3% partly on vehicle production growth alongside industrial capacity addition, and both demand the same qualification depth. A model programme specification locked in stays locked for the full production life, which makes early qualification disproportionately valuable to whoever obtains it first.
Market Impact: Just 19% of parameters used

Asian Manufacturing Capacity Adds Industrial Sensing Points

India compounds at 15.3%, ahead of every other market, as manufacturing capacity is added rather than maintained and each new line carries considerably more sensing points than the equipment it did not replace. East Asia holds 33% of shipment value on the same mechanism operating at larger scale. Suppliers positioned with machine builders and engineering contractors in those markets reach specification decisions that plant-focused competitors never encounter at all. Regional buyers there specify on delivered price more heavily than on calibration stability, which suits volume suppliers considerably. That shapes what actually wins there.
Market Impact: Top five hold only 37% today

Market Restraints and Challenges

Nothing Downstream Consumes What Sensors Produce

Only around 19% of parameters reach a system that acts on them, which undermines every argument built on the richness of what a smart sensor reports. The root cause is that intelligence was added at the sensor while the systems meant to use it were separate projects nobody funded. Commercially this caps what buyers will pay for capability. Mitigation runs through on-device inference that needs no downstream system, through preconfigured diagnostics, and through outputs shaped to existing control inputs. On-device inference is the only one of those that removes the dependency rather than working around it.
Market Impact: Around 11% replaced yearly for drift

Digital Output Pricing Compresses Under Asian Competition

Asian suppliers compete hard in digital output pressure, temperature and flow sensing where qualification barriers are lowest, which pulls average selling prices down faster than unit growth compensates. The root cause is that these devices have converged technically and differentiate mainly on cost. Commercially this compresses the volume half of the category. Mitigation runs through automotive and medical qualification barriers, through calibration stability claims buyers can verify, and through edge processing capability. Defending share in the lowest-barrier category means defending the least attractive part of this market against competitors whose cost bases are materially lower.
Market Impact: Only 19% of data is consumed
3 additional market trends, 4 additional growth drivers, and 2 additional restraints and challenges are covered in the full report. Contact sales@marketmindsadvisory.com to access the complete intelligence.

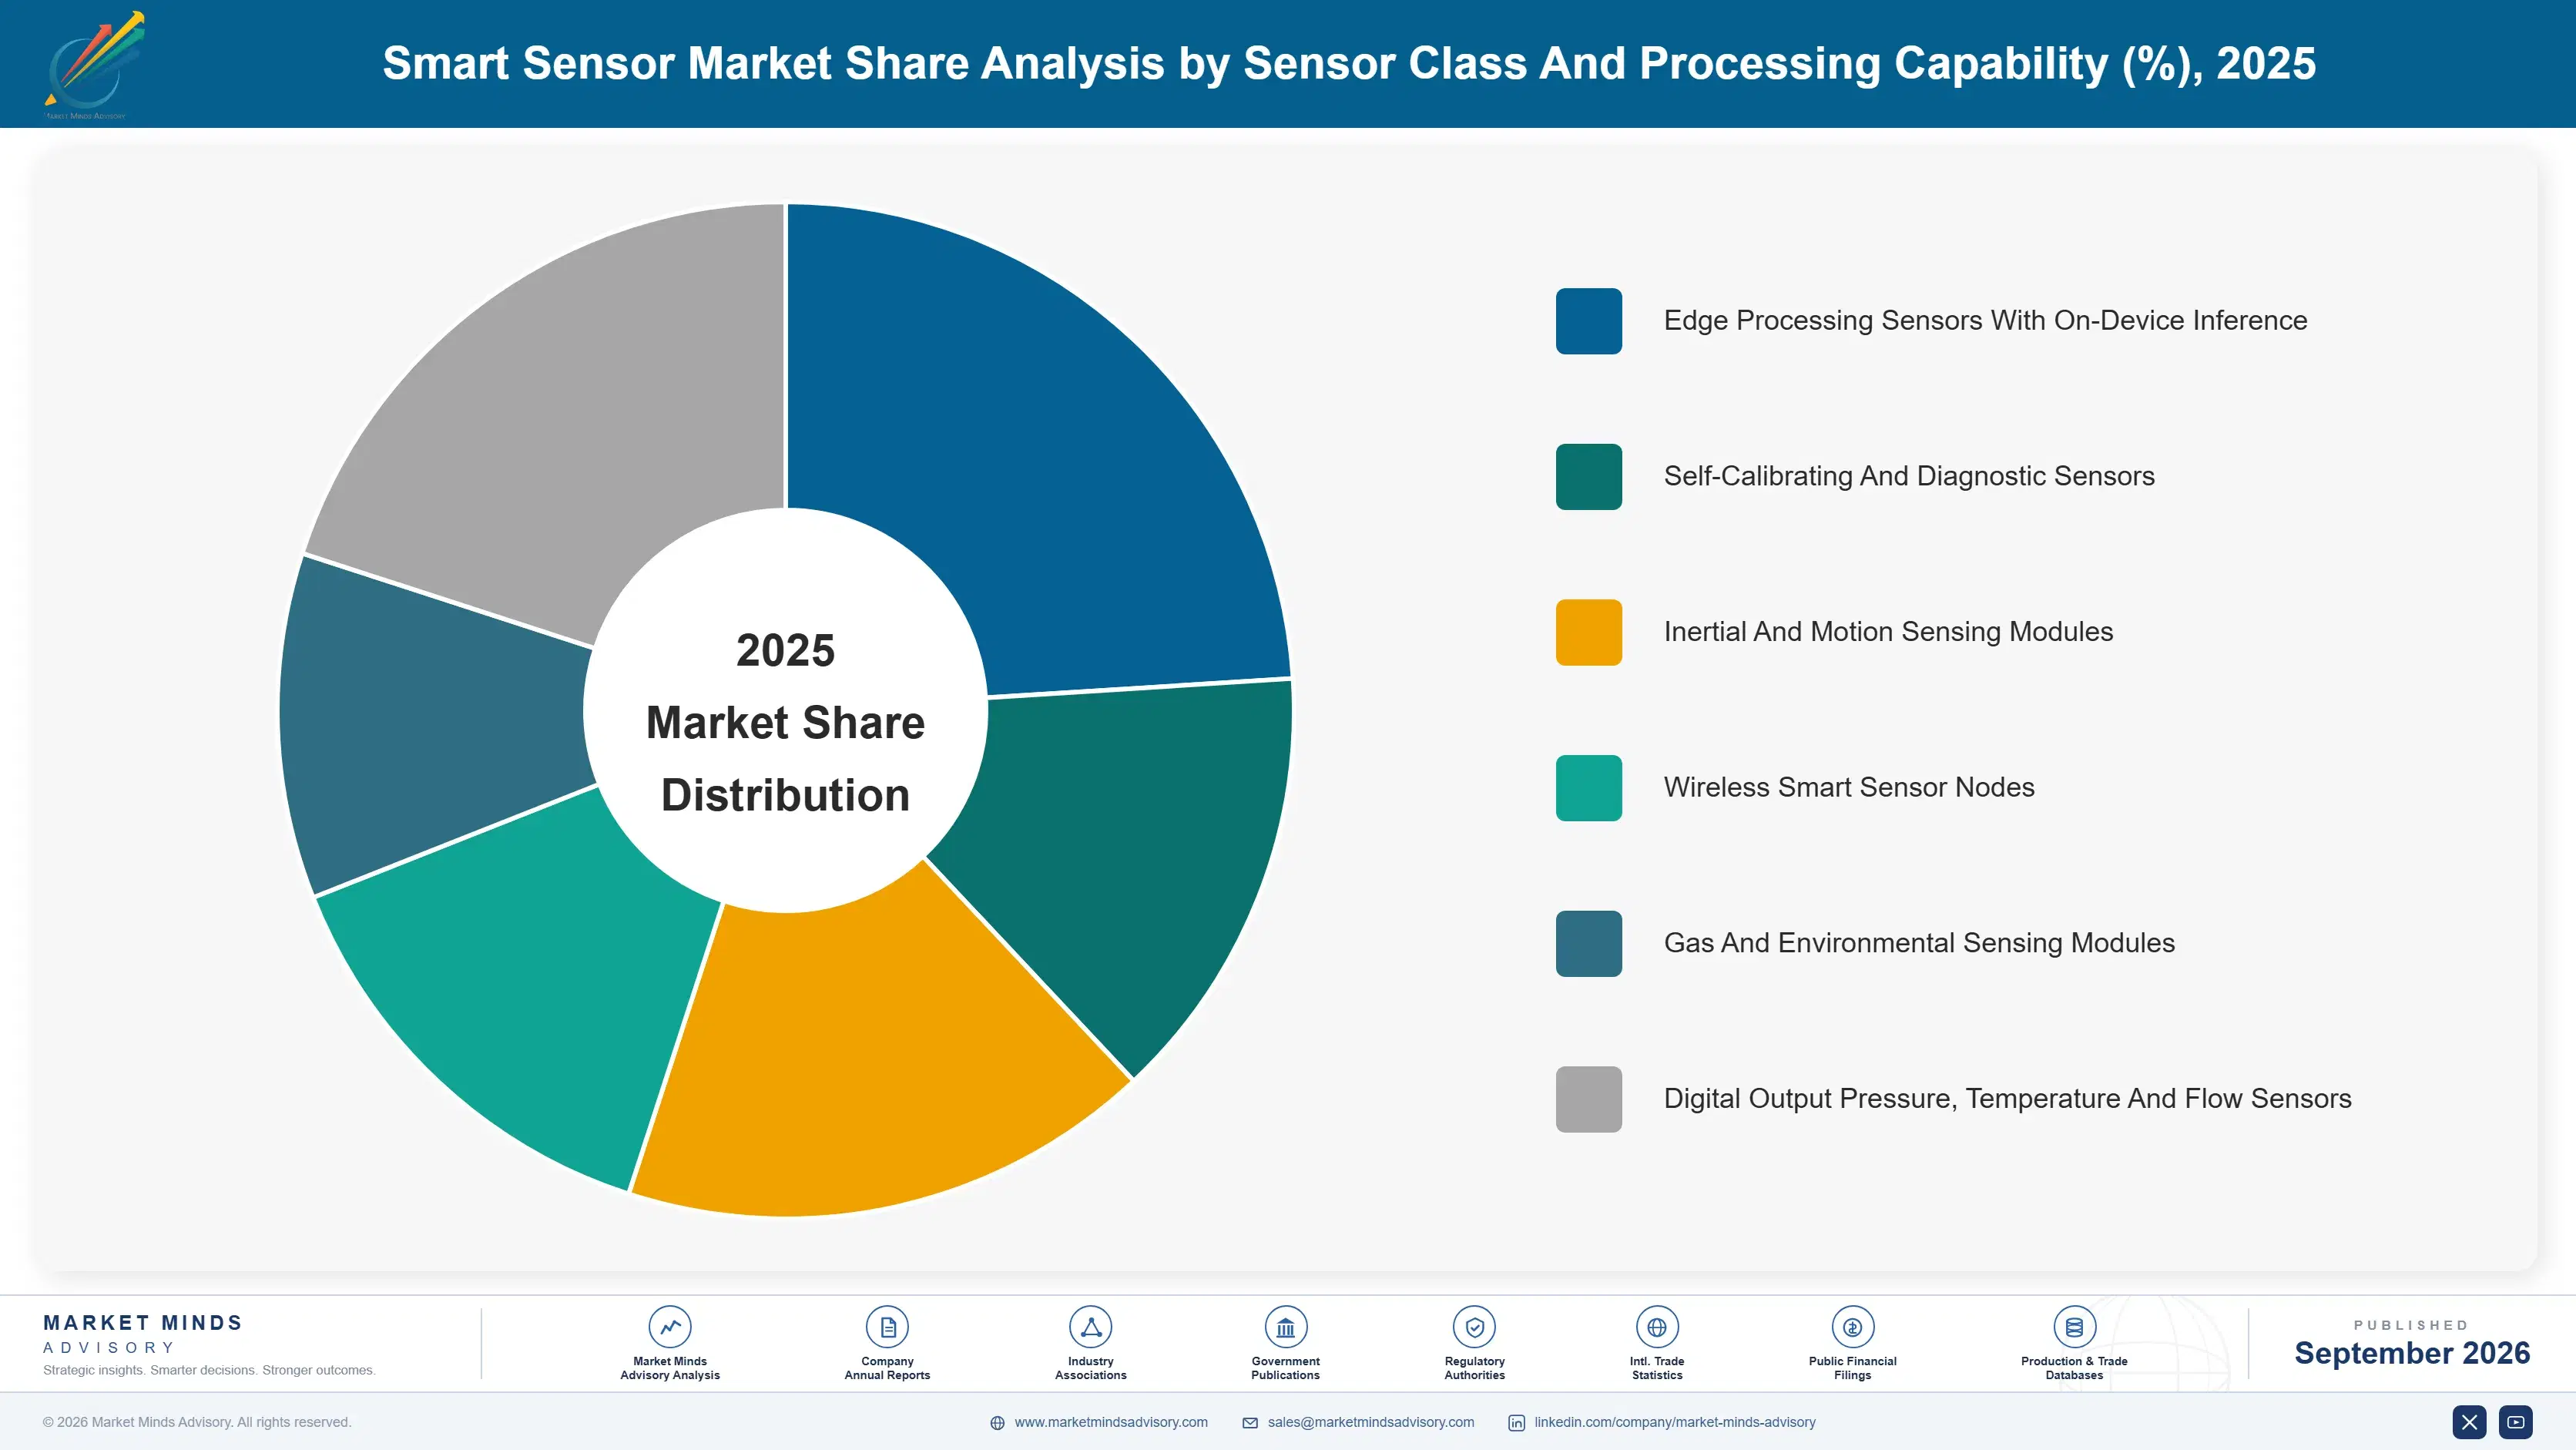
Segment CAGR and Growth Architecture

Segmentation follows sensor class and processing capability, since each carries quite different qualification burden, pricing exposure and calibration behaviour. Six classes cover the market: edge processing sensors with on-device inference, self-calibrating and diagnostic sensors, inertial and motion modules, wireless sensor nodes, gas and environmental modules, and digital output pressure, temperature and flow sensors. Industry and channel are separate dimensions.
smart-sensor-market-market-share-analysis-1789999122154

Edge Processing Sensors With On-Device Inference

Edge processing sensors with on-device inference grow at 13.8%, half again the market rate of 9.2%, because a sensor that decides locally needs nothing downstream and only around 19% of what smart sensors produce currently reaches any system that acts on it. Transmitting raw data also costs more in bandwidth and power than the data is usually worth. These devices carry higher pricing and considerably harder engineering than digital output sensing, which keeps Asian price competition out of the segment and protects margin that the volume half of this market has already lost. Engineering here sits closer to semiconductor design than to measurement, which is why volume component suppliers have struggled to enter it.
CAGR 13.8%

Self-Calibrating And Diagnostic Sensors

Self-calibrating and diagnostic sensors compound at 11.6% because measurement error exceeds specified tolerance within around 14 months on typical devices and roughly 11% of installed units are replaced annually for drift rather than failure. A sensor that reports its own confidence, or corrects itself, addresses the failure mode buyers only discover after they have specified on delivery accuracy. The capability commands better pricing and is difficult to claim credibly without field data that new entrants have not yet accumulated anywhere. Buyers who costed replacement against downtime specify on exactly this basis, and they are the customers worth holding across cycles rather than the ones who re-tender on unit price every year.
CAGR 11.6%
Full segment breakdown across 6 segments available in the complete report.

Regional Architecture and Country Demand Map

East Asia holds 33% of smart sensor shipment value, above the usual band, because electronics manufacturing, vehicle production and industrial capacity all concentrate there together. North America follows at 22% on automotive and industrial specification depth. India compounds fastest at 15.3% on manufacturing capacity addition.

East Asia

East Asia takes 33% of smart sensor shipment value, above the 30% band ceiling, because electronics manufacturing, vehicle production and industrial capacity all concentrate here together and reinforce one another. Chinese suppliers compete hard in digital output sensing where qualification barriers are lowest, which compresses pricing across the volume half of the category globally. Japanese and South Korean suppliers hold stronger positions in inertial and automotive qualified devices. Growth at 10.2% runs above the global rate on manufacturing and vehicle production volume. Regional buyers specify on delivered price more heavily than on calibration stability, which reinforces the same price competition their own suppliers are driving. Volume rather than value is the regional story.
Share: 33% | CAGR: 10.2% (2026 to 2036)

North America

North America accounts for 22% of shipment value, where automotive and industrial specification depth matters more than manufacturing volume does. Honeywell and Texas Instruments both operate substantial sensing businesses here, weighted toward qualified industrial and automotive devices rather than consumer volume. Edge processing adoption runs ahead of the global rate, partly because industrial buyers here already learned what unconsumed sensor data costs them. Growth at 9.6% sits above the global rate on edge processing conversion rather than volume. Industrial buyers here increasingly specify multi-year drift performance rather than delivered accuracy, which favours suppliers holding field data over any new entrant. Automotive tier one buyers here qualify suppliers across programmes that run for a decade or more.
Share: 22% | CAGR: 9.6% (2026 to 2036)
Regional intelligence for 5 additional markets available in the complete report: Western Europe, South Asia and Pacific, Latin America, Middle East and Africa, Eastern Europe. Contact sales@marketmindsadvisory.com.
smart-sensor-market-country-cagr-analysis-1789999122709

Where Sensor Specifications Are Won

Drift rather than failure drives replacement, most of what these devices report reaches nothing, and price competition has already taken the volume half of the category. The four levers below follow those conditions rather than any argument about measurement accuracy at delivery, which buyers over-weight. Each addresses a commercial condition rather than a measurement one.

Prove Calibration Stability, Not Delivery Accuracy

Measurement error exceeds specified tolerance within around 14 months on typical devices, and roughly 11% of installed units are replaced annually for drift rather than failure. Buyers specify on delivery accuracy and then pay for the consequence across a service life. Suppliers presenting multi-year field drift data reframe the comparison onto ground new entrants cannot occupy, because that data takes years of installed base to accumulate and cannot be simulated. Error passes tolerance within about 14 months on typical devices, and buyers who costed that replacement volume changed how they specify.
Market Impact: Around 11% now replaced yearly for calibration drift

Put The Decision In The Sensor Itself

Only around 19% of what a smart sensor reports reaches a system that acts on it, so capability arguments built on parameter richness reach buyers who cannot use the parameters. On-device inference removes the downstream dependency entirely and grows at 13.8% against 9.2% for the market. Suppliers selling data richness are selling something the customer's architecture cannot absorb, while those selling a local decision need nothing from it. That dependency is why so much capability goes unused. Buyers cannot use what they cannot process, and adding capability to the sensor did nothing about that.
Market Impact: Only 19% of all parameters are now consumed

Retreat From Digital Output Price Competition

Asian suppliers compete hard in digital output pressure, temperature and flow sensing where qualification barriers are lowest and devices have converged technically. That competition pulls average selling prices down faster than unit growth compensates. Suppliers defending share there are defending the least attractive part of this market, while automotive qualification, medical approval and edge processing all carry barriers that price competition alone cannot cross at all. Top five suppliers hold only 37% of shipment value, and almost none of that fragmentation sits in the segments carrying real barriers. Barriers rather than share are what matter.
Market Impact: Top five now hold just 37% of value

Qualify Automotive Before Content Growth Arrives

Sensing devices fitted per vehicle rise around 7% annually, and automotive qualification takes years while committing a supplier across a whole model programme once obtained. Those specifications are the most durable in this category by a wide margin. Suppliers qualifying ahead of content growth capture programmes that later entrants cannot bid for, since a model programme locked in stays locked for its full production life. Content per vehicle rises around 7% each year, so a programme won early compounds across every subsequent model cycle. Later entrants cannot bid programmes already locked.
Market Impact: Vehicle content now rises 7% every single year

Who Controls the Margin Pool

Five suppliers hold 37% of smart sensor shipment value, low for a components category, because industrial, automotive, consumer and medical buyers rarely evaluate the same devices and qualification requirements differ enough that strength in one transfers poorly. Bosch Sensortec, STMicroelectronics, TE Connectivity, Honeywell and Texas Instruments lead. All participants are assessed on smart sensor shipment value rather than on broader semiconductor or component businesses. Concentration has stayed low for a decade and shows no sign of consolidating, which reflects how differently those four buyer groups qualify what they purchase.
Competition runs on qualification depth and calibration stability far more than on delivered accuracy, which converges across serious suppliers. The second dimension is edge processing capability, since it carries pricing that digital output sensing has already lost and requires engineering that volume component suppliers have not built. Delivered accuracy competes a distant third.

Pressure is emerging from Asian suppliers in digital output sensing where qualification barriers are lowest, which compresses pricing across the volume half of the category. Rankings shift where automotive content grows and where manufacturing capacity is added, particularly across India, East Asia and Mexico. Suppliers concentrated in the lowest-barrier categories carry the most exposure to that compression.
smart-sensor-market-company-positioning-matrix-1789999123238

Competitive Moat and Risk Dimensions

BOSCH SENSORTEC

Moat: Automotive Qualification Depth

Bosch holds automotive sensing qualification across a very wide device range, and those specifications commit a supplier across a full model programme once obtained. Vehicle sensing content rises around 7% annually, which compounds the value of positions already held. Competitors entering later cannot bid programmes already locked, and qualification itself takes years that no amount of engineering effort compresses.
BOSCH SENSORTEC

Risk: Consumer Volume Exposure

Consumer sensing volume competes directly with Asian suppliers on price in categories where qualification barriers are lowest and devices have converged technically. Automotive depth does not defend that half of the business at all. Where consumer volume subsidises fixed cost, price compression there reaches the whole cost structure regardless of how strong the automotive position remains.
HONEYWELL

Moat: Industrial Calibration Position

Honeywell holds industrial process sensing positions where calibration stability over a service life matters more than delivered accuracy, and it holds field drift data new entrants cannot assemble. Roughly 11% of installed units are replaced annually for drift, which makes that data commercially valuable rather than merely technical. Buyers specify on exactly this basis.
HONEYWELL

Risk: Edge Processing Gap

Industrial calibration position addresses drift and not the separate problem that only around 19% of sensor output reaches anything. Edge processing grows at 13.8% against 9.2% for the market and requires engineering closer to semiconductor design than to sensing. A supplier strong on measurement quality and thin on local inference misses where growth concentrates.

Players Tracked

Prominent Players

Bosch Sensortec
STMicroelectronics
TE Connectivity
Honeywell
Texas Instruments

Other Key Players

Infineon Technologies
NXP Semiconductors
Analog Devices
Sensata Technologies
Omron
Murata Manufacturing
TDK InvenSense
Amphenol
Vishay Intertechnology
Melexis
ams OSRAM
Sensirion
Renesas Electronics
Panasonic Industry
Aceinna

Recent Developments

APRIL 2025

Industrial Buyers Specify Drift Performance Over Delivered Accuracy

Industrial process buyers increasingly specified multi-year calibration drift performance rather than delivered accuracy alone, a procurement development rather than any corporate transaction. Roughly 11% of installed units are replaced annually for drift rather than failure, and buyers who costed that discovered they had been specifying the wrong property entirely.
Signal: Field drift data takes years to accumulate, which favours incumbents heavily over any capable new entrant.
OCTOBER 2024

Edge Inference Sensors Reach Industrial Price Points

On-device inference capability reached price points that industrial applications could absorb at volume, a product development rather than any acquisition. Only around 19% of what smart sensors report reaches a system that acts on it, and local decision-making removes the downstream dependency that has limited value realisation.
Signal: A sensor deciding locally needs nothing downstream at all, which is why that segment grows fastest.
JULY 2025

Asian Suppliers Compress Digital Output Sensing Pricing

Asian suppliers expanded share in digital output pressure, temperature and flow sensing where qualification barriers are lowest, a competitive development rather than any corporate event. Those devices have converged technically and differentiate mainly on cost, which pulls average selling prices down faster than unit growth compensates for.
Signal: Defending the lowest-barrier category now means defending the least attractive part of this whole market today.

What A Smart Sensor Costs

Semiconductor content including signal conditioning and processing absorbs roughly 42% of device cost, sourced from foundries whose capacity is shared with far larger consumer and automotive demand. Sensing elements and packaging take around 23%, and hermetic or media-resistant packaging raises that considerably for process sensing. Calibration and test absorbs about 16%, with qualification and compliance taking the remaining balance.
Semiconductor availability tightened through 2022 and 2023 as consumer and automotive demand competed for the same fabrication capacity that sensing devices depend on at lower volumes. STMicroelectronics Annual Report 2024 and Sensata Technologies Annual Report 2024 both record component availability and qualification cost among principal operating variables. Suppliers holding multi-year foundry agreements met automotive programme commitments that competitors buying against orders could not. A missed programme commitment costs a specification locked for a model life.

The competitive disadvantage mechanism is calibration and test cost rather than semiconductor price. A supplier calibrating each device individually carries cost scaling directly with volume, while one designing self-calibration into the device does not. Exposure concentrates among suppliers in the highest accuracy categories, since precisely those devices demand the most individual calibration and compete in segments where price competition is now sharpest.
smart-sensor-market-cost-volatility-analysis-1789999123434

Design Self-Calibration Rather Than Testing Each Device

Calibration and test absorbs about 16% of device cost and scales directly with unit volume rather than staying flat. Designing self-calibration into the device converts a recurring production cost into product capability buyers pay a premium for. The engineering is demanding, and it addresses the drift driving roughly 11% annual replacement at the same time.

Contract Foundry Capacity Across Automotive Programmes

Semiconductor content absorbs roughly 42% of device cost from foundries whose capacity is shared with far larger consumer and automotive demand at higher volumes. Multi-year agreements secure allocation and support automotive programme commitments spanning years. Missing a programme commitment loses a specification locked for a full model life, which is the most expensive way to lose business in this category.

Share Packaging Platforms Across Sensing Ranges

Sensing elements and packaging absorb around 23% of device cost, and hermetic or media-resistant packaging carries tooling expensive relative to any single product's volume. Sharing packaging platforms across sensing ranges spreads that expense considerably further. The constraint is product management discipline, which erodes whenever ranges are developed independently by separate engineering teams working to separate schedules.

Portfolio Architecture for Margin Defence

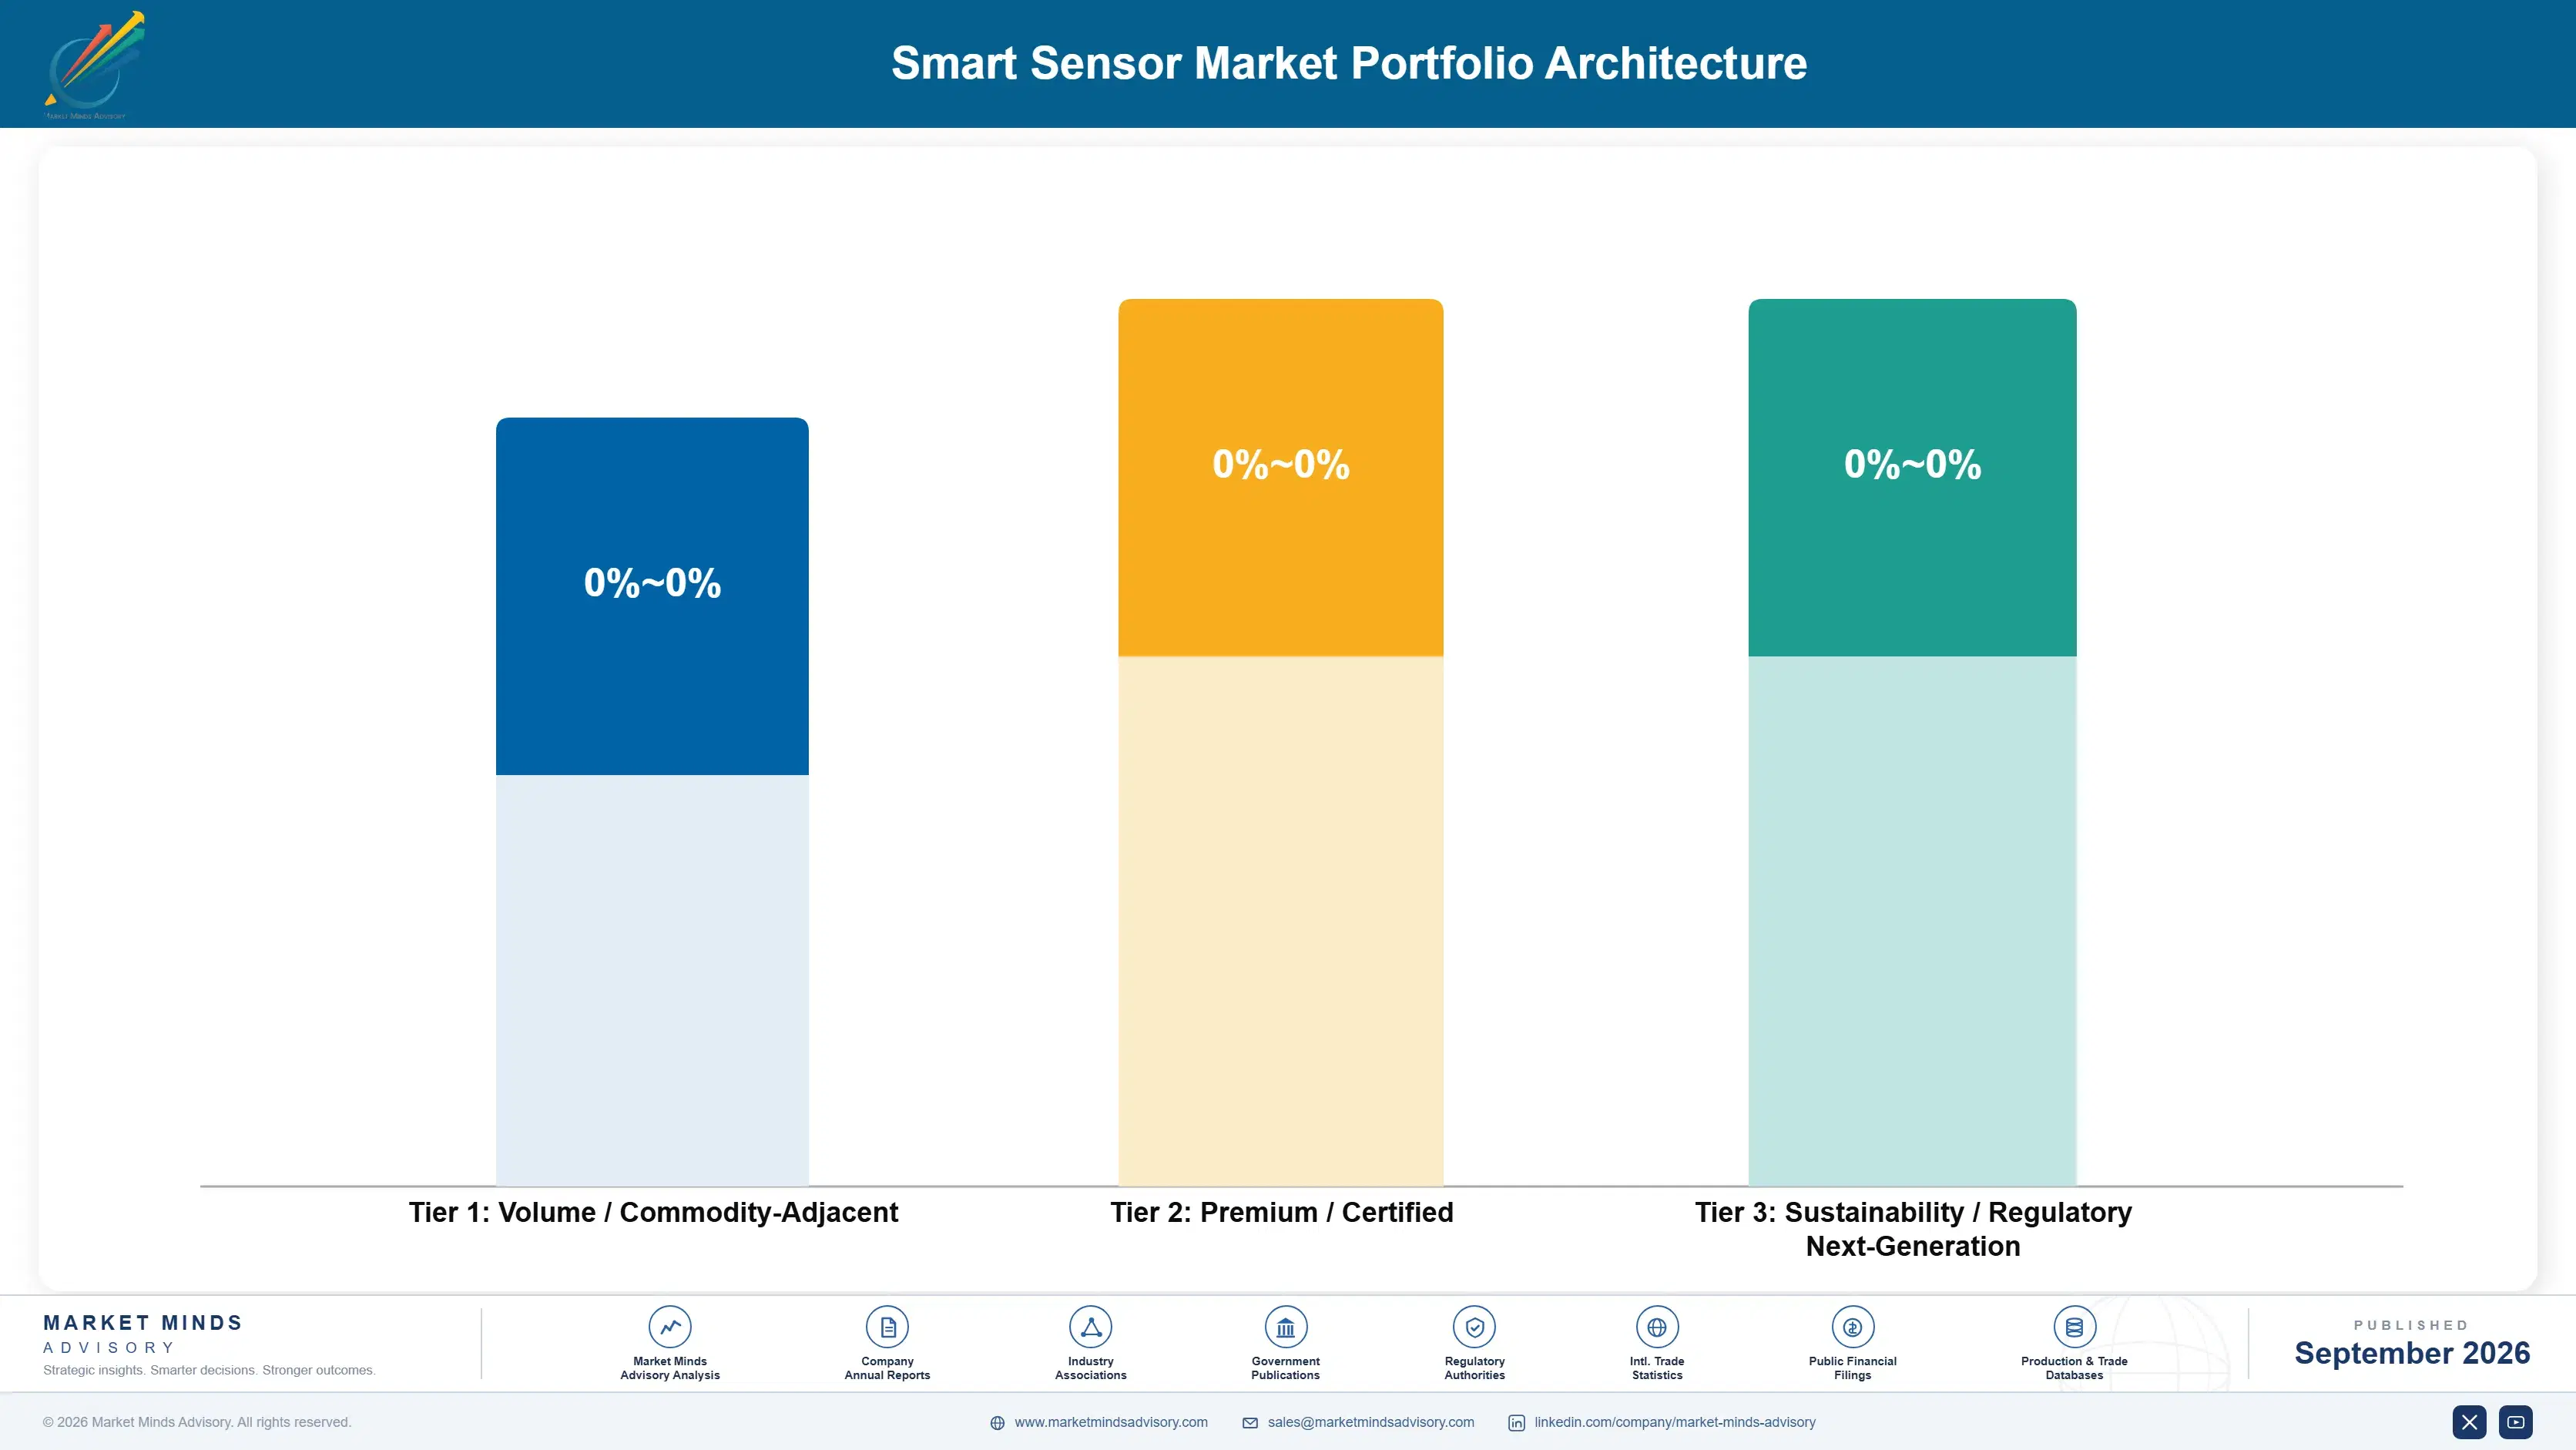
Margin architecture separates on qualification barrier rather than on measurement difficulty. Digital output pressure, temperature and flow sensors earn least, since devices have converged technically and Asian suppliers compete hard where barriers are lowest. Wireless nodes and environmental modules sit above on integration. Edge processing sensors, self-calibrating devices and automotive qualified inertial modules earn most, because each combines barriers with pricing that has not compressed.
The volume versus premium tension runs between digital output sensing and qualified capability, which reward opposite investment entirely. Volume requires manufacturing cost discipline against competitors with materially lower cost bases. Premium requires qualification, field drift data and processing engineering accumulated over years. Suppliers funding premium development from volume margin are watching that funding source compress faster than the premium business replaces it.

High-value pools concentrate in edge processing and in self-calibrating devices, and neither is reached through sensing capability alone. Edge processing requires engineering closer to semiconductor design than to measurement. Self-calibration requires field drift data accumulated across years of installed base. Both explain why concentration sits at only 37% while the barriers protecting the profitable segments remain considerably higher than the shipment shares suggest.

Volume / Commodity-Adjacent

Digital output pressure, temperature and flow sensors, where devices have converged technically and Asian suppliers compete hard in categories carrying the lowest qualification barriers anywhere. The twelve point spread separates suppliers sharing packaging platforms from those tooling each sensing range independently.
Gross Margin: 21% to 33%

Premium / Certified

Wireless smart sensor nodes and gas and environmental sensing modules, where integration depth and application specificity determine selection rather than unit price comparison alone. The thirteen point spread tracks how much of each supplier's calibration is designed into devices against tested individually per unit.
Gross Margin: 38% to 51%

Sustainability / Regulatory / Next-Generation

Edge processing sensors, self-calibrating and diagnostic devices and automotive qualified inertial modules, each combining barriers with pricing that has not compressed under Asian competition. The sixteen point spread reflects processing engineering depth and accumulated field drift data together.
Gross Margin: 56% to 72%
smart-sensor-market-portfolio-architecture-1789999123926

High-value Sub-segments and Strategic Watch-out

Edge Processing Sensors With On-Device Inference

Grows at 13.8% because a sensor deciding locally needs nothing downstream, and only 19% of output currently reaches anything. The sixteen point spread reflects processing depth. Engineering here sits closer to semiconductor design than to measurement work. Volume suppliers have struggled to enter it. Barriers hold firmly.
Gross Margin: 56% to 72%

Self-Calibrating And Diagnostic Sensors

Grows at 11.6% because roughly 11% of installed units are replaced annually for drift rather than outright failure. The sixteen point spread reflects field drift data. New entrants cannot claim stability credibly without years of installed base behind them. The data cannot be simulated at all.
Gross Margin: 56% to 72%

Inertial And Motion Sensing Modules

Grows at 9.9% on vehicle content rising around 7% annually alongside robotics and handling applications. The thirteen point spread reflects automotive qualification. Model programme specifications lock for a full production life once they are won. Qualification takes years to obtain in the first place. Programmes lock for years.
Gross Margin: 38% to 51%

Digital Output Pressure, Temperature And Flow Sensors

Grows at 5.4%, slowest of the six classes, as Asian suppliers compress pricing where qualification barriers are lowest anywhere. The twelve point spread reflects packaging platform sharing. Technical convergence leaves cost as almost the only remaining difference. Margin has already gone here. Cost is the only difference left.
Gross Margin: 21% to 33%

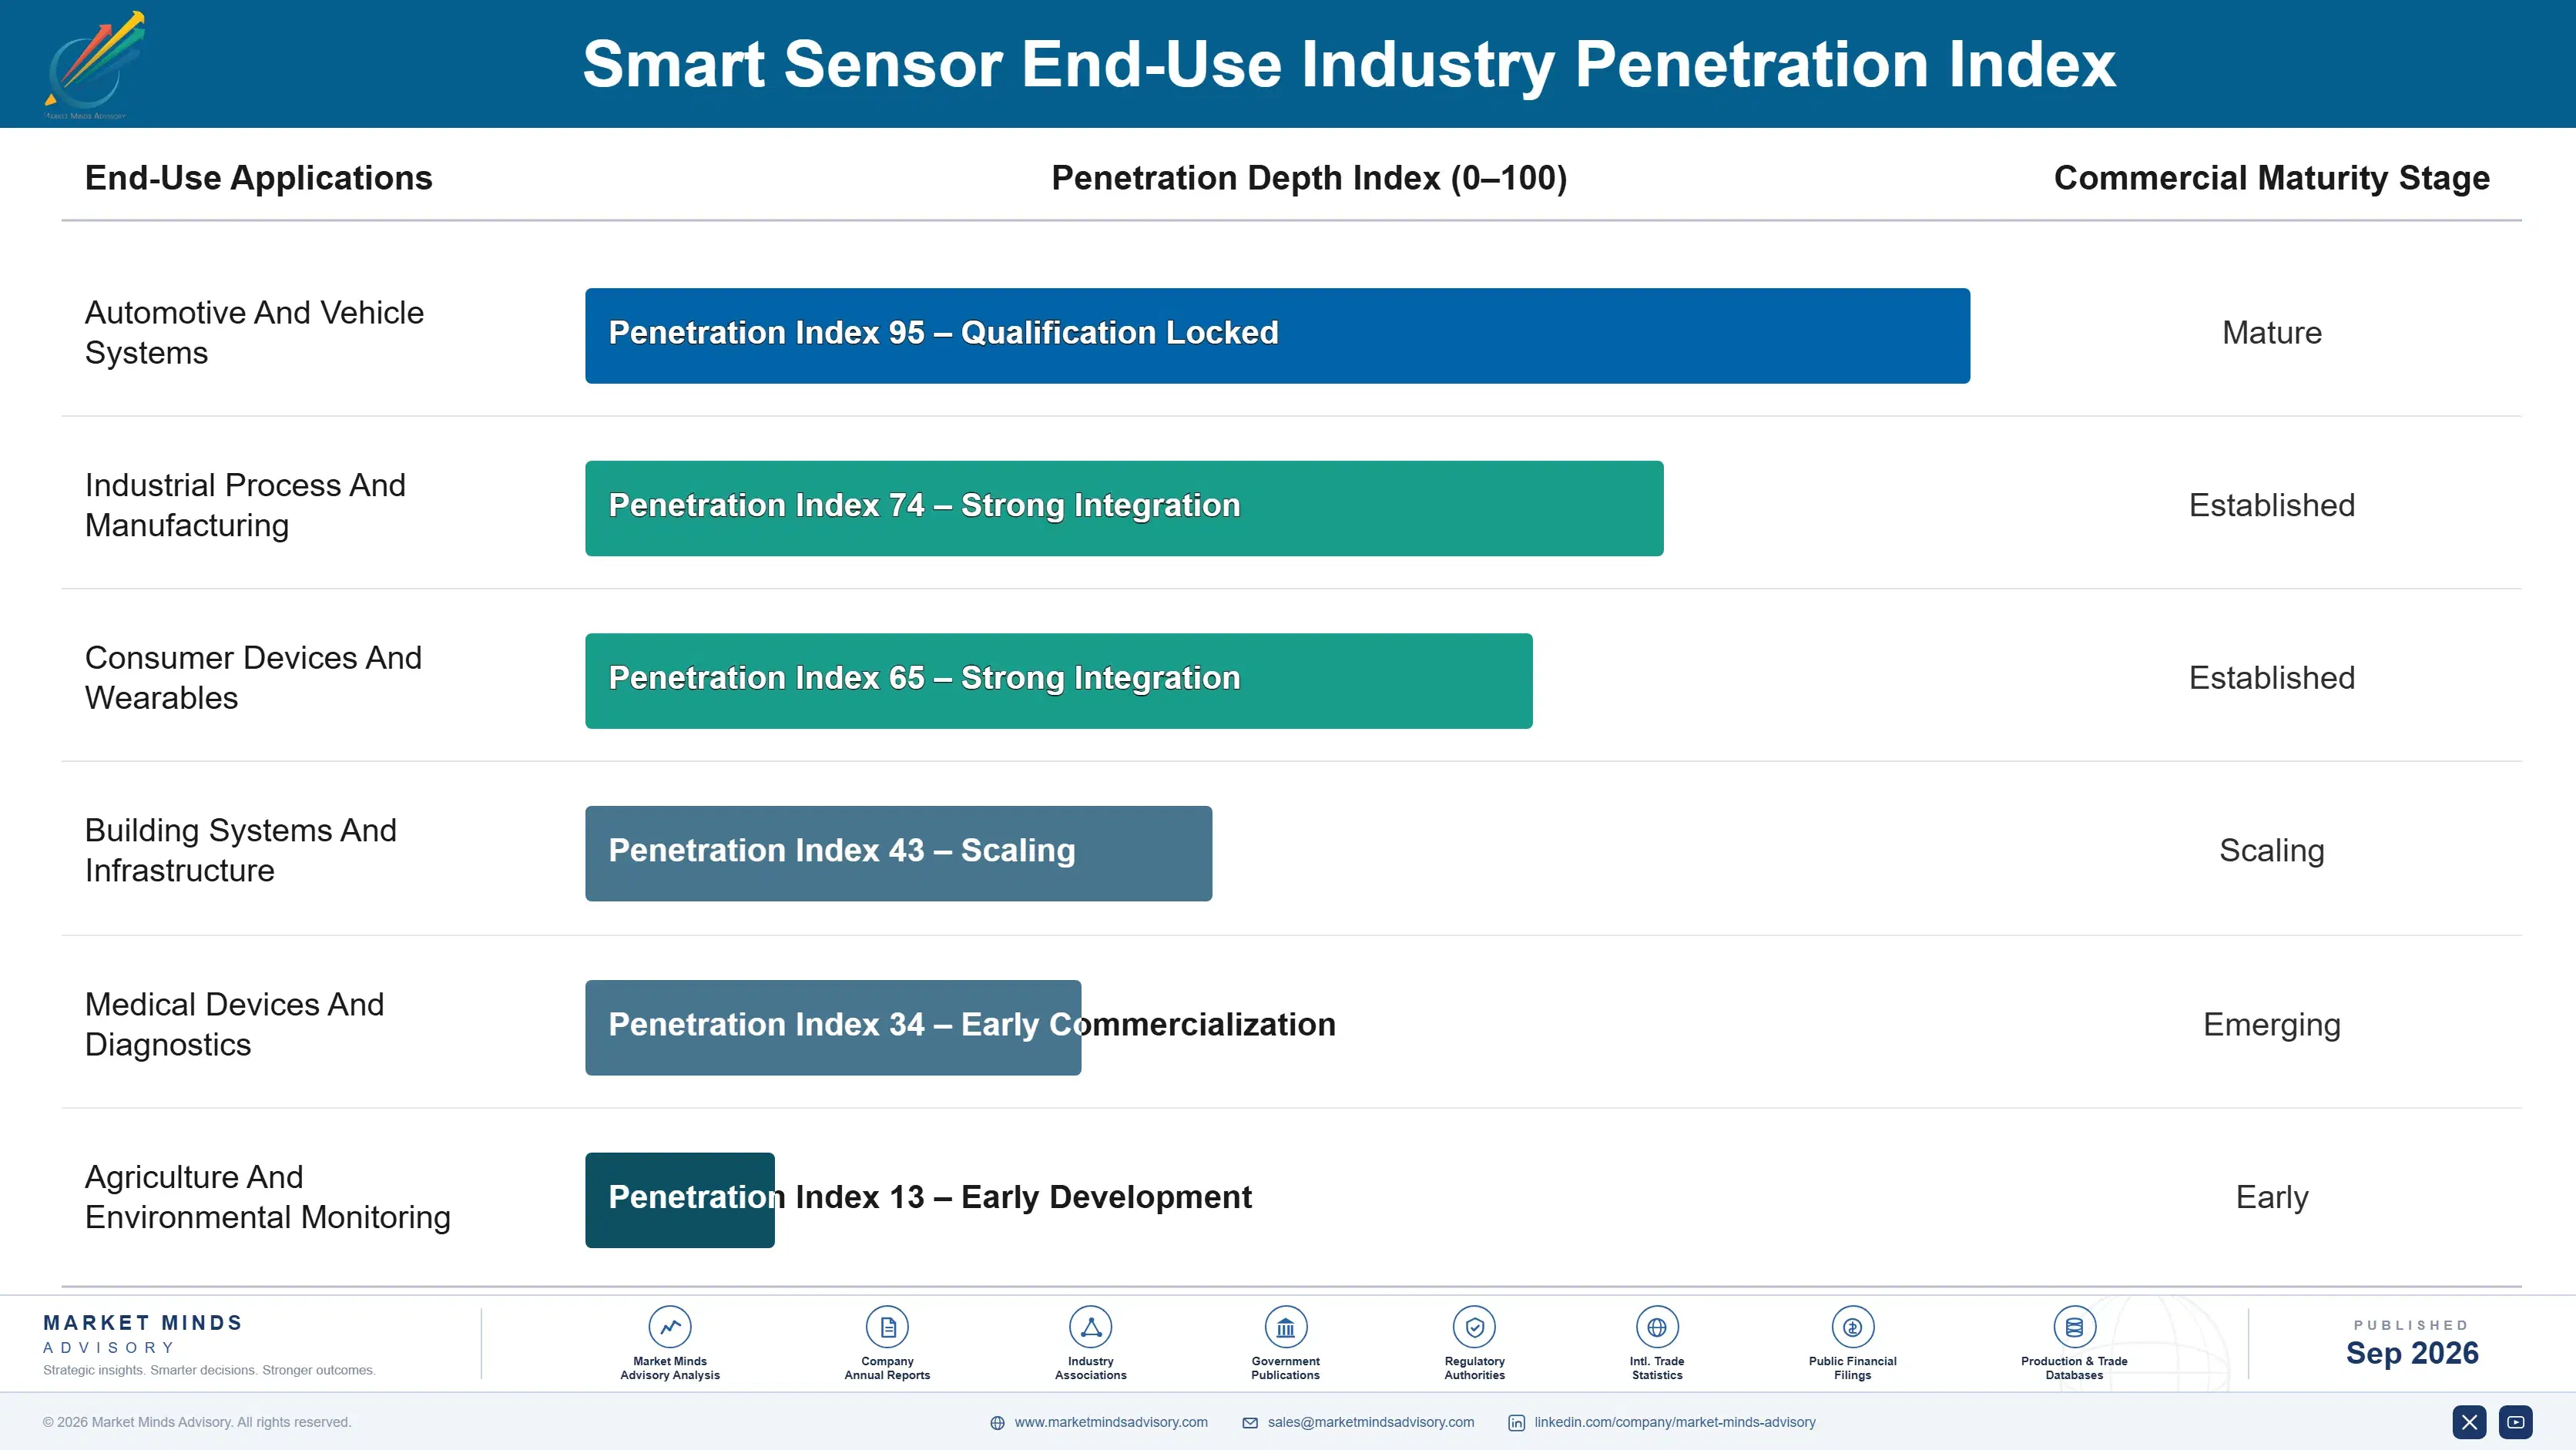
Why Drift Decides Repeat Business

The annuity here is replacement driven by drift rather than by failure. Roughly 11% of installed units are replaced annually because measurement error exceeded tolerance, not because anything stopped working, and error typically passes specified tolerance within around 14 months. That replacement volume goes to whoever the buyer trusts on stability, which is rarely the supplier who won on delivered accuracy the first time round.
Depth varies by whether the buyer measures drift at all. An industrial process operator who costed replacement against downtime specifies on multi-year stability and stays with suppliers who can evidence it. A volume buyer specifying on delivered accuracy and unit price re-tenders every cycle and moves for a few cents. Suppliers holding field drift data hold the first kind of customer.

The buyer has changed more than the technology has. A design engineer evaluated accuracy, range and interface against a datasheet at the point of specification. A maintenance function evaluates how often devices need replacing across a service life. An architect increasingly evaluates whether the device decides locally or adds to data nobody reads. The third buyer is newest and is why edge processing grows fastest.
smart-sensor-market-end-use-penetration-index-1789999124420

What Wins Sensor Specifications

These are among the four positions where our research anticipates prominent divergence between winners and laggards over the coming forecast period. Each is grounded in the demand model, the regulatory perimeter, and the announced capacity pipeline.
01 / DRIFT EVIDENCE POSITIONING

Sell Year Three, Not Day One

Measurement error exceeds specified tolerance within around 14 months on typical devices, and roughly 11% of installed units are replaced annually for drift rather than for any outright failure. Buyers specify on delivered accuracy and then pay for the consequence across a full service life afterwards. Suppliers presenting multi-year field drift data move the comparison onto ground new entrants cannot occupy, because that evidence takes years of installed base that cannot be simulated or purchased by any competitor entering now.
02 / LOCAL DECISION CAPABILITY

Decide In The Sensor, Not Upstream

Only around 19% of what a smart sensor reports reaches a system that acts on it, so every capability argument built on parameter richness reaches buyers whose architecture cannot absorb the parameters. On-device inference removes that dependency entirely and grows at 13.8% against 9.2% for the market. Suppliers selling data richness are selling something the customer cannot use, while local decisions need nothing downstream at all, which is why the segment grows fastest and why the rest of the category does not.
03 / BARRIER SEGMENT DISCIPLINE

Leave The Category Price Already Took

Asian suppliers compete hard in digital output pressure, temperature and flow sensing where qualification barriers are lowest and devices have converged technically to the point of interchangeability. Defending share there means defending the least attractive part of this whole market against competitors whose cost bases are materially lower. Automotive qualification, medical approval and edge processing all carry barriers that price competition on its own simply cannot cross, and each protects pricing that the volume half has already lost to Asian competitors already some years ago.
04 / AUTOMOTIVE PROGRAMME TIMING

Qualify Before The Content Arrives

Sensing devices fitted per vehicle rise around 7% annually, and automotive qualification takes years while committing a supplier across an entire model programme once it has been obtained. Those specifications are the most durable in this category by a considerable margin. Suppliers qualifying ahead of content growth capture programmes that later entrants cannot bid for at all, since a locked programme stays locked for its production life, which compounds as content per vehicle keeps rising across every subsequent model cycle.

Engagement Snapshot From the Field

A live engagement with an industry participant carrying material or product regulatory and market exposure ahead of a defining policy shift, showing how our research translates into a defensible multi-year portfolio strategy.
MARKET MINDS ADVISORY · CLIENT ENGAGEMENT SUMMARY
Smart Sensor Producer Strategic Portfolio Review and Transition Roadmap 2026·Investment Scenario on Smart Sensor Exposure Evaluation 2025-26
CLIENT PROFILE
An industrial sensor supplier losing share in digital output pressure and temperature sensing to lower-priced Asian competitors, while its own higher-accuracy devices grew slowly. Management had approved a manufacturing cost reduction programme to defend the volume categories, without establishing whether those categories could be defended profitably at all. Nobody had modelled whether those categories could be defended profitably at all.
STRATEGIC CHALLENGE
Manufacturing wanted further cost reduction to hold volume share. Product wanted investment in edge processing capability the company did not yet have. Nobody had modelled what the volume categories would earn after another two years of price compression, and a large industrial customer had begun asking for multi-year drift data the company did not collect.
MMA APPROACH
MMA modelled margin across the volume categories under continued price compression, and compared it against the qualification and processing barriers protecting other segments. We assessed what field drift evidence the company could assemble from existing installed base records. Work drew on 47 expert interviews conducted in Q4 2025 with industrial buyers, machine builders and sensing suppliers.
KEY FINDINGS
  1. Volume categories reached negative contribution within 2 years under continued price compression, even with the full planned manufacturing cost reduction applied to them.
  2. The company already held field drift records across 9 years of installed base that nobody had ever assembled into any customer-facing evidence.
  3. Edge processing entry required semiconductor design capability the company lacked, and buying it cost less than defending volume share (client-reported, unverified by MMA).
  4. Industrial buyers costing replacement against downtime specified on multi-year stability, and roughly 11% annual drift replacement made that argument straightforward to build.
CLIENT PROFILE
An industrial sensor supplier losing share in digital output pressure and temperature sensing to lower-priced Asian competitors, while its own higher-accuracy devices grew slowly. Management had approved a manufacturing cost reduction programme to defend the volume categories, without establishing whether those categories could be defended profitably at all. Nobody had modelled whether those categories could be defended profitably at all.
STRATEGIC CHALLENGE
Manufacturing wanted further cost reduction to hold volume share. Product wanted investment in edge processing capability the company did not yet have. Nobody had modelled what the volume categories would earn after another two years of price compression, and a large industrial customer had begun asking for multi-year drift data the company did not collect.
MMA APPROACH
MMA modelled margin across the volume categories under continued price compression, and compared it against the qualification and processing barriers protecting other segments. We assessed what field drift evidence the company could assemble from existing installed base records. Work drew on 47 expert interviews conducted in Q4 2025 with industrial buyers, machine builders and sensing suppliers.
KEY FINDINGS
  1. Volume categories reached negative contribution within 2 years under continued price compression, even with the full planned manufacturing cost reduction applied to them.
  2. The company already held field drift records across 9 years of installed base that nobody had ever assembled into any customer-facing evidence.
  3. Edge processing entry required semiconductor design capability the company lacked, and buying it cost less than defending volume share (client-reported, unverified by MMA).
  4. Industrial buyers costing replacement against downtime specified on multi-year stability, and roughly 11% annual drift replacement made that argument straightforward to build.
RECOMMENDED STRATEGY
Phase 1: Phase one: exit the digital output volume categories rather than funding another cost reduction round that price compression will absorb entirely. Phase 2: Phase two: assemble the existing 9 years of field drift records into customer-facing evidence, since the data already exists and costs nothing. Phase 3: Phase three: acquire rather than build the semiconductor design capability that edge processing entry requires, which is faster and cheaper.
OUTCOME
The supplier exited the volume categories and published field drift evidence from its existing records (client-reported, unverified by MMA). Margin improved materially once the loss-making categories were gone, and drift evidence won industrial specifications the company had previously lost on price. Segment contribution is now modelled before any cost reduction programme is approved.

Frequently Asked Questions

Foundational context covering the market sizes, CAGR, scope, country, region and competition that inform every finding below. This section is provided to cover basics and most often pre-purchase conversations, answered from the MMA Primary Research Dataset.

What is the current size of the Smart Sensor Market?

Global value reaches USD 51.7 billion in 2026, measured as smart sensor shipment value across six device classes. The 2025 base was USD 47.3 billion.

How large will the Smart Sensor Market be by 2036?

The market reaches USD 124.7 billion by 2036, an increase of USD 73.0 billion across the forecast period. That represents 2.41 times expansion from the 2026 base.

What is the CAGR for the Smart Sensor Market 2026 to 2036?

The base case runs at 9.2% annually, with a bull case at 10.4% if on-device inference reaches consumer price points and a bear case at 8.0% if digital output pricing compresses faster.

Which segment is growing fastest?

Edge processing sensors with on-device inference grow at 13.8%, half again the market rate of 9.2%. A sensor deciding locally needs nothing downstream to consume its output.

Who are the major companies in the Smart Sensor Market?

Bosch Sensortec, STMicroelectronics, TE Connectivity, Honeywell and Texas Instruments lead on shipment value, holding 37% between them. Sensata Technologies and Murata Manufacturing hold smaller positions.

Which country is growing fastest?

India leads at 15.3%, as manufacturing capacity is added rather than maintained and each new line carries more sensing points than before. Vietnam and Mexico follow.

Report Segmentation Architecture

The full report scope spans multiple orthogonal segmentation dimensions, with cross-tabulated demand data provided for each dimension pair. Coverage extends further to regional breakdowns, trend trajectories, and the competitive detail needed to support segment-level decision-making.

By Sensor Class And Processing Capability

  • Edge Processing Sensors With On-Device Inference
  • Self-Calibrating And Diagnostic Sensors
  • Inertial And Motion Sensing Modules
  • Wireless Smart Sensor Nodes
  • Gas And Environmental Sensing Modules
  • Digital Output Pressure, Temperature And Flow Sensors

By End-Use Industry

  • Automotive And Vehicle Systems
  • Industrial Process And Manufacturing
  • Consumer Devices And Wearables
  • Building Systems And Infrastructure
  • Medical Devices And Diagnostics
  • Agriculture And Environmental Monitoring

By Commercial Dimension

  • Original Equipment Manufacturer Direct Supply
  • Machine Builder Specification
  • Electronic Component Distribution
  • Automotive Tier One Supply
  • Contract Manufacturer Procurement
  • Design-In Reference Programmes

By Region

  • North America
  • Western Europe
  • East Asia
  • South Asia and Pacific
  • Latin America
  • Middle East and Africa
  • Eastern Europe

Scope, Methodology, and Coverage

Every figure in this report is reproducible from documented input assumptions. The scope below maps the historical period, the forecast horizon, the segmentation dimensions, and the countries covered, alongside the underlying primary and qualitative methodology.
Historical Period
2020 to 2025
Forecast Period
2026 to 2036
Base Year
2025 (USD billions; MMA Primary Research Dataset, September 2026)
Market Definition
This report covers smart sensors: sensing devices integrating signal conditioning, digital output and on-device processing within the sensor package, spanning edge processing sensors with on-device inference, self-calibrating and diagnostic sensors, wireless sensor nodes, digital output pressure, temperature and flow sensors, inertial and motion modules, and gas and environmental modules. It excludes raw sensing elements, machine vision cameras, controllers and gateways, standalone sensor fusion software, and complete instrumentation systems.
Quantitative Units
USD millions, smart sensor shipment value basis; devices shipped; calibration drift windows in months; field replacement rates for drift as a percentage; sensor data consumption rates; automotive sensing content growth per vehicle.
Segmentation Dimensions
Sensor class and processing capability; end-use industry; commercial supply route; geography across seven regions.
Regions Covered
North America, Western Europe, East Asia, South Asia and Pacific, Latin America, Middle East and Africa, Eastern Europe
Countries Covered
China, Japan, South Korea, Taiwan, Singapore, India, Australia, Vietnam, Germany, France, Italy, Netherlands, Switzerland, Poland, Czechia, United States, Canada, Mexico, Brazil, United Arab Emirates.
Key Companies Profiled
Bosch Sensortec, STMicroelectronics, TE Connectivity, Honeywell, Texas Instruments, Infineon Technologies, NXP Semiconductors, Analog Devices, Sensata Technologies, Omron, Murata Manufacturing, TDK InvenSense, Melexis, ams OSRAM, Sensirion.
Quantitative Methodology
Primary survey, n=3,800 respondents, Q4 2025, six countries; demand-side model with trade association cross-validation
Qualitative Methodology
47 expert interviews, Q4 2025; applied to validate demand model assumptions, identify emerging dynamics, and assess competitive positioning
Report Format
PDF and XLSX data workbook (Word format preview document)
Publisher
Market Minds Advisory
Report Code
MMA-2026-TEC-111
Published
September 2026
Contact
sales@marketmindsadvisory.com | www.marketmindsadvisory.com

Purchase the full Smart Sensor Market Report (2026 to 2036).

This report sizes the global smart sensor market from 2026 to 2036 across six device classes, six industries and seven regions. It explains why roughly 11% of installed units are replaced annually for calibration drift rather than failure, and why buyers specifying on delivered accuracy have been specifying the wrong property. Only around 19% of what these devices report reaching any system that acts on it is analysed as the reason edge processing grows fastest. Price compression in digital output sensing is examined across the volume half of the category. Regional analysis explains why East Asia holds 33% of shipment value.
Six sensor device classes sized through to 2036
Calibration drift quantified against annual replacement rates
Sensor data consumption analysed against edge processing growth
Twenty named suppliers assessed on shipment value
Four revenue levers with quantified commercial impact
Anonymised sensor supplier positioning engagement documented in full

Built For The People Who Decide

From boardroom strategy to bench-side execution, this report is read cover-to-cover by leaders shaping the next decade of their industry, turning demand scenarios, market dynamics and valuation benchmarks into decisions.
CXOs/ Presidents/ VPs/ Managers
M&A and Corporate Development
Strategy Teams and R&D Heads
Procurement and Product Directors
Regulatory and Compliance Leaders
Investor Relations and Equity Analysts