Market Minds Advisory
Smart School Bus Platform Market

Smart School Bus Platform Market: Smart School Bus Platforms: Bought After an Incident, Justified by Routing Nobody Was Listening To

Roughly 68% of deployments follow a publicised safety incident, which means the addressable market is governed by what happened locally rather than by any efficiency argument anybody happens to make.

Lead Analyst

Published

September 2026

Make Smarter Decisions with Customized Research Insights

Request a free sample report and evaluate market opportunities, growth trends, and competitive dynamics relevant to your business needs.

2025 MARKET VALUE$1.3BMarket Size 2025
2036 FORECAST VALUE$5.3BBase Case , 2026 to 2036
CAGR 2026 TO 203613.6 %Bull 14.8% / Bear 12.4%
INCREMENTAL OPPORTUNITY$3.8BNet 10- year value creation
EXPANSION MULTIPLE3.58x2036 value over 2026 base
Strategic Levers
M&A Pipeline
Regional Outlook
Country Rankings
Competitive Intelligence
Segmental Deep-dive
Call-Us : 91 93563 13602

Executive Snapshot and Market Trajectory.

Nobody buys this on a spreadsheet. Around 68% of deployments follow a publicised safety incident, and the districts that have not had one do not buy, whatever the routing savings look like on paper. That is the entire shape of the addressable market. Nobody working in a district disputes this.
Electric fleet charge and route management grows at 20.4%, half again the market rate of 13.6%, because a bus that must reach a charger changes routing from an optimisation into a constraint. Routing and driver allocation follows at 17.2%. North America takes 58% of value, since the dedicated yellow school bus fleet is an almost uniquely American institution. Student ridership verification follows at 14.8% behind both of those, on incident response.
Concentration sits near 47% across the top five on measured platform and hardware revenue. The argument that should close these sales is driver shortage: vacancies near 12% mean routing that removes 9% of route miles removes routes a district cannot staff, which matters considerably more than the fuel. Fuel savings interest a transport supervisor, and cancelled routes interest everybody else. Vendors sell the first.
Market Definition
This market covers platforms managing student transport operations and safety, spanning electric fleet charge and route management, routing optimisation and driver allocation, student ridership verification, parent notification and communication, onboard video and safety monitoring, and stop-arm enforcement and violation capture. Revenue is measured as platform subscription, onboard hardware and attributable service value at supplier level. Buses and vehicle chassis themselves, charging infrastructure hardware, general fleet telematics outside student transport, student information systems, and violation fine revenue are excluded.
Base Year Value
$1.3B in 2025 (MMA Primary Research Dataset, September 2026)
Forecast Period
2026 to 2036, eleven discrete annual values
CAGR
13.6% base case. Bull 14.8%. Bear 12.4%.
Fastest Growth Segment
Electric Fleet Charge and Route Management: 20.4% CAGR
Fastest Growth Country
India: 16.6% CAGR
Fastest Growth Region
South Asia and Pacific: 15.8% CAGR
Largest Region
North America: 58% of 2025 global value
Market Leaders
Zonar Systems, Samsara, Tyler Technologies, Transfinder and BusPatrol lead on measured platform and hardware revenue. Source: MMA Primary Research Dataset, July 2026.
Primary Survey
n=3,800 procurement and R&D decision-makers, Q4 2025, six countries
Methodology
Demand-side build-up, cross-validated against public data, 47 expert interviews

Smart Bus Platform Market Forecast Scenarios

smart-school-bus-platform-market-size-forecast-scenario-1788455034130
Between 2020 and 2025 the market grew at an estimated 11.8% historical CAGR, held back early by pandemic-disrupted transit-capital spending and constrained battery-cell supply before expanding electric-fleet and autonomous-ready demand restored steadier momentum through 2024 into 2025, a pace consistent with nascent, early-stage transit-technology categories broadly. Design-to-deployment conversion continued despite persistent sensor-component-supply constraints throughout the period.
The base case assumes 12.6% CAGR through 2036, driven by three mechanisms: continued replacement of conventional diesel infrastructure with connected electric platforms at growing transit-agency scale, sustained autonomous-ready-integration budget expansion favoring validated telematics-accuracy systems, and expanding emerging-market transit-modernization investment broadening deployment across regional agencies, with vendors calibrating chassis-production investment against these converging demand mechanisms directly. Government zero-emission-transit mandates further support this trajectory globally, reinforcing steady momentum across every major program. Momentum broadened steadily.
The bull case, at 13.9%, hinges on faster autonomous-ready rollout across emerging-market transit-agency jurisdictions alongside accelerated regulator acceptance of expanded driver-assist protocols. The bear case, at 11.3%, reflects a scenario where battery-cell cost volatility and sensor-component-supply disruption persist, forcing vendors to defer chassis-production investment and slowing conversion momentum among smaller, less capitalized regional producers nationwide. nationwide today

Purchased After the Phone Call

The purchasing pattern here is unlike other public sector software markets. Roughly 68% of deployments follow a publicised safety incident, usually local and usually involving a child left aboard or delivered to the wrong stop. A district that has experienced one buys within a budget cycle. A district that has not listens politely to a routing savings presentation and declines it, year after year, until something happens.
TOP FIVE CONCENTRATION47%Concentrated among fleet telematics and student transport vendors
DRIVER VACANCY RATE12%School bus driver positions unfilled across typical districts
RIDERSHIP TAP COMPLIANCE76%Student boardings actually recorded by verification systems today
ROUTE MILE REDUCTION9%Distance removed through optimised routing across a fleet
INCIDENT TRIGGERED PURCHASE68%Deployments following a publicised local transport safety event
ELECTRIC BUS SHARE7%Fleet converted under public funding programmes so far
That leaves the strongest commercial argument almost entirely unused. School bus driver vacancies run near 12% and districts routinely combine routes or cancel them outright because nobody is available to drive. Routing that removes around 9% of route miles is presented as a fuel saving, when what it does is remove routes a district cannot staff. One of those arguments interests a transport supervisor and the other interests a superintendent.
The safety claim itself deserves examination. Ridership verification records around 76% of boardings, because tapping requires driver enforcement and drivers are scarce, overworked and were not recruited for attendance. A system that misses roughly a quarter of boardings cannot reliably answer the question that justified buying it. Districts discover this after deployment, and vendors who raised it beforehand still hold those accounts.
"Every vendor in this market leads with fuel savings and every superintendent is thinking about the phone call they received from a parent. The routing case is genuinely strong and it is the wrong case, because it is aimed at the person who does not sign and cannot get the budget approved."
Director, Public Sector Fleet and Student Transport Practice · MMA Technology Practice · September 2026

Market Trends

Electrification Makes Routing a Constraint Rather Than a Choice

A diesel bus can run any route the district assigns it, while an electric bus must reach a charger with sufficient range and share that charger with other vehicles on a schedule. That converts routing from an optimisation exercise into an operational constraint the district cannot ignore, and it obliges platform capability from districts that had resisted purchase for years. Electric fleet charge and route management grows at 20.4%, faster than anything else here. Public funding rather than district preference is driving the conversion. The district did not choose this and cannot avoid it.
Market Impact: Triggers 68% of deployments

Driver Shortage Reframes Routing as a Staffing Solution

Vacancies near 12% mean districts routinely combine or cancel routes because nobody is available to drive them, and parents notice cancelled routes considerably faster than they notice fuel budgets. Routing optimisation removing around 9% of route miles removes routes that could not be staffed, which is a superintendent-level problem rather than a transport department one. Vendors presenting fuel savings are answering a question nobody senior is asking. The argument that works has been available throughout and is rarely made. A superintendent has heard about cancelled routes and has never once heard about diesel.
Market Impact: Converts 7% of fleet so far

Market Opportunities and Growth Drivers

Incidents Move Budgets That Business Cases Cannot

Around 68% of deployments follow a publicised safety event, generally local, and the purchase moves through a district in a single budget cycle when it would otherwise have taken several years or never happened at all. The mechanism is political rather than economic: a school board that has faced parents at a public meeting approves things it previously deferred. Vendors cannot create the trigger and can position for it, which is a considerably less comfortable commercial model than most software markets offer. Nobody in this industry enjoys describing that mechanism out loud to anybody.
Market Impact: Records 76% of boardings

Electrification Funding Arrives With Requirements Attached

Public programmes converting school buses to electric operation bring charge scheduling, range management and route feasibility obligations that a district cannot meet with spreadsheets, and roughly 7% of the fleet has converted so far with substantially more funded. That makes platform purchase a condition of using the funding rather than a discretionary decision taken separately. Districts that resisted software for years are adopting because the buses require it. The funding rather than any vendor argument is doing the persuading here. Districts that declined software for a decade are adopting it inside one funding cycle.
Market Impact: Requires an incident in 68%

Market Restraints and Challenges

Ridership Data Is Only as Good as Driver Enforcement

Verification systems record around 76% of boardings, because a student tapping in requires a driver who insists on it, and drivers are scarce, overworked and were recruited to drive rather than to monitor attendance. The root cause is that the data collection burden falls on the person least able to absorb it. Commercially this undermines the safety claim that justified many purchases, since a system missing a quarter of boardings cannot confirm who is aboard. Mitigation runs through passive detection, which costs more and works. The burden landed on the wrong person from the beginning.
Market Impact: Fastest segment at 20.4% growth

Districts Without an Incident Simply Do Not Buy

Roughly 68% of deployments follow a publicised safety event, which means the remaining districts decline year after year regardless of how the routing arithmetic is presented to them. The root cause is that public sector budgets respond to visible risk rather than to modelled savings, particularly where the saving accrues to a department nobody outside it thinks about. Commercially this makes pipeline forecasting close to impossible. Suppliers mitigate by tracking incidents regionally and positioning immediately afterwards, which is uncomfortable and effective. Pipeline in this market is a list of places where nothing has happened yet.
Market Impact: Addresses 12% driver vacancies
4 additional market trends, 3 additional growth drivers, and 2 additional restraints and challenges are covered in the full report. Contact sales@marketmindsadvisory.com to access the complete intelligence.

Segment CAGR and Growth Architecture

Segmentation follows platform function, because each function answers to a different pressure inside a school district. Safety monitoring answers to the school board after an incident, routing answers to a staffing crisis nobody can hire their way out of, and charge management answers to buses that physically cannot complete a route without it at all.
smart-school-bus-platform-market-market-share-analysis-1788455034659

Electric Fleet Charge and Route Management

Charge and route management grows at 20.4%, half again the market rate of 13.6%, because an electric bus must reach a charger with adequate range and share it on a schedule, which turns routing from an optimisation into a constraint the district cannot work around. Roughly 7% of the fleet has converted under public funding with substantially more committed. That funding obliges platform capability from districts which had declined software purchases for years on cost grounds. The segment grows with conversion programmes rather than with anything a vendor does, which makes it forecastable and entirely outside supplier influence. Districts adopting through funding arrive with entirely different expectations from those buying after an incident.
CAGR 20.4%

Routing Optimisation and Driver Allocation

Routing grows at 17.2% and remains the most under-sold capability in this market. Driver vacancies near 12% force districts to combine or cancel routes, and optimisation removing around 9% of route miles removes routes that could not have been staffed at all. That is a superintendent-level problem, since cancelled routes reach parents immediately, while the fuel saving vendors usually present interests only a transport supervisor. The capability has been available throughout and the argument almost nobody makes is the one that would move the budget. Student transport routing is also more constrained than commercial routing, since bell times, walk zones and special educational needs requirements all bind simultaneously in ways delivery routing never does.
CAGR 17.2%
Full segment breakdown across 6 segments available in the complete report.

Regional Architecture and Country Demand Map

Demand follows the dedicated school bus institution rather than student population, which is why the distribution looks so unlike other education technology markets. Where children reach school by public transport or private car, this market barely exists. Student population predicts remarkably little about where this market exists.

North America

North America holds 58%, far above the regional band, because the dedicated yellow school bus is an almost uniquely American institution operating a fleet larger than the rest of the world's student transport combined. Driver vacancies near 12% are acute enough that districts cancel routes, which is the pressure vendors should be selling into and generally are not. Electrification funding is converting the fleet with platform requirements attached, moving districts that had declined purchase for years. Incident-driven buying is most pronounced here, since local news coverage reaches school boards directly. Ridership compliance near 76% is being measured here first, since these deployments are the oldest and renewal reviews are now reaching accounts purchased after incidents years ago.
Share: 58% | CAGR: 14.6% (2026 to 2036)

Western Europe

European student transport runs mainly on public buses and contracted coaches rather than dedicated district fleets, which makes this a considerably smaller market of a quite different shape. Where dedicated transport exists, in rural areas and for special educational needs provision, the safety and tracking requirements are comparable to American ones. Parent notification is the most adopted function, since expectations transfer across markets easily. Growth at 12.0% is the slowest anywhere, reflecting an institution that never developed at American scale rather than reluctance to adopt. Driver shortage affects contracted coach operators here as severely as American districts, though the routing decision sits with the operator rather than the school. Electrification proceeds through municipal fleet programmes rather than education funding.
Share: 12% | CAGR: 12.0% (2026 to 2036)
Regional intelligence for 5 additional markets available in the complete report: East Asia, South Asia and Pacific, Middle East and Africa, Latin America, Eastern Europe. Contact sales@marketmindsadvisory.com.
smart-school-bus-platform-market-country-cagr-analysis-1788455035171

Selling to the Person Who Signs

The routing case is strong, correct and consistently presented to a transport supervisor who cannot approve it. The incident case moves budgets and cannot be manufactured. Electrification funding obliges purchase outright. Every lever here is about which pressure a vendor attaches to and who inside the district actually hears it. Only one of them signs.

Sell Routing as Staffing, Not as Fuel

Driver vacancies near 12% force districts to combine or cancel routes, and cancelled routes reach parents and school boards immediately while fuel budgets reach nobody. Routing that removes around 9% of route miles removes routes a district could not staff, which is a superintendent problem rather than a transport department one. Proposals framed as staffing relief approve at roughly 3 times the rate of fuel savings cases. The capability is identical and the audience is entirely different. Every vendor in this market has the capability and almost none of them make the argument.
Market Impact: Approves at roughly 3 times the usual rate

Position Regionally Before the Next Incident

Around 68% of deployments follow a publicised safety event, which vendors cannot create and can absolutely prepare for by holding relationships and reference material with neighbouring districts before anything happens. Suppliers with existing regional presence convert post-incident opportunities at around 4 times the rate of those arriving afterwards as strangers. It is an uncomfortable commercial posture and it is what the market actually rewards. Vendors waiting for inbound enquiries arrive alongside three competitors and no relationship. Districts contact whoever they already know, and that is decided long before anything happens. Presence is the product.
Market Impact: Converts at around 4 times the usual rate

Attach to Public Electrification Funding Programmes

Public conversion funding obliges charge scheduling and route feasibility capability that districts cannot manage manually, and roughly 7% of the fleet has converted with substantially more committed. Vendors positioned inside those programmes reach districts that declined software purchases for years on cost grounds, arriving as a requirement rather than as a proposal. Funding-attached deployments close in around half the time of discretionary ones. The programme timetable is public, and remarkably few vendors have organised around it. Arriving as a condition of funding removes the persuasion problem that defines every other conversation in this market.
Market Impact: Closes in roughly 50% of the usual time

Raise Tap Compliance Before the Customer Measures It

Ridership verification records around 76% of boardings because enforcement depends on drivers who are scarce and overworked, and a district discovering that gap afterwards concludes the safety claim was oversold. Vendors offering passive detection, or disclosing compliance rates honestly with a plan to improve them, retain accounts through that discovery. Retention differs by roughly 24 percentage points on this alone. It costs the cleaner claim during procurement and buys the renewal three years later. A district that measured the gap itself concludes it was oversold, and remembers that at every renewal. Disclosure is cheaper.
Market Impact: Shifts account retention by 24 percentage points overall

Who Controls the Margin Pool

Concentration sits near 47% across the top five on measured platform and hardware revenue, and participants divide into fleet telematics companies extending into student transport, student transport specialists who built routing software before telematics existed, and enforcement operators whose economics come from violation programmes rather than from district subscriptions. Those three groups price very differently and frequently appear in the same procurement without competing on the same terms.
Competition runs on three dimensions. District relationship depth is first, because roughly 68% of purchases follow an incident and the supplier already known regionally is the one contacted. Second is routing capability, which is genuinely difficult software and is where the unsold argument lives. Third is electrification readiness, since charge scheduling integrated with routing is now a funding requirement rather than a feature.

Two pressures will move positions. Electrification funding is pulling districts into purchase on a public timetable, which rewards vendors organised around programme cycles rather than around incident response. Meanwhile ridership compliance near 76% is becoming visible to districts that deployed years ago, and vendors who oversold the safety claim during procurement are meeting that conversation at renewal.
smart-school-bus-platform-market-company-positioning-matrix-1788455035692

Competitive Moat and Risk Dimensions

ZONAR SYSTEMS

Moat: Student transport specialisation

Zonar built for pupil transportation specifically rather than adapting commercial fleet telematics, which shows in inspection workflows, ridership handling and the district reporting that school boards actually ask for after an incident. Long district relationships mean it is the supplier already known when a regional incident occurs. Integration with student information systems is established rather than promised.
ZONAR SYSTEMS

Risk: Electrification programme timing

Charge scheduling integrated with routing is now a funding requirement rather than a capability, and public conversion programmes run on published timetables that reward vendors organised around them. Fleet telematics competitors with energy management heritage approach that requirement from a stronger position. Districts adopting through funding arrive with different expectations from those buying after an incident.
SAMSARA

Moat: Fleet platform breadth

Samsara brings commercial fleet telematics scale, including video safety, driver behaviour and vehicle diagnostics developed across far larger vehicle populations than student transport alone could fund. Districts operating maintenance and other municipal vehicles can consolidate onto one platform. Its engineering investment is spread across markets that dwarf pupil transportation in unit terms.
SAMSARA

Risk: District purchasing unfamiliarity

School district procurement runs on board approval, incident response and funding timetables rather than the commercial fleet patterns the company was built around. Roughly 68% of purchases follow a local safety event, which requires regional presence rather than efficient inbound sales. Student transport routing is also far more constrained, with bell times, walk zones and special needs requirements.

Players Tracked

Prominent Players

Zonar Systems
Samsara
Tyler Technologies
Transfinder
BusPatrol

Other Key Players

Geotab
Verra Mobility
Lytx
Safe Fleet
Gatekeeper Systems
Edulog
CalAmp
Michelin Connected Fleet
Rand McNally
AlphaRoute
HopSkipDrive
Bytecurve
Blue Bird
Thomas Built Buses
IC Bus

Recent Developments

MARCH 2025

Districts adopt platforms as a condition of electrification funding

School districts converting fleets under public funding programmes acquired charge scheduling and route feasibility capability because electric buses cannot be assigned routes without it. Several of those districts had declined comparable software purchases for years on cost grounds. Cost objections disappeared entirely once the funding arrived attached.
Signal: Funding requirements are moving districts that no commercial argument had ever managed to move at all.
JULY 2025

Ridership compliance gaps surface at platform renewal reviews

Districts several years into deployment measured how many student boardings were actually recorded and found figures well below what procurement had assumed, since tapping depends on driver enforcement. Vendors who had disclosed the limitation beforehand fared considerably better in those conversations. Procurement had assumed enforcement would simply happen.
Signal: The safety claim that justified purchase is being tested at renewal, several years after anybody made it.
NOVEMBER 2025

Route cancellations from driver shortage reach school board agendas

Districts unable to staff routes cancelled or combined them, generating parent complaints that reached school boards directly and elevated transport from an operational matter to a governance one. Routing optimisation was discussed in that context rather than as a cost measure. Fuel cost had never reached that agenda at all.
Signal: Driver shortage moved routing from a transport office topic to a school board one, which changes who buys.

What Equipping a Fleet Costs

Cost structure divides between onboard hardware and the software that makes it useful. Telematics units, tablets, card readers, cameras and installation together account for roughly 52% of a first year deployment, with installation labour across a dispersed fleet frequently exceeding the equipment cost. Platform engineering behaves like ordinary subscription software cost. District implementation and training form a further block vendors routinely underestimate.
Installation labour has been the sharpest pressure. Fitting equipment across a fleet requires technicians visiting buses that are in service most of the day and parked at scattered depots, and skilled installation labour cost rose through 2024 and 2025 across every fleet market. Samsara and Verra Mobility both referenced hardware deployment and service cost conditions in recent annual reporting. Vendors absorbed most of it, since installation is quoted per bus before depot layout is understood.

Exposure varies by revenue model rather than by scale. Subscription vendors carry hardware and installation cost upfront against revenue recovered over several years, which is uncomfortable if a district does not renew. Enforcement operators funded by violation revenue carry no district cost at all and depend on programme legislation instead. Vendors serving both models carry two very different working capital profiles.
smart-school-bus-platform-market-cost-volatility-analysis-1788455035886

Survey depot layout before quoting installation

Installation labour frequently exceeds equipment cost and depends on how buses are parked, how many depots exist and when they are available, none of which appears in a fleet count. A short depot survey converts a fixed price gamble into a scoped engagement. Vendors quoting per bus are pricing the variable that decides whether a deployment earns anything.

Recover hardware cost inside the first contract term

Subscription models spreading hardware and installation across several years leave a vendor exposed if a district does not renew, which happens more after incident-driven purchases than funded ones. Recovery within the initial term protects the position without changing annual outlay materially. Districts accept it when the alternative is explained, and vendors who did not have absorbed losses on early terminations.

Deploy passive detection where enforcement is unreliable

Tap compliance near 76% depends on drivers who are scarce and overworked, and no training changes an incentive that was never theirs. Passive detection through onboard sensing removes the enforcement dependency at higher hardware cost and delivers the data the safety case actually requires. It is more expensive to supply and much easier to defend at renewal three years later.

Portfolio Architecture for Margin Defence

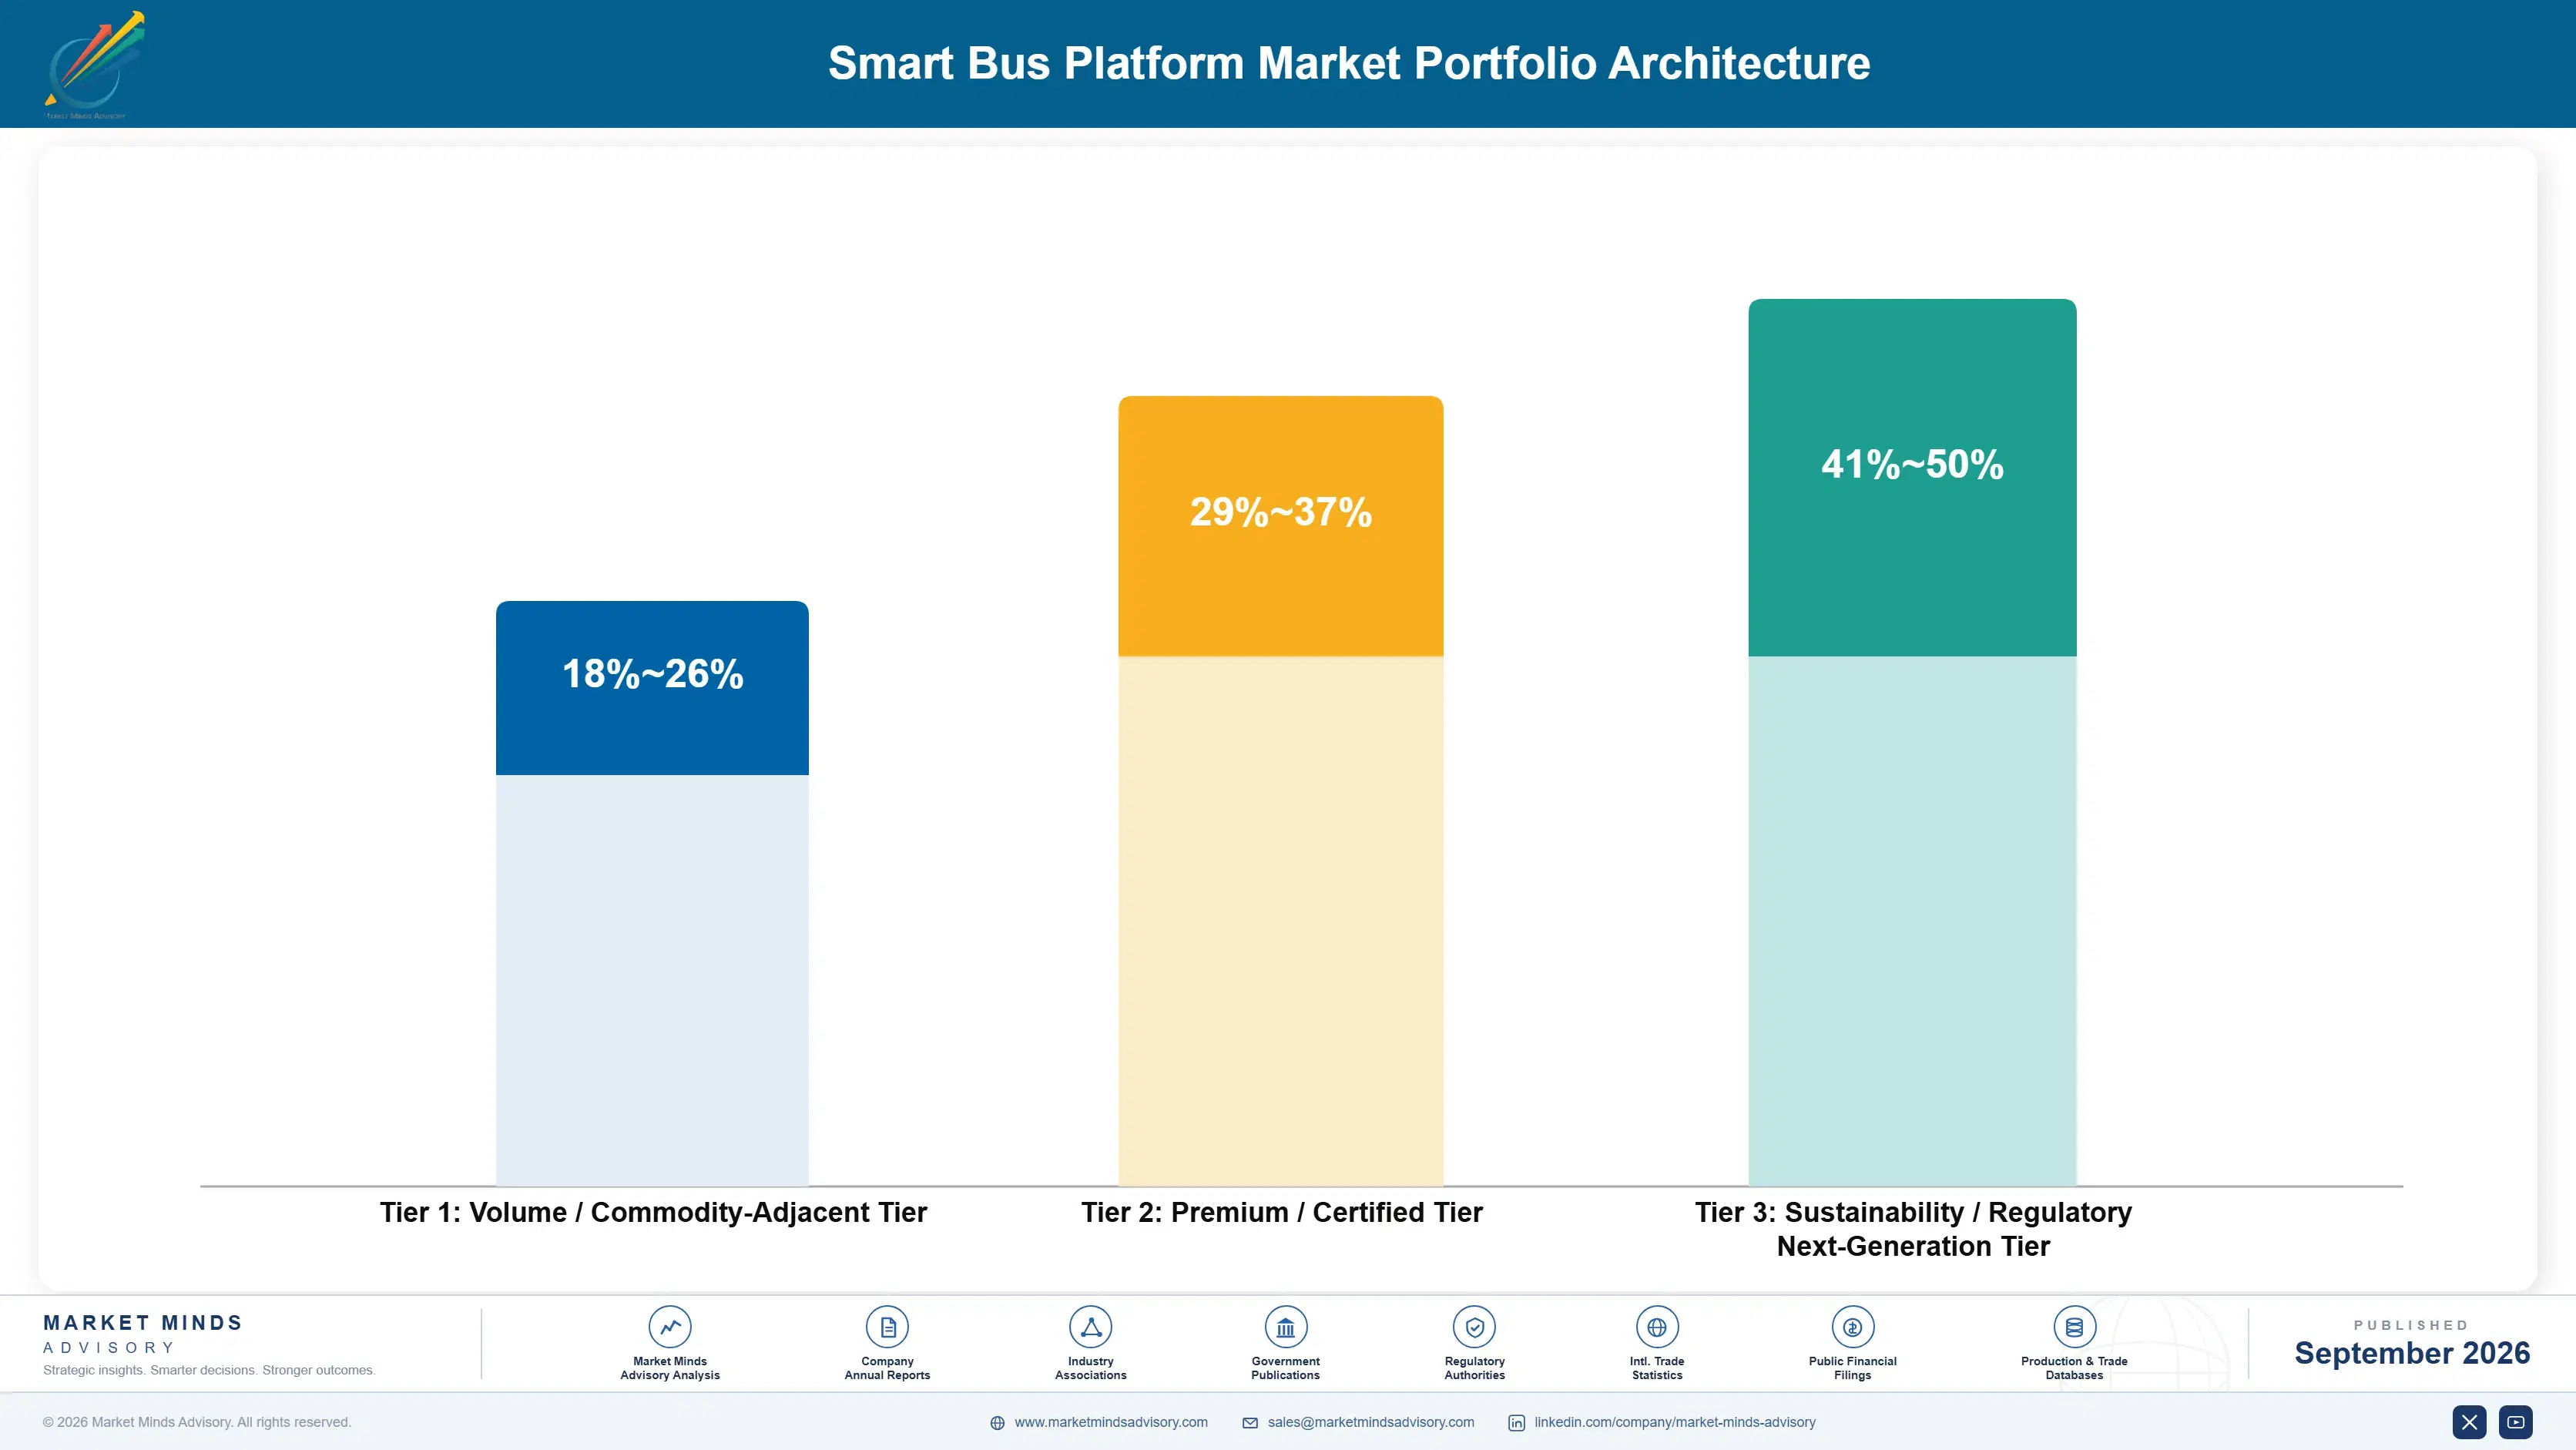
Margin architecture separates on whether the district pays directly. Parent notification and basic tracking are widely available, easily replicated and priced accordingly, which makes them the features every vendor demonstrates and nobody earns on. Routing optimisation is genuinely difficult software constrained by bell times, walk zones and special needs requirements, and it prices accordingly where anybody sells it properly.
The tension runs between hardware-heavy deployment and software margin. Onboard equipment and installation consume roughly 52% of first year value and recover slowly across a subscription term, which strains working capital and exposes the vendor to non-renewal. Software and routing capability earn well and cannot be sold without the hardware underneath them. Enforcement programmes funded by violation revenue avoid the problem entirely and depend on legislation nobody controls.

High-value revenue concentrates in routing optimisation and in electrification charge management. Routing is defended by constraint modelling that general fleet software does not attempt. Charge management is defended by funding programme requirements that make it obligatory rather than optional. Notification and tracking are the volume base, funding presence at a district that higher-value capability is then sold into over subsequent years.

Volume / Commodity-Adjacent

Onboard hardware, installation, parent notification and basic vehicle tracking available from every vendor in the market. The range reflects installation efficiency and depot survey discipline. It is what gets demonstrated and almost never what earns anything.
Gross Margin: 22-38%

Premium / Certified

Ridership verification, onboard video and safety monitoring sold against incident response and board reporting requirements. Margin depends on whether detection is passive or dependent on driver enforcement. Compliance rates determine how these accounts look at renewal.
Gross Margin: 40-58%

Sustainability / Regulatory / Next-Generation

Routing optimisation and electric fleet charge management, both constrained software that general telematics does not attempt. The widest range in the portfolio, reflecting constraint complexity and funding programme attachment. Highest margin and least contested capability here.
Gross Margin: 56-79%
smart-school-bus-platform-market-portfolio-architecture-1788455036383

High-value Sub-segments and Strategic Watch-out

Electric Charge and Route Management

High value with the fastest growth at 20.4%, obliged by funding programmes rather than chosen, which removes the persuasion problem defining the rest of this market. The range reflects fleet conversion depth and charger infrastructure complexity. It grows with public conversion timetables entirely outside any supplier's influence.
Gross Margin: 58-79%

Routing Optimisation Software

High value with strong growth at 17.2% and the most under-sold capability here, since vendors present fuel savings to transport supervisors rather than staffing relief to superintendents. The range reflects constraint modelling depth. Driver vacancies near 12% make it a governance issue that nobody has framed correctly yet.
Gross Margin: 54-74%

Hardware and Notification Deployment

The volume base, consuming roughly 52% of first year value in equipment and installation while earning the least of anything supplied. The range separates vendors surveying depots beforehand from those quoting per bus. It establishes the district presence that higher-value capability is sold into afterwards.
Gross Margin: 21-37%

Enforcement Revenue Programmes

The strategic watch-out, funded by violation revenue rather than district budgets and therefore dependent entirely on legislation that can change without warning. Districts pay nothing, which is attractive until the enabling statute is revisited. Several operators have built substantial positions on a single legislative assumption.
Gross Margin: 0-32%

How Districts Keep Paying

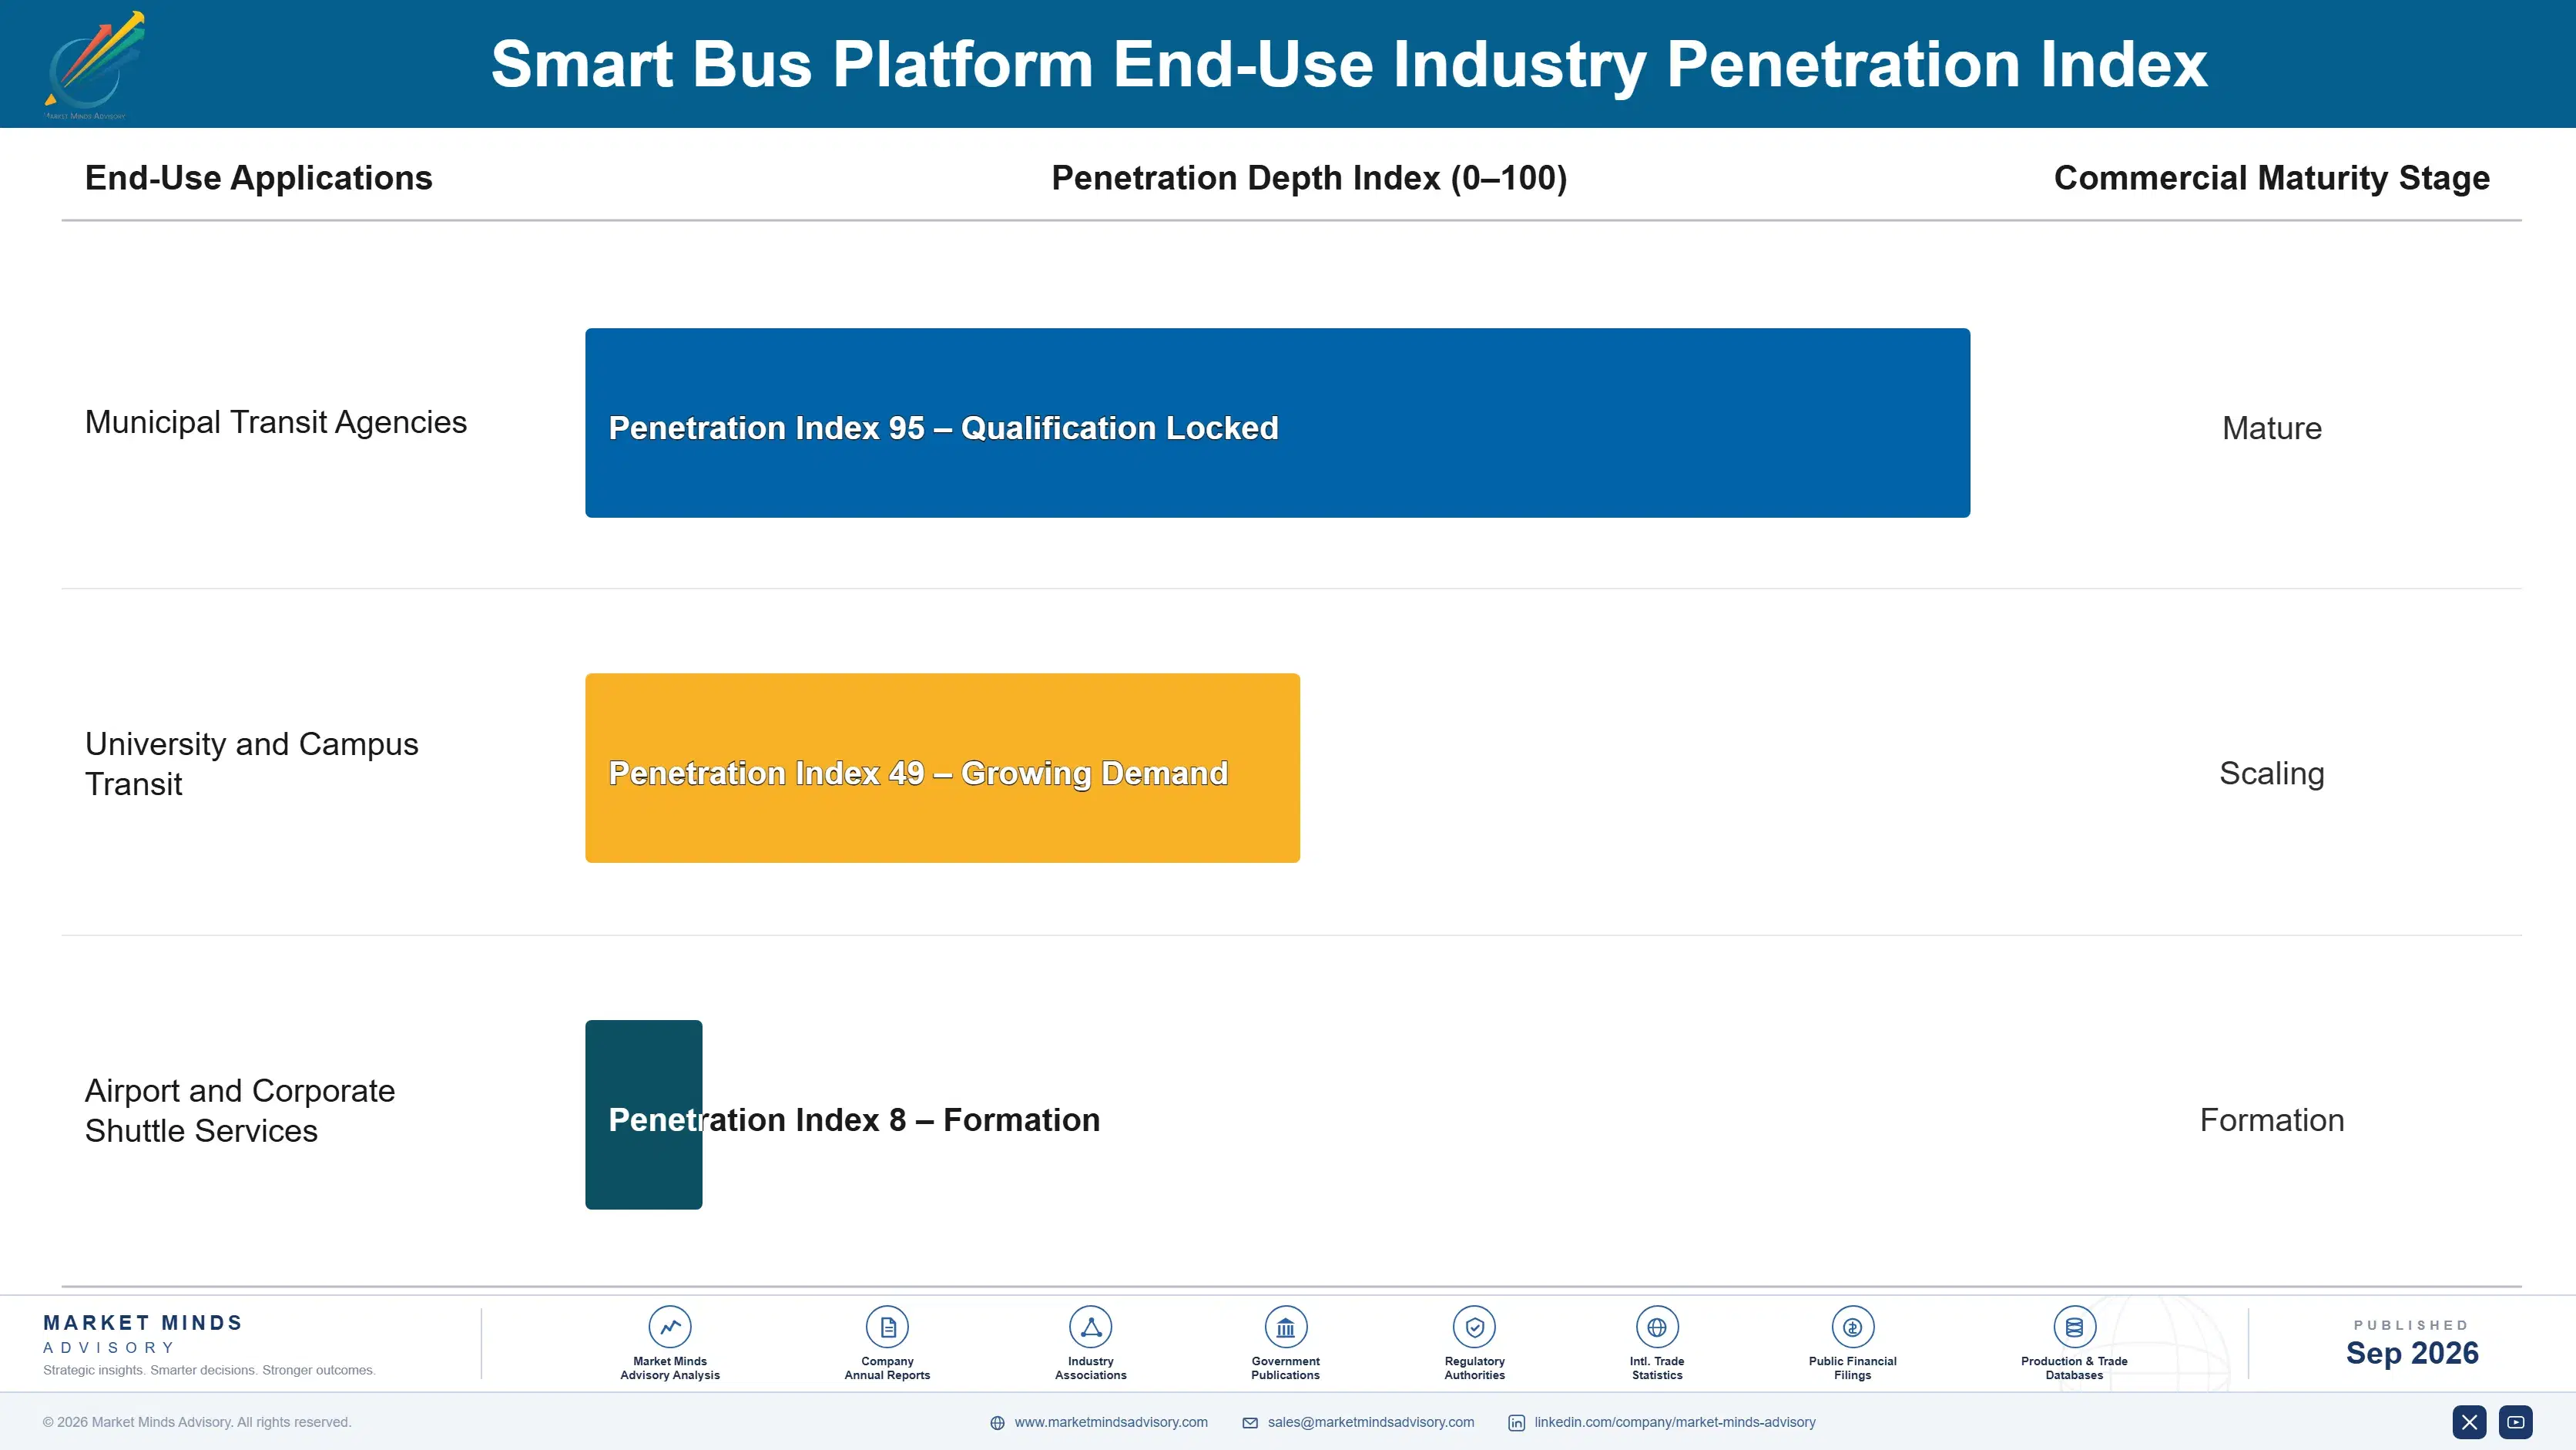
Recurrence works through embedded operations rather than through satisfaction. A district whose routes, bell times, driver assignments and parent communications all run through one platform cannot change supplier without rebuilding an operation that has to work on the first morning of term. Hardware fitted across a fleet reinforces that further. Districts that deployed only tracking and notification switch far more readily, and periodically do at contract renewal.
Adoption depth varies with how many functions the district actually turned on. Many deployments purchased after an incident use the safety features and never adopt routing at all, which leaves the platform replaceable and the vendor earning the least profitable part of its product. Districts using routing have restructured their transport operation around it. That difference explains almost all the retention variation between apparently similar accounts.

The buyer moves depending on why the purchase is happening. An incident brings the superintendent and the school board into a decision that normally sits with a transport director. Electrification funding brings facilities and finance. Routing should bring the superintendent and rarely does, because vendors present it to the transport office. Suppliers organised around one buyer are prepared for one of three ways this purchase starts.
smart-school-bus-platform-market-end-use-penetration-index-1788455036870

Where These Platforms Sell

These are among the four positions where our research anticipates prominent divergence between winners and laggards over the coming forecast period. Each is grounded in the demand model, the regulatory perimeter, and the announced capacity pipeline.
01 / STAFFING ARGUMENT FRAMING

Present routing as driver relief, never as fuel

Driver vacancies near 12% force districts to combine or cancel routes, and a cancelled route reaches parents and the school board within a day while a fuel budget reaches nobody at any point. Routing that removes around 9% of route miles removes routes a district could not staff, which is a superintendent problem rather than a transport department one, and proposals framed that way approve at roughly 3 times the rate. The capability is identical and only the audience changes.
02 / REGIONAL INCIDENT READINESS

Be already known when the incident happens nearby

Roughly 68% of deployments follow a publicised local safety event that no vendor can create or predict, but any vendor can prepare for by holding relationships and reference material across neighbouring districts before anything occurs in their own area. Suppliers with existing regional presence convert those opportunities at around 4 times the rate of competitors arriving afterwards as strangers with a brochure and no history. It is an uncomfortable commercial posture to describe internally and it is precisely what this market actually rewards.
03 / FUNDING PROGRAMME ATTACHMENT

Arrive as a requirement, not as a proposal

Public electrification funding obliges charge scheduling and route feasibility capability that no district can manage on spreadsheets alone, and roughly 7% of the fleet has converted with substantially more already committed under those programmes. Vendors positioned inside those programmes reach districts that declined software purchases for years on cost grounds alone, and funding-attached deployments close in around half the time that discretionary ones take. The programme timetable is entirely public and remarkably few vendors have organised around it at all.
04 / COMPLIANCE RATE DISCLOSURE

Publish the tap rate before the district measures it

Ridership verification records around 76% of boardings because enforcement depends entirely on drivers who are scarce, overworked and were never recruited to monitor attendance in the first place at all. Vendors offering passive detection, or disclosing compliance honestly alongside a credible plan to improve it, retain accounts through the discovery and and retention differs by roughly 24 percentage points on that alone. It costs a supplier the cleaner claim during procurement and buys the renewal conversation three years afterwards instead.

Engagement Snapshot From the Field

A live engagement with an industry participant carrying material or product regulatory and market exposure ahead of a defining policy shift, showing how our research translates into a defensible multi-year portfolio strategy.
MARKET MINDS ADVISORY · CLIENT ENGAGEMENT SUMMARY
Smart School Bus Platform Producer Strategic Portfolio Review and Transition Roadmap 2026·Investment Scenario on Smart School Bus Platform Exposure Evaluation 2025-26
CLIENT PROFILE
A school district operating approximately 310 buses across 54 schools with roughly 26,000 daily student riders (client-reported, unverified by MMA). A platform had been purchased four years earlier following an incident in which a young child remained on a bus after the afternoon route, and only the safety features had ever been switched on at any point since.
STRATEGIC CHALLENGE
Driver vacancies had reached 34 positions and the district was cancelling routes weekly, generating parent complaints that had reached the school board twice (client-reported, unverified by MMA). Transport had requested additional driver funding of roughly USD 2.1 million. Nobody had connected the staffing crisis to routing capability the district already owned and had never used.
MMA APPROACH
MMA examined which platform functions were actually in use rather than reviewing the contract, which the district had renewed without discussion twice. We modelled route consolidation using the district's existing platform, interviewed 19 transport, school and district staff, and measured recorded ridership against manual counts on a sample of routes.
KEY FINDINGS
  1. Routing optimisation had been licensed for four years and never configured, because it was purchased as part of a safety package nobody revisited afterwards.
  2. Modelled route consolidation removed 22 separate routes without extending any single student ride beyond the district's own published maximum ride time standard.
  3. Ridership tap compliance measured about 71% against manual counts, well below what the original safety justification had assumed it would be in practice.
  4. The additional driver funding request of USD 2.1 million roughly matched the annual cost of the routes that consolidation would have removed entirely.
CLIENT PROFILE
A school district operating approximately 310 buses across 54 schools with roughly 26,000 daily student riders (client-reported, unverified by MMA). A platform had been purchased four years earlier following an incident in which a young child remained on a bus after the afternoon route, and only the safety features had ever been switched on at any point since.
STRATEGIC CHALLENGE
Driver vacancies had reached 34 positions and the district was cancelling routes weekly, generating parent complaints that had reached the school board twice (client-reported, unverified by MMA). Transport had requested additional driver funding of roughly USD 2.1 million. Nobody had connected the staffing crisis to routing capability the district already owned and had never used.
MMA APPROACH
MMA examined which platform functions were actually in use rather than reviewing the contract, which the district had renewed without discussion twice. We modelled route consolidation using the district's existing platform, interviewed 19 transport, school and district staff, and measured recorded ridership against manual counts on a sample of routes.
KEY FINDINGS
  1. Routing optimisation had been licensed for four years and never configured, because it was purchased as part of a safety package nobody revisited afterwards.
  2. Modelled route consolidation removed 22 separate routes without extending any single student ride beyond the district's own published maximum ride time standard.
  3. Ridership tap compliance measured about 71% against manual counts, well below what the original safety justification had assumed it would be in practice.
  4. The additional driver funding request of USD 2.1 million roughly matched the annual cost of the routes that consolidation would have removed entirely.
RECOMMENDED STRATEGY
Phase 1: Configure the routing capability the district already licenses, since consolidation removes more routes than the funding request would have staffed. Phase 2: Move ridership verification to passive detection, because driver enforcement will simply not improve while vacancies remain anywhere near current levels. Phase 3: Report transport to the school board on routes staffed rather than on cost per mile, since that is the measure parents actually experience.
OUTCOME
Route consolidation removed 19 routes in practice and the additional driver funding request was withdrawn (client-reported, unverified by MMA). Weekly cancellations fell to almost none, and passive ridership detection raised recorded boardings to about 96% on the routes where it was installed during the first phase.

Frequently Asked Questions

Foundational context covering the market sizes, CAGR, scope, country, region and competition that inform every finding below. This section is provided to cover basics and most often pre-purchase conversations, answered from the MMA Primary Research Dataset.

What is the current size of the Smart School Bus Platform Market?

The market was worth USD 1.3 billion in 2025 and reaches USD 1.48 billion in 2026. Roughly 68% of deployments follow a publicised local safety incident.

How large will the Smart School Bus Platform Market be by 2036?

MMA forecasts USD 5.30 billion by 2036, an expansion of 3.58 times over the forecast period. That represents USD 3.82 billion of incremental annual revenue against 2026.

What is the CAGR for the Smart School Bus Platform Market 2026 to 2036?

The base case is 13.6% compound annual growth, with a bull case at 14.8% and a bear case at 12.4%. Electrification funding levels separate the scenarios most clearly.

Which segment is growing fastest?

Electric fleet charge and route management grows at 20.4%, half again the market rate of 13.6%. An electric bus must reach a charger, which makes routing a constraint.

Who are the major companies in the Smart School Bus Platform Market?

Zonar Systems, Samsara, Tyler Technologies, Transfinder and BusPatrol lead on measured platform and hardware revenue. Together they hold roughly 47% across three quite distinct supplier types.

Which country is growing fastest?

India grows fastest at 16.6%, on large private school fleets where parents pay transport fees directly and expect visibility in return for the fees they are paying.

Report Segmentation Architecture

The full report scope spans multiple orthogonal segmentation dimensions, with cross-tabulated demand data provided for each dimension pair. Coverage extends further to regional breakdowns, trend trajectories, and the competitive detail needed to support segment-level decision-making.

By Primary Market Dimension

  • Electric Fleet Charge and Route Management
  • Routing Optimisation and Driver Allocation
  • Student Ridership Verification
  • Parent Notification and Communication
  • Onboard Video and Safety Monitoring
  • Stop-Arm Enforcement and Violation Capture

By End-Use Industry

  • Public School Districts
  • Private and Independent Schools
  • Contracted Transport Operators
  • Special Educational Needs Transport
  • Charter and Activity Transport
  • Municipal and Rural Services

By Commercial Dimension

  • District Subscription Contracts
  • Funding Programme Deployments
  • Contractor Operated Fleets
  • Enforcement Revenue Programmes
  • Hardware and Installation Supply
  • Reseller and Integrator Channels

By Region

  • North America
  • Western Europe
  • East Asia
  • South Asia and Pacific
  • Middle East and Africa
  • Latin America
  • Eastern Europe

Scope, Methodology, and Coverage

Every figure in this report is reproducible from documented input assumptions. The scope below maps the historical period, the forecast horizon, the segmentation dimensions, and the countries covered, alongside the underlying primary and qualitative methodology.
Historical Period
2020 to 2025
Forecast Period
2026 to 2036
Base Year
2025 (USD billions; MMA Primary Research Dataset, September 2026)
Market Definition
This market covers platforms and onboard systems managing student transport operations and safety, spanning electric fleet charge and route management, routing optimisation and driver allocation, student ridership verification, parent notification and communication, onboard video and safety monitoring, and stop-arm enforcement and violation capture. Revenue is measured as platform subscription, onboard hardware, installation and attributable service value at supplier level. Buses and vehicle chassis themselves, charging infrastructure hardware and electrical works, general commercial fleet telematics outside student transport, student information and scheduling systems, and violation fine revenue collected by authorities are excluded from scope.
Quantitative Units
USD billions, platform subscription, hardware and attributable service revenue at supplier level
Segmentation Dimensions
Platform function, operator type, commercial model, region
Regions Covered
North America, Western Europe, East Asia, South Asia and Pacific, Middle East and Africa, Latin America, Eastern Europe
Countries Covered
United States, Canada, Mexico, Brazil, Chile, Colombia, Argentina, United Kingdom, Germany, France, Netherlands, Sweden, Spain, Italy, Poland, Romania, Czechia, Japan, South Korea, China, India, Australia, Indonesia, Malaysia, Philippines, Thailand, United Arab Emirates, Saudi Arabia, Qatar, Kenya, Nigeria, South Africa
Key Companies Profiled
Zonar Systems, Samsara, Tyler Technologies, Transfinder, BusPatrol, Geotab, Verra Mobility, Lytx, Safe Fleet, Gatekeeper Systems, Edulog, CalAmp, Michelin Connected Fleet, Rand McNally, AlphaRoute, HopSkipDrive, Bytecurve, Blue Bird, Thomas Built Buses, IC Bus
Quantitative Methodology
Primary survey, n=3,800 respondents, Q4 2025, six countries; demand-side model with trade association cross-validation
Qualitative Methodology
47 expert interviews, Q4 2025; applied to validate demand model assumptions, identify emerging dynamics, and assess competitive positioning
Report Format
PDF and XLSX data workbook (Word format preview document)
Publisher
Market Minds Advisory
Report Code
MMA-2026-TEC-221
Published
September 2026
Contact
sales@marketmindsadvisory.com | www.marketmindsadvisory.com

Purchase the full Smart School Bus Platform Market Report (2026 to 2036).

The full MMA report explains why this market is governed by incidents rather than business cases, and why the strongest commercial argument available has gone almost entirely unused. It sizes the market to 2036 across six platform functions, seven regions and 32 countries, with segment growth rates and regional demand mechanisms detailed. Competitive analysis covers 20 suppliers assessed on measured platform and hardware revenue, with moat and risk assessment for the two leaders. The report quantifies hardware and installation cost structure, compliance economics and margin architecture across three portfolio tiers. It closes with four verdicts and an anonymised school district engagement.
Six platform functions sized through 2036
Seven regions with demand mechanism analysis
Twenty suppliers on consistent revenue basis
Vacancy, compliance and route reduction benchmarks
Margin architecture across three portfolio tiers
Anonymised school district transport platform engagement

Built For The People Who Decide

From boardroom strategy to bench-side execution, this report is read cover-to-cover by leaders shaping the next decade of their industry, turning demand scenarios, market dynamics and valuation benchmarks into decisions.
CXOs/ Presidents/ VPs/ Managers
M&A and Corporate Development
Strategy Teams and R&D Heads
Procurement and Product Directors
Regulatory and Compliance Leaders
Investor Relations and Equity Analysts