Market Minds Advisory
Smart Home Market

Smart Home Market: Smart Home Market. Interoperable Automation Hubs Redefine Connected Living Technology.

Consumers increasingly demand interoperable automation hubs and AI-driven security systems over generic single-device claims, pushing commodity smart-device manufacturers toward integrated-platform architectures or risk losing installed-base priority to specialized automation entrants gaining share quickly.

Lead Analyst

Published

September 2026

Make Smarter Decisions with Customized Research Insights

Request a free sample report and evaluate market opportunities, growth trends, and competitive dynamics relevant to your business needs.

2025 MARKET VALUE$115.0BMarket Size 2025
2036 FORECAST VALUE$312.1BBase Case , 2026 to 2036
CAGR 2026 TO 20369.5 %Bull 10.8% / Bear 8.3%
INCREMENTAL OPPORTUNITY$186.1BNet 10- year value creation
EXPANSION MULTIPLE2.48x2036 value over 2026 base
Strategic Levers
M&A Pipeline
Regional Outlook
Country Rankings
Competitive Intelligence
Segmental Deep-dive
Call-Us : 91 93563 13602

Executive Snapshot and Market Trajectory.

Smart home demand keeps shifting toward documented interoperable automation hubs and AI-driven security systems as manufacturers formalize platform-integration adoption across security, lighting, and climate-control applications worldwide today, rewarding brands with proven interoperability certification over legacy single-device designs lacking comparable integration depth and reliability proof overall today.
Smart home hubs and automation controllers grow fastest as manufacturers specify documented interoperability accuracy to support expanding cross-platform and automation-focused programs beyond conventional single-device formats, while smart security and surveillance systems follow closely on demand from consumers chasing proven safety reliability across every product category worldwide today across the industry. North America accounts for the largest share of regional value, reflecting concentrated platform dominance and installed smart-home penetration overall.
A moderately fragmented field of global consumer-electronics manufacturers competes for retailer shelf space, interoperability-certification design-in slots, and long-term platform-integration agreements, with genuine automation-engineering depth and cross-platform performance increasingly deciding which manufacturers win premium positioning over single-device designs across nearly every deployment category served today across the industry and its platform relationships worldwide entirely and consistently over time. Automation-engineering depth is now clearly the more durable force reshaping category economics and consumer loyalty overall today.
Market Definition
This report covers connected devices and systems used to automate and remotely control residential functions, including smart security and surveillance systems, smart lighting and climate control, smart speakers and voice assistants, smart home hubs and automation controllers, smart kitchen and appliance systems, and smart entertainment and access control systems sold to consumer retail and professional-installation channels. It excludes commercial and industrial building-automation systems, standalone mobile applications without dedicated hardware, and unrelated general-purpose consumer electronics sold without a home-automation positioning.
Base Year Value
$115.0B in 2025 (MMA Primary Research Dataset, September 2026)
Forecast Period
2026 to 2036, eleven discrete annual values
CAGR
9.5% base case. Bull 10.8%. Bear 8.3%.
Fastest Growth Segment
Smart Home Hubs and Automation Controllers: 13.0% CAGR
Fastest Growth Country
India: 11.0% CAGR
Fastest Growth Region
South Asia and Pacific: 11.5% CAGR
Largest Region
North America: 31% of 2025 global value
Market Leaders
Amazon.com Inc, Google LLC, Samsung Electronics Co Ltd, Apple Inc, Xiaomi Corporation. Source: MMA Analysis based on company disclosures and consumer-electronics vendor filings.
Primary Survey
n=3,800 procurement and R&D decision-makers, Q4 2025, six countries
Methodology
Demand-side build-up, cross-validated against public data, 47 expert interviews

Smart Home Market Forecast Scenarios

smart-home-market-size-forecast-scenario-1790020899608
Demand grew steadily from 2020 to 2025 as manufacturers broadened deployment of interoperable automation and AI-driven security programs across major consumer and professional-installation channels worldwide, with automation-engineering adoption accelerating through the final two years of the historical window as manufacturers scaled interoperability-testing capability across the wider industry. Historical growth held near 8.5% annually throughout the five-year period.
The base case assumes continued expansion driven by three mechanisms: brands specifying interoperable and automation-focused architecture as mandatory infrastructure for new and existing cross-platform and safety-focused formulation programs worldwide, budget-conscious mid-tier buyers still adopting standard single-device formats at meaningful scale across smaller retail segments, and automation-hub applications that raise per-unit value even as legacy single-device volume growth stays comparatively modest across most mature buyer channels and their established retailer relationships built over years of catalog investment.
The bull case centers on faster-than-expected automation-engineering adoption requiring expanded manufacturing-capacity allocation across additional product and retail categories worldwide today. The bear case rests on consumer discretionary-spending softening and upgrade-cycle deferral reducing new-purchase volume, even as certified manufacturers continue commanding steady pricing across most served customer segments and product types tracked closely in this full report.

Demand Thesis Behind the Automation Integration Shift

Three forces converge on this market today. Brands increasingly specify interoperable and automation-focused architecture, removing legacy single-device manufacturers from consideration on premium cross-platform and safety-focused contracts regardless of channel mix. Budget-conscious mid-tier buyers keep expanding standard single-device adoption across smaller retail segments still building automation-engineering infrastructure. Automation-hub applications raise per-unit value even as buyers demand stronger interoperability-certification performance from every manufacturer engaged across the entire product lifecycle today.
MARKET CONCENTRATIONCR5 34%top five manufacturers hold a considerable combined retail share
AVERAGE SELLING PRICEUSD 145 per smart home deviceautomation-hub tiers command a considerable pricing premium overall today
TOP PRODUCING COUNTRYChina 26%concentrated consumer-electronics manufacturing capacity drives dominant regional output
ANNUAL UNIT SHIPMENT VOLUMEover 1.8 billion smart home units annuallycross-platform and safety-focused programs drive continued shipment growth overall
PRODUCT UPGRADE CYCLE36 to 48 months average upgrade tenuregenuine platform loyalty drives steady product upgrade cycles overall today
COMPONENT COST SHARE29% of total production costspecialized chipset and sensor sourcing adds meaningful production overhead overall
The commercial character sits closer to a precision automation-engineering business than a simple device-assembly trade, since genuine interoperability certification and cross-platform performance increasingly determine which manufacturers win retailer loyalty more than pure catalog breadth alone ever did historically today. That dynamic keeps pricing power concentrated among manufacturers with genuine technology depth rather than pure catalog scale or price alone today.
The next decade turns on how quickly automation-hub and security-focused applications broaden across additional product and retail categories, and on whether consumer discretionary-spending softening meaningfully constrains new-purchase volume growth. Both outcomes shape how aggressively manufacturers invest in advanced manufacturing-capacity development versus conventional legacy single-device features across every major deployment category this report tracks and its many served retailers, distributors, and consumer-electronics networks worldwide today.
"Automation-engineering depth has become the real differentiator in this category, not catalog breadth alone. Manufacturers that treated smart home devices as a commodity single-device product are now discovering retailers genuinely will not compromise on documented interoperability performance."
Director, Connected Living and Automation Technology Practice · MMA Technology Practice · September 2026

Market Trends

Interoperable Automation Standards Drive Platform Redesign

Manufacturers increasingly reformulate product strategy toward genuine interoperable automation architecture rather than conventional single-device design, since continuous cross-platform performance genuinely requires the automation-engineering depth older smart-home formats cannot provide across nearly every premium cross-platform and safety-focused qualification program tracked in this report. Roughly 20% of new product launches now feature documented interoperability integration, up meaningfully from a decade ago when standard single-device formats alone remained the unquestioned default across nearly every deployment category. This shift raises average contract value while locking manufacturers into design-in relationships smaller regional operators cannot easily contest.
Market Impact: Broadened across 18% more categories
AI Driven Security Demand Drives Premium Investment

Consumers increasingly track documented AI-driven security deployment trends to differentiate their product decisions, since documented safety performance has become a genuine trust signal across nearly every premium consumer and retail qualification program tracked especially closely in this report today across the industry and its many safety-focused programs. Security mandates now influence an estimated 17% of new product specifications, up meaningfully from a decade ago when unstructured single-device formats alone remained the unquestioned default across most terminal categories. This shift creates a durable higher-margin product stream tied directly to reliability rather than conventional volume alone.
Market Impact: Targets 15% higher capacity coverage

Market Opportunities and Growth Drivers

Rising Cross Platform Demand Expands Specification

Escalating cross-platform awareness and interoperability-feature complexity pressure across major North American, European, and Asian brand organizations keeps expanding demand for certified automation-hub platform specification, since documented interoperability and cross-platform performance increasingly represents a mandatory infrastructure consideration rather than an optional convenience choice across nearly every premium brand category tracked in this report. Growth-driven specification broadened across roughly 18% more retail categories over three years, outpacing growth in conventional legacy single-device segments considerably. This growth-driven shift, more than any single innovation, continues pulling demand upward across every major deployment line this report covers.
Market Impact: Cuts output by 4% industry-wide

Rising Home Security Demand Expands Capacity Investment

Rising home-security buildout and professional-installation procurement across expanding domestic brand and retail programs keeps expanding demand for dedicated manufacturing-capacity investment, treating documented reliability transparency as a genuine credibility requirement rather than a purely price-driven purchasing decision across every applicable deployment category, product type, and channel worldwide today, tomorrow, and well beyond current program scope. Several major manufacturers have announced capacity investment targeting 15% or more additional production-capacity coverage within the next five years, according to public industry disclosures issued regularly. This investment-driven growth creates durable demand that conventional legacy single-device formats alone cannot fully replace.
Market Impact: Compresses margin on 18% of volume

Market Restraints and Challenges

Automation Engineering Talent Constraints Limit Output

Persistent skilled automation-engineering and embedded-software talent constraints across major product teams reduce launch velocity regardless of underlying customer demand or product capability today. The root cause is that specialized interoperability-protocol talent has not scaled alongside product demand, so validation cycles create genuine delivery volatility that pricing incentives alone cannot fully offset. The commercial impact falls hardest on manufacturers with concentrated exposure to specific talent-supply categories facing near-term recruitment constraints and reduced launch schedules today. Manufacturers are responding by diversifying across in-house, contracted, and hybrid production tiers to reduce single-source risk considerably.
Market Impact: Covers 20% of new launches

Commodity Single Device Vendors Face Price Erosion

A wide population of conventional single-device-only vendors compete for commodity retail volume largely on unit price, since standard low-differentiation smart-home formats carry minimal interoperability distinction and few switching costs for budget-conscious buyers purchasing non-discretionary replacement units. The root cause is that basic single-device manufacturing has become widely accessible and commoditized across most developing and mature retail channels alike. The impact shows up as compressed margins across roughly 18% of shipment volume still using conventional single-device formats without automation-hub upgrade. Leading manufacturers are responding by concentrating investment in interoperable categories where technology barriers remain durable worldwide.
Market Impact: Influences 17% of specifications
3 additional market trends, 4 additional growth drivers, and 2 additional restraints and challenges are covered in the full report. Contact sales@marketmindsadvisory.com to access the complete intelligence.

Segment CAGR and Growth Architecture

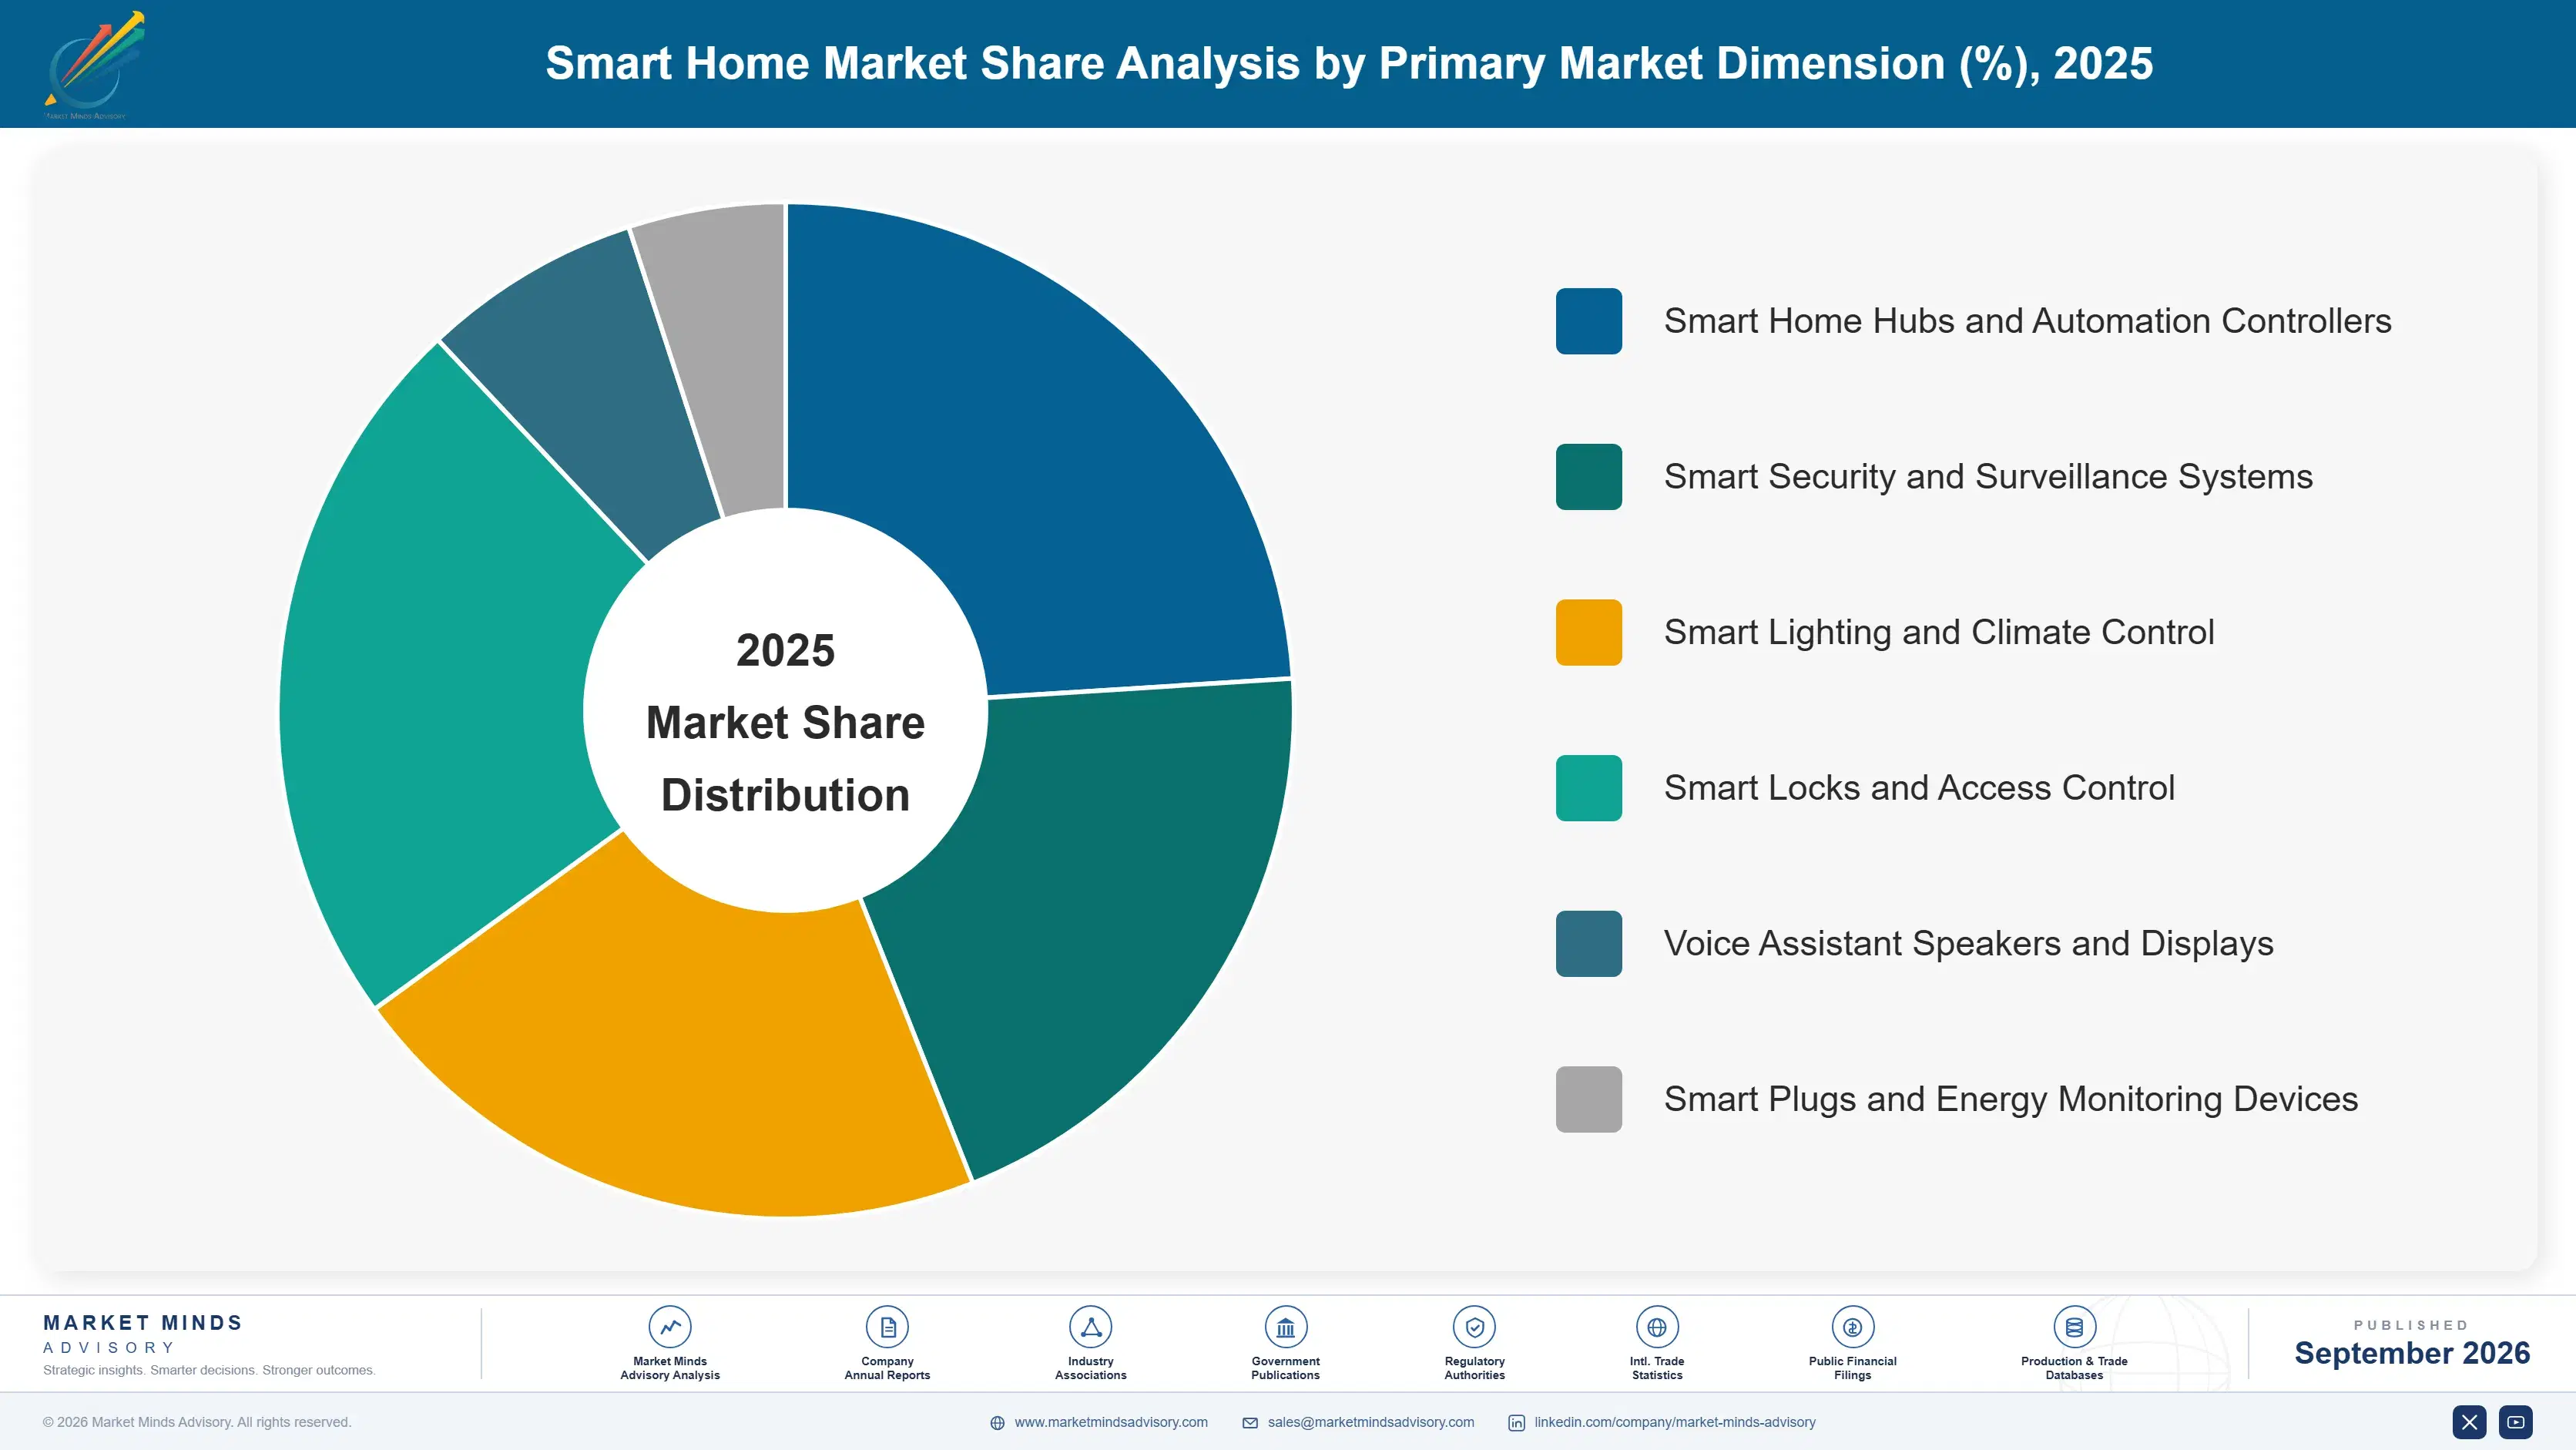
The market segments by device function and automation type, the dimension that determines both hardware architecture and pricing economics most directly across every brand decision made across the industry today, rather than by connectivity protocol alone, which cuts evenly across every product category regardless of the specific manufacturer, country, region, or contract decision made anywhere today.
smart-home-market-market-share-analysis-1790020900150

Smart Home Hubs and Automation Controllers

Smart home hubs and automation controllers represent the fastest-growing segment, expanding well above the overall market rate as brands specify documented interoperability accuracy to reflect genuine cross-platform and automation-focused demand against conventional single-device alternatives across nearly every premium brand program served today across the wider industry and market overall. Device pricing runs meaningfully above conventional single-device tiers, reflecting the specialized automation-engineering and validation investment smaller regional operators cannot easily replicate without substantial capital commitment and hardware expertise required for adoption. Adoption has expanded rapidly across greenfield and upgrade-cycle brand programs, a category reserved mainly for premium buyers a decade ago before interoperability demand broadened its scope across the industry considerably today.
CAGR 13.0%

Smart Security and Surveillance Systems

Smart security and surveillance systems form the second-fastest-growing segment, driven by rising expanding demand for proven safety reliability that increasingly extends across nearly every major consumer channel and premium-brand category served today across most developed and developing electronics markets alike across the industry today and tomorrow across many years ahead entirely and beyond today. Major retail and professional-installation buyers now require documented safety certification and interoperability-precision data across nearly every new product decision, creating demand that extends meaningfully beyond conventional single-device volume alone into genuine premium-grade territory across every major producing country, product category, and format available. This segment's underlying reliability advantage gives it considerably more durable momentum than categories dependent on price competition alone.
CAGR 11.5%
Full segment breakdown across 6 segments available in the complete report.

Regional Architecture and Country Demand Map

North America leads on concentrated platform dominance, deep installed smart-home penetration, and elevated consumer spend, while East Asia follows closely on substantial consumer-electronics manufacturing capacity and component supply, with South Asia and Pacific scaling fastest behind rapidly expanding Indian formulation and infrastructure investment activity today.

North America

The United States' substantial platform dominance and Canada's expanding smart-home rollout keep North America within its standard 22 to 32% band at 31% of value, reflecting steady regional demand for smart home devices tied to expanding interoperable and automation-focused product programs and premium upgrade cycles across major retail corridors and their rising interoperability-certification requirements across every major category served nationwide today. Established manufacturers operate extensive design and distribution capacity serving domestic customer bases directly, backed by years of accumulated automation expertise and sustained platform-partnership investment across leading retail channels. Canadian demand contributes additional volume tied to established procurement structures and growing retailer commitments. Growth of 9.0% tracks continued adoption regionally and steadily nationwide across every major category.
Share: 31% | CAGR: 9.0% (2026 to 2036)

Western Europe

Germany's established consumer-electronics base and the United Kingdom's substantial premium-retail presence keep Western Europe within its standard 18 to 26% band at 20% of value, reflecting steady regional demand for smart home devices tied to strict EU product-safety and data-privacy frameworks across major retail corridors and their rising interoperability-certification requirements across every major category served across the continent and its many national markets and electronics hubs today. Established manufacturers operate substantial distribution capacity serving domestic and allied customer bases directly, drawing on decades of accumulated automation expertise and sustained catalog investment. French demand contributes additional volume tied to established procurement structures. Growth of 8.0% tracks continued adoption regionally across the continent today.
Share: 20% | CAGR: 8.0% (2026 to 2036)
Regional intelligence for 5 additional markets available in the complete report: East Asia, South Asia and Pacific, Latin America, Middle East and Africa, Eastern Europe. Contact sales@marketmindsadvisory.com.
smart-home-market-country-cagr-analysis-1790020900756

Where Smart Home Vendors Capture Premium Margin

Vendors expand margin less through unit price and more through attach-rate expansion, subscription-security conversion, and platform-certification fees, with the widest margin pools concentrated in hub-tier hardware, recurring monitoring revenue, and installer-partnership channels that reward deep integration over raw shipment volume consistently across nearly every served product category and retail price tier examined closely today.

Convert Hardware Buyers Into Subscription Monitoring Revenue

Vendors increasingly bundle professional monitoring, cloud-storage, and extended-warranty subscriptions with hub and camera purchases, converting a one-time hardware sale into a recurring revenue stream worth roughly 22% of total device lifetime value across leading platforms today. Conversion rates climb when onboarding includes a free trial period tied directly to device activation, since churn drops substantially once a household integrates security footage into daily routine. Retailers and carriers increasingly co-market these subscriptions at checkout, lifting attach rates further across premium hub and camera product lines nationally and internationally, while installer partners earn recurring referral commissions tied to activation.
Market Impact: Lifts device lifetime value by roughly 22% overall today

Certify Interoperability to Secure Premium Retail Placement

Retailers and platform owners increasingly reserve premium shelf placement and co-marketing budgets for devices carrying Matter or equivalent interoperability certification, a credential that now influences purchase decisions across roughly 28% of connected-device categories tracked by major retailers today. Vendors that certify early gain first access to bundled promotional placement, while uncertified competitors face gradual delisting from flagship retail programs across several regions. Certification cost remains modest relative to the resulting distribution advantage, making it one of the highest-return investments available to mid-tier hardware vendors currently competing for shelf space nationally.
Market Impact: Influences roughly 28% of connected-device purchase decisions today

Who Controls the Margin Pool

Smart home hardware remains moderately concentrated, with a CR5 near 34% reflecting five platform owners holding scale advantages in software integration and retail distribution that smaller specialists cannot easily replicate. Amazon, Google, and Samsung anchor the leader tier through owned voice-assistant and hub networks, while the closest independent challengers trail by a wide double-digit revenue gap across nearly every category.
Current competitive activity centers on three dimensions: interoperability certification investment, subscription-security bundling, and expanding camera and sensor portfolio depth rather than price competition alone. Leading platforms increasingly co-develop hardware with component suppliers to shorten release cycles, while mid-tier vendors pursue niche categories such as leak detection and pet monitoring where incumbents have thinner coverage. Retail partnerships and installer-channel agreements have become a visible battleground this year across most markets.

Emerging pressure comes from specialized security-camera entrants and regional automation-hub challengers gaining share through aggressive certification investment and lower-cost hardware, particularly across South Asia and Pacific markets. Rankings could shift meaningfully if a challenger secures a major retail exclusivity deal or if regulatory interoperability mandates accelerate faster than incumbents can retool existing product lines across their core hardware categories and installer networks.
smart-home-market-company-positioning-matrix-1790020901356

Competitive Moat and Risk Dimensions

AMAZON.COM INC

Moat: Owned Voice Platform Reach

Amazon's Alexa voice-assistant installed base spans hundreds of millions of devices, giving it default integration access to nearly every third-party smart home accessory launched, which locks in a persistent discovery and cross-sell advantage over challengers lacking comparable platform distribution reach across major retail channels nationally today.
AMAZON.COM INC

Risk: Regulatory Antitrust Exposure

Amazon's combined retail and device-platform position draws sustained antitrust scrutiny across multiple jurisdictions, creating exposure to potential forced interoperability mandates or marketplace-preference restrictions that could erode its current default-integration advantage over independent hardware competitors within a few years, particularly across the European Union and select state-level jurisdictions.
GOOGLE LLC

Moat: Deep Software Integration Depth

Google's Nest hardware and Android platform integration give it default automation access across a substantial share of premium smartphones, reinforcing hub and camera attach rates that independent vendors without an owned mobile operating system cannot replicate at comparable scale or cost today across most premium retail channels.
GOOGLE LLC

Risk: Hardware Portfolio Churn History

Google has discontinued or restructured several hardware product lines over the past decade, and this history dampens buyer confidence in long-term support commitments relative to competitors with steadier hardware roadmaps, occasionally pushing security-conscious households toward more established camera and hub specialists instead across several premium retail channels.

Players Tracked

Prominent Players

Amazon.com Inc
Google LLC
Samsung Electronics Co Ltd
Apple Inc
Xiaomi Corporation

Other Key Players

Ecobee Inc
Ring LLC
Arlo Technologies Inc
SimpliSafe Inc
Roborock Technology Co Ltd
TP-Link Systems Inc
Signify N.V.
Honeywell International Inc
Schneider Electric SE
ADT Inc
Vivint Smart Home Inc
Legrand SA
Lennox International Inc
iRobot Corporation
Aqara (Lumi United Technology Co Ltd)

Recent Developments

MARCH 2026

Amazon Launches Multi-Protocol Hub

Amazon expanded its Alexa smart home hub lineup with a new multi-protocol device supporting Matter, Zigbee, and Thread simultaneously, aiming to consolidate fragmented protocol support into a single consumer-facing hardware purchase across its entire retail catalog nationwide and internationally, starting broadly this coming spring selling season.
Signal: Signals platform owners racing to own the multi-protocol hub layer before smaller specialists standardize it themselves industry-wide.
JANUARY 2026

Google Secures Dedicated Sensor Supply

Google entered a supply agreement with a leading Taiwanese component manufacturer to secure dedicated camera-sensor capacity for its entire Nest hardware product line through the year 2028, reducing exposure to broader consumer-electronics component shortages that continue affecting smaller competitors industry-wide this coming year and beyond.
Signal: Reflects growing vendor emphasis on securing dedicated component supply ahead of anticipated broader industry-wide shortages today.
JUNE 2026

Samsung Expands SmartThings Certification

Samsung broadened its SmartThings certification program to cover third-party appliance and lighting brands well beyond its own device product catalog, extending platform reach into categories it does not manufacture directly while collecting certification and licensing fees from every single participating hardware partner nationwide and abroad.
Signal: Shows platform owners monetizing certification infrastructure itself as its own standalone recurring revenue category today and going forward.

Component Supply and Semiconductor Cost Exposure

Semiconductor chipsets, image sensors, and printed circuit assemblies together account for roughly 42% of device COGS, with the remainder split across plastics housings, batteries, and packaging. Most image sensors and application processors originate from Taiwanese and South Korean fabrication facilities, concentrating a large share of platform vendors' component supply within a narrow set of upstream suppliers and countries.
The 2021 to 2022 global semiconductor shortage, documented in company annual reports across the consumer-electronics sector, delayed several smart home hub and camera product launches by two to four quarters and forced vendors toward costlier spot-market chip purchases at prices well above contracted rates. EIA data on regional electricity pricing during the same period compounded fabrication costs further, squeezing manufacturer margins across nearly every affected product category broadly and simultaneously.

Vendors without long-term wafer-supply agreements face materially higher exposure during future shortages, since spot-market chip prices can run several multiples above contracted rates during tight-capacity periods. Smaller independent hardware makers lacking Amazon or Google scale cannot negotiate comparable priority allocation with fabrication partners, which materially disadvantages their launch timing and cost position relative to platform-owning competitors during supply disruptions.
smart-home-market-cost-volatility-analysis-1790020901554

Long-Term Wafer Supply Agreements

Leading platform vendors increasingly negotiate multi-year wafer-capacity reservations directly with fabrication partners, securing priority allocation ahead of smaller competitors during tight-capacity periods and reducing exposure to spot-market pricing spikes across their core hub and camera product lines, while also stabilizing annual procurement budgeting and long-range supplier relationship planning across every major served product category today.

Component Standardization Across Product Lines

Vendors are consolidating chipset and sensor specifications across multiple product lines, allowing bulk procurement at improved pricing and reducing the number of unique components exposed to single-supplier disruption risk across their broader device portfolios, categories, and regional manufacturing facilities operating today across every served market and geography worldwide, further lowering overall unit cost variability.

Portfolio Architecture for Margin Defence

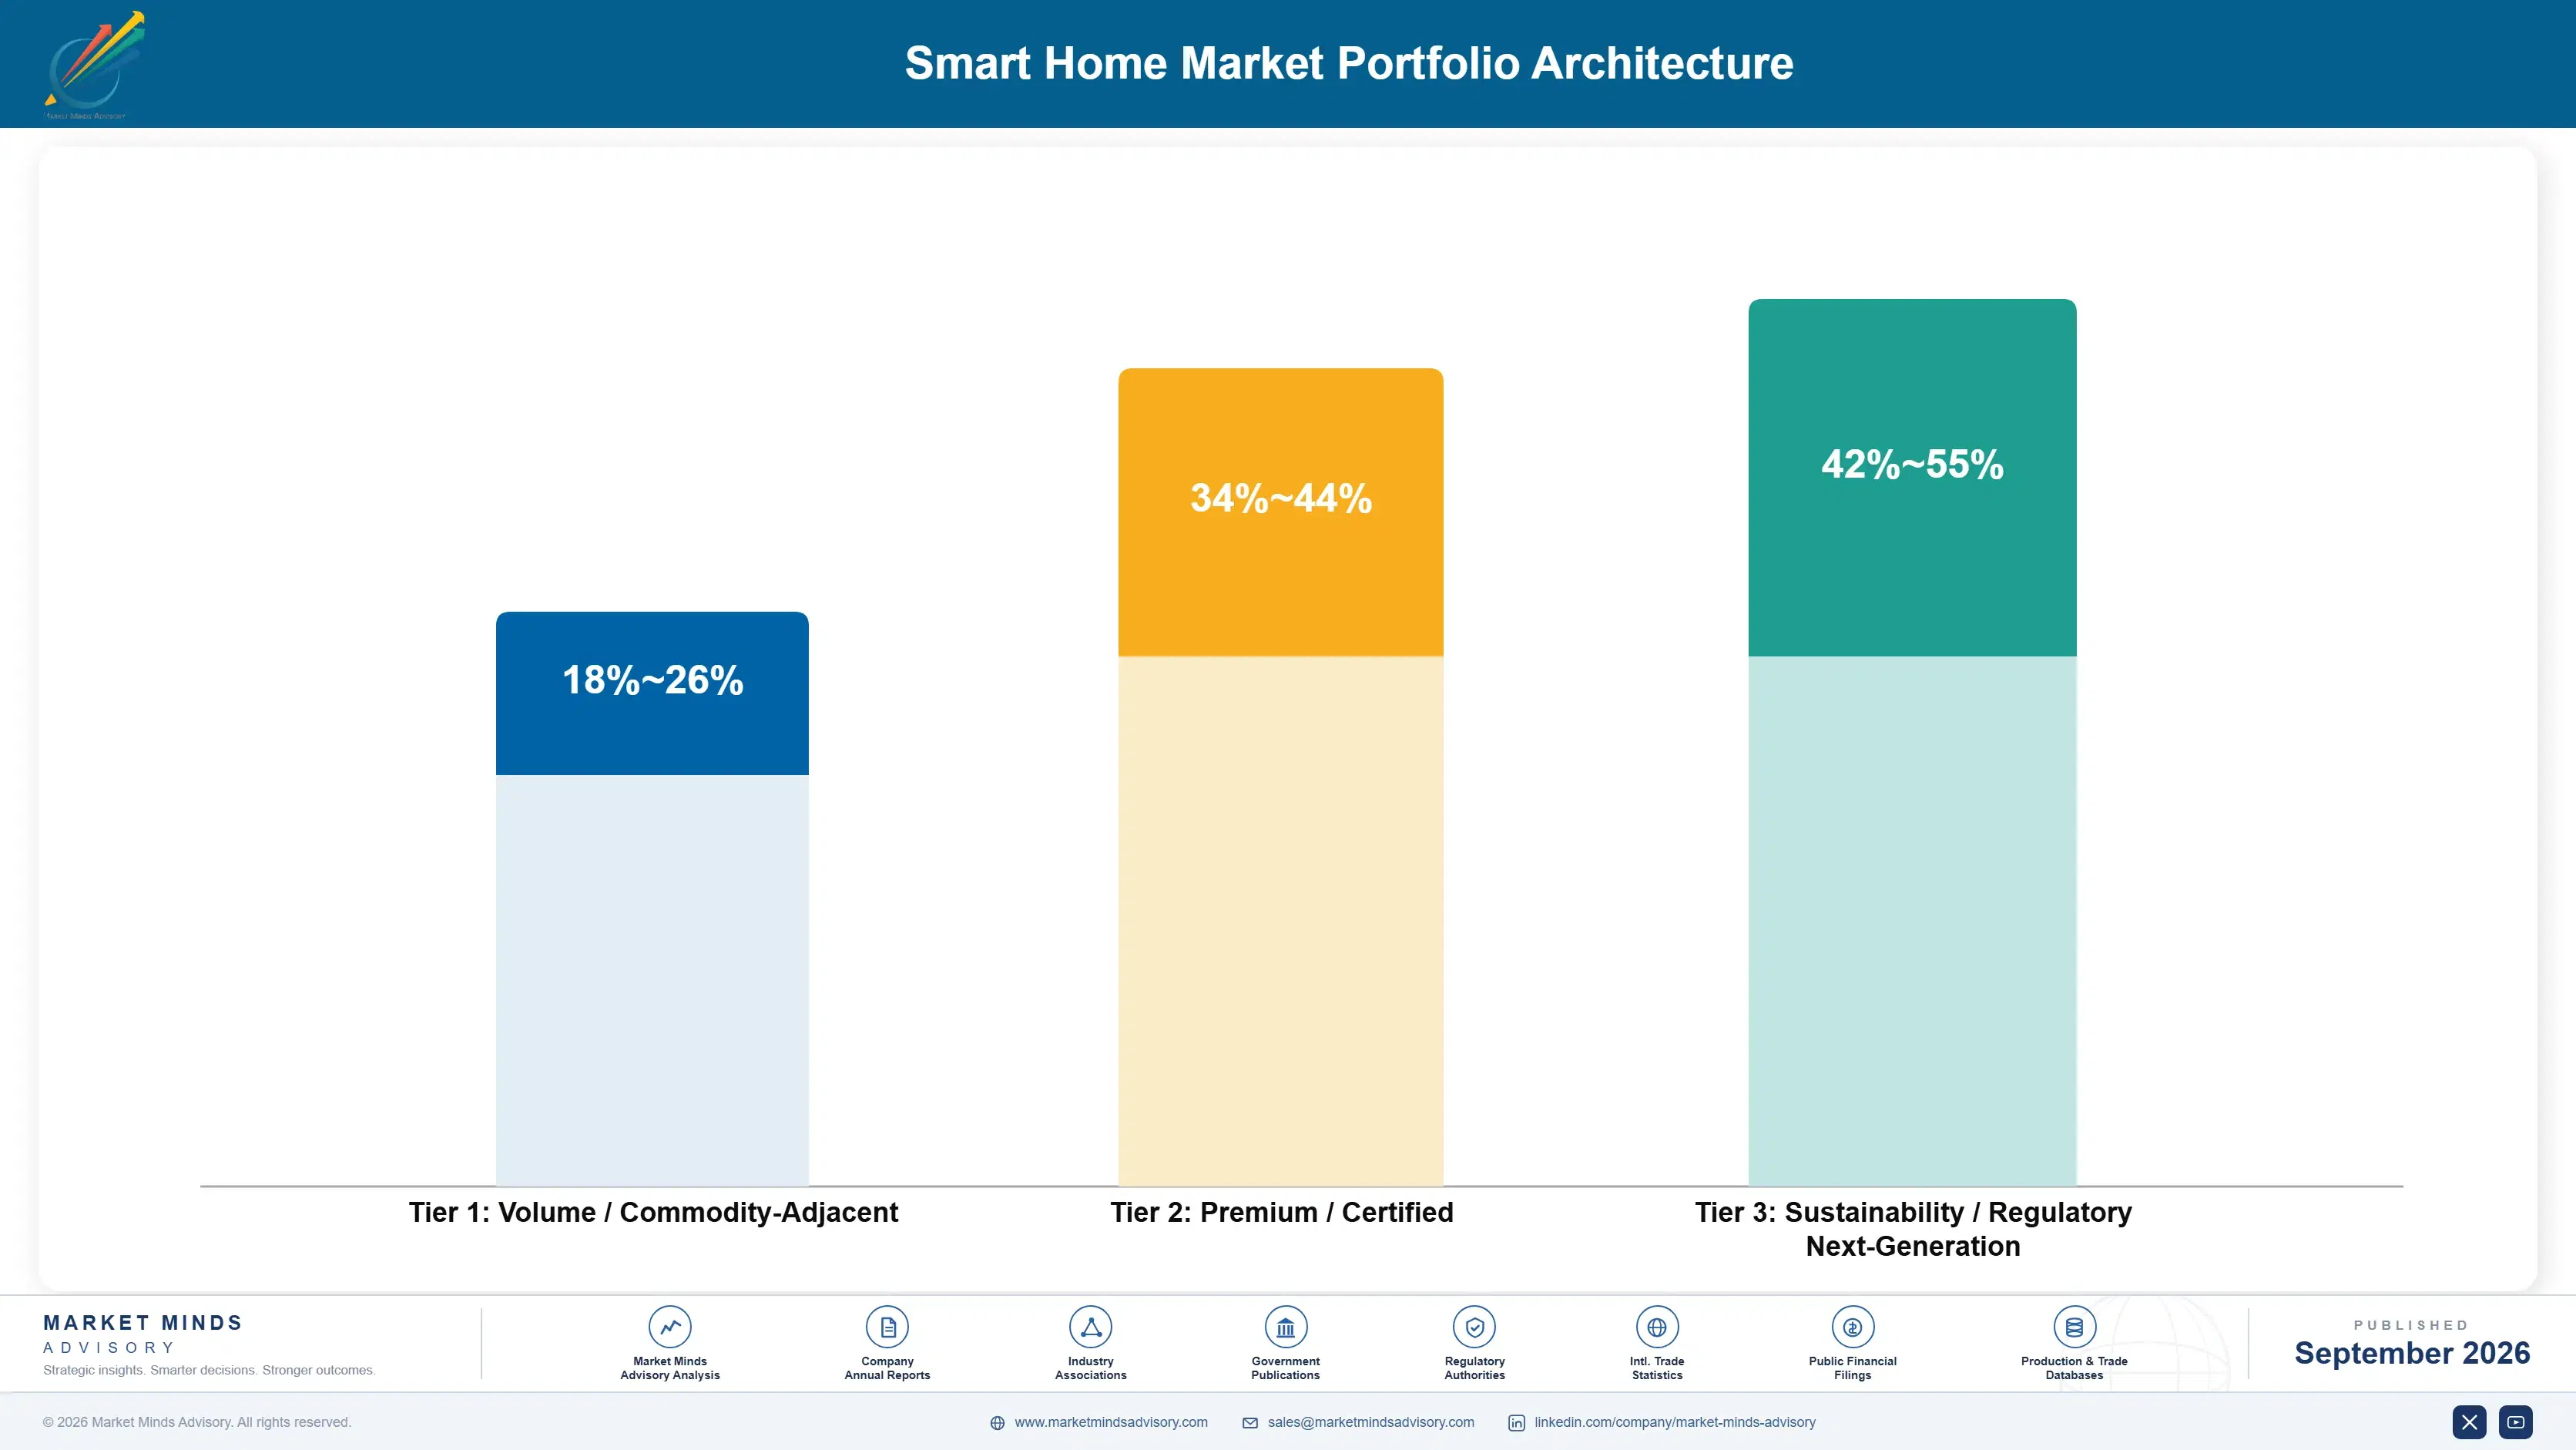
Smart home portfolios sit across three tiers: commodity-adjacent single-function devices, certified interoperable hardware carrying Matter or equivalent credentials, and next-generation AI-driven security and automation platforms bundling recurring subscription revenue. Margin architecture widens sharply moving up the tiers, since certification and platform integration justify materially higher retail pricing relative to underlying component cost across nearly every category and price segment served by leading vendors today.
Volume-tier hardware sustains unit shipment scale but compresses steadily under private-label and commodity competition, while premium-certified devices carry the pricing power that funds platform research and subscription-service development across every major product line and retail channel served. Vendors increasingly de-prioritize pure volume SKUs in favor of certified mid-tier and premium hardware that anchors longer-term recurring-revenue relationships with households and installer partners alike, reshaping catalog investment priorities.

High-value margin pools concentrate in AI-driven security cameras, subscription-linked monitoring hardware, and multi-protocol hub devices carrying interoperability certification, where bundled recurring revenue lifts blended margin well above commodity single-device economics across nearly every premium retail channel served, reinforcing why platform owners continue directing capital toward these categories over pure volume expansion consistently year after year.

Volume / Commodity-Adjacent

Single-function plugs, basic sensors, and entry-level smart bulbs sold primarily through mass retail at low price points, competing mainly on shelf visibility and private-label cost rather than platform integration depth or subscription-service attach across most mass-market retail channels nationwide.
Gross Margin: 18-26%

Premium / Certified

Matter-certified hubs, cameras, and locks carrying interoperability credentials and premium retail placement, commanding higher pricing through demonstrated cross-platform compatibility, sustained brand trust, and installer-channel relationships among security-conscious households across most developed retail markets and regions.
Gross Margin: 34-44%

Sustainability / Regulatory / Next-Generation

AI-driven security platforms, energy-management hubs meeting emerging efficiency mandates, and subscription-linked monitoring hardware bundling recurring software revenue with premium device pricing across leading vendor catalogs and their fastest-growing retail and carrier distribution channels globally.
Gross Margin: 42-55%
smart-home-market-portfolio-architecture-1790020902055

High-value Sub-segments and Strategic Watch-out

AI-Driven Security Cameras and Sensors

Camera and sensor hardware bundling AI-based threat detection and subscription monitoring commands the highest blended margin in the portfolio, driven by recurring-revenue attach and rapid unit-volume growth across premium retail and carrier channels nationwide today, reinforcing sustained capital allocation toward this category by leading platform vendors.
Gross Margin: 45-58%

Certified Multi-Protocol Automation Hubs

Hubs carrying Matter, Zigbee, and Thread certification sustain strong margin and steady moderate volume growth, anchored by retailer preference for interoperability-credentialed hardware over single-protocol legacy alternatives across most retail channels, with installer partnerships further reinforcing category durability going forward into the next several planned product cycles.
Gross Margin: 36-46%

Entry-Level Smart Plugs and Bulbs

Commodity single-function devices retain substantial shipment volume but face continuous private-label price pressure, keeping margin persistently the thinnest tier in the portfolio despite steady unit demand across mass retail, where shelf visibility and price remain the single most dominant competitive factors above all else today.
Gross Margin: 16-24%

Legacy Single-Protocol Hardware

Devices built on proprietary, non-interoperable protocols face accelerating retailer delisting risk as certification requirements spread, making this segment the clearest strategic watch-out for vendors still carrying legacy catalog inventory into the coming certification-driven retail transition across most major developed and emerging markets alike this decade.
Gross Margin: 14-22%

Why Platform Loyalty Compounds Over Time

Smart home spending behaves less like a one-time hardware purchase and more like an annuity once a household commits to a hub platform, since every subsequent device purchase gets steered toward compatible platforms to preserve existing automation routines and avoid costly re-platforming. Subscription-security and cloud-storage fees compound this further, generating recurring revenue that persists across multiple hardware refresh cycles spanning several years per household and often longer.
Adoption depth varies sharply by end-use vertical: security-conscious households anchor spend around camera and sensor networks with deep subscription attach, while convenience-focused households concentrate purchases on lighting and voice-control hardware carrying thinner recurring-revenue attach and shorter replacement cycles. Renters adopt shallower, portable device sets, while homeowners invest in permanently installed automation infrastructure tied closely to property value and long-term residency plans across most markets.

Younger buyers increasingly default to voice-first, app-controlled purchasing decisions made independently of professional installers, while older and higher-income households still favor installer-mediated purchases bundling design consultation with equipment selection. This generational split is reshaping vendor go-to-market investment, pushing platform owners toward direct-to-consumer channels while installer-dependent categories such as whole-home security consolidate around fewer, larger integration partners nationally.
smart-home-market-end-use-penetration-index-1790020902548

Where to Compete in Smart Home

These are among the four positions where our research anticipates prominent divergence between winners and laggards over the coming forecast period. Each is grounded in the demand model, the regulatory perimeter, and the announced capacity pipeline.
01 / CERTIFICATION INVESTMENT TIMING

Certify for interoperability now, before retailers mandate it

Matter certification currently influences roughly 28% of connected-device purchase decisions, and that share is climbing steadily as major retailers formalize certification requirements for premium shelf placement across nearly every category served today. Vendors that certify early gain first access to bundled promotional programs and installer partnerships well ahead of the coming mandate curve. Waiting until certification becomes a baseline requirement means competing for shelf space against every uncertified competitor simultaneously, a materially weaker negotiating position for any mid-tier hardware vendor.
02 / SUBSCRIPTION REVENUE BUILD

Build subscription attach into hardware design from the outset

Subscription-security and cloud-storage revenue already contributes roughly 22% of device lifetime value across leading platforms, and this share continues expanding steadily as churn falls once households integrate footage into daily household routine and habit over time. Vendors treating subscription revenue as an afterthought bolted onto existing hardware consistently see materially lower attach rates than those designing onboarding flows around trial activation from day one. This gap compounds across each device generation and retail cycle going forward for every hardware vendor involved.
03 / COMPONENT SUPPLY SECURITY

Lock in multi-year wafer agreements ahead of the next shortage

The 2021 to 2022 semiconductor shortage delayed hub and camera launches by two to four quarters industry-wide, and smaller vendors lacking scale still cannot negotiate comparable fabrication priority against platform owners today across nearly every hardware category and retail segment. Securing multi-year wafer-capacity reservations now, while fabrication capacity remains relatively available, costs materially less than scrambling for spot-market allocation during the next cyclical shortage across the industry. This single strategic decision determines launch-timing reliability and cost position for years ahead.
04 / GEOGRAPHIC EXPANSION PRIORITY

Prioritize South Asia and Pacific for the fastest unit growth

South Asia and Pacific carries the fastest regional growth rate of the seven regions tracked, led by rapidly expanding Indian formulation and infrastructure investment activity that outpaces every other region tracked in this report by a wide margin. Vendors currently concentrated on North America and Western Europe distribution risk ceding early-mover retail and installer relationships to regional challengers already scaling certification investment there. Establishing local distribution partnerships now costs far less than entering after a regional leader consolidates share across the market.

Engagement Snapshot From the Field

A live engagement with an industry participant carrying material or product regulatory and market exposure ahead of a defining policy shift, showing how our research translates into a defensible multi-year portfolio strategy.
MARKET MINDS ADVISORY · CLIENT ENGAGEMENT SUMMARY
Smart Home Producer Strategic Portfolio Review and Transition Roadmap 2026·Investment Scenario on Smart Home Exposure Evaluation 2025-26
CLIENT PROFILE
The client is a mid-tier consumer-electronics manufacturer with an established presence in adjacent categories, generating annual revenue of approximately $310 million (client-reported, unverified by MMA) prior to this engagement. The company had not previously competed directly in smart home hubs or security hardware, though it possessed relevant manufacturing and retail-distribution infrastructure it hoped to redeploy toward a new automation-focused product line targeting mid-market retail channels.
STRATEGIC CHALLENGE
Leadership needed to decide whether to enter the smart home hub category directly, pursue a certified-accessory strategy around existing platforms, or avoid the category given rising interoperability-certification costs and an already CR5-concentrated competitive field. Internal teams disagreed on whether their existing retail relationships could offset the multi-year fabrication and certification investment required to compete credibly against scaled incumbents.
MMA APPROACH
MMA conducted primary interviews with retail buyers and installer-channel partners, benchmarked component-cost structures against disclosed competitor margins, and modeled certification-investment payback under three entry scenarios. The analysis weighted regional demand concentration, existing manufacturing-capacity fit, and realistic timeline to achieve competitive interoperability certification against the client's balance-sheet capacity for market entry.
KEY FINDINGS
  1. Certified-accessory market entry required roughly 60% less upfront capital investment than a full automation-hub launch while still capturing meaningful subscription-adjacent revenue streams.
  2. Existing retail relationships covered only about 40% of the premium shelf placement needed to compete against top-five incumbent platform owners directly today.
  3. Component cost structure remained competitive with mid-tier rivals, but the certification timeline risked missing the next major retail buying cycle window entirely.
  4. South Asia and Pacific distribution partnerships offered a meaningfully lower-cost entry path than immediate direct competition in saturated, already-crowded North American retail channels.
CLIENT PROFILE
The client is a mid-tier consumer-electronics manufacturer with an established presence in adjacent categories, generating annual revenue of approximately $310 million (client-reported, unverified by MMA) prior to this engagement. The company had not previously competed directly in smart home hubs or security hardware, though it possessed relevant manufacturing and retail-distribution infrastructure it hoped to redeploy toward a new automation-focused product line targeting mid-market retail channels.
STRATEGIC CHALLENGE
Leadership needed to decide whether to enter the smart home hub category directly, pursue a certified-accessory strategy around existing platforms, or avoid the category given rising interoperability-certification costs and an already CR5-concentrated competitive field. Internal teams disagreed on whether their existing retail relationships could offset the multi-year fabrication and certification investment required to compete credibly against scaled incumbents.
MMA APPROACH
MMA conducted primary interviews with retail buyers and installer-channel partners, benchmarked component-cost structures against disclosed competitor margins, and modeled certification-investment payback under three entry scenarios. The analysis weighted regional demand concentration, existing manufacturing-capacity fit, and realistic timeline to achieve competitive interoperability certification against the client's balance-sheet capacity for market entry.
KEY FINDINGS
  1. Certified-accessory market entry required roughly 60% less upfront capital investment than a full automation-hub launch while still capturing meaningful subscription-adjacent revenue streams.
  2. Existing retail relationships covered only about 40% of the premium shelf placement needed to compete against top-five incumbent platform owners directly today.
  3. Component cost structure remained competitive with mid-tier rivals, but the certification timeline risked missing the next major retail buying cycle window entirely.
  4. South Asia and Pacific distribution partnerships offered a meaningfully lower-cost entry path than immediate direct competition in saturated, already-crowded North American retail channels.
RECOMMENDED STRATEGY
Phase 1: Phase 1 (Months 1 to 4): Pursue Matter certification for a focused sensor and camera accessory line compatible with the three leading hub platforms. Phase 2: Phase 2 (Months 5 to 10): Establish installer-channel partnerships in two South Asia and Pacific markets ahead of direct North American retail entry. Phase 3: Phase 3 (Months 11 to 18): Evaluate a full automation-hub launch only after accessory-line subscription attach and retail relationships reach target thresholds.
OUTCOME
Within twelve months of following the phased approach, the client's certified accessory line reached an estimated $42 million in incremental annual revenue (client-reported, unverified by MMA), with subscription-adjacent attach exceeding internal targets. Installer partnerships in South Asia and Pacific markets progressed faster than the originally planned North American entry, validating the full sequencing recommendation overall.

Frequently Asked Questions

Foundational context covering the market sizes, CAGR, scope, country, region and competition that inform every finding below. This section is provided to cover basics and most often pre-purchase conversations, answered from the MMA Primary Research Dataset.

What is the current size of the Smart Home Market?

The Smart Home Market reached $115.0 billion in base-year 2025, reflecting sustained adoption of interoperable hubs, security systems, and automation hardware across residential households globally.

How large will the Smart Home Market be by 2036?

The market is forecast to reach $312.1 billion by 2036, roughly 2.48 times its 2026 value, driven by sustained platform expansion and rising subscription-security attach.

What is the CAGR for the Smart Home Market 2026 to 2036?

The market is projected to grow at a 9.5% CAGR between 2026 and 2036, supported by rising interoperability-certification adoption and expanding AI-driven security investment overall.

Which segment is growing fastest?

Smart Home Hubs and Automation Controllers lead at a 13.0% CAGR, roughly 1.37 times the overall market rate, as interoperability certification accelerates hub-centered household purchasing broadly.

Who are the major companies in the Smart Home Market?

Amazon, Google, Samsung, Apple, and Xiaomi lead the market, evaluated closely on platform reach, device-portfolio depth, and retailer partnership breadth across major regions and channels.

Which country is growing fastest?

India leads country-level growth at an 11.0% CAGR, driven by rapidly expanding formulation and infrastructure investment activity across its residential construction sector and retail base.

Report Segmentation Architecture

The full report scope spans multiple orthogonal segmentation dimensions, with cross-tabulated demand data provided for each dimension pair. Coverage extends further to regional breakdowns, trend trajectories, and the competitive detail needed to support segment-level decision-making.

By Primary Market Dimension

  • Smart Home Hubs and Automation Controllers
  • Smart Security and Surveillance Systems
  • Smart Lighting and Climate Control
  • Smart Locks and Access Control
  • Voice Assistant Speakers and Displays
  • Smart Plugs and Energy Monitoring Devices

By End-Use Industry

  • Single-Family Residential
  • Multi-Family and Rental Residential
  • New Construction and Builder-Installed
  • Retrofit and Aftermarket Installation
  • Property Management and Commercial Residential

By Commercial Dimension

  • Direct-to-Consumer Retail
  • Professional Installer Channel
  • Carrier and Telecom Bundled Distribution
  • Subscription-Linked Service Models

By Region

  • North America
  • Western Europe
  • East Asia
  • South Asia and Pacific
  • Latin America
  • Middle East and Africa
  • Eastern Europe

Scope, Methodology, and Coverage

Every figure in this report is reproducible from documented input assumptions. The scope below maps the historical period, the forecast horizon, the segmentation dimensions, and the countries covered, alongside the underlying primary and qualitative methodology.
Historical Period
2020 to 2025
Forecast Period
2026 to 2036
Base Year
2025 (USD billions; MMA Primary Research Dataset, September 2026)
Market Definition
The smart home market covers connected hardware devices, including hubs, security cameras, locks, lighting, and climate controllers, that enable automated or remotely monitored residential functions across households. It excludes standalone non-connected appliances, professional commercial building-automation systems, and third-party software platforms sold independently of hardware devices.
Quantitative Units
USD billions (current prices); unit shipment volumes where applicable
Segmentation Dimensions
By Primary Market Dimension; By End-Use Industry; By Commercial Dimension; By Region
Regions Covered
North America, Western Europe, East Asia, South Asia and Pacific, Latin America, Middle East and Africa, Eastern Europe
Countries Covered
USA, China, Germany, France, UK, Japan, South Korea, India, Australia, Canada, Brazil, Mexico, Indonesia, Vietnam, Thailand, Malaysia, UAE, Saudi Arabia, South Africa, Nigeria, Turkey, Poland, Netherlands, Italy, Spain, Sweden, Switzerland, Argentina, Colombia, Singapore, and additional markets relevant to this sector
Key Companies Profiled
Amazon.com Inc, Google LLC, Samsung Electronics Co Ltd, Apple Inc, Xiaomi Corporation, Ecobee Inc, Ring LLC, Arlo Technologies Inc, SimpliSafe Inc, Roborock Technology Co Ltd, TP-Link Systems Inc, Signify N.V., Honeywell International Inc, Schneider Electric SE, ADT Inc, Vivint Smart Home Inc, Legrand SA, Lennox International Inc, iRobot Corporation, Aqara (Lumi United Technology Co Ltd)
Quantitative Methodology
Primary survey, n=3,800 respondents, Q4 2025, six countries; demand-side model with trade association cross-validation
Qualitative Methodology
47 expert interviews, Q4 2025; applied to validate demand model assumptions, identify emerging dynamics, and assess competitive positioning
Report Format
PDF and XLSX data workbook (Word format preview document)
Publisher
Market Minds Advisory
Report Code
MMA-2026-TEC-183
Published
September 2026
Contact
sales@marketmindsadvisory.com | www.marketmindsadvisory.com

Purchase the full Smart Home Market Report (2026 to 2036).

The complete report expands substantially on this shorter preview summary. It provides detailed country-level sizing across all thirty covered markets, full historical and forecast data tables spanning 2020 through 2036, and granular segment-level revenue breakdowns unavailable in this preview version. Extended competitive profiles cover all twenty companies profiled here in much greater depth, alongside complete primary-research and expert-interview methodology documentation. A downloadable data appendix supports direct integration into internal corporate forecasting and strategic planning models used regularly by category strategy, product management, and corporate development teams.
Full 2020 to 2036 historical and forecast data
Country-level sizing across thirty covered markets
Complete competitive profiles for twenty companies
Downloadable data appendix and Excel workbook
Segment-level revenue breakdowns by all dimensions
Primary survey and expert interview source data

Built For The People Who Decide

From boardroom strategy to bench-side execution, this report is read cover-to-cover by leaders shaping the next decade of their industry, turning demand scenarios, market dynamics and valuation benchmarks into decisions.
CXOs/ Presidents/ VPs/ Managers
M&A and Corporate Development
Strategy Teams and R&D Heads
Procurement and Product Directors
Regulatory and Compliance Leaders
Investor Relations and Equity Analysts