

Market Minds Advisory
Smart Home Hub Market

Smart Home Hub Market: Smart Home Hub Market: Embedded Function, Local Execution and Subsidised Placement, 2026 to 2036

Almost nobody buys a hub any more. They buy a router, a speaker, or a television, and about 84% of hub function now arrives inside something the household wanted anyway.

Lead Analyst

Published

September 2026

Make Smarter Decisions with Customized Research Insights

Request a free sample report and evaluate market opportunities, growth trends, and competitive dynamics relevant to your business needs.

2025 MARKET VALUE$5.6BMarket Size 2025
2036 FORECAST VALUE$13.9BBase Case , 2026 to 2036
CAGR 2026 TO 20368.6 %Bull 9.8% / Bear 7.4%
INCREMENTAL OPPORTUNITY$7.8BNet 10- year value creation
EXPANSION MULTIPLE2.28x2036 value over 2026 base
Strategic Levers
M&A Pipeline
Regional Outlook
Country Rankings
Competitive Intelligence
Segmental Deep-dive
Call-Us : 91 93563 13602

Executive Snapshot and Market Trajectory.

The hub has stopped being a product and become a function. Around 84% of hub capability now ships inside a router, speaker, television, or security panel the household bought for another reason entirely, and standalone dedicated hubs grow at just 2.4% against a market rate more than three times that.
Routers and gateways with hub function grow at 12.9%, half again the market rate of 8.6%, because a network operator ships one to every subscriber and the marginal cost of adding radios is small. Energy controllers follow at 11.2% on similar logic. Around 38% of hubs are supplied by utilities, insurers, or network operators rather than bought at retail. East Asia holds 33% of hub revenue.
Local execution has become the one genuine argument for a dedicated device. Roughly 43% of routines now run without reaching any external service, and households that watched devices stop working when a cloud service closed understand precisely why that matters. Five suppliers hold 57% of hub revenue between them. Four of those five sell speakers, phones, televisions, or platform software with hub function attached, which describes the category's direction better than any forecast could.
Market Definition
This market covers devices providing smart home control and connectivity, including standalone dedicated hubs, smart speakers and displays with hub function, routers and gateways with hub function, television and media devices with hub function, security panels with hub function, and energy management controllers with hub function, together with the control software supplied on them. It excludes connected end devices such as lighting, locks, cameras and thermostats, professional building automation systems, and camera video storage subscriptions.
Base Year Value
$5.6B in 2025 (MMA Primary Research Dataset, September 2026)
Forecast Period
2026 to 2036, eleven discrete annual values
CAGR
8.6% base case. Bull 9.8%. Bear 7.4%.
Fastest Growth Segment
Routers And Gateways With Hub Function: 12.9% CAGR
Fastest Growth Country
China: 13.4% CAGR
Fastest Growth Region
South Asia and Pacific: 10.6% CAGR
Largest Region
East Asia: 33% of 2025 global value
Market Leaders
Amazon, Google, Apple, Samsung, and Tuya lead the field. Source: MMA Primary Research Dataset, July 2026.
Primary Survey
n=3,800 procurement and R&D decision-makers, Q4 2025, six countries
Methodology
Demand-side build-up, cross-validated against public data, 47 expert interviews

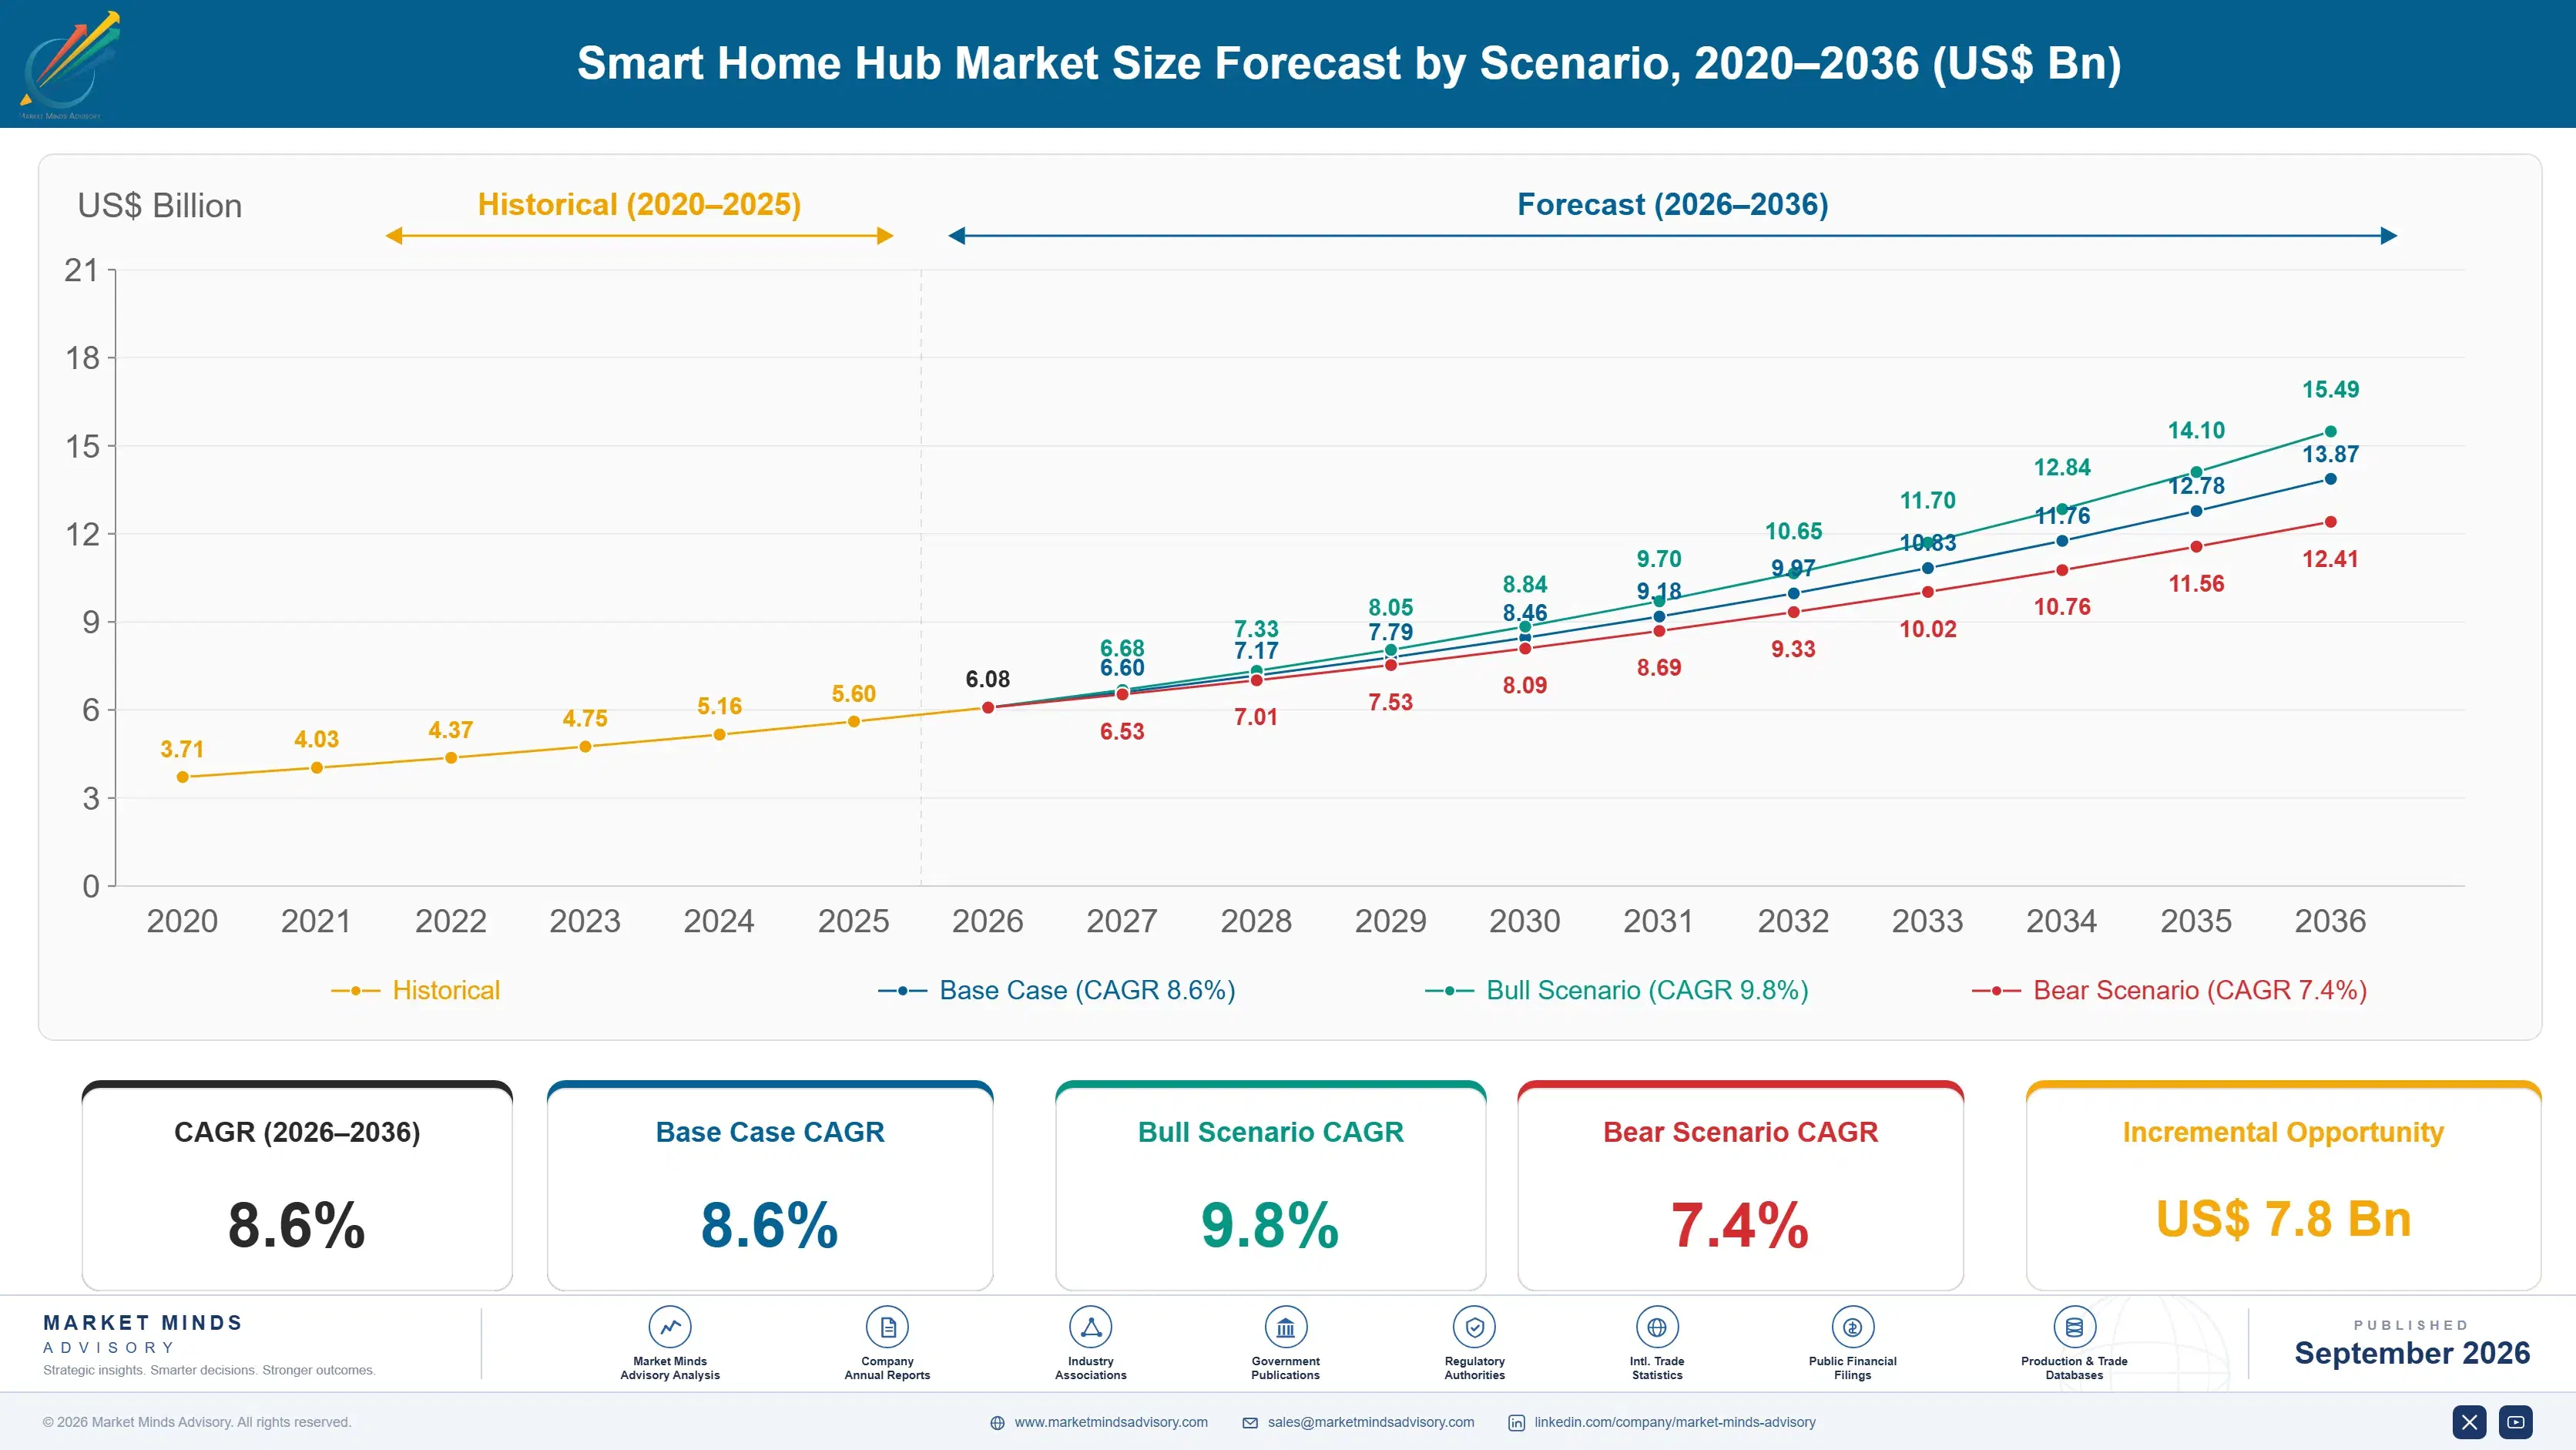
Smart Home Hub Market Forecast Scenarios

smart-home-hub-market-size-forecast-scenario-1790011102701
Between 2020 and 2025 the standalone hub quietly lost its reason to exist while hub capability spread everywhere. Interoperability standardisation, intended to simplify the household, mostly moved border router capability into speakers, televisions, and gateways that households already owned. Historical growth of 7.6% conceals a declining dedicated product alongside embedded function expanding rapidly, and averaging those two together describes neither.
The base case at 8.6% rests on three mechanisms. Network operators ship gateways to every subscriber and the marginal cost of adding home automation radios is small, which puts hub function into homes at scale without anybody choosing it. Utilities and insurers subsidise placement to obtain a control position. And local execution gives dedicated devices a defensible argument they lacked when everything ran through a cloud service. None depends on households choosing a hub.
The bull case at 9.8% depends on utility and insurer subsidy widening as tariff response and home risk monitoring become mainstream propositions, which would place hardware in far more homes than retail demand supports. The bear case at 7.4% is platform consolidation: if two or three platform owners absorb the function completely into devices they already sell, independent hub suppliers lose the addressable market entirely.

A Function Without A Product

Ask a household whether it owns a smart home hub and most say no, then describe a speaker, a router, and a television that between them run everything connected in the house. That is the market. Embedded function reached 84% of shipments, the dedicated product grows at 2.4%, and nobody outside the industry experiences any of this as a purchase decision. Nobody outside this industry thinks of it as a category at all.
TOP FIVE CONCENTRATION57%Share of hub revenue held by the leading suppliers
EMBEDDED HUB SHARE84%Hub function shipping inside another device rather than standalone
MULTI-PLATFORM HOUSEHOLD SHARE61%Homes running more than one control platform at once
SUBSIDISED PLACEMENT SHARE38%Hubs supplied by utilities, insurers or network operators
AVERAGE DEVICE PRICEUSD 68Delivered price averaged across all hub device categories
LOCAL AUTOMATION SHARE43%Routines executing without any external service being reached
Interoperability standardisation was supposed to simplify the household and largely relocated the problem. Onboarding a device became easier while the platforms above kept competing on automation logic, voice assistants, and subscriptions, so 61% of homes still run more than one control platform and more than one application. What standardisation genuinely achieved was removing the last reason to buy a dedicated box.
Local execution is the exception and the one durable argument for owning a proper hub. Around 43% of routines now run without reaching an external service, which matters for latency, for privacy, and most persuasively because households have watched connected devices stop working when a company shut its cloud service down. That memory sells more hardware than any feature comparison does.
"We stopped asking consumers about hubs because the answer is always no and always wrong. They own three. What they actually respond to is being told the lights will still work if the company goes away, which is a strange thing for a technology category to be selling, and it is the most effective message anybody has."
Practice Director, Connected Home and Consumer Devices · MMA Technology Practice · September 2026

Market Trends

Hub Capability Migrates Into Devices Already Purchased

Adding home automation radios to a gateway, speaker, or television costs the manufacturer very little and removes the household's reason to buy anything separate. Embedded function now covers 84% of shipments while standalone hubs grow at only 2.4%. Network operators are the most consequential channel, since they ship a gateway to every subscriber regardless of whether that household wanted home automation. Suppliers whose whole business is a dedicated box are watching their category dissolve into other people's products. Licensing the software inside those products is the only route to the same households now.
Market Impact: Segment grows at 12.9%

Local Execution Sells Better Than Any Feature

Households that watched connected devices stop working when a cloud service closed understand the argument for local processing without needing it explained. Around 43% of routines now execute without reaching any external service, and that share rises with every discontinued platform. It is also the one thing a dedicated device does better than an embedded one, since a gateway supplied by a network operator generally runs whatever the operator chose rather than whatever the household would prefer. An operator gateway generally runs whatever the operator chose, which is where a dedicated device still has something to sell.
Market Impact: Covers 38% of placements

Market Opportunities and Growth Drivers

Network Operators Distribute Hubs At Subscriber Scale

An operator shipping a gateway to every subscriber places hub function in millions of homes at a marginal cost of a few components, which no retail channel can approach for reach. Routers and gateways grow at 12.9% on that alone. Chinese growth of 13.4% leads every country covered, supported by operator distribution combined with the largest domestic connected device market anywhere. The household never chooses the hub and frequently never learns it has one. Operators also decide which platform their gateway supports, which settles adoption at national scale without any household voting on it.
Market Impact: Affects 61% of households

Utilities And Insurers Subsidise The Control Position

A utility running tariff response, or an insurer monitoring water leaks and heating faults, needs a device in the home and will fund it because the control position is worth more than the hardware. Around 38% of hubs now arrive through those channels rather than through retail. Energy management controllers grow at 11.2% accordingly. The economics are entirely different from consumer sales, since the subsidising party is buying an ongoing relationship rather than a product margin. A prevented claim or a shifted load outweighs the device many times over, which supports prices retail could never sustain.
Market Impact: Standalone grows at 2.4%

Market Restraints and Challenges

Platform Competition Keeps Households Running Several Applications

Around 61% of homes run more than one control platform, and the root cause is that standardisation settled device onboarding while leaving automation logic, voice assistants, and subscriptions as competitive ground. Commercially this frustrates households, suppresses spending on additional devices, and leaves nobody owning the relationship. Suppliers respond with bridges across platforms, automation layers that sit above all of them, and local execution that does not depend on which company still supports the account. A household juggling three applications stops adding connected devices altogether, which caps the whole category quietly.
Market Impact: Embedded reaches 84% of shipments

Dedicated Hardware Loses Its Reason To Exist

Standalone hubs grow at just 2.4% while embedded function reaches 84% of shipments, and the root cause is that radios cost a manufacturer almost nothing to add to a product the household was buying anyway. Commercially this removes the addressable market for anyone selling only a box. Suppliers respond by licensing platform software to device makers, by pursuing utility and insurer placement, and by building local execution capability that embedded gateways generally lack. Giving up a branded device is uncomfortable, and several suppliers reached that conclusion later than the market did.
Market Impact: Covers 43% of routines
3 additional market trends, 4 additional growth drivers, and 2 additional restraints and challenges are covered in the full report. Contact sales@marketmindsadvisory.com to access the complete intelligence.

Segment CAGR and Growth Architecture

Segmentation follows hub device form. Six categories cover the market: standalone dedicated hubs, smart speakers and displays with hub function, routers and gateways with hub function, television and media devices with hub function, security panels with hub function, and energy management controllers with hub function. Control software is counted within the device it ships on.
smart-home-hub-market-market-share-analysis-1790011103311

Routers And Gateways With Hub Function

Gateways grow at 12.9%, half again the market rate of 8.6%, because a network operator ships one to every subscriber and adding home automation radios costs a few components against a device the household receives regardless. No retail channel reaches homes at that scale or that cost. The household typically never chooses the hub and frequently never discovers it has one, which is commercially excellent for the operator and difficult for anybody selling a competing device. Operators also control which platform the gateway supports, which decides platform outcomes at national scale. Retail cannot compete with a device the household receives regardless of whether it wanted one. Licensing software into those gateways is the only route left to the same households.
CAGR 12.9%

Energy Management Controllers With Hub Function

Energy controllers grow at 11.2% because utilities running tariff response and demand flexibility need a device in the home and will fund it outright. The control position is worth considerably more than the hardware, so the economics differ entirely from consumer sales: the subsidising party buys an ongoing relationship rather than a product margin. Insurers follow similar logic for water leak and heating fault monitoring, where a prevented claim outweighs the device cost many times over. Around 38% of hubs now arrive through subsidised channels of this kind. Care providers monitoring independent living are beginning to fund placement on identical reasoning, and their tolerance for device failure is lower than anybody else's.
CAGR 11.2%
Full segment breakdown across 6 segments available in the complete report.

Regional Architecture and Country Demand Map

Regional shares reflect connected device penetration and operator distribution practice rather than household income alone. One region sits outside the standard bands, for the reason named in its paragraph and summarised for operator review at the close. Who funds the device varies enormously between them.

East Asia

At 33% this region sits above the standard band, and the justification runs two ways: China is the largest connected device market anywhere by volume, and Chinese platform suppliers provide hub software to device makers across the world. Chinese growth of 13.4% leads every country covered, supported by operator gateway distribution at enormous scale. Japanese and Korean households adopt through television and speaker devices more than through dedicated hardware. Domestic platforms hold most of the regional volume and export the software layer widely. Operator gateway distribution runs at a scale no other region approaches, and households rarely purchase a separate control device at retail prices at all. Domestic platforms hold most regional volume and export the software layer widely.
Share: 33% | CAGR: 9.6% (2026 to 2036)

North America

Speaker and display devices established hub function in households earlier here than anywhere, and television devices have extended it since. Insurer subsidised placement is more developed than in any other region, driven by water leak and heating fault monitoring where a prevented claim outweighs the hardware many times over. Growth of 8.1% is close to the world rate. Platform fragmentation is also at its worst here, with a large majority of connected households running two or three control applications simultaneously. Insurer subsidised placement is more developed here than anywhere, and the claims prevention argument travels well beyond the households that adopted first. Platform fragmentation is at its worst here, with most connected households running two or three applications.
Share: 26% | CAGR: 8.1% (2026 to 2036)
Regional intelligence for 5 additional markets available in the complete report: Western Europe, South Asia and Pacific, Latin America, Middle East and Africa, Eastern Europe. Contact sales@marketmindsadvisory.com.
smart-home-hub-market-country-cagr-analysis-1790011103839

Where Suppliers Find Real Volume

Four commercial moves separate suppliers with a future from those defending a dedicated device category that is dissolving into other people's products. Each accepts that the household rarely chooses a hub deliberately, and that somebody else is usually paying for the one it ends up with. Retail is the smallest and least defensible channel in the market.

License Platform Software To Device Manufacturers

Embedded function reaches 84% of shipments, so the addressable opportunity is the software inside somebody else's gateway, speaker, or television rather than a box of one's own. Suppliers licensing platform software report reach 6 to 9 times the households their own hardware ever achieved, at margins hardware never delivered. It requires giving up the branded device that founders are usually attached to, which is why several suppliers reached at this conclusion later than the market did. Reaching households through other people's products is the whole opportunity now. Retail cannot reach them at all.
Market Impact: Reaches 6 to 9 times more households overall

Sell Control Position To Utilities And Insurers

A utility running tariff response or an insurer monitoring leaks needs a device in the home and funds it because the ongoing relationship is worth more than the hardware margin. Around 38% of hubs now arrive that way. Suppliers pursuing subsidised placement report volumes 4.2 times retail equivalents at prices retail would never support, because the buyer is purchasing a channel rather than a product. The sale is enterprise rather than consumer, which most device suppliers are poorly organised for. A prevented claim or a shifted load outweighs the hardware many times over.
Market Impact: Delivers 4.2 times the volumes retail can support

Make Everything Work Without The Cloud

Around 43% of routines already run locally, and households that watched devices stop working when a service closed need no persuading about why. Suppliers whose automation runs entirely on the device report retention 2.7 times higher and considerably better review sentiment, because the failure mode customers most fear cannot occur. It is also the one capability a network operator gateway generally lacks, which gives dedicated hardware its only remaining genuine argument. Operator supplied gateways run whatever the operator selected, and they rarely prioritise offline capability. Households notice the difference during outages.
Market Impact: Raises household retention by 2.7 times over rivals

Bridge The Platforms Rather Than Pick One

Around 61% of homes run more than one control platform, and every household running three applications is a household that stops buying additional devices. Suppliers whose automation layer sits above the competing platforms rather than inside one of them report attach rates 34 to 48% higher on subsequent device purchases. It is unglamorous integration work that the platform owners have no incentive to perform, which is precisely why the opportunity persists. Every household running three applications is one that has stopped buying additional devices altogether. Platform owners will never build it.
Market Impact: Raises device attach rates by 34 to 48%

Who Controls the Margin Pool

Concentration is high and the participants are mostly not hub companies. Five suppliers hold 57% of hub revenue, measured consistently on that basis across all participants, and four of them sell speakers, phones, televisions, or platform software with hub function attached. Independent hub specialists survive by licensing software or by serving households that want local execution specifically.
Competition currently turns on three things: distribution reach, where network operators and platform owners hold positions retail cannot match; local execution capability, which decides the dedicated device argument entirely; and subsidised placement relationships with utilities and insurers who buy a channel rather than a product. Price decides retail hardware, where the device competes against function already sitting in the household's speakers and gateways, and decides almost nothing in subsidised placement.

Pressure comes from two directions. Platform owners absorb hub function into devices households already buy for other reasons. Meanwhile Chinese platform suppliers license software to device makers worldwide at prices that make in-house development difficult to justify. Rankings will shift toward suppliers holding distribution or subsidised placement, since neither depends on anybody choosing a hub. Retail-only hardware suppliers hold the weakest position.
smart-home-hub-market-company-positioning-matrix-1790011104369

Competitive Moat and Risk Dimensions

AMAZON

Moat: Installed Speaker Distribution Base

An enormous installed base of speakers and displays already sitting in households provides hub function without the household ever making a hub decision, which is a distribution position no dedicated device supplier can approach. Each additional connected device the household buys reinforces it further, since setup defaults toward whatever is already present.
AMAZON

Risk: Cloud Dependency And Trust

Hub function tied closely to online services is exposed precisely where households have become most sensitive, having watched connected devices elsewhere stop working when companies withdrew support. Competitors selling local execution are attacking that directly, and the argument requires no technical explanation for a consumer to grasp.
TUYA

Moat: Platform Licensing Across Manufacturers

Supplying platform software to a very large number of device manufacturers reaches households through products the company neither designs nor brands, which scales far beyond what its own hardware could. Manufacturers find in-house development difficult to justify against licensing at that price, which reinforces the position with each product generation.
TUYA

Risk: Platform Owner Absorption Risk

Large platform owners increasingly provide equivalent capability directly to device manufacturers as part of platform participation, which removes the licensing revenue rather than competing with it. Differentiating means offering local execution and cross-platform bridging that the platform owners have no commercial incentive to build themselves.

Players Tracked

Prominent Players

Amazon
Google
Apple
Samsung
Tuya

Other Key Players

Aqara
Xiaomi
Signify
Aeotec
Hubitat
Nabu Casa
Bosch
Legrand
Schneider Electric
ADT
Vivint
Deutsche Telekom
Comcast
TP-Link
Ecobee

Recent Developments

JANUARY 2026

Aqara Releases Hub Executing All Automation Locally Without Cloud

Aqara released a hub running every automation routine on the device itself, positioned explicitly at households concerned about connected products ceasing to function when a manufacturer withdraws its online service. Pricing sits above comparable cloud dependent models, positioned against the risk of service withdrawal. Households understand that risk directly.
Signal: Local execution is the only argument left for a dedicated device against embedded gateway function. Consumers grasp it immediately.
SEPTEMBER 2025

Schneider Electric Signs Subsidised Hub Supply Agreement With Utility

Schneider Electric entered a multi-year supply agreement placing energy management controllers in households through a European utility's tariff response programme, funded by the utility rather than purchased by the households involved. No acquisition or joint venture was involved, and the utility retains the customer relationship throughout.
Signal: Utilities buy a control position rather than hardware, which supports prices retail would never sustain. Retail could not fund this.
MAY 2025

Samsung Acquires Local Automation Software Developer For Offline Execution

Samsung completed an acquisition of a local automation software developer, adding on-device routine execution so that household automation continues functioning when connectivity or an online service becomes unavailable for any reason. Cloud dependence had made this capability the hardest thing for a platform owner to build internally.
Signal: Platform owners are buying the capability their cloud dependence made hardest to build internally. Trust is now a product feature.

What A Hub Costs To Build

Three input groups dominate cost. The processor, wireless radios, and memory run 38% to 46% of cost of goods sold, sourced from a limited number of semiconductor suppliers whose combination chips carry most of the value. Enclosure, power supply, and assembly take 18% to 25%, performed almost entirely in China and Southeast Asia. Software development, protocol certification, and cloud operation add 22% to 30% across the product's supported life.
Memory and wireless component pricing moved sharply through 2024 and 2025 as demand across connected device categories absorbed supply, and several suppliers described the margin effect in their annual reports for those years. SEMI equipment data indicated capacity additions arriving behind requirement. Devices selling near USD 68 have very little room to absorb component movement, so the effect lands on margin rather than on price almost immediately.

The competitive disadvantage mechanism runs through distribution rather than manufacturing. A supplier without operator, utility, or platform distribution must acquire households one at a time at retail, where the device competes against function already present in things the household owns. Exposure varies by supplier type, and dedicated hardware suppliers pay acquisition costs on every unit.
smart-home-hub-market-cost-volatility-analysis-1790011104565

Pursue Operator And Utility Distribution Over Retail

Retail acquisition costs are paid on every unit and compete against hub function already present in devices the household owns anyway. Operator and utility channels place hardware at subscriber scale for the cost of a few components, and the subsidising party accepts pricing retail would never support because it is buying a relationship. The economics are not comparable.

Design One Hardware Platform Across Product Variants

Radios, processors, and memory dominate cost and differ far less between hub variants than product ranges suggest, yet each is frequently engineered separately with its own certification. A shared platform concentrates component purchasing, shortens protocol certification for new variants, and reduces inventory that component lead times otherwise force a supplier to carry. Certification costs fall sharply as well.

Move Automation Execution Onto The Device Itself

Cloud operation is a recurring cost that scales with installed base rather than with revenue, and it never stops for as long as the product is supported. On-device execution removes most of that cost permanently while addressing the failure mode households fear most, which makes it unusually rare in delivering savings and differentiation together.

Portfolio Architecture for Margin Defence

Margin follows who pays and why. Retail hardware is close to commodity, competing at around USD 68 against function already present in the household's existing devices. Embedded licensing earns better, since the software reaches households through products somebody else builds and sells. Subsidised placement earns most, because the utility or insurer is buying a control position rather than a product margin. Who funds the device rather than what it contains decides this whole hierarchy.
The tension between volume and premium runs through who made the decision. A household buying at retail compares prices, keeps the device for years, and generates nothing further. A utility placing devices across a tariff response programme buys at volume, funds ongoing operation, and values the relationship rather than the hardware, which supports pricing no consumer would accept.

High-value pools concentrate where the device supports a commercial relationship worth more than itself: tariff response, insurance risk monitoring, elderly care and independent living, and monitored security. None of those buyers is comparing device prices. Where the household is simply buying convenience, price decides everything and embedded function keeps removing the reason to buy at all. Convenience alone supports very little price.

Volume / Commodity-Adjacent

Retail hub hardware competing on price against function already present in speakers, gateways, and televisions the household owns. The ten-point range reflects component purchasing scale and manufacturing volume rather than any capability difference between suppliers.
Gross Margin: 18% to 28%

Premium / Certified

Platform software licensed to device manufacturers, reaching households through products the licensor neither designs nor brands. The fourteen-point range reflects how much protocol certification and ongoing service the licensor provides alongside the software itself.
Gross Margin: 40% to 54%

Sustainability / Regulatory / Next-Generation

Subsidised placement for utilities, insurers, and care providers who fund hardware to obtain a control position worth more than the device. The sixteen-point range reflects how much ongoing service each arrangement includes beyond the initial placement.
Gross Margin: 52% to 68%
smart-home-hub-market-portfolio-architecture-1790011105065

High-value Sub-segments and Strategic Watch-out

Subsidised Utility Placement

Highest value in the category, funded by parties buying a control position rather than hardware, already covering 38% of placements. The sixteen-point range reflects how much ongoing service and data handling each programme includes beyond the initial device. Care providers are beginning to fund placement similarly.
Gross Margin: 54% to 70%

Platform Software Licensing

High value reaching households through devices the licensor never builds, at margins hardware has never delivered anywhere. The fourteen-point range reflects certification and service depth, and platform owners increasingly supply equivalent capability at no charge. Manufacturers struggle to justify building it themselves. Platform owners increasingly supply it free.
Gross Margin: 44% to 58%

Local Execution Hardware

The one dedicated device argument that still works, since 43% of routines already run locally and households fear service withdrawal. The twelve-point range separates suppliers running everything on device from those partially dependent on external services. Operator gateways rarely offer the same capability at all.
Gross Margin: 32% to 44%

Retail Standalone Hub Supply

The strategic watch-out. Standalone units grow at 2.4% while embedded function covers 84% of shipments, and retail acquisition cost is paid on every unit sold. The ten-point range reflects purchasing scale and nothing commercially defensible. The category is dissolving into other people's products. Retail acquisition cost is paid every time.
Gross Margin: 16% to 26%

How This Revenue Recurs

Retail hardware generates a single payment and then a support obligation lasting years, which is a poor shape unless something recurs alongside it. Platform licensing recurs per device shipped by the manufacturer, and subsidised placement recurs through service fees the utility or insurer pays for as long as the programme runs. The suppliers doing well are those whose revenue arrives repeatedly rather than once. Single payment hardware businesses have not done well in this category.
Attachment depth follows the automation configuration rather than the hardware. A household that has built routines, device groupings, and habits inside one platform rarely rebuilds them elsewhere, even while complaining about the platform continuously. A household whose gateway came from an operator has no attachment at all and changes whatever the operator changes at the next equipment refresh.

The buyer has shifted from the household toward utilities, insurers, and network operators. Early hubs were bought by enthusiasts who configured everything themselves and cared about protocols. Around 38% of placements are now funded by organisations pursuing tariff response, claims prevention, or subscriber retention, and they evaluate reliability, service life, and data handling rather than features. Enthusiast households remain a small and shrinking share of the total.
smart-home-hub-market-end-use-penetration-index-1790011105555

Where This Market Rewards

These are among the four positions where our research anticipates prominent divergence between winners and laggards over the coming forecast period. Each is grounded in the demand model, the regulatory perimeter, and the announced capacity pipeline.
01 / EMBEDDED FUNCTION ACCEPTANCE

The box is gone, sell the software

Embedded hub capability reaches 84% of shipments while standalone devices grow at only 2.4%, because radios cost a manufacturer almost nothing to add to a product households were buying anyway. Suppliers licensing platform software reach 6 to 9 times the households their own hardware ever did, at margins hardware never produced. It means abandoning the branded device, which several suppliers took far too long to accept, by which time the addressable retail market had already gone, and the retail market had largely gone by then.
02 / SUBSIDISED CHANNEL DEVELOPMENT

Somebody else should pay for this

Utilities running tariff response and insurers monitoring leaks need a device in the home and fund it because the ongoing relationship exceeds any hardware margin available at retail. Around 38% of hubs now arrive through those channels, and suppliers pursuing them report volumes 4.2 times retail equivalents at prices consumers would never pay. The sale is enterprise rather than consumer, which most device businesses are organised badly for, and rebuilding around it takes longer than the opportunity allows, which takes longer to fix than the opening lasts.
03 / OFFLINE CAPABILITY BUILDING

Households fear the service being switched off

Roughly 43% of routines already execute locally, and consumers who watched connected products stop working when a company withdrew its service need no explanation of why that matters to them. Suppliers running automation entirely on device report retention 2.7 times higher and considerably better sentiment, because the failure mode people fear most simply cannot occur. It is also what operator-supplied gateways generally cannot offer, since operators specify whatever suits them rather than the household, because operators specify what suits them rather than households.
04 / CROSS-PLATFORM BRIDGING WORK

Three apps means no more purchases

Around 61% of homes run more than one control platform, and a household juggling three applications stops adding connected devices altogether, which caps the whole category. Suppliers whose automation layer sits above the competing platforms report attach rates 34 to 48% higher on subsequent purchases. Platform owners have no incentive whatever to perform that integration, which is exactly why the opportunity has persisted this long, and it remains open for exactly that reason today, and that is exactly why it remains open today.

Engagement Snapshot From the Field

A live engagement with an industry participant carrying material or product regulatory and market exposure ahead of a defining policy shift, showing how our research translates into a defensible multi-year portfolio strategy.
MARKET MINDS ADVISORY · CLIENT ENGAGEMENT SUMMARY
Smart Home Hub Producer Strategic Portfolio Review and Transition Roadmap 2026·Investment Scenario on Smart Home Hub Exposure Evaluation 2025-26
CLIENT PROFILE
An energy retailer serving roughly 3.4 million households across two countries, running a tariff response programme that had placed connected controllers in about 210,000 homes at a subsidised cost near USD 24 million to date (client-reported, unverified by MMA). Devices had been sourced from three suppliers across successive procurement rounds. Local execution capability varied considerably between the three device models.
STRATEGIC CHALLENGE
Participation in tariff response events had fallen steadily to under half of enrolled households, and the retailer assumed customers were opting out deliberately. Nobody had established whether the devices were actually reaching households during events, or whether the fault lay somewhere in the connectivity chain. Programme value was being questioned internally.
MMA APPROACH
MMA analysed event-level response data by device model, household broadband arrangement, and connectivity path, separating deliberate opt-outs from technical non-response. Local execution capability was compared across the three supplied device types against measured participation rates in each cohort. Broadband provider change records were matched against device reporting history for every enrolled household.
KEY FINDINGS
  1. Deliberate opt-outs accounted for only 19% of non-participation; the remainder were households whose devices never received or never acted on the event instruction.
  2. Devices executing tariff logic locally responded in 94% of events, against 61% for models requiring an external service call at the moment of the event.
  3. Around 31% of enrolled households had changed broadband provider since installation, and a substantial share of those devices had never reconnected afterwards.
  4. The cheapest of the three device models accounted for most failures, and its lower unit price had been fully consumed by lost response value within two years.
CLIENT PROFILE
An energy retailer serving roughly 3.4 million households across two countries, running a tariff response programme that had placed connected controllers in about 210,000 homes at a subsidised cost near USD 24 million to date (client-reported, unverified by MMA). Devices had been sourced from three suppliers across successive procurement rounds. Local execution capability varied considerably between the three device models.
STRATEGIC CHALLENGE
Participation in tariff response events had fallen steadily to under half of enrolled households, and the retailer assumed customers were opting out deliberately. Nobody had established whether the devices were actually reaching households during events, or whether the fault lay somewhere in the connectivity chain. Programme value was being questioned internally.
MMA APPROACH
MMA analysed event-level response data by device model, household broadband arrangement, and connectivity path, separating deliberate opt-outs from technical non-response. Local execution capability was compared across the three supplied device types against measured participation rates in each cohort. Broadband provider change records were matched against device reporting history for every enrolled household.
KEY FINDINGS
  1. Deliberate opt-outs accounted for only 19% of non-participation; the remainder were households whose devices never received or never acted on the event instruction.
  2. Devices executing tariff logic locally responded in 94% of events, against 61% for models requiring an external service call at the moment of the event.
  3. Around 31% of enrolled households had changed broadband provider since installation, and a substantial share of those devices had never reconnected afterwards.
  4. The cheapest of the three device models accounted for most failures, and its lower unit price had been fully consumed by lost response value within two years.
RECOMMENDED STRATEGY
Phase 1: Phase one: specify local execution of tariff logic as a mandatory requirement in all future device procurement, regardless of unit price differences. Phase 2: Phase two: run a reconnection campaign for the households whose devices stopped reporting after broadband changes, prioritising high consumption homes. Phase 3: Phase three: retire the lowest performing device model early rather than waiting for end of life, since lost response value exceeds replacement cost.
OUTCOME
Event participation rose from 47% to 78% within three quarters (client-reported, unverified by MMA). Reconnection recovered roughly 41,000 previously silent devices. Device procurement moved to local execution models at a 22% higher unit price that paid back inside one year. Local execution is now mandatory in every device specification.

Frequently Asked Questions

Foundational context covering the market sizes, CAGR, scope, country, region and competition that inform every finding below. This section is provided to cover basics and most often pre-purchase conversations, answered from the MMA Primary Research Dataset.

What is the current size of the Smart Home Hub Market?

The market was worth USD 5.6 billion in 2025 and reaches USD 6.1 billion in 2026. Value covers hub devices and the control software supplied on them.

How large will the Smart Home Hub Market be by 2036?

MMA forecasts USD 13.9 billion by 2036, an increase of USD 7.8 billion across the forecast period. That represents 2.28 times the 2026 base of USD 6.1 billion.

What is the CAGR for the Smart Home Hub Market 2026 to 2036?

The base case compound annual growth rate is 8.6%, with a bull case at 9.8% and a bear case at 7.4%. Historical growth from 2020 to 2025 ran at 7.6%.

Which segment is growing fastest?

Routers and gateways with hub function grow at 12.9%, half again the market rate of 8.6%. Operators ship one to every subscriber at minimal marginal cost.

Who are the major companies in the Smart Home Hub Market?

Amazon, Google, Apple, Samsung, and Tuya lead, together holding 57% of hub revenue. Four of the five sell hub function inside products bought for other reasons.

Which country is growing fastest?

China grows at 13.4%, supported by operator gateway distribution at an enormous scale alongside the largest domestic connected device market found anywhere in the world.

Report Segmentation Architecture

The full report scope spans multiple orthogonal segmentation dimensions, with cross-tabulated demand data provided for each dimension pair. Coverage extends further to regional breakdowns, trend trajectories, and the competitive detail needed to support segment-level decision-making.

By Hub Device Form

  • Standalone Dedicated Hubs
  • Smart Speakers and Displays with Hub Function
  • Routers and Gateways with Hub Function
  • Television and Media Devices with Hub Function
  • Security Panels with Hub Function
  • Energy Management Controllers with Hub Function

By End-Use Industry

  • Consumer Households
  • Energy Retail and Utilities
  • Home and Property Insurance
  • Broadband and Telecommunications
  • Monitored Security Services
  • Care and Independent Living Providers

By Commercial Dimension

  • Retail Consumer Purchase
  • Network Operator Distribution
  • Utility Subsidised Placement
  • Insurer Funded Deployment
  • Platform Software Licensing
  • Builder and Developer Specification

By Region

  • East Asia
  • North America
  • Western Europe
  • South Asia and Pacific
  • Latin America
  • Middle East and Africa
  • Eastern Europe

Scope, Methodology, and Coverage

Every figure in this report is reproducible from documented input assumptions. The scope below maps the historical period, the forecast horizon, the segmentation dimensions, and the countries covered, alongside the underlying primary and qualitative methodology.
Historical Period
2020 to 2025
Forecast Period
2026 to 2036
Base Year
2025 (USD billions; MMA Primary Research Dataset, September 2026)
Market Definition
This market covers devices providing smart home control and connectivity, including standalone dedicated hubs, smart speakers and displays with hub function, routers and gateways with hub function, television and media devices with hub function, security panels with hub function, and energy management controllers with hub function, together with the control software supplied on them. It excludes connected end devices such as lighting, locks, cameras and thermostats, professional building automation, and video storage subscriptions.
Quantitative Units
USD billions, device and licensed software revenue
Segmentation Dimensions
Hub device form, end-use industry, commercial dimension, region
Regions Covered
East Asia, North America, Western Europe, South Asia and Pacific, Latin America, Middle East and Africa, Eastern Europe
Countries Covered
China, Japan, South Korea, Taiwan, United States, Canada, Mexico, United Kingdom, Germany, France, Netherlands, Spain, Italy, Sweden, Switzerland, India, Australia, Indonesia, Vietnam, Singapore, Brazil, Mexico, Colombia, Chile, Saudi Arabia, United Arab Emirates, Nigeria, South Africa, Poland, Czechia
Key Companies Profiled
Amazon, Google, Apple, Samsung, Tuya, Aqara, Xiaomi, Signify, Aeotec, Hubitat, Nabu Casa, Bosch, Legrand, Schneider Electric, ADT, Vivint, Deutsche Telekom, Comcast, TP-Link, Ecobee
Quantitative Methodology
Primary survey, n=3,800 respondents, Q4 2025, six countries; demand-side model with trade association cross-validation
Qualitative Methodology
47 expert interviews, Q4 2025; applied to validate demand model assumptions, identify emerging dynamics, and assess competitive positioning
Report Format
PDF and XLSX data workbook (Word format preview document)
Publisher
Market Minds Advisory
Report Code
MMA-2026-TEC-811
Published
September 2026
Contact
sales@marketmindsadvisory.com | www.marketmindsadvisory.com

Purchase the full Smart Home Hub Market Report (2026 to 2036).

The full report sizes the smart home hub market across six device forms, seven regions, and thirty countries, with forecasts to 2036 under base, bull, and bear cases. It examines why the dedicated hub is dissolving into devices households buy for other reasons, how utilities and insurers now fund a large share of placement, and what local execution means for retention and trust. Competitive analysis covers twenty participants evaluated consistently on hub revenue, with detailed treatment of distribution reach and platform licensing. Cost structure, margin architecture, and regional adoption routes are analysed throughout. Primary research includes 3,800 survey responses and 47 expert interviews.
Six hub device forms sized and forecast separately
Twenty participants evaluated on device and licensing revenue
Regional adoption routes mapped across seven distinct geographies
Margin architecture by device form and who funds placement
Local execution rates benchmarked against retention and service withdrawal risk
Subsidised placement economics compared against retail acquisition cost

Built For The People Who Decide

From boardroom strategy to bench-side execution, this report is read cover-to-cover by leaders shaping the next decade of their industry, turning demand scenarios, market dynamics and valuation benchmarks into decisions.
CXOs/ Presidents/ VPs/ Managers
M&A and Corporate Development
Strategy Teams and R&D Heads
Procurement and Product Directors
Regulatory and Compliance Leaders
Investor Relations and Equity Analysts