Market Minds Advisory
Smart Grid Home Area Network (HAN) Market

Smart Grid Home Area Network (HAN) Market: Smart Grid Home Area Network Market: Consumer Indifference, Flexibility Value and Who Actually Pays 2026 to 2036

Two decades of showing households their electricity use changed almost nothing. What does change behaviour is a device that acts without asking, and the utility rather than the consumer pays for it.

Lead Analyst

Published

September 2026

Make Smarter Decisions with Customized Research Insights

Request a free sample report and evaluate market opportunities, growth trends, and competitive dynamics relevant to your business needs.

2025 MARKET VALUE$3.4BMarket Size 2025
2036 FORECAST VALUE$12.4BBase Case , 2026 to 2036
CAGR 2026 TO 203612.5 %Bull 13.8% / Bear 11.3%
INCREMENTAL OPPORTUNITY$8.6BNet 10- year value creation
EXPANSION MULTIPLE3.26x2036 value over 2026 base
Strategic Levers
M&A Pipeline
Regional Outlook
Country Rankings
Competitive Intelligence
Segmental Deep-dive
Call-Us : 91 93563 13602

Executive Snapshot and Market Trajectory.

Two decades of showing households their own electricity consumption changed almost nothing about how they use it. What genuinely changes load is a device that acts on its own without asking anybody, and the utility rather than the consumer is the party willing to pay for that.
The market reaches USD 3.8 billion in 2026 and USD 12.4 billion by 2036, a 3.26 times expansion at 12.5% annually. Automated load control and flexibility devices grow at 18.8%, half again the market rate of 12.5%, because a controllable load is genuinely worth something to a grid operator while a display simply is not. East Asia holds 30% of global spending, and India compounds fastest of any market at 20.2% on national metering rollouts.
Five suppliers hold 39% of home network equipment and platform revenue between them, and utility procurement rather than any consumer choice determines nearly all of it. Landis+Gyr, Itron, Schneider Electric, Siemens and Kamstrup lead the field between them. Whoever supplies the meter usually ends up supplying the network behind it too, which is a considerably stronger commercial position than any consumer brand relationship provides.
Market Definition
This report covers smart grid home area network equipment and platforms by function class: automated load control and flexibility devices, in-home displays and consumption feedback units, communicating thermostats and heating controls, home network gateways and communication modules, electric vehicle charging integration equipment, and utility demand response management platforms. It excludes electricity meters themselves, distribution grid automation equipment, general home automation products with no grid function, solar inverters and battery storage hardware, and retail energy supply services.
Base Year Value
$3.4B in 2025 (MMA Primary Research Dataset, September 2026)
Forecast Period
2026 to 2036, eleven discrete annual values
CAGR
12.5% base case. Bull 13.8%. Bear 11.3%.
Fastest Growth Segment
Automated Load Control And Flexibility Devices: 18.8% CAGR
Fastest Growth Country
India: 20.2% CAGR
Fastest Growth Region
South Asia and Pacific: 14.7% CAGR
Largest Region
East Asia: 30% of 2025 global value
Market Leaders
Landis+Gyr, Itron, Schneider Electric, Siemens and Kamstrup lead on home area network equipment and platform revenue. Source: MMA Analysis.
Primary Survey
n=3,800 procurement and R&D decision-makers, Q4 2025, six countries
Methodology
Demand-side build-up, cross-validated against public data, 47 expert interviews

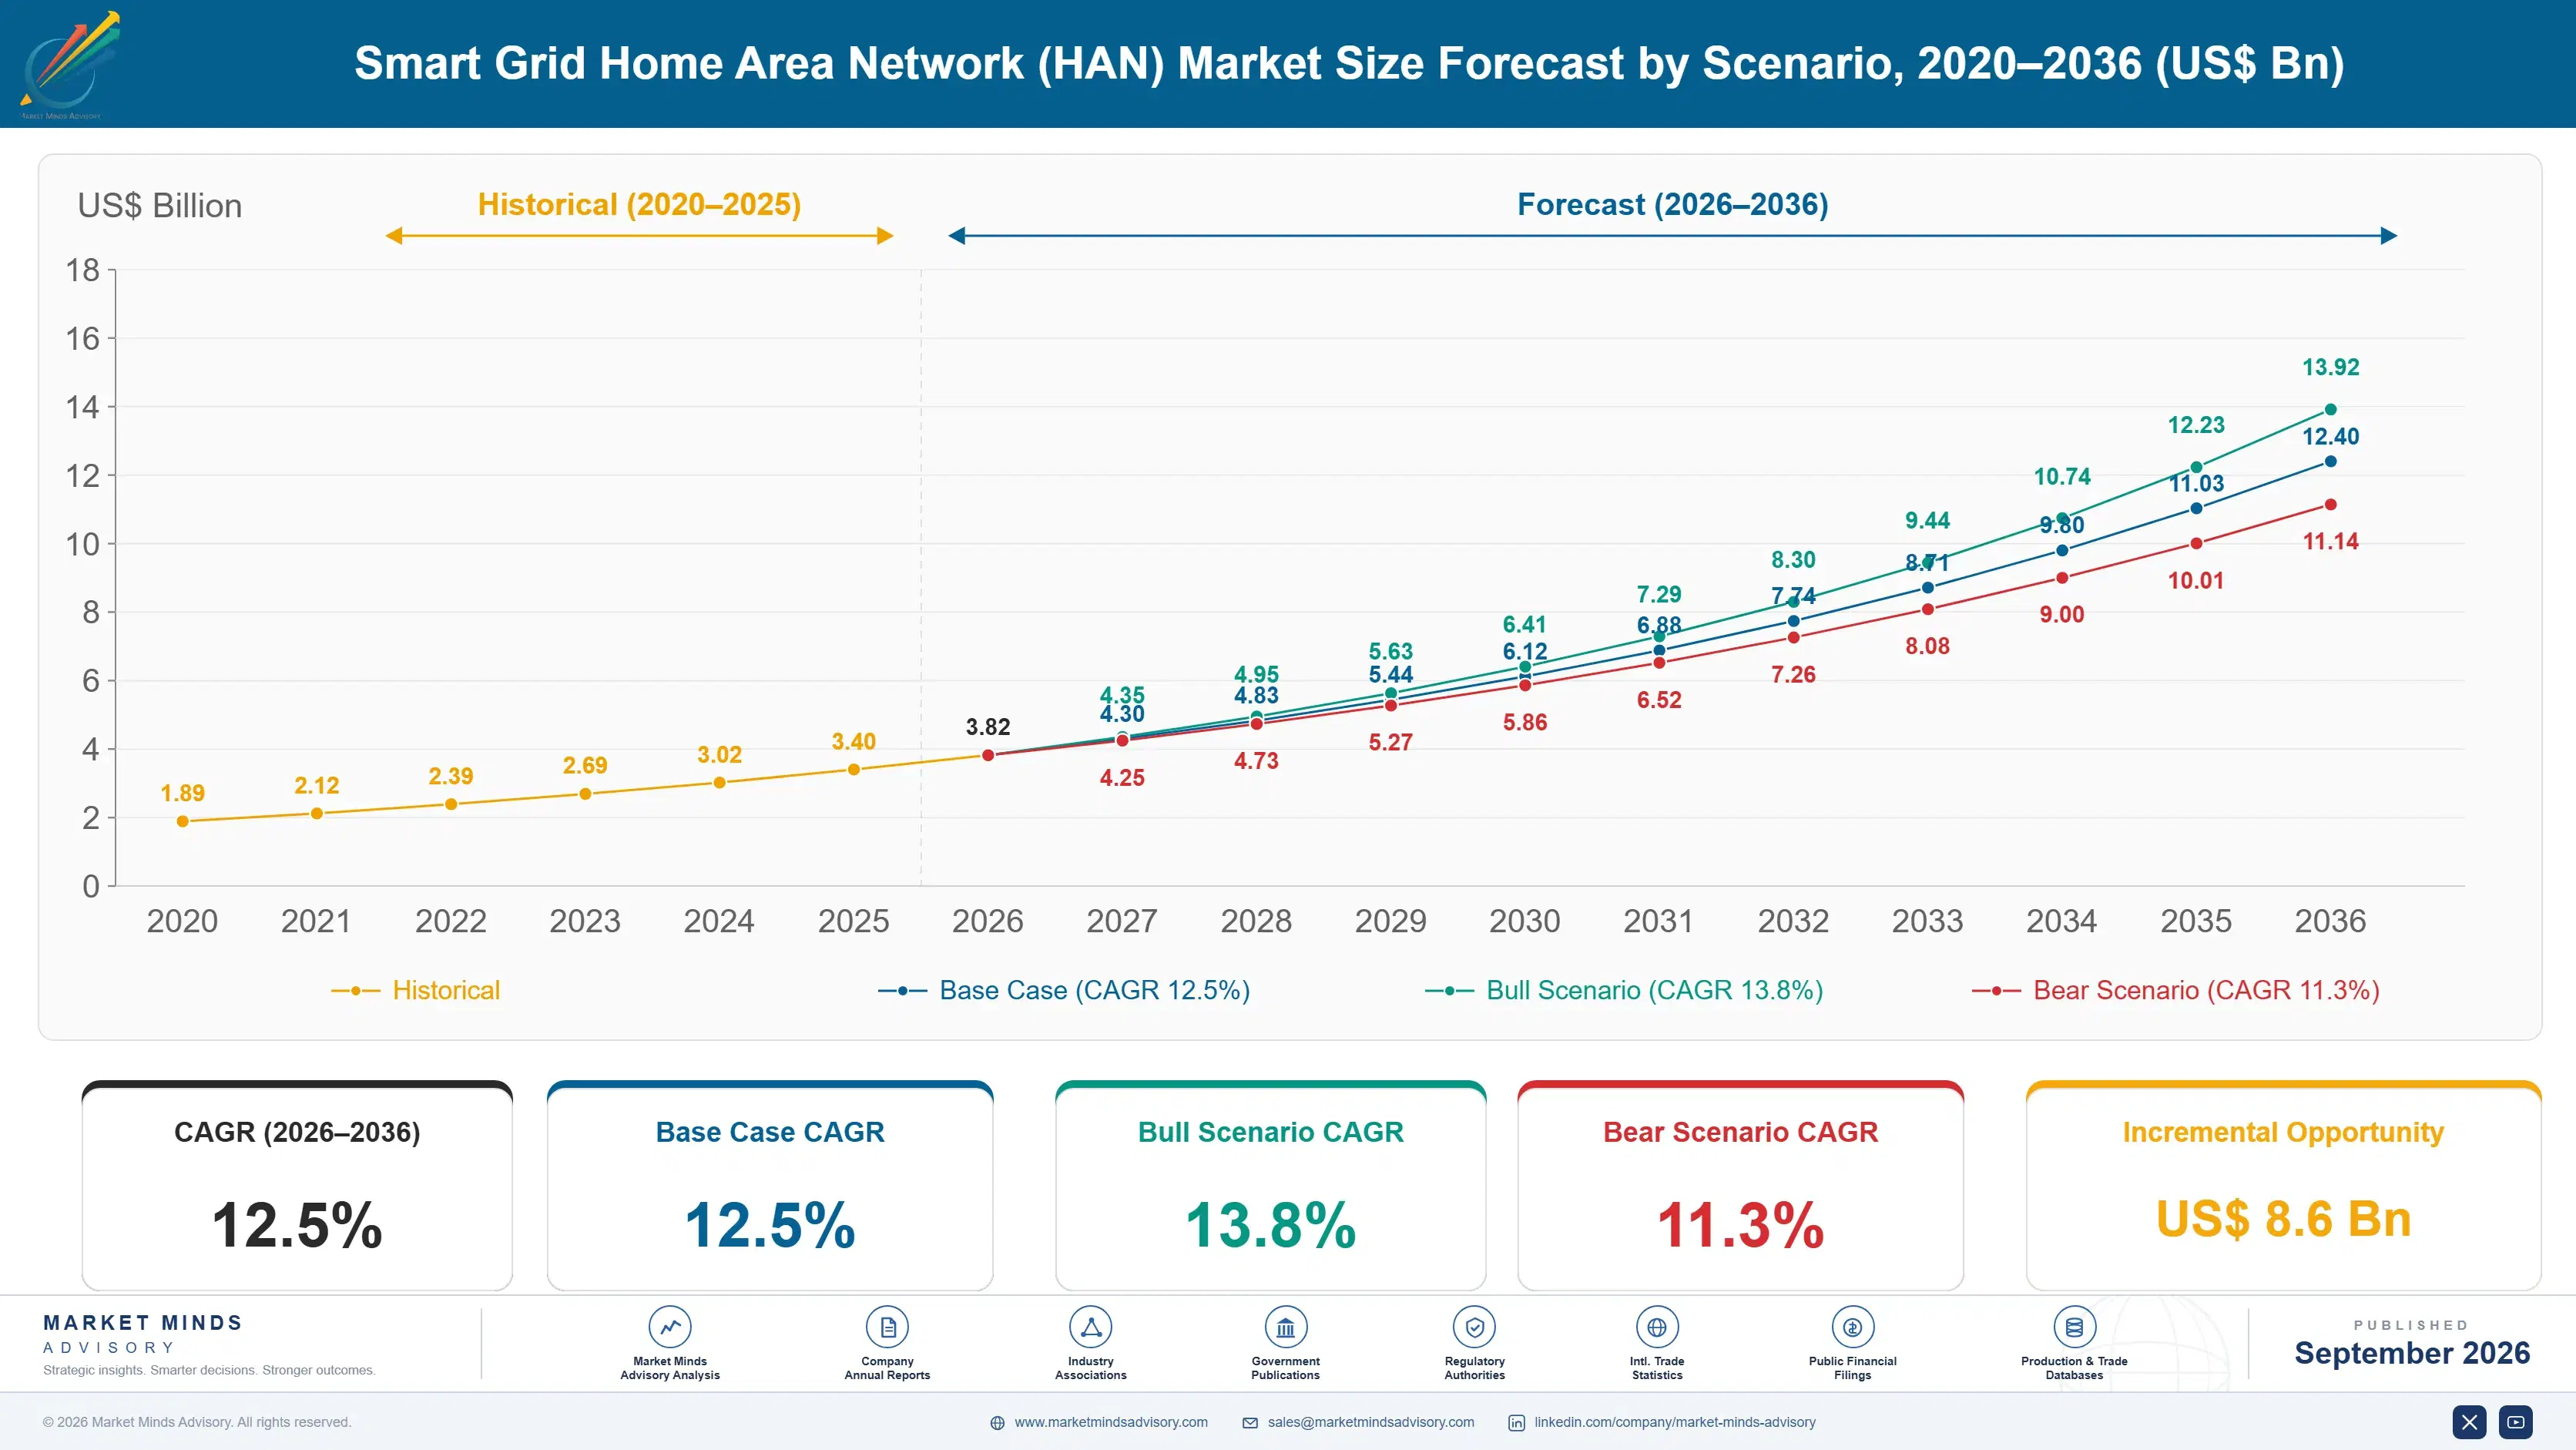
Smart Grid Home Area Network (HAN) Market Forecast Scenarios

smart-grid-home-area-network-han-market-size-forecast-scenario-1789996538197
Between 2020 and 2025 the category compounded at 11.2%, and the early part of that period was largely wasted. Programmes installed in-home displays on the assumption that information would change behaviour, and the measured effect proved small and faded within months. What worked was automation. Devices shifting load without asking anybody produced results displays never approached, and utilities eventually noticed which was worth funding.
The base case holds 12.5% on three mechanisms. Electricity demand is becoming considerably less predictable as heat pumps and vehicle charging arrive in domestic settings, which makes controllable load genuinely valuable to a network operator. Metering rollouts across India, Southeast Asia and Latin America keep installing the communication infrastructure this equipment depends on. And flexibility markets are opening in more jurisdictions, which finally gives somebody a reason to pay for aggregated household load.
The bull case at 13.8% assumes flexibility markets open faster than currently legislated, since a working market makes household load a tradeable asset rather than a theoretical one. The bear case at 11.3% is programme fatigue: regulators have funded two decades of consumer engagement with limited results, and a further round of scepticism about household participation would slow approvals across several jurisdictions.

Nobody Watches The Display

The uncomfortable finding sits at the centre of this whole category. Households stop paying attention to consumption displays after around nine weeks, and the lasting saving attributable to information feedback alone runs to roughly 2%. That result has been replicated repeatedly across two decades and several countries. It has also been ignored repeatedly, because programmes were designed around consumer engagement rather than around what actually moves load.
TOP FIVE CONCENTRATION39%Held by metering suppliers who also supply the network
DISPLAY ENGAGEMENT DECAY9 weeksBefore household attention to consumption feedback effectively disappears
SUSTAINED CONSUMPTION REDUCTION2%Lasting saving attributable to information feedback alone across studies
AUTOMATED SHIFT CAPABILITY18%Household peak load movable through automation without occupant action
UTILITY FUNDED SHARE81%Equipment paid for by network operators rather than by households
DEVICE SERVICE LIFE11 yearsBefore home network equipment requires replacement or major upgrade
Automation does what information could not. Roughly 18% of household peak load can be moved through automated control without any occupant action at all, principally through water heating, space conditioning and vehicle charging that nobody notices being shifted by an hour. Automated load control and flexibility devices grow at 18.8% against 12.5% for the market. The device acts, the household does nothing, and the load actually moves.
That reframes who the customer is. Around 81% of this equipment is paid for by network operators rather than by households, because a controllable load has measurable value to a grid while a display has essentially none. Utility procurement therefore determines nearly everything, and whoever supplies the meter usually supplies the network behind it too.
"We have spent twenty years and a great deal of public money on the theory that people would use less electricity if they could see how much they were using. They will not. They will, however, let a thermostat move their heating by twenty minutes if nobody asks them about it."
Director, Grid Edge and Energy Systems Practice · MMA Energy Practice · September 2026

Market Trends

Automation Delivers What Consumer Feedback Never Did

Household attention to consumption displays fades after around nine weeks and the lasting saving from information alone runs to roughly 2%, a result replicated repeatedly across two decades and several countries. Automated control moves around 18% of household peak load without any occupant action at all, principally through water heating, space conditioning and vehicle charging shifted by an hour that nobody notices. Automated load control and flexibility devices grow at 18.8% against 12.5% for the market. The device acts and the household simply does nothing. Utilities have finally noticed which of the two is worth funding.
Market Impact: India compounds at 20.2% annually
Domestic Electrification Makes Load Genuinely Unpredictable

Heat pumps and vehicle charging arriving in domestic settings change residential demand from something reliably predictable into something considerably harder for a network operator to plan around. A single vehicle charger can double a household's peak draw, and a street of them creates local constraints that were never designed for. That makes controllable load valuable in a way it simply was not when domestic demand consisted of lighting and appliances. Electric vehicle charging integration equipment grows at 15.4% as a direct consequence. Local constraints now arrive faster than reinforcement programmes can plan for them.
Market Impact: Utilities fund 81% of equipment

Market Opportunities and Growth Drivers

Metering Rollouts Install The Underlying Communication Layer

Home area network equipment depends on a communicating meter to reach the utility, so metering rollouts effectively determine where this market can exist at all. India compounds at 20.2%, faster than any other market, on a metering programme installing communication infrastructure at genuine national scale. Southeast Asian and Latin American rollouts follow broadly similar patterns behind it. Whoever supplies the meter usually supplies the network equipment behind it, which makes metering tenders considerably more commercially important than they appear. Metering tenders therefore decide considerably more than they appear to. Rollout timing determines where this market can exist at all.
Market Impact: Feedback saves only 2%

Flexibility Markets Give Somebody A Reason To Pay

Regulators across several jurisdictions are opening markets where aggregated household flexibility can be sold to network operators, which turns controllable load from a theoretical benefit into a tradeable asset with an actual price attached to it. That matters enormously, because around 81% of this equipment is funded by utilities and they need a revenue basis for doing so. Utility demand response management platforms grow at 14.1% as those markets open and require somebody to aggregate and dispatch the load. Without a price for flexibility there is no revenue basis for funding any of it.
Market Impact: Utilities buy 81% of equipment

Market Restraints and Challenges

Two Decades Of Disappointing Results Slow Approvals

Regulators have funded consumer engagement programmes for twenty years and seen sustained savings of roughly 2% from information feedback, which is a poor return on considerable public money. The root cause is that programmes were designed around a behavioural theory that repeated evidence has not supported. Commercially this makes new approvals harder even for automation that works. Mitigation runs through measured flexibility rather than claimed savings, and through funding cases built on network deferral value rather than on household consumption reduction. Scepticism earned by one approach now attaches unhelpfully to another that works.
Market Impact: Automation shifts 18% of peak

Utility Procurement Cycles Constrain Market Access Severely

Around 81% of equipment is bought by network operators through regulated procurement that runs on multi-year cycles tied to price control periods and approved capital plans. The root cause is that utilities cannot spend outside an approved allowance whatever a supplier proposes. Commercially this means a supplier missing a procurement window waits years for another. Mitigation runs through engaging during regulatory determination rather than at tender, and through metering positions that carry the network equipment alongside them automatically. Missing a determination means waiting for the next price control period entirely. Suppliers rarely plan that far ahead.
Market Impact: Chargers can double 1 household peak
3 additional market trends, 4 additional growth drivers, and 2 additional restraints and challenges are covered in the full report. Contact sales@marketmindsadvisory.com to access the complete intelligence.

Segment CAGR and Growth Architecture

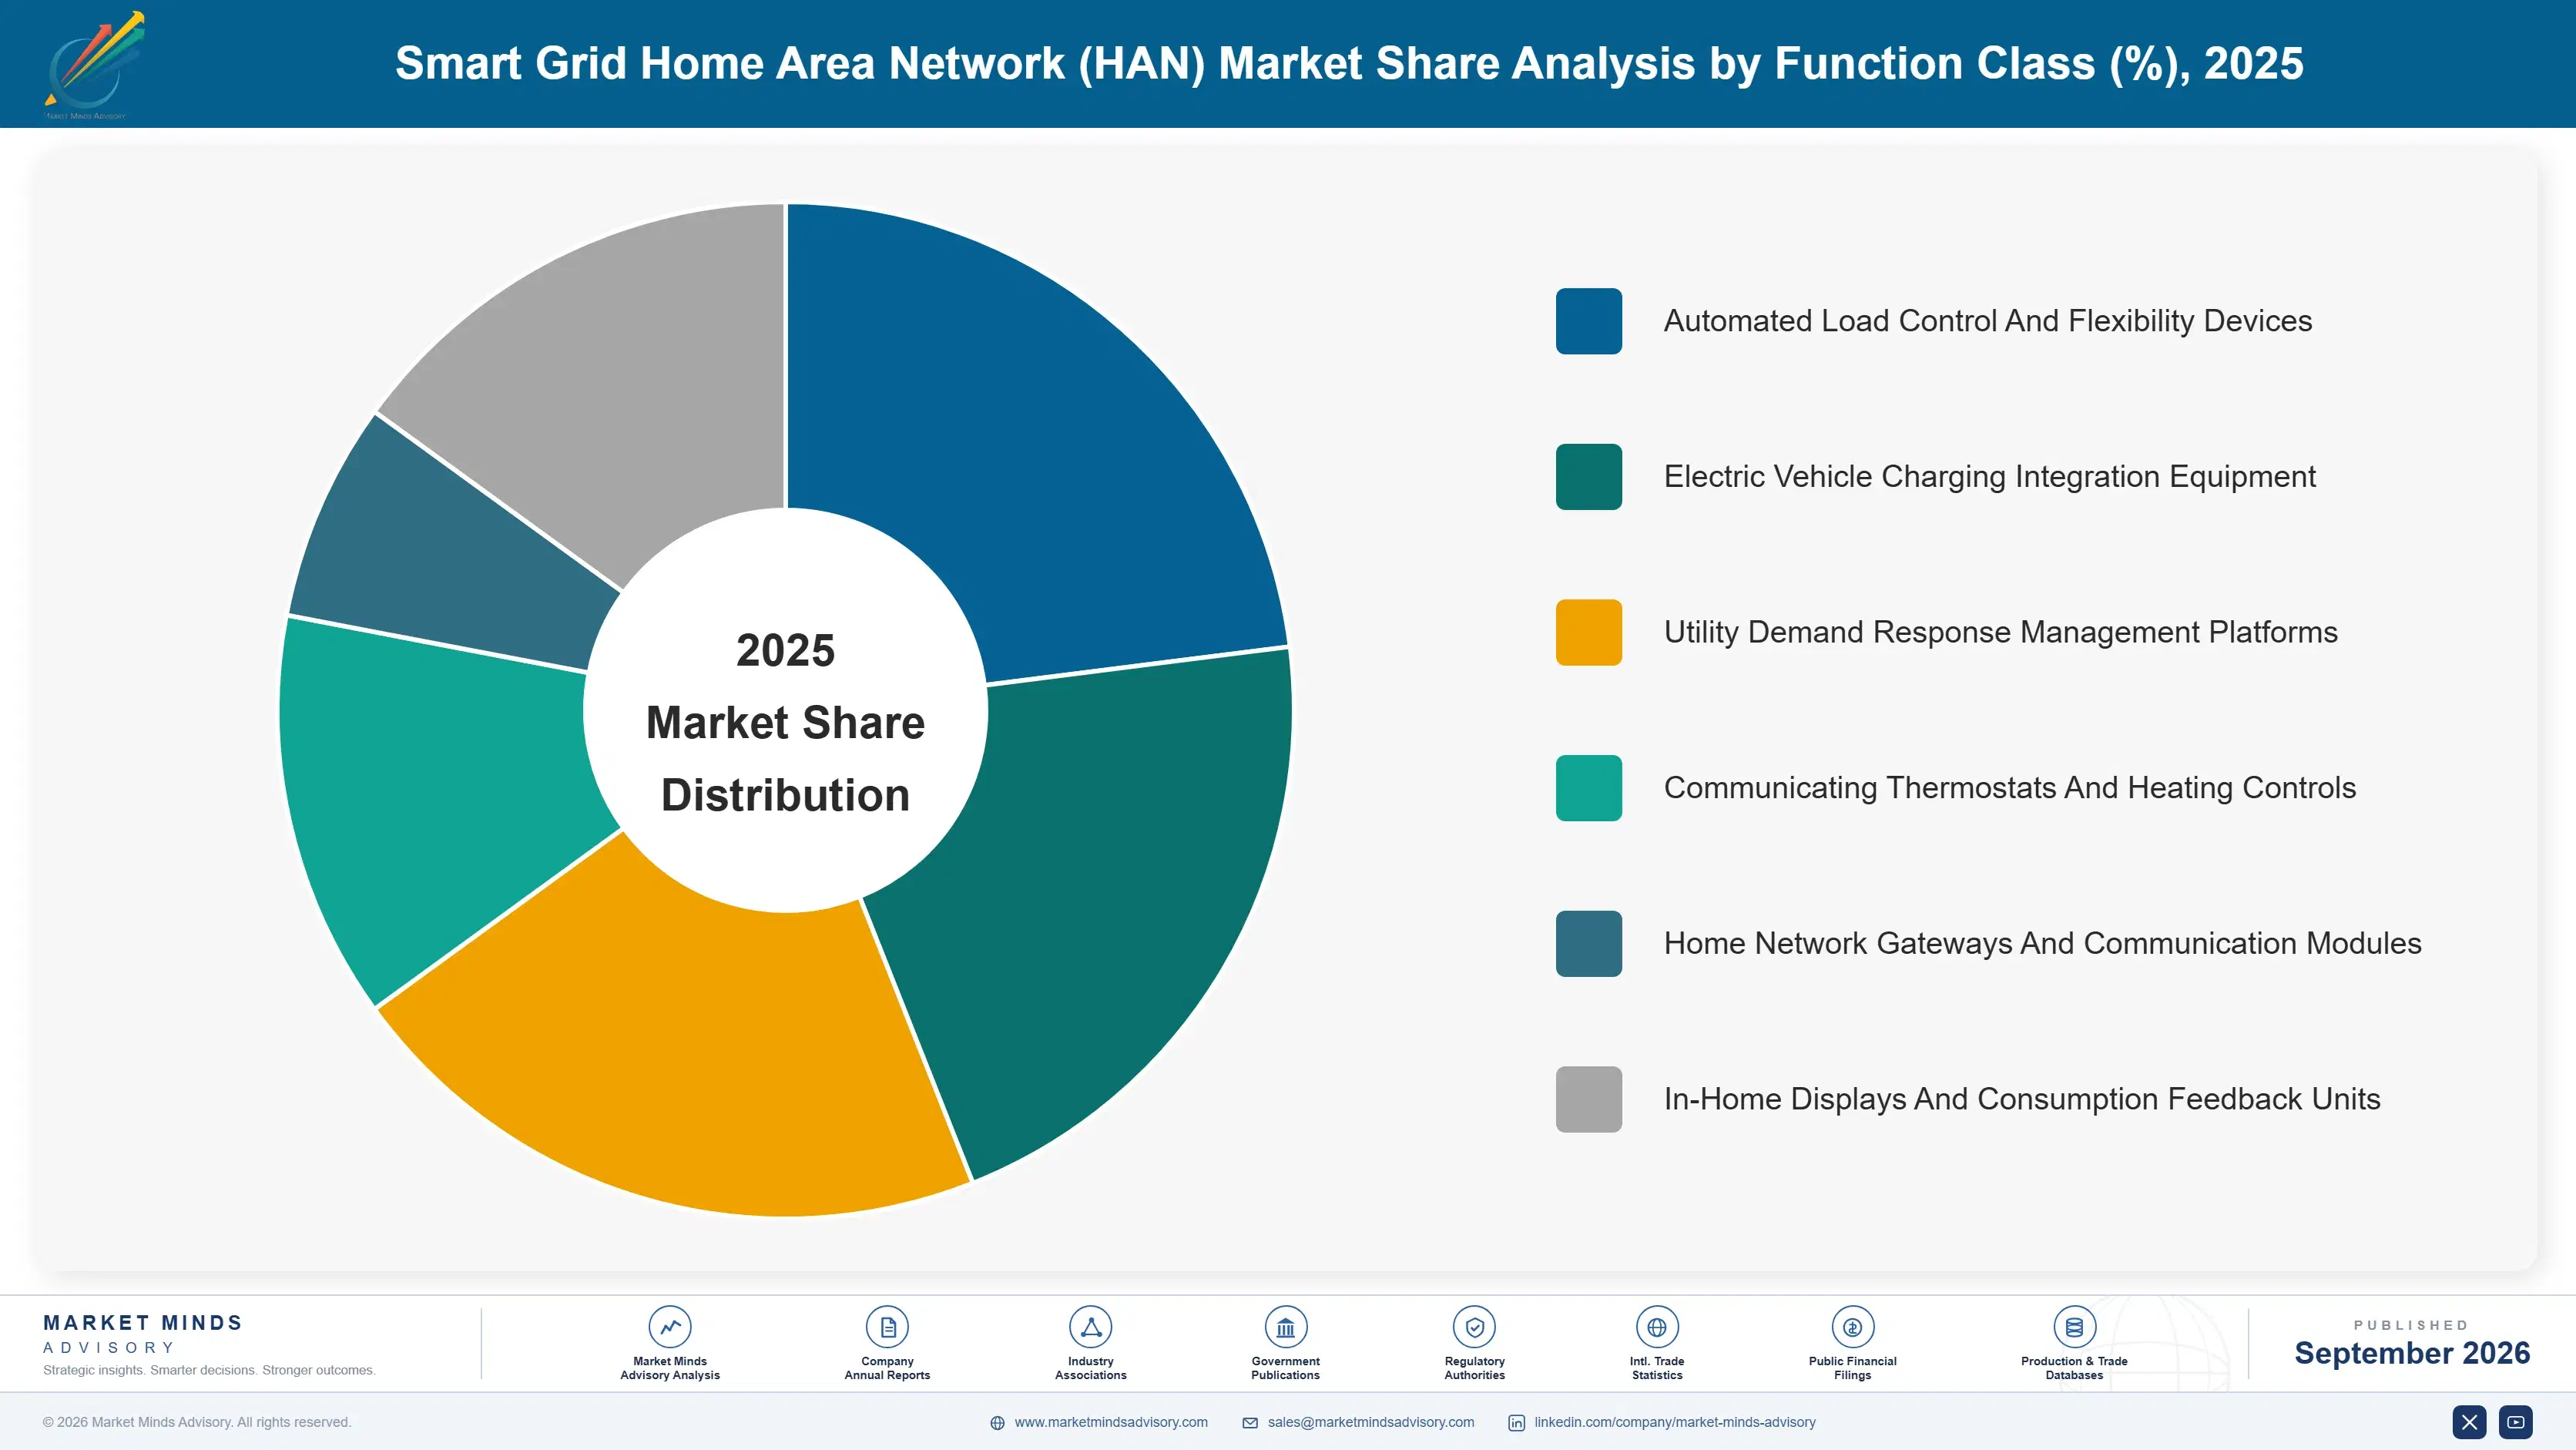
Segmentation follows function class, since each carries a different value to the party actually paying and quite different evidence behind whether it works. Six classes cover the market, spanning automated load control, consumption displays, communicating thermostats, network gateways, vehicle charging integration and utility demand response platforms. Procurement route and dwelling type are separate dimensions handled elsewhere.
smart-grid-home-area-network-han-market-market-share-analysis-1789996538753

Automated Load Control And Flexibility Devices

Automated load control and flexibility devices grow at 18.8%, half again the market rate of 12.5%, because they deliver what two decades of consumer information programmes could not. Roughly 18% of household peak load moves through automated control without any occupant action at all, principally water heating, space conditioning and vehicle charging shifted by an hour that nobody notices happening. That is measurable flexibility a network operator can plan around and increasingly sell into a market. Displays by contrast produce a lasting saving of roughly 2% and lose household attention entirely after about nine weeks of installation. That comparison has now been made often enough that regulators are noticing it too.
CAGR 18.8%

Electric Vehicle Charging Integration Equipment

Electric vehicle charging integration equipment compounds at 15.4% because a single domestic charger can double a household's peak draw and a street of them creates local network constraints nobody designed for. Managing when those vehicles charge is considerably cheaper than reinforcing the cable feeding the street, which is the comparison a network operator actually makes when approving expenditure. The occupant does not care when charging happens provided the vehicle is ready in the morning, which makes this the easiest load to shift and the one delivering most of the available flexibility value. Charging is also the load growing fastest across every domestic market measured, which makes it the segment where flexibility value concentrates most heavily.
CAGR 15.4%
Full segment breakdown across 6 segments available in the complete report.

Regional Architecture and Country Demand Map

East Asia holds 30% of category spending, sitting right at the band ceiling, on the Chinese, Japanese and South Korean metering and grid programmes that all run at very considerable scale. Western Europe follows at 23% on flexibility market development and domestic electrification proceeding together.

East Asia

East Asia takes 30% of spending, at the band ceiling, on Chinese metering and grid programmes operating at a scale that dwarfs anything elsewhere and on Japanese and South Korean electrification investment behind it. Chinese deployment runs almost entirely on domestic equipment under national programmes, which separates that portion of the market from international competition. Japanese utilities have deployed home area network capability alongside metering for years with limited flexibility market development behind it. Growth at 13.6% sits above the global rate on rollout volume rather than on any flexibility market opening. Domestic equipment dominates the Chinese portion of this market completely. Flexibility markets remain undeveloped across most of the region.
Share: 30% | CAGR: 13.6% (2026 to 2036)

Western Europe

Western Europe accounts for 23% of spending, where flexibility market development is furthest advanced and domestic electrification is proceeding fastest anywhere. Heat pump and vehicle charging adoption is creating local network constraints that make controllable load genuinely valuable to distribution operators rather than theoretically interesting. Landis+Gyr, Kamstrup, Schneider Electric and Siemens all hold established regional positions across metering and network equipment. Regulatory determination cycles rather than commercial cycles govern procurement timing entirely. Growth at 11.0% is the slowest of any region on mature metering penetration. Domestic electrification is proceeding faster here than anywhere else measured. Flexibility revenue is genuinely available to operators. Distribution operators here face the constraints first. Reinforcement costs make the comparison easy.
Share: 23% | CAGR: 11.0% (2026 to 2036)
Regional intelligence for 5 additional markets available in the complete report: North America, South Asia and Pacific, Latin America, Middle East and Africa, Eastern Europe. Contact sales@marketmindsadvisory.com.
smart-grid-home-area-network-han-market-country-cagr-analysis-1789996539284

Where This Equipment Gets Funded

Consumers have demonstrated across two full decades that they will simply not engage with any of this at all, utilities pay for almost everything and buy only on regulated cycles, and automation delivers measurable flexibility where information delivered essentially none. The four levers below follow those conditions rather than any argument about interface design.

Sell Measured Flexibility Rather Than Claimed Savings

Information feedback produces a lasting household saving of roughly 2% while automated control moves around 18% of peak load without any occupant action whatsoever. Those two numbers should have settled the argument a decade ago and somehow did not. Suppliers still presenting consumer engagement benefits are asking a regulator to fund a theory that repeated evidence contradicts. Those presenting measured load shift are offering something a network operator can plan around and increasingly sell into an actual flexibility market. Regulators are increasingly asking for the measurement rather than the theory.
Market Impact: Automation now shifts fully 18% of peak load

Win The Metering Tender To Win Everything

Home area network equipment depends on a communicating meter to reach the utility, and whoever supplies that meter usually supplies the network equipment behind it as a matter of course. India compounds at 20.2% on a metering programme installing that infrastructure at national scale right now. Suppliers treating metering and home network equipment as separate commercial opportunities are competing for the second one after somebody else has already effectively won it through the first. The metering tender is therefore the commercially decisive moment in this whole category, and it is frequently contested by people who have not realised that.
Market Impact: India alone compounds at 20.2% every single year

Engage During Regulatory Determination Not Tender

Around 81% of equipment is bought by network operators through regulated procurement tied to price control periods and approved capital allowances, which means the money is decided long before any tender is issued. A supplier missing that window waits years for the next one. Engaging during regulatory determination, when allowances are being set and evidence is being submitted, shapes what gets funded at all. Arriving at tender means competing for a budget somebody else helped to define. Determination work is slow, unglamorous and decides what any tender can actually buy afterwards.
Market Impact: Utilities now fund 81% of all the equipment

Follow Vehicle Charging Into Local Constraints

A single domestic charger can double a household's peak draw, and a street of them creates local network constraints that no distribution operator planned for when the cables were laid. Managing charging timing costs considerably less than reinforcing that cable, which is the comparison actually made when approving expenditure. Vehicle charging integration equipment grows at 15.4% because occupants genuinely do not care when charging happens provided the vehicle is ready by morning. Reinforcement is expensive, disruptive and slow, which is exactly why managing timing wins the comparison so often. Occupants notice nothing at all.
Market Impact: Charging integration compounds at fully 15.4% every year

Who Controls the Margin Pool

Five suppliers hold 39% of home area network equipment and platform revenue, and utility procurement rather than any consumer choice determines nearly all of it. Landis+Gyr, Itron, Schneider Electric, Siemens and Kamstrup lead. All participants here are assessed on home area network equipment and platform revenue rather than on any broader metering or grid business they also operate. Consumer preference plays essentially no part in any of these purchasing decisions at all.
Competition runs through metering positions more than through product capability, because whoever supplies the communicating meter usually supplies the network equipment behind it as a matter of course. The second dimension is regulatory engagement, since around 81% of purchases are funded through approved allowances that get decided during determination rather than at the point any tender is finally issued.

Pressure comes from consumer device makers whose thermostats and chargers already sit in the home and increasingly offer utility integration. Rankings shift where metering rollouts are happening rather than where flexibility markets are opening, particularly across India, Southeast Asia and Latin America at present. Metering rollouts rather than flexibility market openings determine where the volume actually appears next.
smart-grid-home-area-network-han-market-company-positioning-matrix-1789996539842

Competitive Moat and Risk Dimensions

LANDIS+GYR

Moat: Metering Installed Base Position

Landis+Gyr holds metering positions across a very large number of utility programmes, and the home area network equipment behind a meter is usually supplied by whoever supplied the meter itself. That relationship persists across an 11 year device life and through successive procurement rounds. Competitors without a metering position must displace an incumbent whose equipment already communicates with everything installed.
LANDIS+GYR

Risk: Consumer Device Encroachment

Thermostats, chargers and appliances made by consumer brands already sit inside the home and increasingly offer utility integration without any metering relationship at all. Those devices reach the household directly rather than through a procurement cycle. A metering position protects the network equipment and does not protect the controllable load itself.
SCHNEIDER ELECTRIC

Moat: Grid And Home Integration

Schneider Electric holds positions across distribution grid equipment and home network products together, which matters because flexibility value is realised at the distribution level rather than inside the house. Understanding where local constraints actually bind lets the company make a funding case a home equipment supplier cannot construct alone. That combined position is genuinely difficult to assemble from either direction.
SCHNEIDER ELECTRIC

Risk: Regulated Cycle Exposure

Revenue depends on utility capital allowances approved through regulatory determination on multi-year cycles that nobody controls or accelerates. A determination that funds less than expected removes revenue for years with no commercial recourse available. Breadth across grid and home does not change when the money is actually decided or how much of it there is.

Players Tracked

Prominent Players

Landis+Gyr
Itron
Schneider Electric
Siemens
Kamstrup

Other Key Players

Honeywell
Sagemcom
Aclara Technologies
Wasion Group
Hexing Electrical
Networked Energy Services
Trilliant
Ecobee
tado
OhmConnect
Enel X
AutoGrid
Uplight
GridPoint
Sensus

Recent Developments

APRIL 2025

Distribution Operators Fund Automated Load Control Programmes

European distribution network operators funded automated load control deployment in place of further consumption feedback programmes, a procurement development rather than any corporate transaction. Automated control moves around 18% of household peak without occupant action, while information feedback produces a lasting saving of roughly 2% that fades within weeks.
Signal: A device that simply acts without asking moves load where any display asking politely never did.
OCTOBER 2024

Indian Metering Programme Installs Communication Infrastructure Nationally

Indian metering programmes installed communicating infrastructure across states at national scale, capacity development rather than any commercial transaction. Home area network equipment depends on a communicating meter to reach the utility at all, which makes the metering tender the commercially decisive moment rather than any subsequent network equipment procurement.
Signal: Whoever wins the metering tender usually wins the home network equipment sitting behind it as well.
JULY 2025

Flexibility Markets Open Across Further European Jurisdictions

Regulatory authorities opened flexibility markets allowing aggregated household load to be sold to network operators across additional jurisdictions, a regulatory development rather than any transaction. That turns controllable load from a theoretical benefit into a tradeable asset with a price, which utilities funding 81% of this equipment genuinely need.
Signal: A tradeable price turns household flexibility from a theoretical benefit into a genuinely funded asset instead.

What Home Network Equipment Costs

Communication modules and radio silicon absorb roughly 31% of device cost, sourced from a limited group of suppliers serving metering and industrial markets together. Enclosures, power supply and certification take around 24%, with regulatory approval per market adding meaningful cost. Platform software development absorbs about 22% and must be maintained across an 11 year device life, with logistics taking the balance.
Radio and communication component supply tightened through 2022 and 2023 as metering rollouts competed with industrial demand for the same limited semiconductor capacity, extending delivery on equipment already contracted under fixed-price utility agreements. Landis+Gyr Annual Report 2023 and Itron Annual Report 2023 both record component availability and cost as principal operating variables. Suppliers holding multi-year allocation delivered considerably better than those buying against demand. Certification timing added further delay in several markets.

The competitive disadvantage mechanism is certification cost per market rather than component price. A supplier selling across many jurisdictions amortises radio and safety approval across large volume, while one entering a new market carries that cost against uncertain tender outcomes. Exposure concentrates among smaller suppliers and new entrants, whose certification burden is identical to an incumbent's while their volume is nothing remotely like it.
smart-grid-home-area-network-han-market-cost-volatility-analysis-1789996540039

Secure Radio Component Allocation Across Rollout Cycles

Communication modules run roughly 31% of device cost and compete directly with metering and industrial demand for the same limited semiconductor capacity. Multi-year allocation lets a supplier commit to delivery dates a utility can build a rollout programme around. Buying against demand means being unable to commit at all, which loses tenders on schedule rather than on price.

Amortise Certification Across Multiple Jurisdictions

Enclosures, power supply and certification absorb around 24% of cost, and radio and safety approval repeats in every market a supplier enters. Structuring products so a single design family covers several jurisdictions with minimal variation spreads that expense considerably further. Smaller suppliers frequently certify per market and never recover the cost across the volume that actually results.

Design Platforms For Eleven Year Maintenance

Platform software absorbs roughly 22% of cost and must be maintained across an 11 year device service life while communication standards and security requirements both change underneath it. Designing for that maintenance horizon rather than for initial deployment reduces total cost considerably. Suppliers optimising for launch discover that supporting a decade-old fleet consumes engineering capacity they never budgeted.

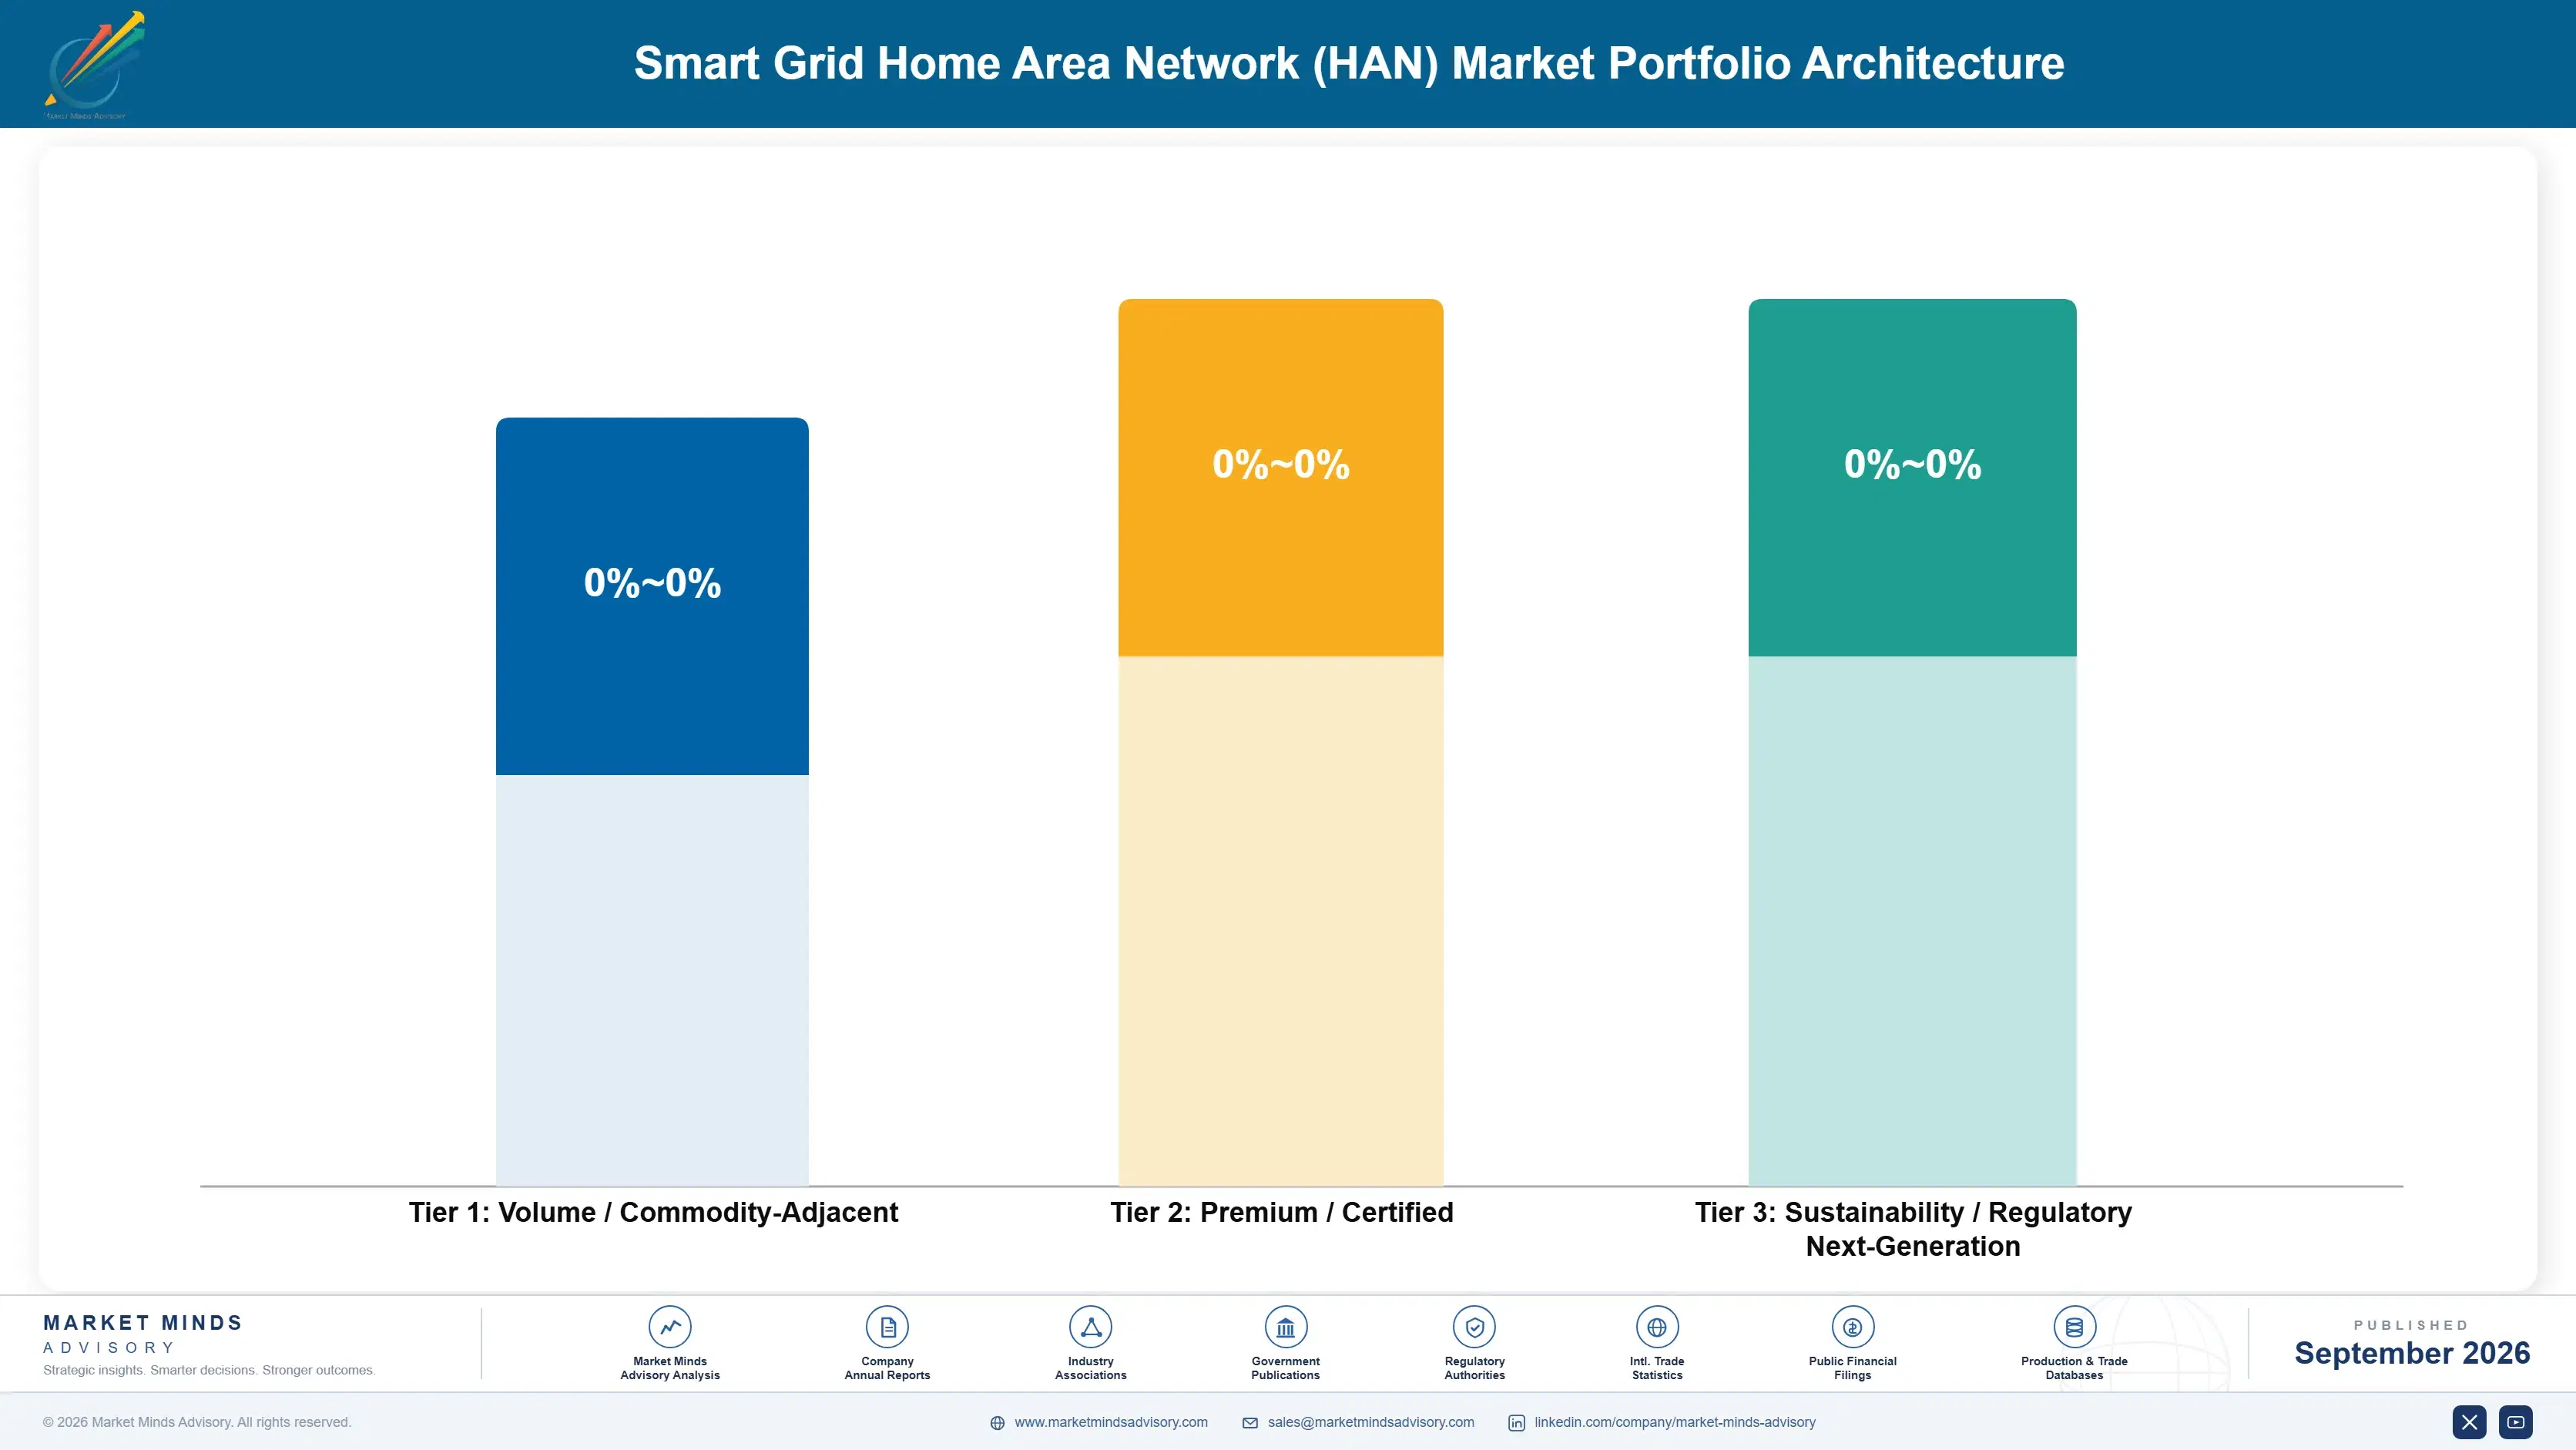
Portfolio Architecture for Margin Defence

Margin architecture separates on whether the product produces measurable flexibility. In-home displays and consumption feedback units earn least, since the evidence for their effect is poor and regulators have noticed. Network gateways and communication modules sit above on integration content. Automated load control, vehicle charging integration and demand response platforms earn most, because each produces load shift a network operator can measure and increasingly sell.
The volume versus premium tension runs between hardware and platform. Devices ship in enormous quantities at thin margin against utility procurement pressure. Demand response platforms aggregate and dispatch that load at considerably better margin on far smaller revenue. Suppliers organised entirely around device manufacturing are exposed to procurement cycles they cannot influence and to a component cost base they do not control.

High-value pools concentrate in demand response platforms and in flexibility measurement, and neither is reached through device manufacturing capability. Platforms require aggregation, dispatch and market participation capability that hardware businesses have generally not built. Flexibility measurement requires evidence quality a regulator will accept. Both are deliberate investments and both explain why metering suppliers keep acquiring software businesses rather than building them.

Volume / Commodity-Adjacent

In-home displays and consumption feedback units, where the measured effect is poor and regulators across several jurisdictions have now noticed that clearly. The ten point spread separates suppliers with certification amortised across many markets from those entering new jurisdictions individually.
Gross Margin: 18% to 28%

Premium / Certified

Home network gateways, communication modules and communicating thermostats, where integration quality and metering compatibility determine selection alongside price. The twelve point spread tracks component allocation security and how much certification each supplier has already amortised across volume.
Gross Margin: 32% to 44%

Sustainability / Regulatory / Next-Generation

Automated load control devices, vehicle charging integration and utility demand response platforms, each producing measurable load shift that an operator can plan around and increasingly sell. The eighteen point spread reflects platform software content and flexibility market participation capability.
Gross Margin: 48% to 66%
smart-grid-home-area-network-han-market-portfolio-architecture-1789996540566

High-value Sub-segments and Strategic Watch-out

Automated Load Control And Flexibility Devices

Grows at 18.8% because automation moves around 18% of household peak where information feedback moved almost nothing at all. The eighteen point spread reflects platform software content. Displays produce a lasting saving of roughly 2% and lose attention within nine weeks. Regulators have started noticing the difference.
Gross Margin: 48% to 66%

Electric Vehicle Charging Integration Equipment

Grows at 15.4% because a single charger can double household peak draw and a street creates constraints nobody planned for. The eighteen point spread reflects integration depth. Occupants do not care when charging happens provided the vehicle is ready by morning. It is the fastest growing domestic load anywhere.
Gross Margin: 48% to 66%

Utility Demand Response Management Platforms

Grows at 14.1% as flexibility markets open and somebody has to aggregate and dispatch the household load being traded. The eighteen point spread reflects market participation capability. Utilities funding 81% of equipment need a revenue basis to justify it. Aggregation capability is genuinely scarce among hardware suppliers.
Gross Margin: 48% to 66%

In-Home Displays And Consumption Feedback Units

Grows at 3.6%, slowest of the six function classes, on a proposition that two decades of evidence has now fairly comprehensively undermined. The ten point spread reflects certification amortisation. Attention fades after roughly nine weeks and the saving runs near 2%. Regulators have largely stopped funding it.
Gross Margin: 18% to 28%

Why Utility Choices Persist

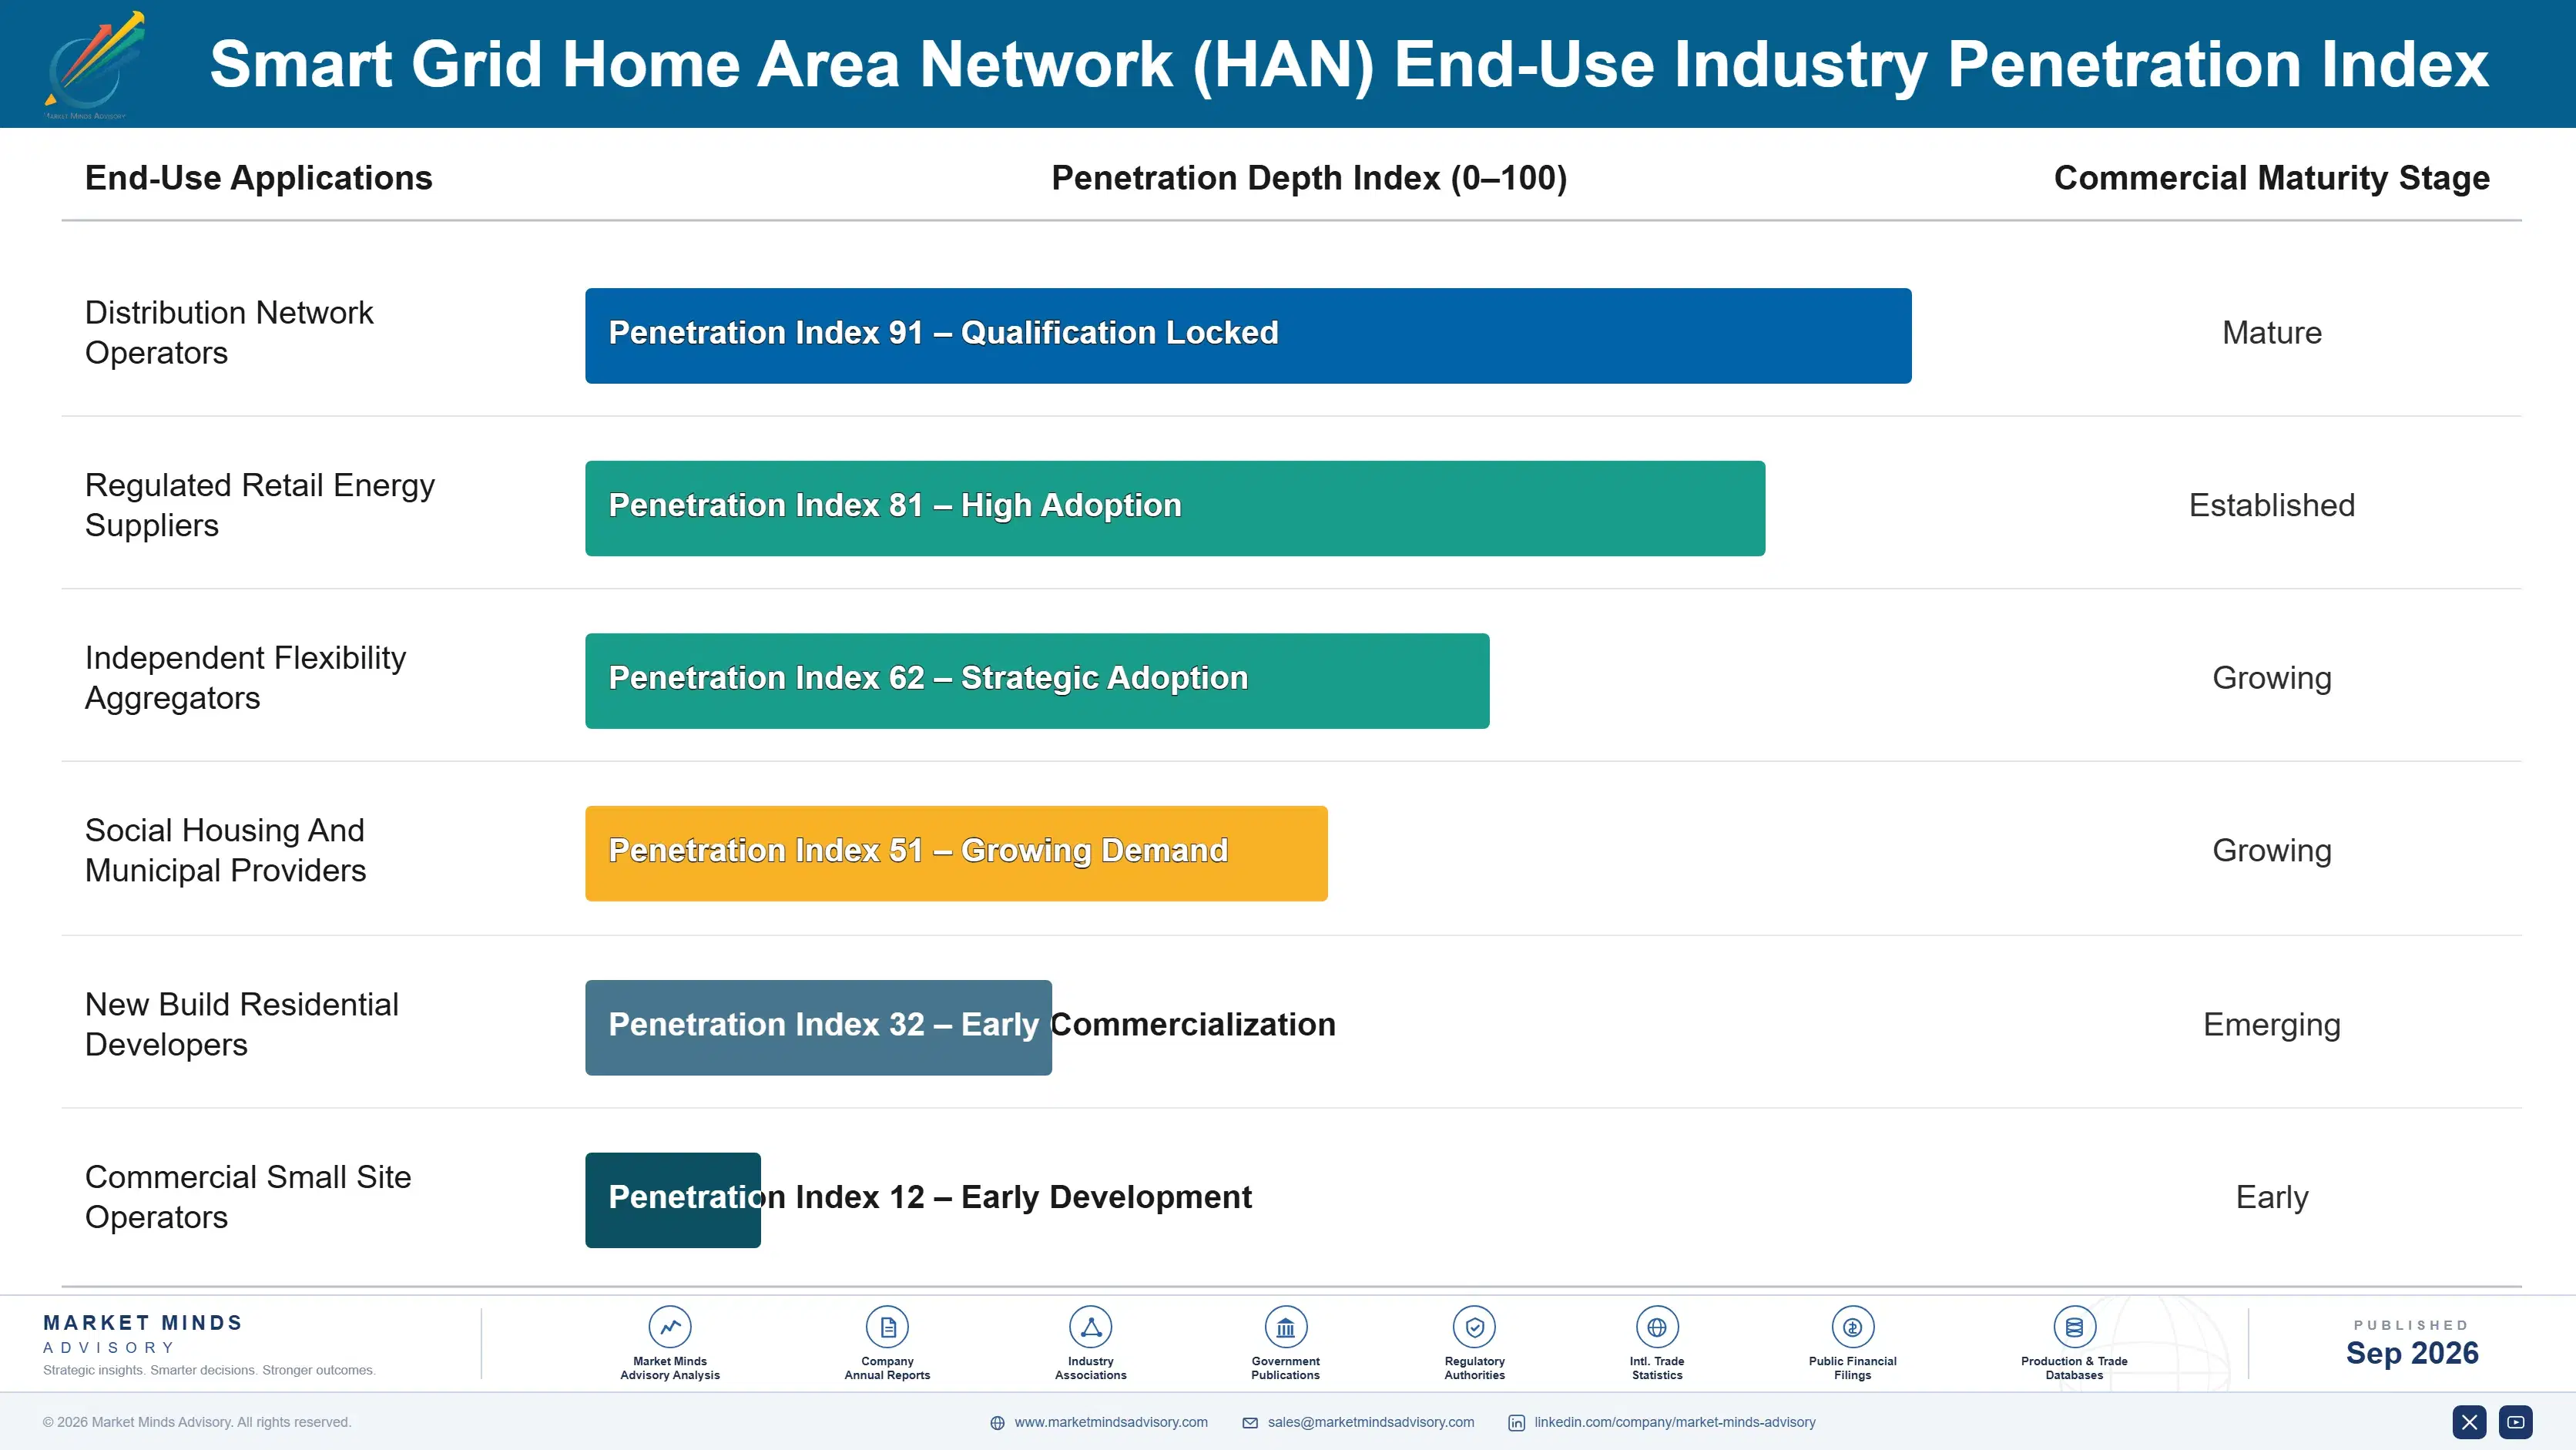
The annuity here runs through the meter rather than through any consumer relationship. Home network equipment communicates with a specific metering system, and replacing it means either replacing the meters or accepting an integration nobody wants to maintain. Devices run around 11 years and utilities replace on programme cycles rather than opportunistically at all. A supplier winning the metering position therefore holds the network equipment behind it for over a decade.
Depth varies by what actually sits between the utility and the load. A demand response platform holding years of dispatch history and market participation records is deeply embedded. Automated control devices integrated into a specific metering system are similarly fixed. A consumer thermostat that happens to accept utility signals is barely embedded, and the household replaces it whenever it likes.

The buyer sits inside utility capital planning rather than anywhere near the household, which is not what the category name suggests. A network planner evaluates whether controllable load defers a reinforcement. A regulatory affairs function evaluates whether the allowance can be justified. A household evaluates nothing at all, because it is not paying. Suppliers marketing to consumers address the one party with no budget here.
smart-grid-home-area-network-han-market-end-use-penetration-index-1789996541055

What Gets Funded Here

These are among the four positions where our research anticipates prominent divergence between winners and laggards over the coming forecast period. Each is grounded in the demand model, the regulatory perimeter, and the announced capacity pipeline.
01 / EVIDENCE BASED POSITIONING

Sell Measured Shift, Not Consumer Engagement

Information feedback produces a lasting household saving of roughly 2% while automated control moves around 18% of peak load without any occupant action whatsoever, and those two numbers should have settled this argument a full decade ago. Suppliers still presenting consumer engagement benefits are asking a regulator to fund a behavioural theory that two decades of repeated evidence has fairly comprehensively contradicted. Those presenting measured load shift instead offer something that a network operator can genuinely plan around and increasingly sell.
02 / METERING POSITION PRIORITY

The Meter Tender Decides Everything Else

Home area network equipment depends on a communicating meter to reach the utility at all, and whoever supplies that meter usually supplies the network equipment behind it more or less as a matter of course. India compounds at 20.2% annually on a metering programme installing exactly that communicating infrastructure at national scale right now. Suppliers treating metering and home network equipment as two separate commercial opportunities are competing for the second one long after somebody else has effectively won it.
03 / REGULATORY CYCLE ENGAGEMENT

Shape The Allowance Before The Tender

Around 81% of all this equipment is bought by network operators through regulated procurement tied to price control periods and to approved capital allowances, which means the money itself is decided long before any tender document is ever issued out to suppliers. A supplier missing that particular window then waits several years for the next one to open up. Engaging during regulatory determination, when the allowances are being set and evidence submitted, shapes what actually gets funded at all afterwards.
04 / CHARGING CONSTRAINT TARGETING

Follow Vehicles Into Local Network Limits

A single domestic vehicle charger can double a household's peak draw, and a whole street of them creates local network constraints that no distribution operator ever planned for when the cables were originally laid. Managing the charging timing costs considerably less than reinforcing that cable, which is the direct comparison actually made whenever anybody approves expenditure. Vehicle charging integration equipment grows at 15.4% precisely because occupants genuinely do not care when the charging happens, provided the vehicle is ready by morning.

Engagement Snapshot From the Field

A live engagement with an industry participant carrying material or product regulatory and market exposure ahead of a defining policy shift, showing how our research translates into a defensible multi-year portfolio strategy.
MARKET MINDS ADVISORY · CLIENT ENGAGEMENT SUMMARY
Smart Grid Home Area Network (HAN) Producer Strategic Portfolio Review and Transition Roadmap 2026·Investment Scenario on Smart Grid Home Area Network (HAN) Exposure Evaluation 2025-26
CLIENT PROFILE
A distribution network operator serving around two million domestic connections, facing local network constraints arising from heat pump and vehicle charging adoption across several urban areas. A previous consumption feedback programme had already produced disappointing results, and the regulator had questioned whether any further household investment could be justified in the next price control period.
STRATEGIC CHALLENGE
Customer engagement wanted to extend the feedback programme with better displays and a communications campaign. Network planning wanted reinforcement capital for the constrained areas instead. Nobody had compared automated load control against either option, or measured what shift was actually achievable in the affected streets rather than assumed across the whole customer base.
MMA APPROACH
MMA measured achievable load shift by street in the constrained areas, separating water heating, space conditioning and vehicle charging. We costed automated control against physical reinforcement for each constraint, and reviewed what evidence the regulator had accepted from comparable programmes elsewhere. Work drew on 47 expert interviews conducted in Q4 2025 with network operators, suppliers and regulatory specialists.
KEY FINDINGS
  1. Around 2 in 10 of peak load in the constrained streets was shiftable through automation without any occupant action being required at all.
  2. Automated control cost substantially less than physical cable reinforcement in four of the five constrained areas that were assessed during this work.
  3. The previous feedback programme had produced a sustained saving close to nothing once the initial novelty period had passed (client-reported, unverified by MMA).
  4. Vehicle charging alone accounted for the majority of the achievable shift, and occupants raised no objection at all to overnight timing being managed.
CLIENT PROFILE
A distribution network operator serving around two million domestic connections, facing local network constraints arising from heat pump and vehicle charging adoption across several urban areas. A previous consumption feedback programme had already produced disappointing results, and the regulator had questioned whether any further household investment could be justified in the next price control period.
STRATEGIC CHALLENGE
Customer engagement wanted to extend the feedback programme with better displays and a communications campaign. Network planning wanted reinforcement capital for the constrained areas instead. Nobody had compared automated load control against either option, or measured what shift was actually achievable in the affected streets rather than assumed across the whole customer base.
MMA APPROACH
MMA measured achievable load shift by street in the constrained areas, separating water heating, space conditioning and vehicle charging. We costed automated control against physical reinforcement for each constraint, and reviewed what evidence the regulator had accepted from comparable programmes elsewhere. Work drew on 47 expert interviews conducted in Q4 2025 with network operators, suppliers and regulatory specialists.
KEY FINDINGS
  1. Around 2 in 10 of peak load in the constrained streets was shiftable through automation without any occupant action being required at all.
  2. Automated control cost substantially less than physical cable reinforcement in four of the five constrained areas that were assessed during this work.
  3. The previous feedback programme had produced a sustained saving close to nothing once the initial novelty period had passed (client-reported, unverified by MMA).
  4. Vehicle charging alone accounted for the majority of the achievable shift, and occupants raised no objection at all to overnight timing being managed.
RECOMMENDED STRATEGY
Phase 1: Phase one: abandon the consumption feedback extension entirely, since two decades of evidence and the operator's own results both pointed the same way. Phase 2: Phase two: deploy automated control in the four constrained areas where it cost less than reinforcement, and reinforce only the fifth. Phase 3: Phase three: build the regulatory submission on measured load shift by street rather than on any assumed household engagement figure.
OUTCOME
The operator deployed automated load control in four areas and deferred reinforcement accordingly (client-reported, unverified by MMA). The regulatory submission was approved with the flexibility allowance intact. Load shift is now measured by street rather than assumed across the customer base, which is the change that outlasted the programme itself.

Frequently Asked Questions

Foundational context covering the market sizes, CAGR, scope, country, region and competition that inform every finding below. This section is provided to cover basics and most often pre-purchase conversations, answered from the MMA Primary Research Dataset.

What is the current size of the Smart Grid Home Area Network (HAN) Market?

Global value reaches USD 3.8 billion in 2026, measured as equipment and platform revenue across six function classes. The 2025 base is USD 3.4 billion.

How large will the Smart Grid Home Area Network (HAN) Market be by 2036?

The market reaches USD 12.4 billion by 2036, an increase of USD 8.6 billion across the forecast period. That represents 3.26 times expansion from the 2026 base.

What is the CAGR for the Smart Grid Home Area Network (HAN) Market 2026 to 2036?

The base case runs at 12.5% annually, with a bull case at 13.8% if flexibility markets open faster than legislated and a bear case at 11.3% if regulator scepticism about household programmes slows approvals.

Which segment is growing fastest?

Automated load control and flexibility devices grow at 18.8%, half again the market rate of 12.5%. A controllable load is worth something to a grid operator while a display is not.

Who are the major companies in the Smart Grid Home Area Network (HAN) Market?

Landis+Gyr, Itron, Schneider Electric, Siemens and Kamstrup lead on equipment and platform revenue, together holding 39%. Honeywell, Sagemcom and Wasion Group all hold smaller positions.

Which country is growing fastest?

India leads at 20.2%, on a metering programme installing communicating infrastructure at genuine national scale for the first time. Indonesia and Brazil follow behind it.

Report Segmentation Architecture

The full report scope spans multiple orthogonal segmentation dimensions, with cross-tabulated demand data provided for each dimension pair. Coverage extends further to regional breakdowns, trend trajectories, and the competitive detail needed to support segment-level decision-making.

By Function Class

  • Automated Load Control And Flexibility Devices
  • Electric Vehicle Charging Integration Equipment
  • Utility Demand Response Management Platforms
  • Communicating Thermostats And Heating Controls
  • Home Network Gateways And Communication Modules
  • In-Home Displays And Consumption Feedback Units

By End-Use Industry

  • Distribution Network Operators
  • Regulated Retail Energy Suppliers
  • Independent Flexibility Aggregators
  • Social Housing And Municipal Providers
  • New Build Residential Developers
  • Commercial Small Site Operators

By Commercial Dimension

  • Regulated Utility Procurement
  • Metering Programme Bundled Supply
  • Flexibility Market Participation Contracts
  • Retail Supplier Customer Programmes
  • Direct Consumer Retail Purchase
  • Housing Developer Specification

By Region

  • North America
  • Western Europe
  • East Asia
  • South Asia and Pacific
  • Latin America
  • Middle East and Africa
  • Eastern Europe

Scope, Methodology, and Coverage

Every figure in this report is reproducible from documented input assumptions. The scope below maps the historical period, the forecast horizon, the segmentation dimensions, and the countries covered, alongside the underlying primary and qualitative methodology.
Historical Period
2020 to 2025
Forecast Period
2026 to 2036
Base Year
2025 (USD billions; MMA Primary Research Dataset, September 2026)
Market Definition
This report covers smart grid home area network equipment and platforms by function class: automated load control and flexibility devices, in-home displays and consumption feedback units, communicating thermostats and heating controls, home network gateways and communication modules, electric vehicle charging integration equipment, and utility demand response management platforms. It excludes electricity meters themselves, distribution grid automation equipment, general home automation with no grid function, solar inverters and battery storage, and retail energy supply services.
Quantitative Units
USD millions, equipment and platform revenue basis; installed devices; shiftable peak load as a percentage; sustained consumption reduction as a percentage; utility funded share as a percentage; device service life in years.
Segmentation Dimensions
Function class; end-use operator type; commercial procurement and funding route; geography across seven regions.
Regions Covered
North America, Western Europe, East Asia, South Asia and Pacific, Latin America, Middle East and Africa, Eastern Europe
Countries Covered
China, Japan, South Korea, India, Indonesia, Australia, United States, Canada, Mexico, Brazil, Chile, Colombia, United Kingdom, Germany, France, Netherlands, Denmark, Poland, Saudi Arabia, South Africa.
Key Companies Profiled
Landis+Gyr, Itron, Schneider Electric, Siemens, Kamstrup, Honeywell, Sagemcom, Aclara Technologies, Wasion Group, Hexing Electrical, Trilliant, Ecobee, tado, Enel X, Uplight.
Quantitative Methodology
Primary survey, n=3,800 respondents, Q4 2025, six countries; demand-side model with trade association cross-validation
Qualitative Methodology
47 expert interviews, Q4 2025; applied to validate demand model assumptions, identify emerging dynamics, and assess competitive positioning
Report Format
PDF and XLSX data workbook (Word format preview document)
Publisher
Market Minds Advisory
Report Code
MMA-2026-ENE-851
Published
September 2026
Contact
sales@marketmindsadvisory.com | www.marketmindsadvisory.com

Purchase the full Smart Grid Home Area Network (HAN) Market Report (2026 to 2036).

This report sizes the global smart grid home area network market from 2026 to 2036 across six function classes, six operator types and seven regions. It explains why two decades of consumption feedback produced a lasting saving of roughly 2% while automation moves around 18% of household peak without any occupant action. Utility funding at around 81% of equipment is analysed as the reason regulated procurement cycles rather than consumer preference determine everything. Vehicle charging is examined as the load creating local constraints that finally make flexibility valuable. Regional analysis explains why East Asia leads at 30% of spending.
Six function classes sized through to 2036
Feedback and automation outcomes quantified against each other
Utility funding share assessed as the procurement determinant
Twenty named suppliers assessed on equipment revenue
Four revenue levers with quantified commercial impact
Anonymised network operator flexibility engagement documented in full

Built For The People Who Decide

From boardroom strategy to bench-side execution, this report is read cover-to-cover by leaders shaping the next decade of their industry, turning demand scenarios, market dynamics and valuation benchmarks into decisions.
CXOs/ Presidents/ VPs/ Managers
M&A and Corporate Development
Strategy Teams and R&D Heads
Procurement and Product Directors
Regulatory and Compliance Leaders
Investor Relations and Equity Analysts