Market Minds Advisory
Smart Education and Learning Market

Smart Education and Learning Market: Smart Education and Learning Market: Assessment Economics, Evidence Gaps and the Replacement Cliff, 2026 to 2036

Buyers here are not users and almost never purchase on evidence of learning, which is why products attached to a qualification renew reliably and products that merely promise better teaching do not.

Lead Analyst

Published

September 2026

Make Smarter Decisions with Customized Research Insights

Request a free sample report and evaluate market opportunities, growth trends, and competitive dynamics relevant to your business needs.

2025 MARKET VALUE$34.0BMarket Size 2025
2036 FORECAST VALUE$93.2BBase Case , 2026 to 2036
CAGR 2026 TO 20369.6 %Bull 10.8% / Bear 8.4%
INCREMENTAL OPPORTUNITY$55.9BNet 10- year value creation
EXPANSION MULTIPLE2.50x2036 value over 2026 base
Strategic Levers
M&A Pipeline
Regional Outlook
Country Rankings
Competitive Intelligence
Segmental Deep-dive
Call-Us : 91 93563 13602

Executive Snapshot and Market Trajectory.

Only 17% of purchases in this market are made against evidence of learning outcome. The buyer is a district, a ministry or a procurement office rather than a learner or a teacher, and the evidence base is thin enough that nobody is required to produce it. Nobody has to.
Where a purchase attaches to a qualification, that changes completely. Assessment, proctoring and credentialing grows at 14.4%, half again the market rate of 9.6%, and carries 38% of vendor revenue, because an examination result has value somebody will defend. Renewal rates for credentialing products run 31 points above products that only promise better learning, which is the single most useful number in this sector. Nothing else in this sector prices reliably.
Five providers hold 24% of measured vendor revenue, which makes this one of the most fragmented sectors anywhere. Generative models destroyed the unsupervised essay as an assessment instrument, pushing institutions back toward supervised and proctored settings. Meanwhile 68% of pandemic-era devices are reaching end of service against budgets that no longer exist. Districts face replacement they cannot fund and withdrawal from programmes that depend on the hardware.
Market Definition
The smart education and learning market covers technology products and digital services supplied to schools, universities, training providers and employers for instruction, administration and assessment, spanning interactive classroom hardware, learning management and administration platforms, digital content and courseware, adaptive and personalised learning systems, assessment with proctoring and credentialing, and workforce skilling platforms. Sizing is measured at vendor revenue. Tuition fees, teacher salaries, physical textbooks, general purpose computing devices and school infrastructure construction are excluded.
Base Year Value
$34.0B in 2025 (MMA Primary Research Dataset, September 2026)
Forecast Period
2026 to 2036, eleven discrete annual values
CAGR
9.6% base case. Bull 10.8%. Bear 8.4%.
Fastest Growth Segment
Assessment, Proctoring and Credentialing: 14.4% CAGR
Fastest Growth Country
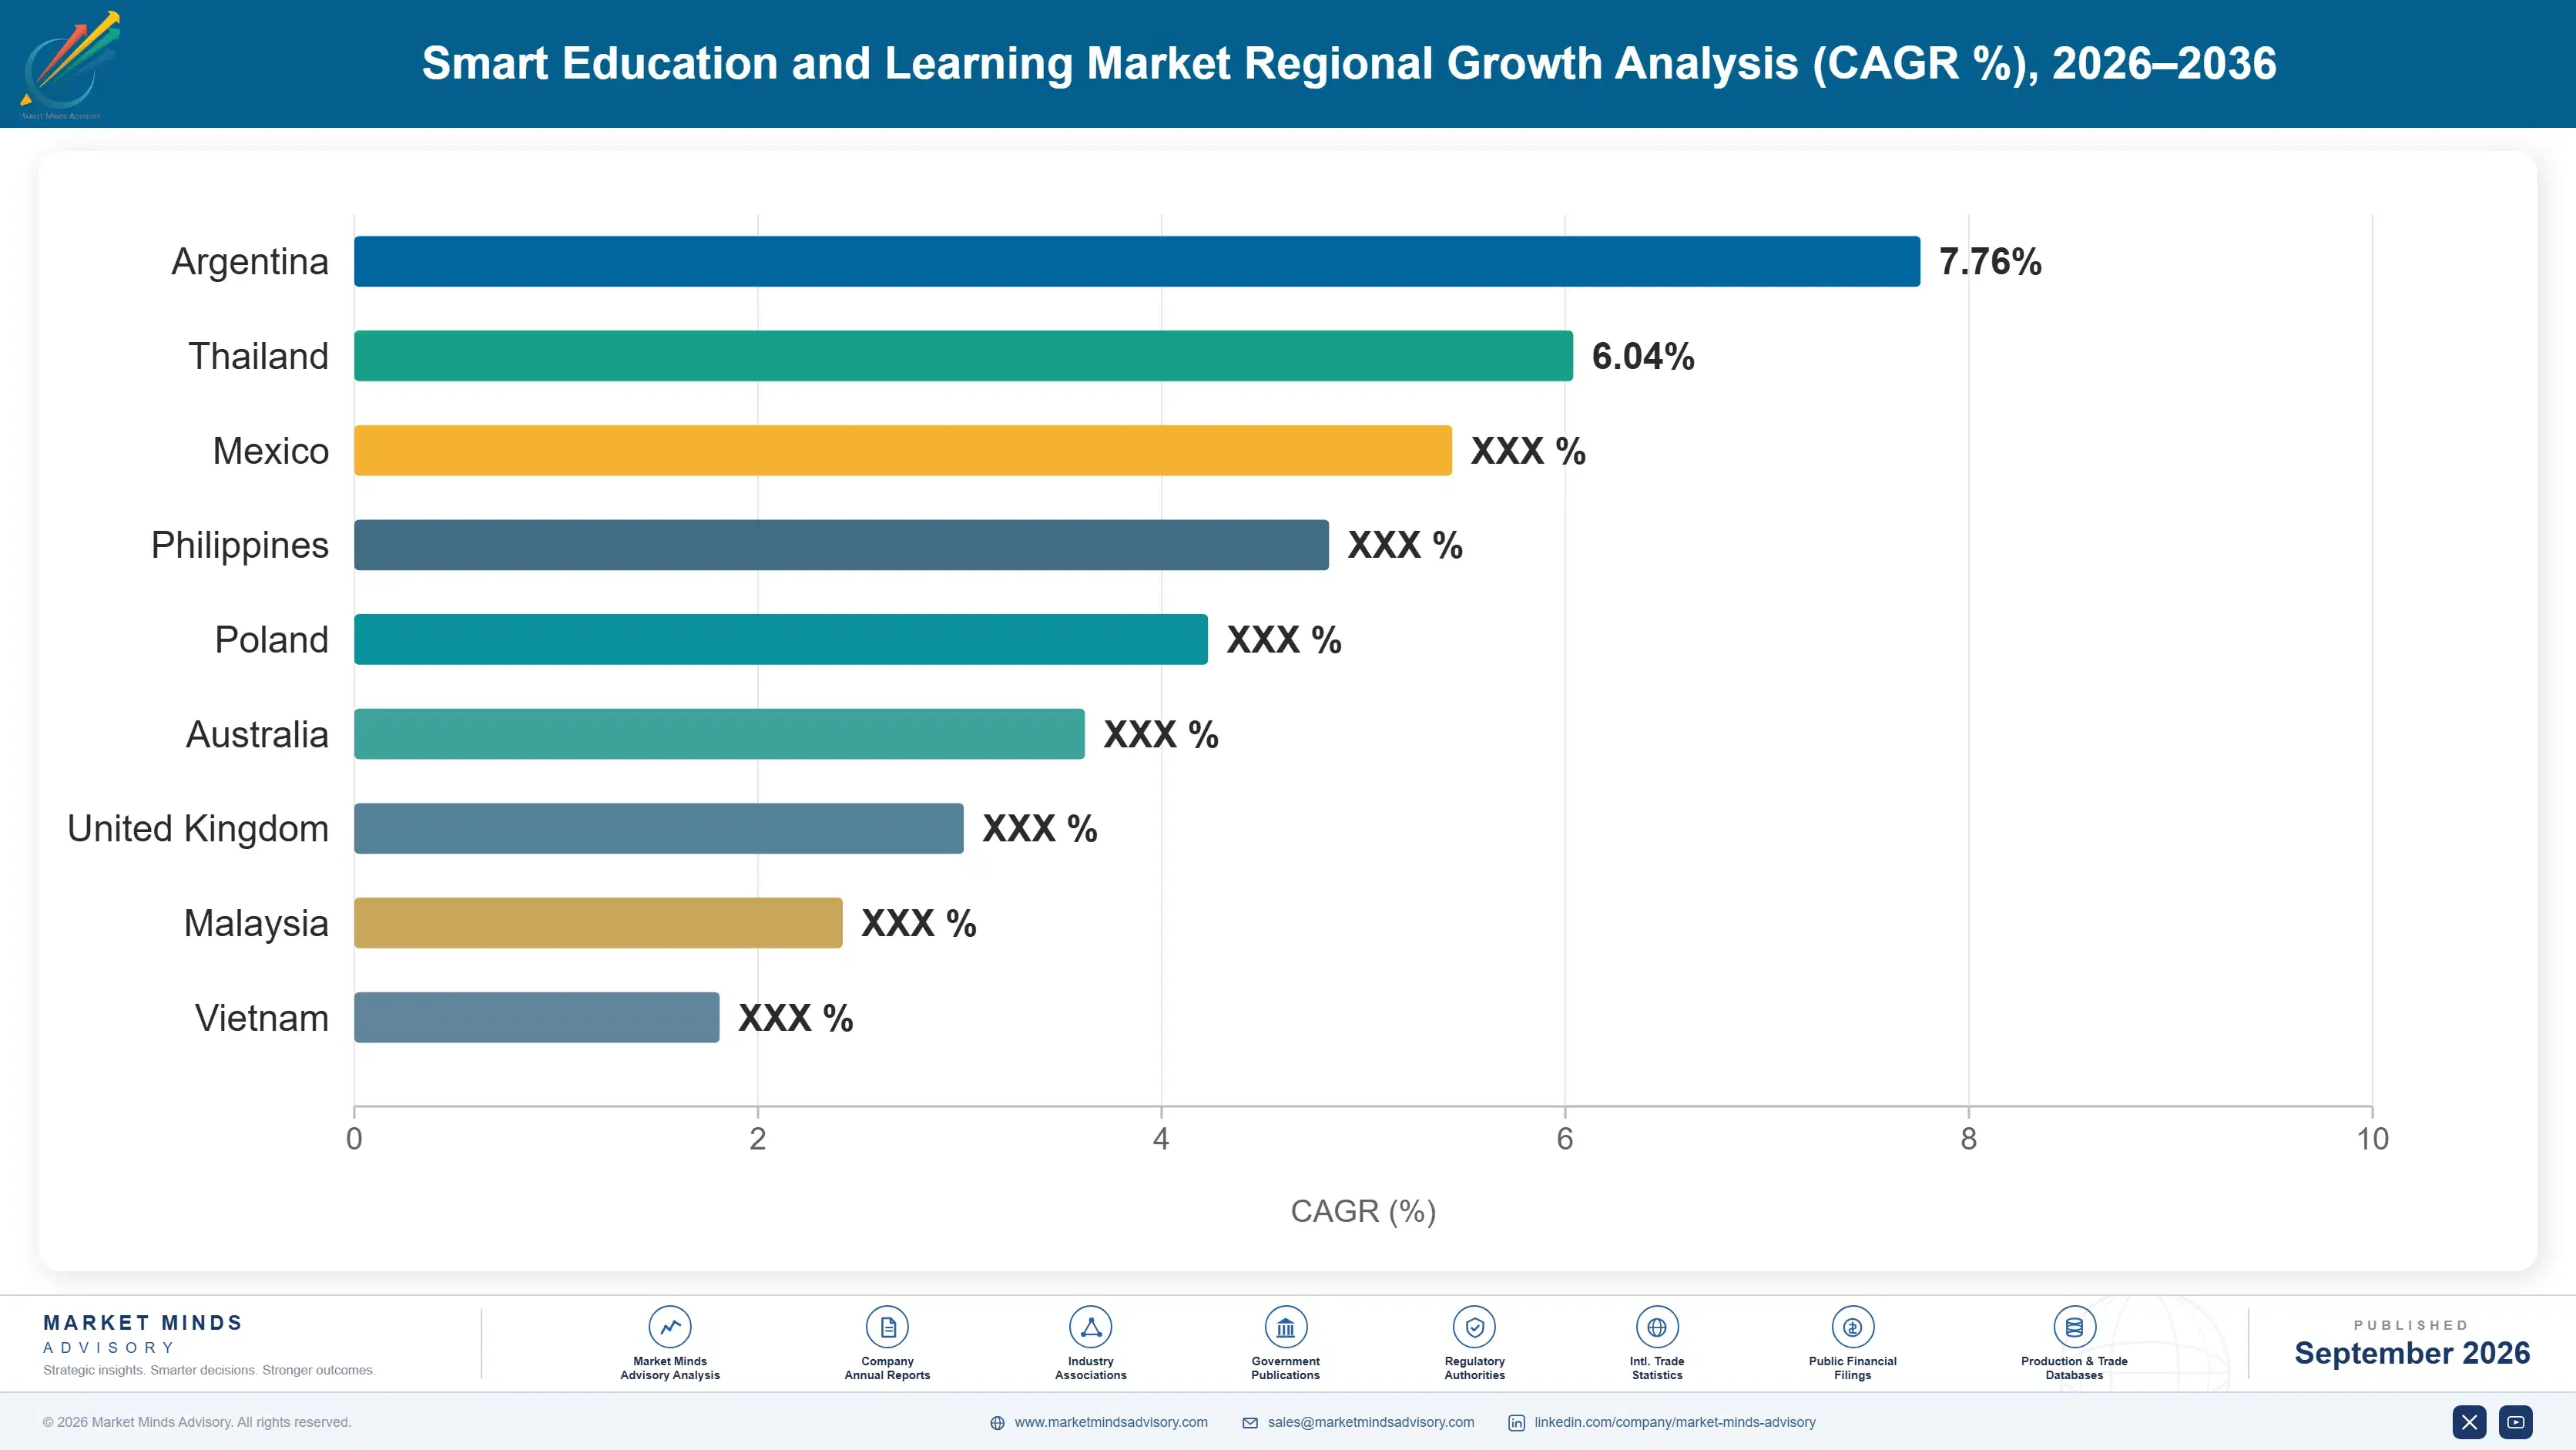
Indonesia: 15.6% CAGR
Fastest Growth Region
South Asia and Pacific: 12.0% CAGR
Largest Region
North America: 30% of 2025 global value
Market Leaders
Pearson, Instructure, PowerSchool, Anthology, Cengage Group. Source: MMA Analysis based on company annual reports and measured vendor revenue.
Primary Survey
n=3,800 procurement and R&D decision-makers, Q4 2025, six countries
Methodology
Demand-side build-up, cross-validated against public data, 47 expert interviews

Smart Education and Learning Market Forecast Scenarios

smart-education-learning-market-size-forecast-scenario-1788414407148
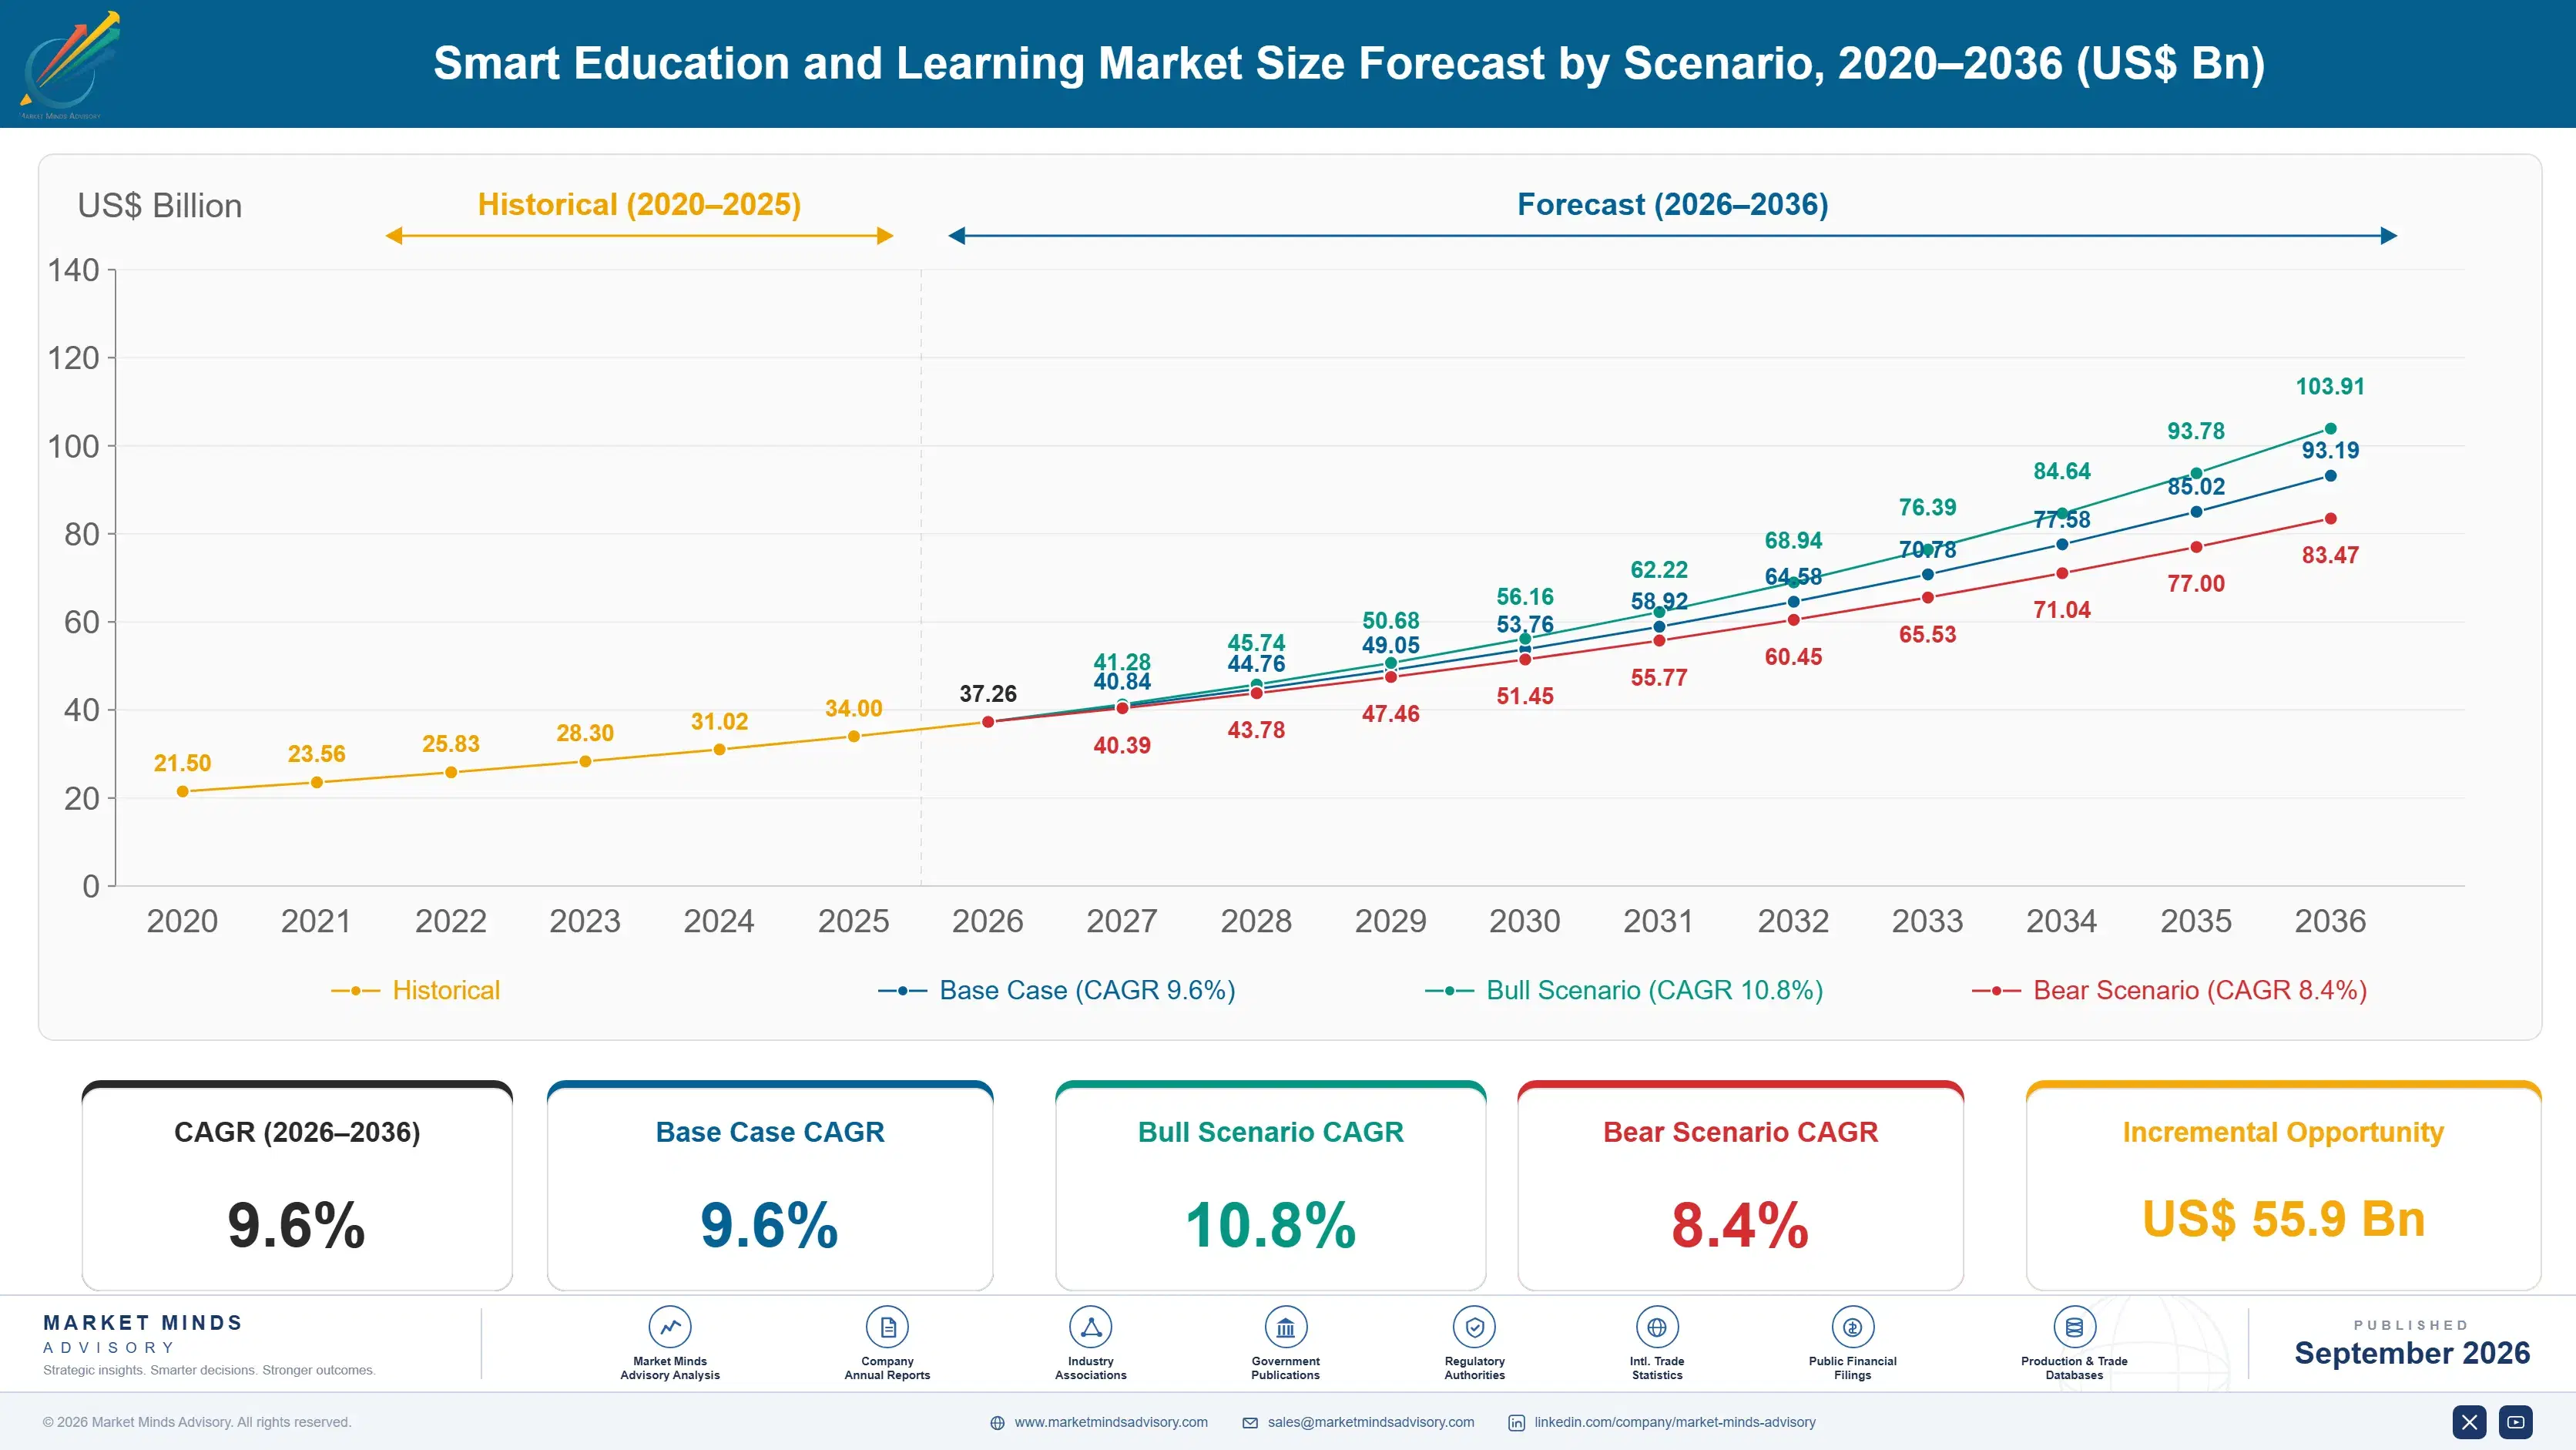
Between 2020 and 2025 the market compounded at 8.4%, and the number hides a violent cycle rather than steady growth. Emergency procurement during school closures produced spending on devices, platforms and content at rates nobody had planned for, under rules that suspended normal evaluation. What followed was equally sharp: unused licences were cancelled, several well-funded providers failed, and institutions became markedly more sceptical buyers.
The 9.6% base case rests on three commercial mechanisms. Assessment and credentialing demand is rising because generative models made unsupervised written work unusable as evidence of anything, which forces institutions toward supervised and authenticated alternatives. Workforce and vocational skilling grows because the buyer there is an employer with a measurable skills gap and a budget rather than an institution with neither. And developing market governments continue funding national digital education programmes on multi-year commitments.
The bull case is credentialing value extending further into workplace hiring, which would make verified assessment a purchase employers fund directly rather than institutions. The bear case is the device replacement cliff arriving alongside constrained public budgets, since 68% of pandemic-era hardware reaches end of service in a period when the emergency funding that bought it has entirely expired.

Why Qualifications Sell And Learning Claims Do Not

The buyer here is not the user and cannot easily judge the product. A district administrator, a ministry official or a university procurement office selects tools that teachers and students then use, and only 17% of those purchases rest on any demonstrated learning outcome. The evidence base is weak, comparisons are rare and nobody requires them, so procurement runs on features, references and price.
TOP FIVE CONCENTRATION24%Share of measured vendor revenue held by leading providers
EVIDENCE-BASED PURCHASE SHARE17%Portion of purchases made against demonstrated learning outcome evidence
DEVICE REPLACEMENT CLIFF68%Portion of pandemic-era devices reaching end of service
ASSESSMENT REVENUE SHARE38%Portion of vendor revenue from assessment and credentialing products
RENEWAL RATE GAP31 pointsDifference in renewal between credentialing and learning-only products
PUBLIC FUNDING DEPENDENCE72%Portion of institutional spend originating in public education budgets
Assessment behaves entirely differently, and the difference is instructive. An examination result, a certification or a credential has value somebody will defend, which makes its worth visible without any research literature. That segment carries 38% of vendor revenue and renews 31 points above products whose only claim is better learning. Every durable business in this sector is attached to something that certifies rather than something that teaches.
Two disruptions arrived together. Generative models made unsupervised written work useless as evidence of a student's ability, which pushed institutions back toward supervised examinations and proctored digital environments faster than anyone had planned. At the same time 68% of devices bought during school closures are reaching end of service, and the emergency funding that bought them has expired, leaving a replacement requirement with no budget attached.
"This sector has spent twenty years selling learning improvement to buyers who never once asked for the evidence, and the moment procurement tightened, most of it stopped renewing. What survived was attached to a qualification, because a qualification is the only thing here anybody can actually price."
Director, Education Technology and Workforce Skills Practice · MMA Technology and Education Practice · September 2026

Market Trends

Generative Models Ended The Unsupervised Written Assessment

An essay completed at home stopped being evidence of anything a student can do, and institutions recognised this far faster than they normally change anything. The immediate response was not adoption of artificial intelligence teaching tools but retreat toward supervised examinations, proctored digital environments, secure browsers and authenticated identity, all of which are purchases with a defensible rationale. Detection tools were tried and largely abandoned as unreliable and unfair. The commercial consequence is a segment growing at 14.4% against a market at 9.6%, funded by institutions with no alternative rather than by any enthusiasm for the technology.
Market Impact: Renews 31 points higher
The Pandemic Device Estate Reaches End Of Life Together

Devices, displays and network equipment bought during school closures were purchased within a compressed window, so they age out within a compressed window too, and roughly 68% reach end of service across the next few years. The emergency funding that paid for them has expired, and ordinary capital budgets were never sized for an estate that large. Districts face a choice between replacement they cannot afford and withdrawal from programmes that depend on the hardware. Vendors selling software into that estate face a licence base that shrinks with the devices underneath it.
Market Impact: Covers 5 million learners

Market Opportunities and Growth Drivers

Credentialing Value Makes Assessment Defensible Spending

A certification, licence or qualification has value that a learner, an employer or a regulator will defend, which makes assessment spending visible and justifiable in a way learning improvement never is. Renewal for credentialing products runs 31 points above products that only promise better teaching, and 38% of vendor revenue in this market already sits there. Professional licensing bodies, language proficiency testing and industry certification all buy on reliability and security rather than on price. This is the only part of the sector where a vendor holds genuine pricing power.
Market Impact: Leaves 83% of purchases unevidenced

Developing Market Governments Fund Multi-Year Programmes

National digital education programmes across Indonesia, India, Brazil and much of Africa are funded on multi-year commitments rather than annual budgets, which gives vendors visibility that developed market institutional selling rarely provides. Indonesia grows at 15.6%, the fastest of any country in this market, on curriculum reform combined with a substantial vocational push. Procurement runs through ministries at national scale, so a single award covers millions of learners. Local content requirements and language adaptation are conditions rather than preferences in most of these programmes. Local content and language adaptation are conditions rather than preferences.
Market Impact: Exposes 72% of institutional spend

Market Restraints and Challenges

Nobody Requires Evidence That Any Of It Works

Only 17% of purchases rest on demonstrated learning outcomes, and the research literature that does exist is thin, contested and rarely comparative between products. The root cause is that rigorous educational research is slow and expensive while procurement cycles are neither, so no buyer waits for evidence and no vendor is punished for lacking it. Commercial impact is a market where quality and revenue are only loosely connected, which suppresses investment in efficacy. Mitigation runs through independent evaluation frameworks, procurement standards requiring evidence tiers, and vendors publishing outcome data voluntarily to differentiate where competitors will not.
Market Impact: Grows at 14.4% annually

Public Budget Dependence Makes Demand Politically Fragile

Around 72% of institutional spend originates in public education budgets, which move with political priorities, election cycles and fiscal conditions rather than with any assessment of need. The root cause is that education is a public good funded through general taxation almost everywhere. Commercial impact arrived visibly when emergency pandemic funding expired and spending fell sharply across whole markets within a single year. Participants mitigate through geographic diversification, moving toward employer-funded workforce provision where the buyer is commercial, and pursuing multi-year national programmes that survive annual budget pressure. The exposure is permanent rather than cyclical.
Market Impact: Affects 68% of installed devices
4 additional market trends, 3 additional growth drivers, and 2 additional restraints and challenges are covered in the full report. Contact sales@marketmindsadvisory.com to access the complete intelligence.

Segment CAGR and Growth Architecture

Segmentation follows product function, which determines who buys, how the purchase is justified and whether it renews. Hardware, administration platforms, content, adaptive systems, assessment and workforce provision face entirely different buyers and evidence requirements, and the divergence in growth between them is now much wider than any average suggests. Averages conceal more than they reveal here.
smart-education-learning-market-market-share-analysis-1788414407684

Assessment, Proctoring and Credentialing

This is the only part of the sector where the product's value is visible without a research literature, because a qualification, certification or examination result is something a learner, employer or regulator will defend. It carries 38% of vendor revenue and renews 31 points above learning-only products. Generative models pushed demand further by making unsupervised written work useless as evidence, which drove institutions toward supervised examinations, proctored environments and authenticated identity rather faster than they would otherwise have moved. Growth at 14.4% is half again the market rate of 9.6%. Security and reliability rather than price decide these awards. Institutions here have no workable alternative to buying it. Enthusiasm plays no part in it.
CAGR 14.4%

Workforce and Vocational Skilling Platforms

The buyer here is an employer with a quantified skills shortage and a budget it controls, which makes it a completely different customer from a school district or a ministry. Evaluation rests on whether trainees can perform the work afterwards, renewal follows that assessment and pricing per learner runs several times institutional levels. Growth at 13.2% reflects employers funding provision directly rather than waiting for education systems to supply candidates. Content overlaps substantially with institutional material, so the same asset sells on entirely different terms depending who pays, and most vendors have not adjusted pricing to reflect that at all. Adjusting pricing to reflect who pays is the easiest gain available.
CAGR 13.2%
Full segment breakdown across 6 segments available in the complete report.

Regional Architecture and Country Demand Map

Demand follows public education budgets, national digital programmes and employer skills funding rather than learner numbers. North America leads on spend per learner and on the scale of its higher education and workforce markets rather than on population. Learner numbers alone mislead badly. Budgets decide almost everything.

North America

Spend per learner is the highest anywhere and the higher education and corporate learning markets are both the largest in the world, which together explain the regional position rather than any population advantage. District procurement remains the dominant route in schools and has become markedly more sceptical since emergency funding expired and unused licences were cancelled at scale. Assessment and proctoring demand rose sharply as universities retreated from unsupervised written work. The device replacement cliff lands hardest here, since the pandemic hardware wave was largest in this region and the funding behind it has entirely gone. Employer-funded workforce provision is the largest anywhere and grows on entirely different terms from the institutional business.
Share: 30% | CAGR: 8.6% (2026 to 2036)

East Asia

Chinese regulatory intervention in private tutoring in 2021 removed an enormous commercial sector almost overnight, and the market that remains is oriented toward public provision, vocational training and hardware rather than the consumer tutoring model that preceded it. Japanese and Korean institutions buy conservatively but consistently, with strong assessment and university admission testing demand. Interactive classroom hardware manufacturing is concentrated here and supplies the world. Regional growth of 10.2% reflects a market rebuilt on different foundations rather than one recovering to its previous shape. Hardware manufacturing rather than software or content carries a disproportionate share of what this region actually supplies to the world, and the tutoring collapse removed the consumer segment permanently.
Share: 22% | CAGR: 10.2% (2026 to 2036)
Regional intelligence for 5 additional markets available in the complete report: Western Europe, South Asia and Pacific, Latin America, Middle East and Africa, Eastern Europe. Contact sales@marketmindsadvisory.com.
smart-education-learning-market-country-cagr-analysis-1788414408205

Where Education Revenue Actually Holds

Four positions carry margin in a sector where the buyer cannot judge the product and rarely tries. Each involves attaching revenue to something with defensible value rather than to a claim about learning, which is the distinction separating the businesses that survived the funding correction from those that did not. The funding correction proved it.

Attach Every Product To A Qualification

Credentialing products renew 31 points above learning-only products and carry 38% of vendor revenue, because a qualification has value a learner, employer or regulator will defend without needing any research literature. Content that leads to a certificate sells on entirely different terms from identical content that does not. Building or acquiring credential authority is the single most valuable move available in this sector, and it is slow, which is exactly why the positions are worth holding. Vendors selling learning improvement alone are arguing a case nobody scores. Nobody scores a learning claim.
Market Impact: Renews a full 31 points above learning-only alternatives

Sell To Employers Rather Than Institutions

An employer with a quantified skills shortage holds a budget it controls, evaluates on whether trainees can do the work and pays roughly 3 times institutional rates per learner. The content is frequently identical to what institutions buy, which means most vendors are selling the same asset at a fraction of its value to the wrong customer. Workforce provision grows at 13.2% with far better renewal characteristics. Redirecting sales effort requires different people and a different proposition, and very few institutional vendors have made that change. Very few institutional vendors have actually made that change.
Market Impact: Earns 3 times institutional rates per learner enrolled

Publish Outcome Evidence Competitors Will Not

Only 17% of purchases rest on demonstrated outcomes, which means evidence is currently a differentiator rather than a requirement, and that will not remain true indefinitely as procurement standards tighten. A vendor publishing genuine comparative outcome data reaches buyers before the obligation arrives and shapes the standard that eventually applies. It also filters out competitors unwilling to be measured. The cost is real research spending against a market that has never demanded it, which is precisely why so few will do it. It also filters out competitors unwilling to be measured at all.
Market Impact: Differentiates against the 83% that hold no evidence

Pursue Multi-Year National Programme Awards Directly

Ministry programmes across developing markets commit funding across several years and reach millions of learners through single awards, which provides revenue visibility that annual institutional selling never delivers and insulates a vendor from the budget volatility affecting 72% of institutional spend. Localisation, local content and language adaptation are conditions rather than preferences on these awards. Winning one changes a vendor's scale entirely, and the qualification work has to be done years before any tender appears. Ministry relationships and curriculum alignment must exist before the tender is published. Winning one changes a vendor's scale entirely.
Market Impact: Covers up to 5 million learners per award

Who Controls the Margin Pool

Measured on vendor revenue, the basis used throughout this section, the top five hold 24%. That is extraordinarily fragmented for a market of this size, and it reflects education systems that procure nationally, regionally or institutionally with almost no cross-border standardisation. The gap between leaders and the rest is credential authority and assessment infrastructure rather than any difference in content or platform quality.
Competition runs on procurement relationships, credential recognition and increasingly on assessment security rather than on learning claims that no buyer verifies. Established publishers hold content libraries and examination franchises built over decades. Platform vendors compete on administrative integration with student information systems. Regional providers hold national markets through language, curriculum alignment and government relationships that international vendors find genuinely difficult to replicate.

Pressure comes from two directions. The device replacement cliff will shrink the installed base that software vendors license into, and no commercial response recovers a district that cannot afford hardware. And employer-funded workforce provision is growing faster than institutional demand, which favours vendors organised to sell commercially. Rankings shift where providers built credential authority and moved toward employer buyers rather than defending institutional accounts.
smart-education-learning-market-company-positioning-matrix-1788414408726

Competitive Moat and Risk Dimensions

PEARSON

Moat: Assessment and credential authority

Ownership of recognised qualifications, professional testing operations and examination delivery infrastructure gives the company revenue attached to credentials that learners, employers and regulators all defend, which is the only durable position in this sector. Assessment delivery at scale requires security and reliability infrastructure competitors cannot assemble quickly. Workforce certification extends the same authority to employer buyers directly.
PEARSON

Risk: Legacy content revenue decline

Traditional courseware and higher education content revenue continues to erode as institutions and students substitute cheaper or open alternatives, and that decline is not obviously reversible by any commercial action. Assessment growth has to outrun it continuously. Exposure to institutional budgets in developed markets leaves the company facing the same public funding pressure affecting the whole sector.
INSTRUCTURE

Moat: Administrative platform switching cost

A learning management platform integrated with student records, grading and institutional workflow becomes genuinely difficult to replace, since migration disrupts an academic year and involves every faculty member. That produces renewal rates far above anything content products achieve. Position inside the institutional workflow also gives distribution advantages for assessment and analytics capability sold alongside it.
INSTRUCTURE

Risk: Platform without credential value

The platform administers learning without certifying anything, which leaves it on the wrong side of the divide separating products that renew reliably from those that must justify themselves annually. Institutional budget pressure falls directly on exactly this kind of spending. Open source alternatives remain credible for institutions willing to carry the operational burden themselves.

Players Tracked

Prominent Players

Pearson
Instructure
PowerSchool
Anthology
Cengage Group

Other Key Players

McGraw Hill
Wiley
Coursera
Udemy
Docebo
D2L
Blackbaud
TAL Education Group
New Oriental Education
Kahoot
Duolingo
Meazure Learning
Promethean
BenQ
Sanoma

Recent Developments

JUNE 2025

University system returns to supervised examination for core assessment

A large university system moved core assessment back to supervised in-person and proctored digital examinations, a policy decision rather than any procurement transaction. Unsupervised written work was judged no longer capable of evidencing individual student capability under any detection regime available. Detection tools had been trialled and abandoned.
Signal: Institutions abandoned detection entirely and reverted to supervision, which is a purchase rather than a policy.
OCTOBER 2024

Assessment provider expands proctoring delivery capacity

An assessment and proctoring provider expanded delivery capacity across testing centres and remote supervision, an organic capacity expansion rather than any acquisition. Institutional demand following changes to assessment policy was cited as the driver rather than any growth in overall student numbers. Testing centre capacity was added too.
Signal: Capacity is being built for supervision rather than for teaching, which tells you where the money moved.
MARCH 2025

Emergency education funding obligations reach final expiry

Pandemic-era emergency education funding reached its final obligation and liquidation deadlines, ending a spending programme that had supported device, platform and content purchasing at unprecedented scale. Districts entered the following budget cycle without the resources that had funded those commitments. Districts entered the cycle without replacement funding.
Signal: The funding that created this installed base expired years before the hardware it bought wears out.

Content Development And Proctor Labour

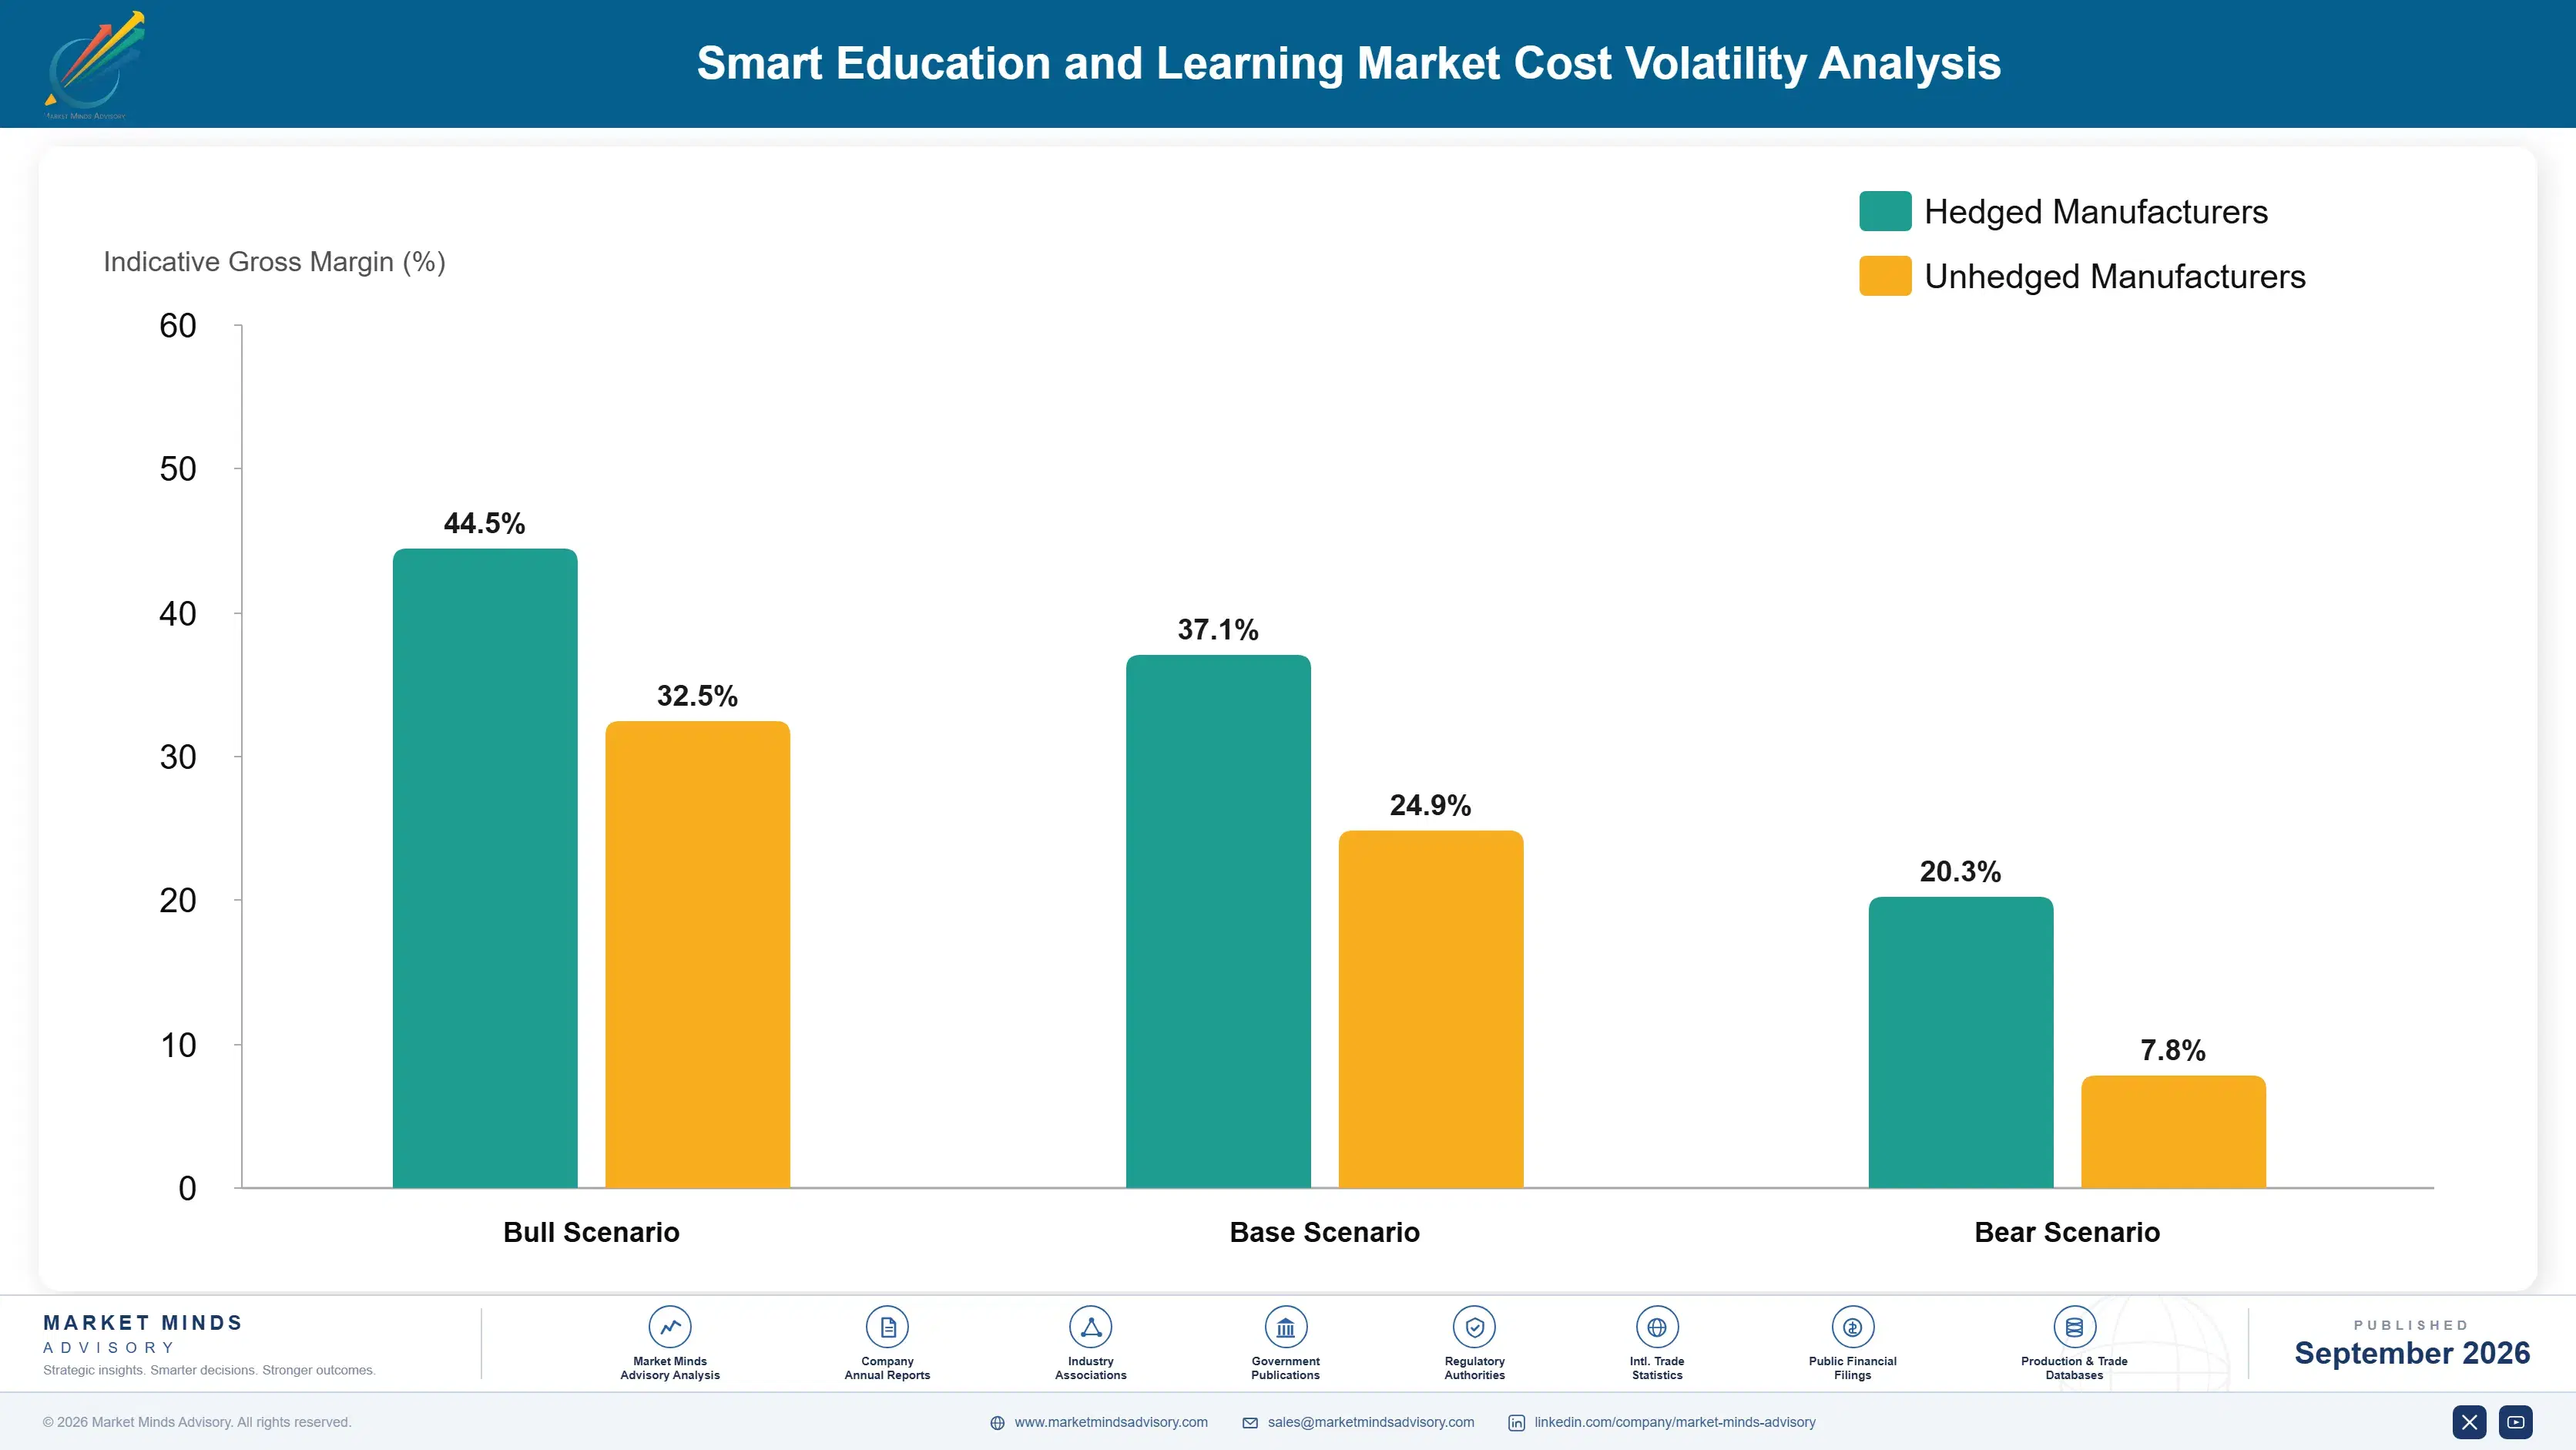
Content development and instructional design account for roughly 31% of vendor cost, platform engineering around 24%, assessment delivery including human proctor labour between 12 and 19%, and content royalties, hosting and overhead the balance. The proctoring component is unusual in a software market, since supervised assessment requires people watching candidates, and US Bureau of Labor Statistics data shows wages in comparable supervisory occupations rising steadily.
Instructional design and specialist authoring costs rose through the period as demand for assessment content grew and qualified item writers proved scarce, and several providers disclosed increased content investment in results covering those years. Proctor labour costs rose alongside as demand for supervised assessment recovered faster than the workforce that had dispersed during closures. Both pressures fell on the fastest growing part of the market.

The disadvantage mechanism is delivery model rather than scale. A provider delivering supervised assessment with human proctors carries labour cost that scales directly with volume, while one relying on secure browsers and authenticated identity does not, and the two positions diverge sharply as volume grows. Content royalties create a second asymmetry, since providers owning their content outright carry none while those licensing it carry a permanent margin deduction.
smart-education-learning-market-cost-volatility-analysis-1788414408923

Automated supervision reducing human proctor load

Secure browsers, identity authentication and automated flagging let one supervisor oversee far more candidates than direct observation permits, which changes how assessment delivery cost scales with volume. Institutions and regulators have to accept the approach as adequate, and acceptance varies considerably between jurisdictions and qualification types. Acceptance varies by qualification type and jurisdiction. Regulators decide, not vendors.

Owned content in place of licensed material

Developing content outright rather than licensing it removes a permanent royalty deduction that compounds across every unit sold, and it takes years and considerable investment to build. Providers that made that investment during earlier cycles hold a margin advantage competitors cannot close through any operational improvement at all. No operational improvement closes that gap afterwards.

Item bank reuse across qualifications and markets

Assessment items are expensive to author and validate, and reusing them across qualifications, languages and jurisdictions spreads that cost considerably further. It requires disciplined item banking and psychometric governance that many providers never established, which leaves them re-authoring material they already own somewhere. Providers without proper item banking end up re-authoring material they already own somewhere else.

Portfolio Architecture for Margin Defence

Margin separates by whether the product certifies or merely teaches. Assessment and credentialing carry pricing power because the output has defensible value, and they renew 31 points above alternatives. Content and platform products must justify themselves annually against a budget under pressure, with no evidence requirement to protect them and open or cheaper substitutes always available. The two halves of this market behave like different industries.
The volume against premium tension runs through the institutional relationship. Platform and content revenue keeps a vendor present inside the institution, which is how assessment and credentialing opportunities surface, so abandoning it forfeits the access. But those products carry the budget risk and the poor renewals. Vendors treating platform revenue as a distribution cost rather than a profit centre are reading the position correctly, and most do not.

High-value pools sit where somebody outside the institution values the output: professional certification, licensing examinations, language proficiency testing and employer-funded vocational credentials. Each is defended by recognition that takes decades to build and cannot be bought quickly. The pools are narrow against total sector revenue and carry a disproportionate share of the profit.

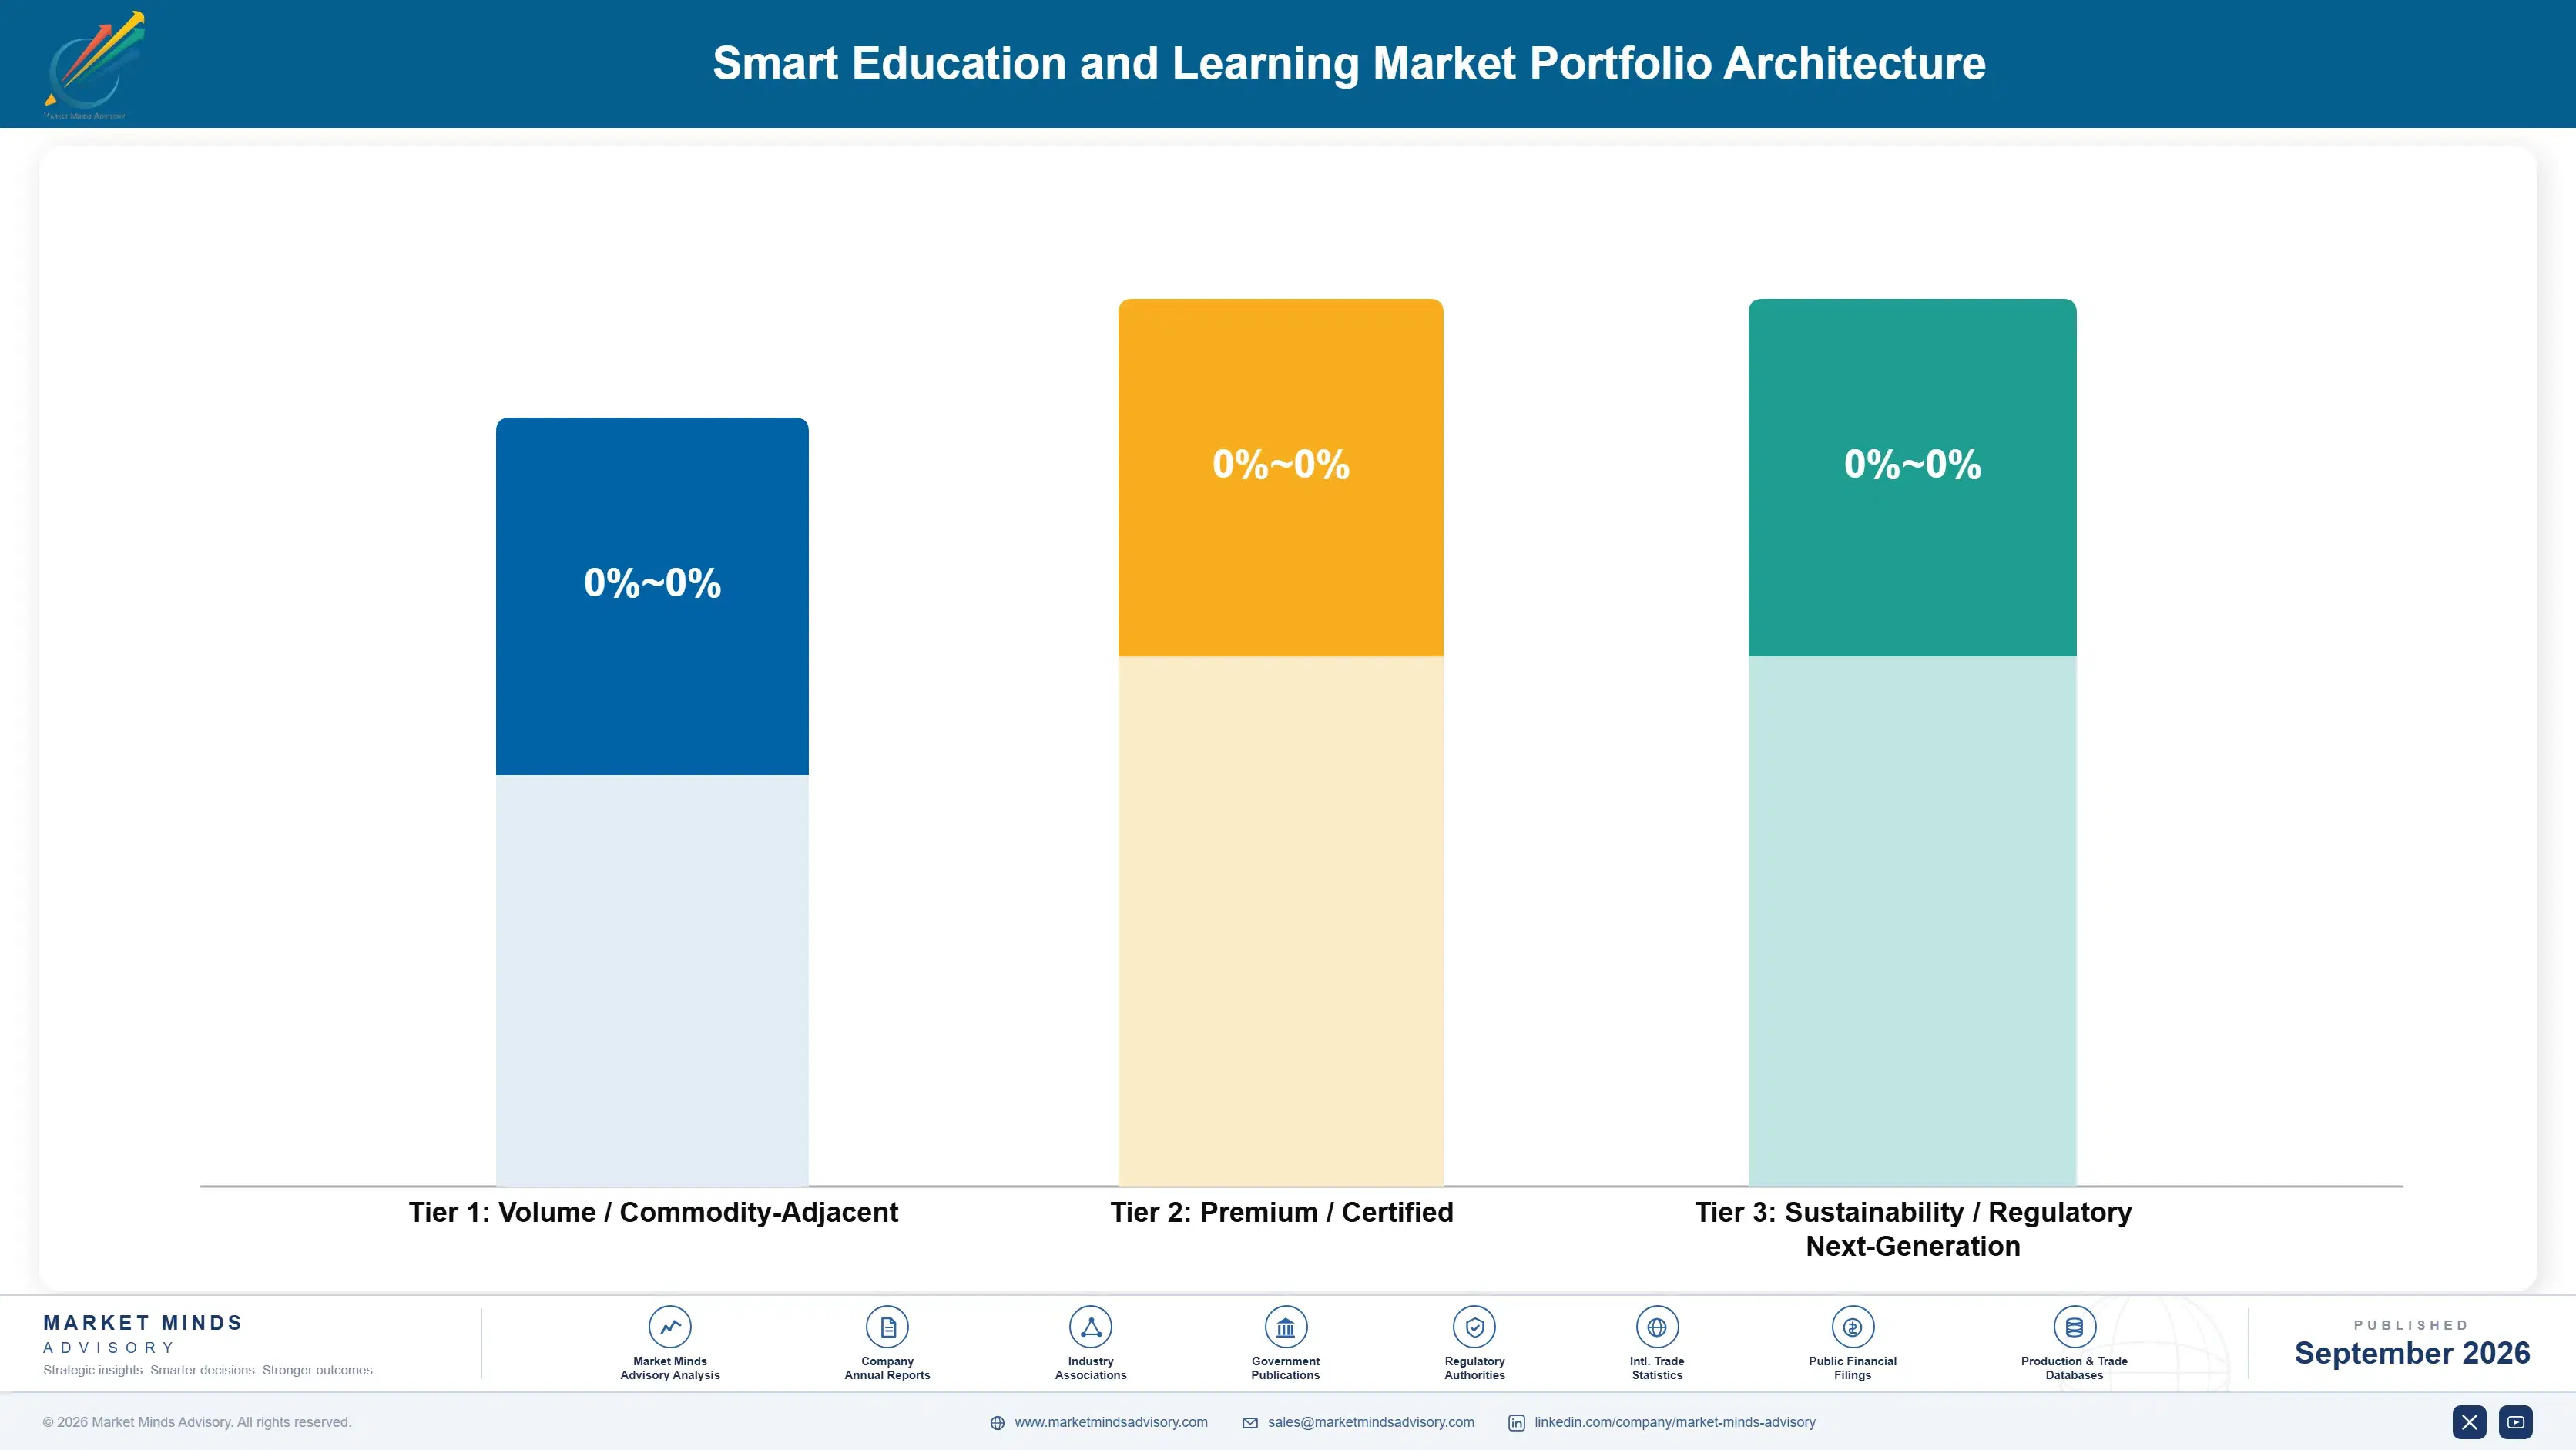
Volume / Commodity-Adjacent

Interactive classroom hardware, general digital content and administration platforms sold into institutional budgets on price and features. Renewal depends on budget rather than value, and the device replacement cliff shrinks the licensable base underneath it.
Gross Margin: 26 to 36%

Premium / Certified

Adaptive learning systems and vocational skilling platforms sold where an outcome is at least partly measurable. The 12 point range reflects whether the buyer is an employer evaluating capability or an institution evaluating features.
Gross Margin: 44 to 56%

Sustainability / Regulatory / Next-Generation

Assessment delivery, proctoring, professional certification and licensing examinations where the credential itself carries defensible value. The 16 point range reflects how completely recognition rather than product quality determines pricing power.
Gross Margin: 54 to 70%
smart-education-learning-market-portfolio-architecture-1788414409430

High-value Sub-segments and Strategic Watch-out

Professional Certification And Licensing

Highest value position in the sector, defended by recognition that takes decades to build and cannot be purchased quickly by any competitor. Learners, employers and regulators all defend the value of the output independently. Nothing else in this entire sector holds anything like comparable pricing power.
Gross Margin: 58 to 70%

Employer-Funded Vocational Credentials

Growing at 13.2% with a commercial buyer who quantifies the skills gap, controls the budget and pays roughly three times institutional rates. Most vendors sell identical content to this buyer at institutional pricing without noticing. Adjusting pricing to reflect the buyer is the easiest gain available.
Gross Margin: 48 to 60%

Institutional Platform Subscriptions

Sticky through switching cost rather than through demonstrated value, and exposed directly to the 72% of institutional spend originating in public budgets. Best understood as distribution access rather than as a profit centre in its own right. Switching cost rather than value keeps it in place.
Gross Margin: 40 to 52%

Classroom Hardware And Displays

Facing a replacement cliff as 68% of pandemic-era estate ages out against funding that has entirely expired. Revenue continues where budgets exist, but no vendor should be building a growth plan on this segment now. Any software licensed onto that estate shrinks along with it.
Gross Margin: 18 to 28%

Who Pays And What They Buy

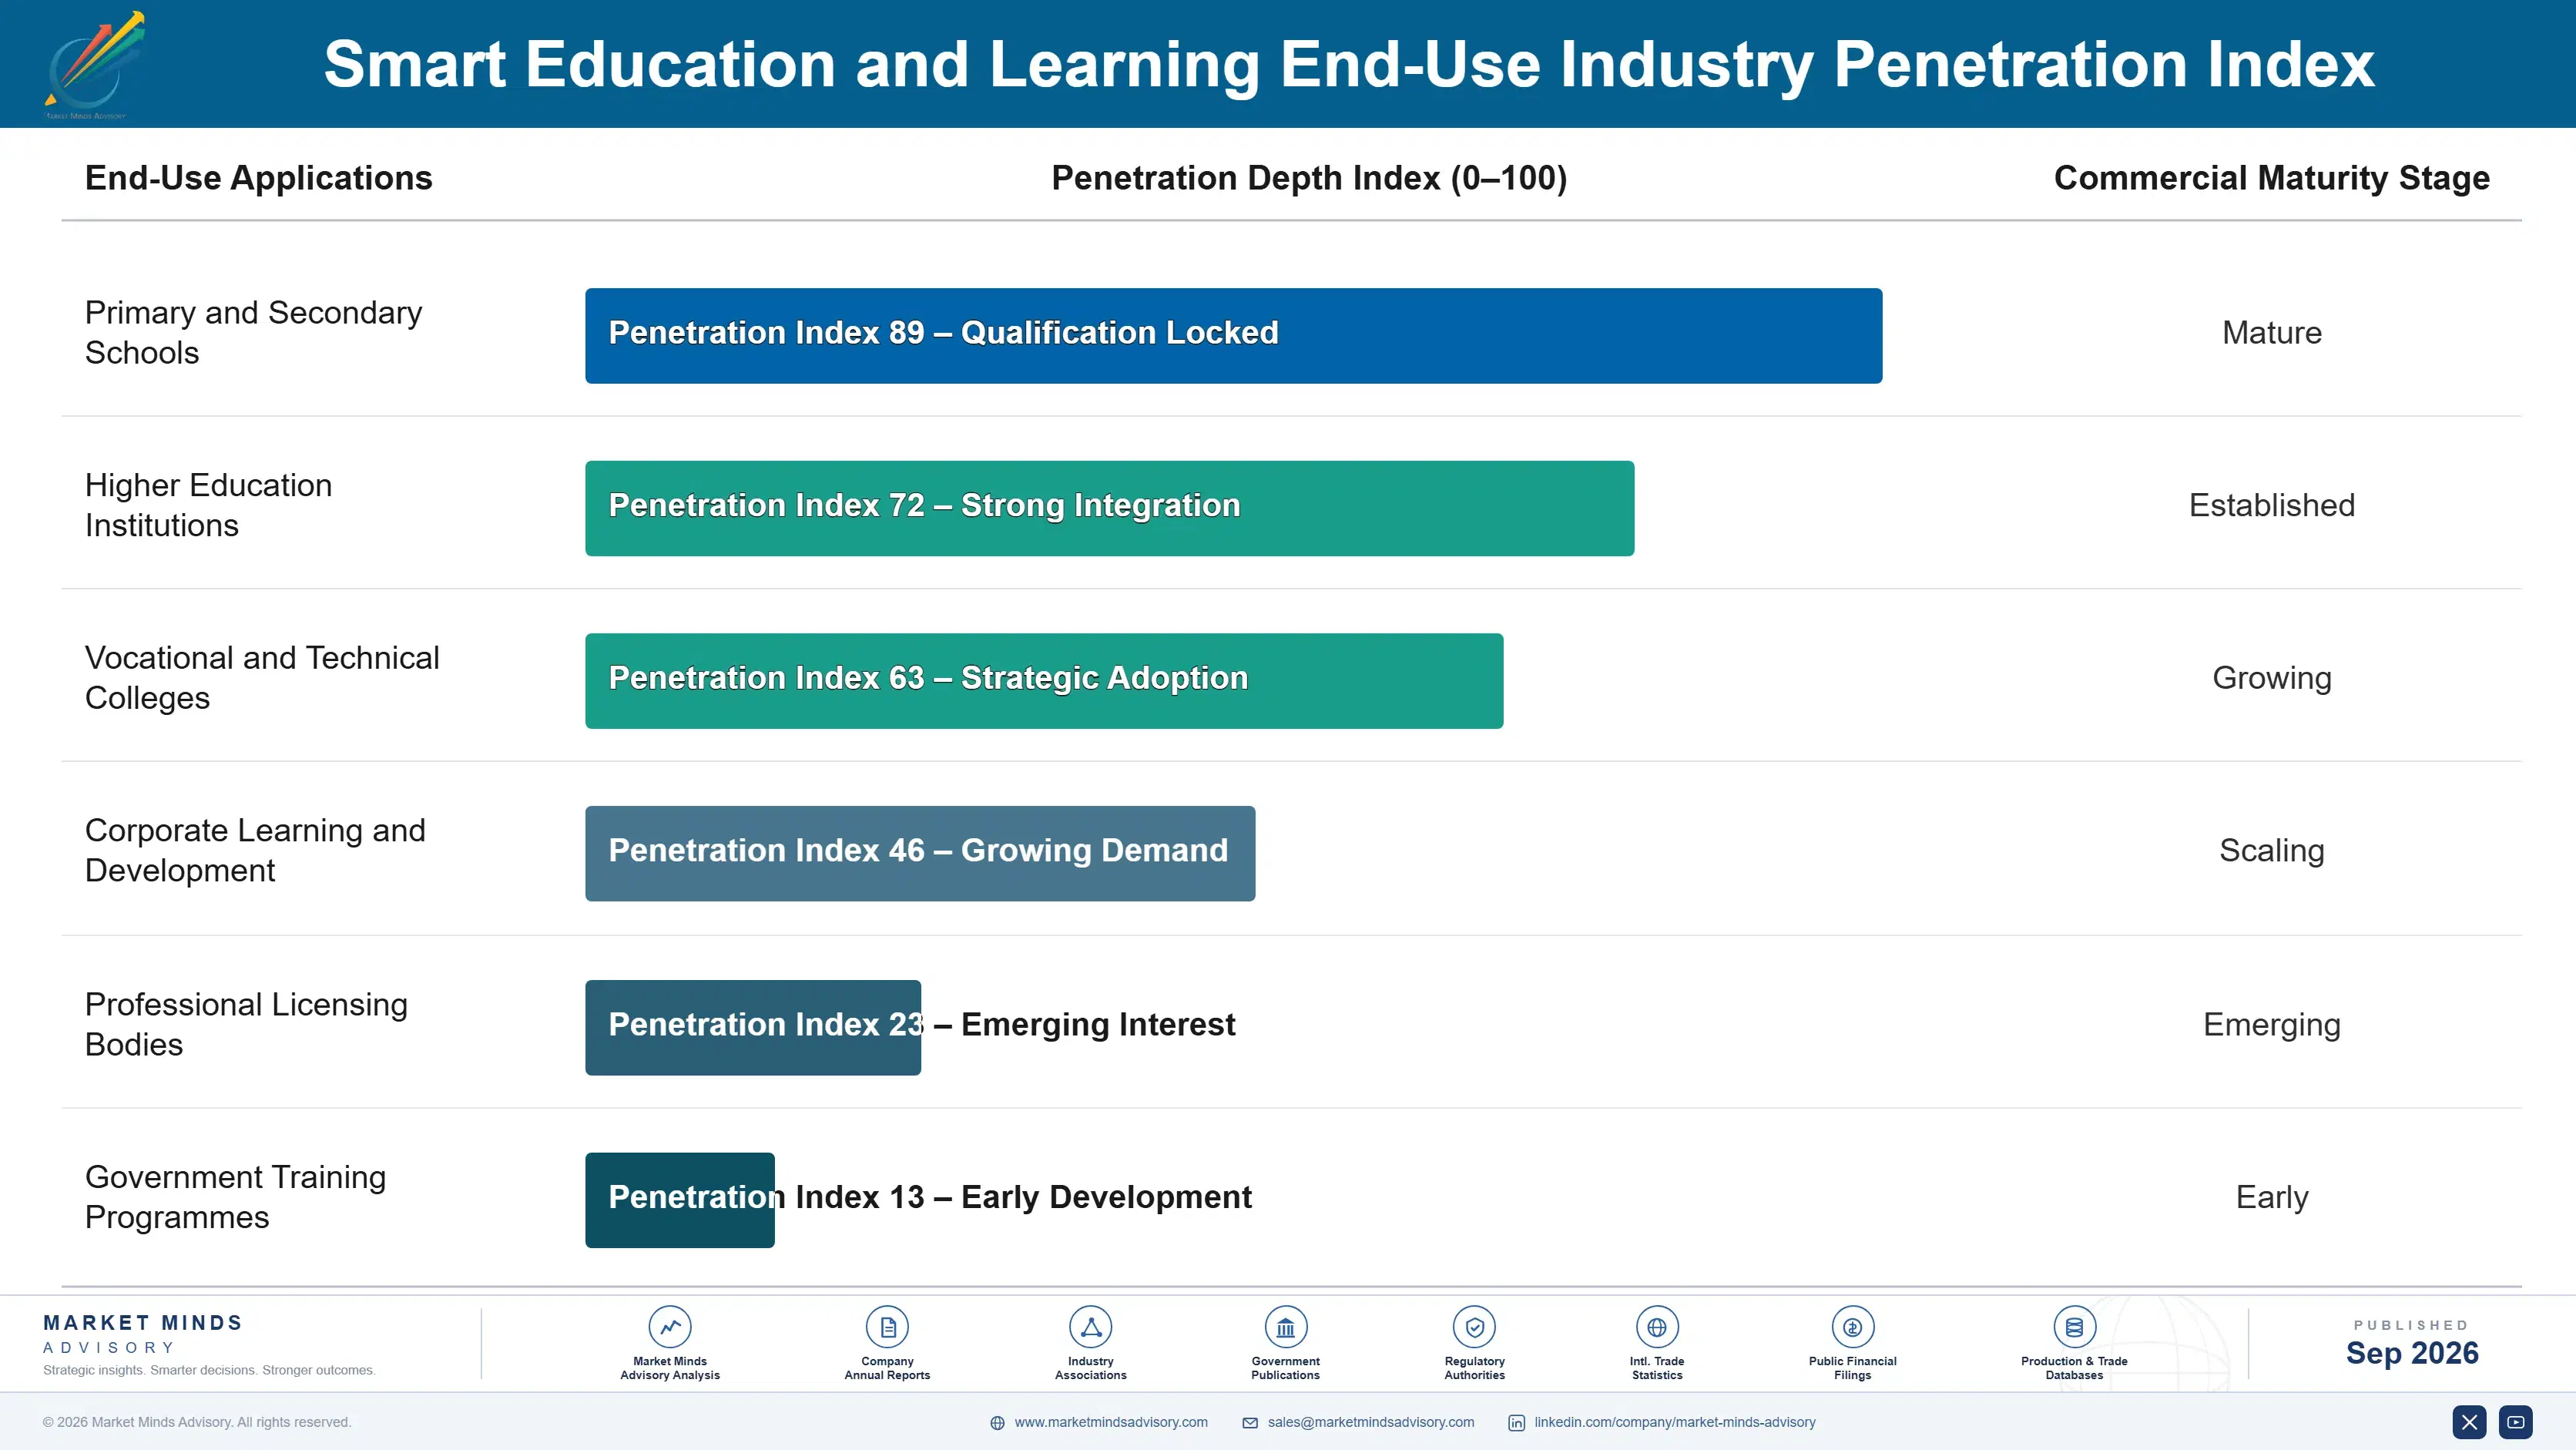
Annuity economics divide sharply along the certification line. A credential with recognition generates candidate volume year after year without any selling, because learners come to the qualification rather than the reverse. A platform subscription renews because switching disrupts an academic year, which is durable but different, and a content licence renews only while a budget permits. Vendors describe all three as recurring revenue and they are not comparable.
Adoption depth varies enormously by buyer type. Employers specify against a capability requirement, measure whether it was met and renew accordingly, which makes them demanding and reliable customers. Universities adopt deeply where accreditation or assessment integrity is involved and shallowly elsewhere. School districts adopt whatever a funding programme paid for and abandon it when the programme ends, which is the pattern that produced the post-pandemic contraction.

The buyer profile has shifted in one clear direction. Purchasing sat with technology and curriculum offices buying tools they hoped would improve teaching. It now sits with assessment and quality functions protecting qualification integrity, and with employers buying capability they can measure. Both ask questions the sector spent twenty years not answering, and vendors selling learning improvement alone address a buyer who has stopped purchasing.
smart-education-learning-market-end-use-penetration-index-1788414409918

Where Providers Should Compete

These are among the four positions where our research anticipates prominent divergence between winners and laggards over the coming forecast period. Each is grounded in the demand model, the regulatory perimeter, and the announced capacity pipeline.
01 / CREDENTIAL ATTACHMENT PRIORITY

Attach revenue to a qualification or accept commodity pricing

Credentialing products renew 31 points above learning-only products and and already carry 38% of all vendor revenue, because a qualification has value that learners, employers and regulators all defend without any research literature being required of anyone. Identical content sells on entirely different terms depending on whether it actually leads to a certificate at the end. Building or acquiring credential authority is slow, which is precisely why the positions that exist are worth so much to whoever happens already to hold them.
02 / EMPLOYER CHANNEL SHIFT

Sell capability to employers, not tools to institutions

An employer facing a quantified skills shortage controls its own budget, evaluates on whether trainees can perform the work and pays roughly three times institutional rates for content that is very frequently identical to it. Workforce provision grows at 13.2% with far better renewal characteristics than any institutional selling has ever produced. Redirecting requires different salespeople and a genuinely different proposition, which is why so few institutional vendors have actually made the change rather than merely announcing that they will.
03 / EVIDENCE PUBLICATION TIMING

Publish outcome data before procurement starts demanding it

Only 17% of purchases currently rest on demonstrated learning outcomes, which makes published evidence a differentiator today rather than any obligation, and that will not stay true as procurement standards tighten across all the major markets. A provider that publishes genuine comparative outcome data reaches buyers early and then helps shape the standard that eventually eventually applies to everybody else too. The cost is genuine and sustained research spending against a market that has never once demanded it of anyone.
04 / BUDGET EXPOSURE MANAGEMENT

Diversify away from single-cycle public education budgets

Roughly 72% of institutional spend originates in public education budgets that move with political priorities and fiscal cycles rather than with any real assessment of educational need, as the post-pandemic contraction demonstrated across entire national markets within a single budget year. Multi-year national programmes and employer-funded provision both behave quite differently from that, and both survive annual budget pressure far better. Vendors concentrated entirely in single-cycle institutional purchasing are carrying a risk they persist in describing as an entirely temporary condition.

Engagement Snapshot From the Field

A live engagement with an industry participant carrying material or product regulatory and market exposure ahead of a defining policy shift, showing how our research translates into a defensible multi-year portfolio strategy.
MARKET MINDS ADVISORY · CLIENT ENGAGEMENT SUMMARY
Smart Education and Learning Producer Strategic Portfolio Review and Transition Roadmap 2026·Investment Scenario on Smart Education and Learning Exposure Evaluation 2025-26
CLIENT PROFILE
A European education technology provider serving schools and universities across seven national markets, with annual revenue reported at approximately USD 410 million (client-reported, unverified by MMA). The portfolio was weighted toward learning platforms and digital content sold into public education budgets, with a small assessment business the group had acquired several years earlier and never integrated.
STRATEGIC CHALLENGE
Platform and content renewals had deteriorated sharply as emergency funding expired, while the small assessment business was growing strongly and constrained only by capacity. Management could not decide whether to defend the core portfolio, invest behind assessment, or attempt both with the resources available to the group. Nobody had quantified either side.
MMA APPROACH
MMA measured renewal rates by product type across the client's whole base, established which revenue was attached to a recognised qualification and which was not, and benchmarked pricing per learner between institutional and employer-funded channels for substantially identical content. Public budget exposure was mapped by national market. Renewal data was examined by product line.
KEY FINDINGS
  1. Products attached to a recognised qualification renewed 31 points above the rest of the portfolio, and the gap held consistently across every one of the seven national markets examined.
  2. Roughly 72% of group revenue depended on public education budgets in markets where those budgets had already contracted or were scheduled to contract further.
  3. Employers were paying around three times the client's institutional rate for vocational content that substantially overlapped material already in the catalogue and required little adaptation.
  4. The neglected assessment business had the highest margin in the group and had been capacity constrained for two years without anyone escalating the investment case.
CLIENT PROFILE
A European education technology provider serving schools and universities across seven national markets, with annual revenue reported at approximately USD 410 million (client-reported, unverified by MMA). The portfolio was weighted toward learning platforms and digital content sold into public education budgets, with a small assessment business the group had acquired several years earlier and never integrated.
STRATEGIC CHALLENGE
Platform and content renewals had deteriorated sharply as emergency funding expired, while the small assessment business was growing strongly and constrained only by capacity. Management could not decide whether to defend the core portfolio, invest behind assessment, or attempt both with the resources available to the group. Nobody had quantified either side.
MMA APPROACH
MMA measured renewal rates by product type across the client's whole base, established which revenue was attached to a recognised qualification and which was not, and benchmarked pricing per learner between institutional and employer-funded channels for substantially identical content. Public budget exposure was mapped by national market. Renewal data was examined by product line.
KEY FINDINGS
  1. Products attached to a recognised qualification renewed 31 points above the rest of the portfolio, and the gap held consistently across every one of the seven national markets examined.
  2. Roughly 72% of group revenue depended on public education budgets in markets where those budgets had already contracted or were scheduled to contract further.
  3. Employers were paying around three times the client's institutional rate for vocational content that substantially overlapped material already in the catalogue and required little adaptation.
  4. The neglected assessment business had the highest margin in the group and had been capacity constrained for two years without anyone escalating the investment case.
RECOMMENDED STRATEGY
Phase 1: Phase one: fund assessment capacity expansion immediately from platform cash generation rather than waiting for the next annual planning cycle. Phase 2: Phase two: repackage existing vocational content for employer buyers at employer pricing and build a commercial sales capability to reach them. Phase 3: Phase three: manage the platform and content portfolio for cash and institutional access rather than for growth, and stop funding development there.
OUTCOME
Within thirteen months the client had doubled assessment delivery capacity, launched an employer-funded vocational offer in two markets, and reported group gross margin up 5.6 percentage points despite flat revenue (client-reported, unverified by MMA). Platform development spending was reduced and redirected toward assessment capacity accordingly.

Frequently Asked Questions

Foundational context covering the market sizes, CAGR, scope, country, region and competition that inform every finding below. This section is provided to cover basics and most often pre-purchase conversations, answered from the MMA Primary Research Dataset.

What is the current size of the Smart Education and Learning Market?

The market was valued at USD 34.0 billion in 2025 and reaches USD 37.26 billion in 2026. Assessment and credentialing carry a disproportionate share of the durable revenue.

How large will the Smart Education and Learning Market be by 2036?

MMA forecasts USD 93.17 billion by 2036, an increase of USD 55.91 billion over the 2026 base. That represents an expansion multiple of 2.50 times.

What is the CAGR for the Smart Education and Learning Market 2026 to 2036?

The base case CAGR is 9.6%, with a bull case of 10.8% and a bear case of 8.4%. The historical rate between 2020 and 2025 was 8.4%.

Which segment is growing fastest?

Assessment, proctoring and credentialing grows at 14.4%, half again the market rate of 9.6%. A qualification has value somebody will defend, unlike a claim about learning.

Who are the major companies in the Smart Education and Learning Market?

Pearson, Instructure, PowerSchool, Anthology and Cengage Group lead on measured vendor revenue. Together they account for roughly 24% of an unusually fragmented global market today.

Which country is growing fastest?

Indonesia grows fastest at 15.6%, on national curriculum reform combined with a substantial vocational skilling push funded through multi-year ministry commitments rather than annual budgets.

Report Segmentation Architecture

The full report scope spans multiple orthogonal segmentation dimensions, with cross-tabulated demand data provided for each dimension pair. Coverage extends further to regional breakdowns, trend trajectories, and the competitive detail needed to support segment-level decision-making.

By Product Function

  • Interactive Classroom Hardware
  • Learning Management and Administration Platforms
  • Digital Content and Courseware
  • Adaptive and Personalised Learning Systems
  • Assessment, Proctoring and Credentialing
  • Workforce and Vocational Skilling Platforms

By End-Use Industry

  • Primary and Secondary Schools
  • Higher Education Institutions
  • Vocational and Technical Colleges
  • Corporate Learning and Development
  • Professional Licensing Bodies
  • Government Training Programmes

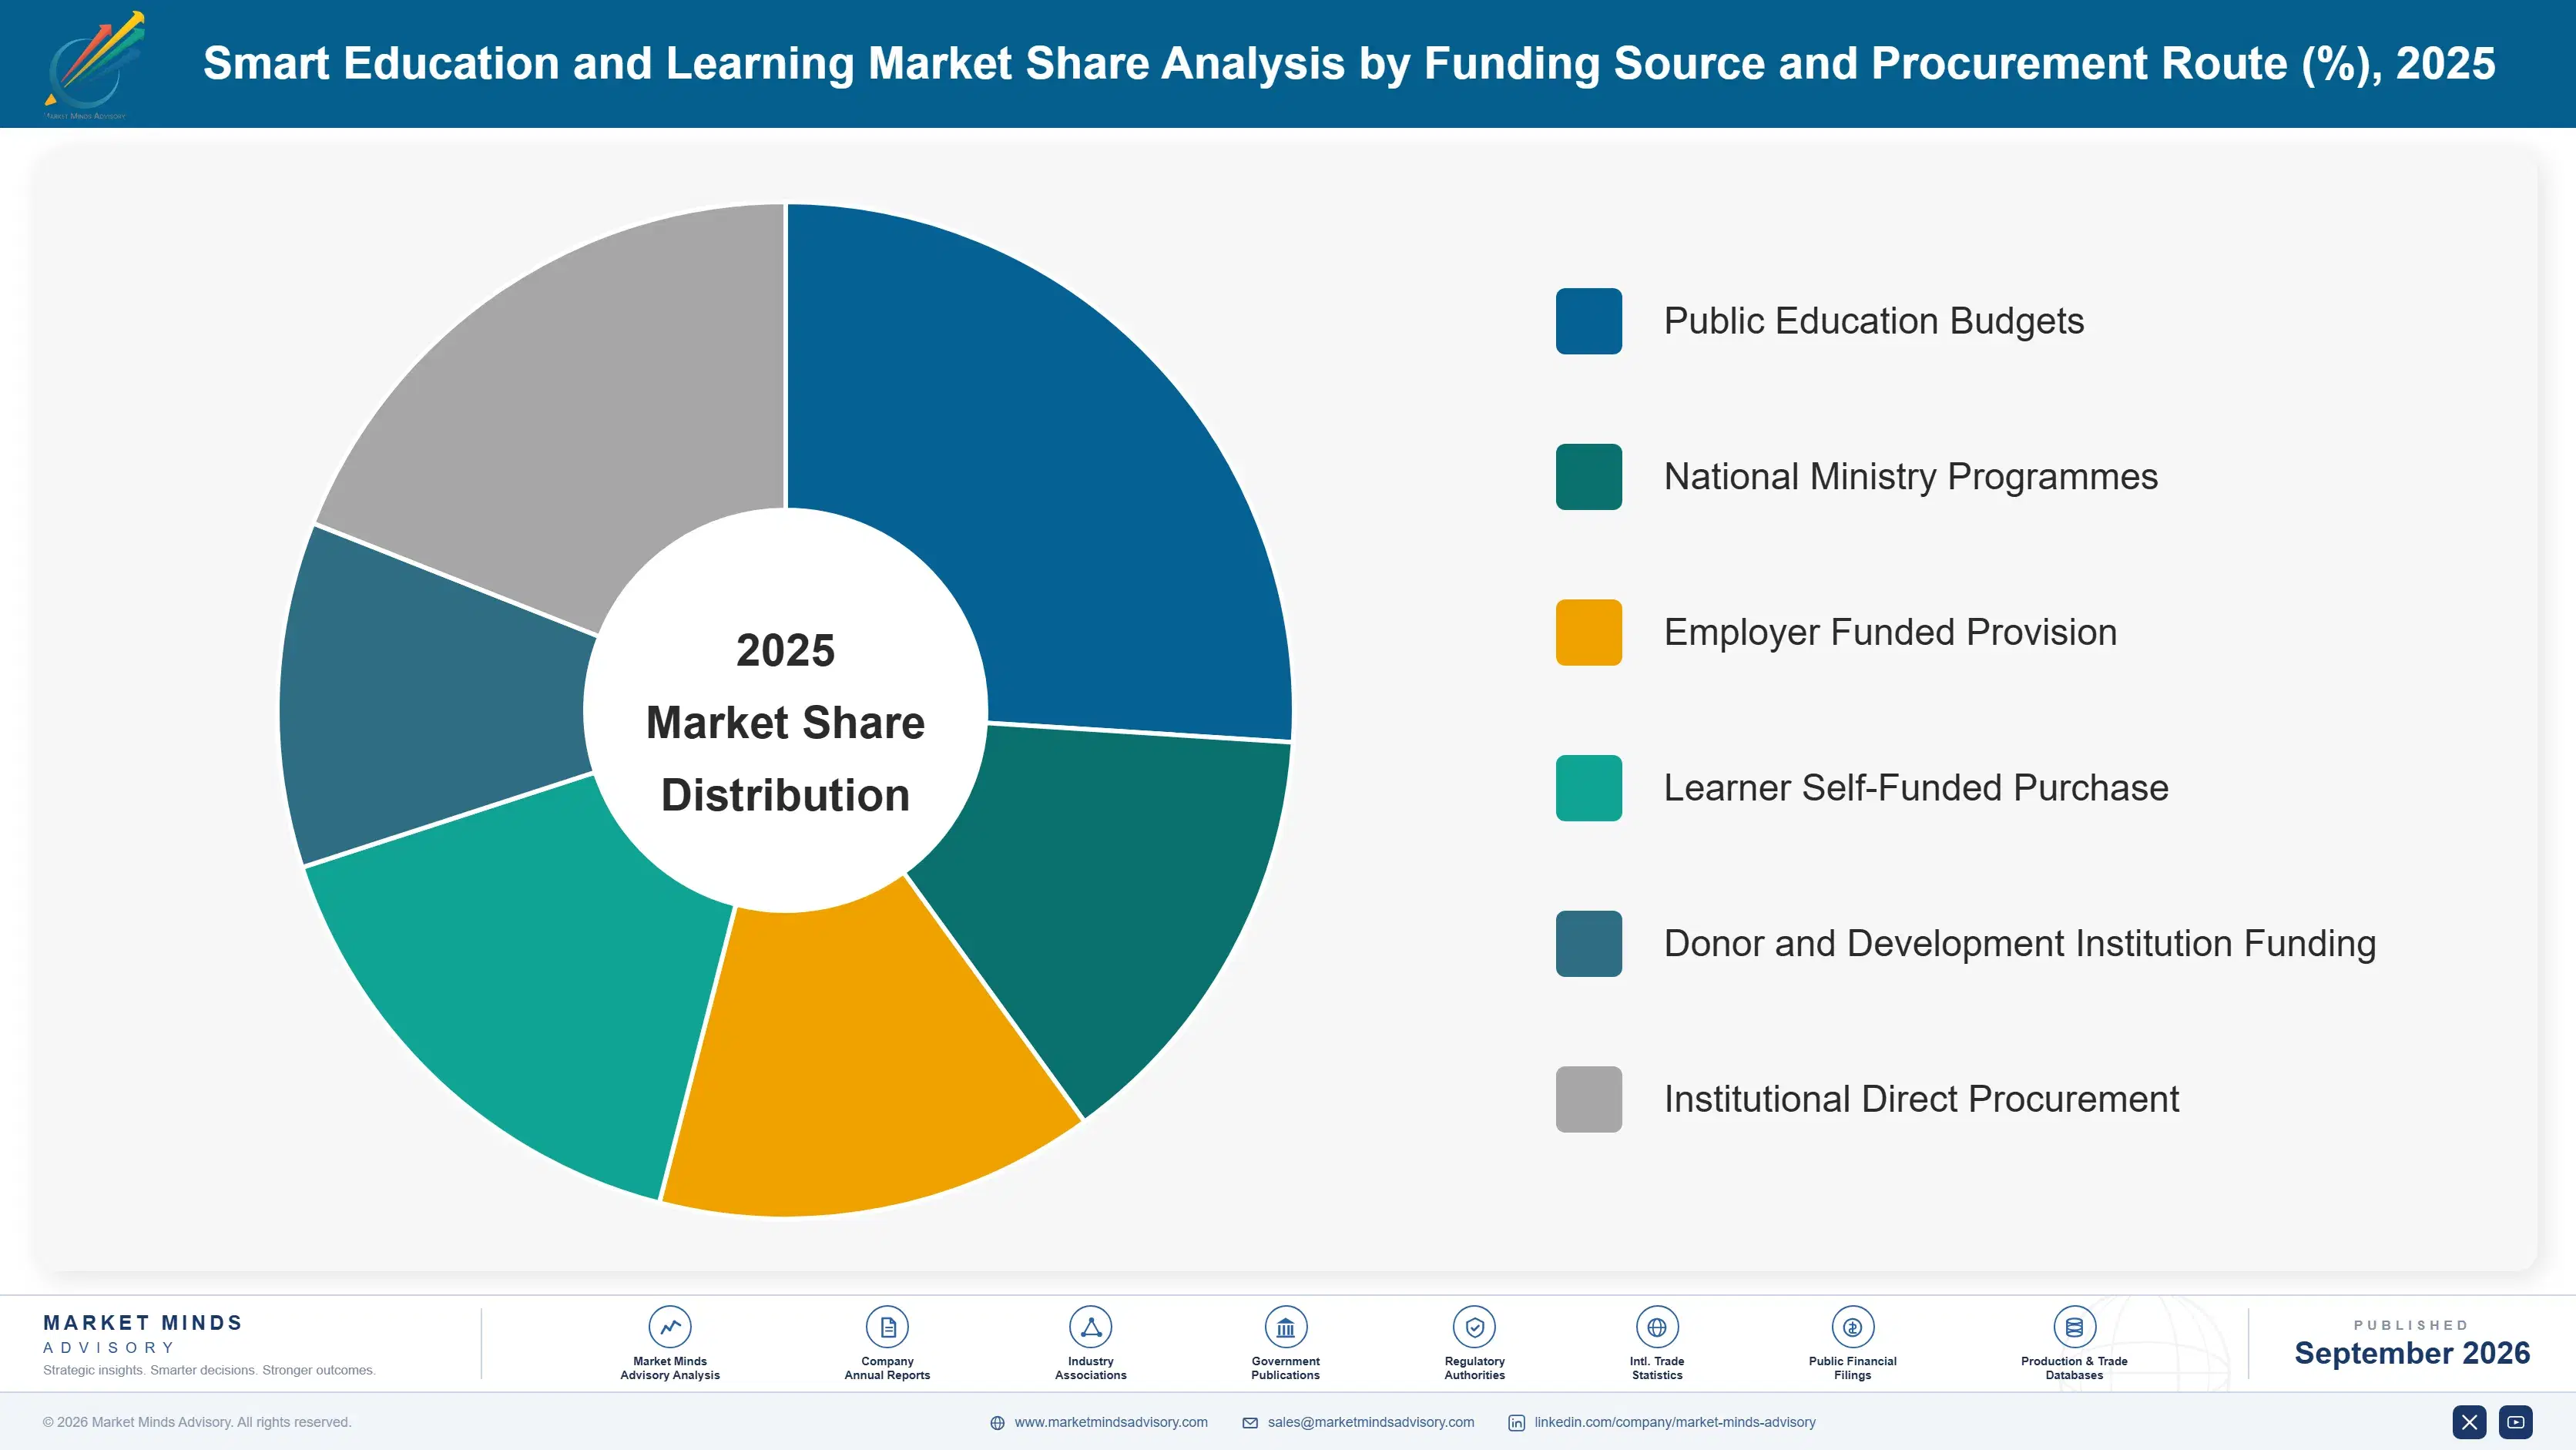
By Funding Source and Procurement Route

  • Public Education Budgets
  • National Ministry Programmes
  • Employer Funded Provision
  • Learner Self-Funded Purchase
  • Donor and Development Institution Funding
  • Institutional Direct Procurement

By Region

  • North America
  • East Asia
  • Western Europe
  • South Asia and Pacific
  • Latin America
  • Middle East and Africa
  • Eastern Europe

Scope, Methodology, and Coverage

Every figure in this report is reproducible from documented input assumptions. The scope below maps the historical period, the forecast horizon, the segmentation dimensions, and the countries covered, alongside the underlying primary and qualitative methodology.
Historical Period
2020 to 2025
Forecast Period
2026 to 2036
Base Year
2025 (USD billions; MMA Primary Research Dataset, September 2026)
Market Definition
The smart education and learning market covers technology products and digital services supplied to schools, universities, training providers and employers for instruction, administration and assessment, spanning interactive classroom hardware, learning management and administration platforms, digital content and courseware, adaptive and personalised learning systems, assessment with proctoring and credentialing, and workforce skilling platforms. Sizing is measured at vendor revenue. Tuition fees, teacher salaries, physical textbooks, general purpose computing devices and school infrastructure construction are excluded.
Quantitative Units
USD billions at vendor revenue, with supporting learner counts and spend per learner by region
Segmentation Dimensions
Product function, end-use industry, funding source and procurement route, region
Regions Covered
North America, East Asia, Western Europe, South Asia and Pacific, Latin America, Middle East and Africa, Eastern Europe
Countries Covered
United States, Canada, Mexico, Brazil, United Kingdom, Germany, France, Netherlands, Sweden, Poland, China, Japan, South Korea, India, Indonesia, Australia, Saudi Arabia, South Africa
Key Companies Profiled
Pearson, Instructure, PowerSchool, Anthology, Cengage Group, McGraw Hill, Wiley, Coursera, Udemy, Docebo, D2L, Blackbaud, TAL Education Group, New Oriental Education, Kahoot, Duolingo, Meazure Learning, Promethean, BenQ, Sanoma
Quantitative Methodology
Primary survey, n=3,800 respondents, Q4 2025, six countries; demand-side model with trade association cross-validation
Qualitative Methodology
47 expert interviews, Q4 2025; applied to validate demand model assumptions, identify emerging dynamics, and assess competitive positioning
Report Format
PDF and XLSX data workbook (Word format preview document)
Publisher
Market Minds Advisory
Report Code
MMA-2026-TEC-641
Published
September 2026
Contact
sales@marketmindsadvisory.com | www.marketmindsadvisory.com

Purchase the full Smart Education and Learning Market Report (2026 to 2036).

The full report separates revenue attached to a qualification from revenue that merely claims to improve learning, which is the single distinction that explains renewal, margin and survival across this entire sector. It sizes six product functions with individual growth rates, seven regions built from public budget position and national programme funding, and the device replacement cliff arriving against expired emergency funding. Competitive analysis covers twenty providers on a consistent vendor revenue basis, with credential authority and assessment infrastructure treated as the decisive variables. Input cost modelling breaks out content development, proctor labour and royalty exposure by delivery model.
Six product functions with individual growth rates
Credential-attached revenue separated from learning claims
Renewal rates compared by product type
Device replacement cliff mapped against funding expiry
Twenty providers on consistent vendor revenue basis
Content development and proctor labour cost exposure

Built For The People Who Decide

From boardroom strategy to bench-side execution, this report is read cover-to-cover by leaders shaping the next decade of their industry, turning demand scenarios, market dynamics and valuation benchmarks into decisions.
CXOs/ Presidents/ VPs/ Managers
M&A and Corporate Development
Strategy Teams and R&D Heads
Procurement and Product Directors
Regulatory and Compliance Leaders
Investor Relations and Equity Analysts