Market Minds Advisory
Smart Connected Assets and Operations Market

Smart Connected Assets and Operations Market: Smart Connected Assets and Operations Market: Maintenance Calendar Inertia, Alert Fatigue and Data Nobody Acts On 2026 to 2036

Sensors got cheap and reliable, and almost nobody changed the maintenance schedule. Condition data arrives daily while the planned calendar from 1998 still decides when a machine gets opened up.

Lead Analyst

Published

September 2026

Make Smarter Decisions with Customized Research Insights

Request a free sample report and evaluate market opportunities, growth trends, and competitive dynamics relevant to your business needs.

2025 MARKET VALUE$28.4BMarket Size 2025
2036 FORECAST VALUE$91.4BBase Case , 2026 to 2036
CAGR 2026 TO 203611.2 %Bull 12.5% / Bear 9.9%
INCREMENTAL OPPORTUNITY$59.8BNet 10- year value creation
EXPANSION MULTIPLE2.89x2036 value over 2026 base
Strategic Levers
M&A Pipeline
Regional Outlook
Country Rankings
Competitive Intelligence
Segmental Deep-dive
Call-Us : 91 93563 13602

Executive Snapshot and Market Trajectory.

Sensors got cheap and reliable, and almost nobody changed the maintenance schedule. Condition data arrives daily while a planned calendar written decades ago still decides when a machine gets opened up and worked on. Around 68% of maintenance still runs to interval rather than condition.
The market reaches USD 31.6 billion in 2026 and USD 91.4 billion by 2036, a 2.89 times expansion at 11.2% annually. Maintenance workflow integration and work order automation grows at 16.8%, half again the market rate of 11.2%, because turning a condition alert into a scheduled job is the step nobody built. East Asia holds 32% of spending on installed industrial asset base. Workflow rather than sensing decides value.
Five vendors hold 31% of spending, very low for industrial software, because equipment manufacturers, platform vendors and system integrators all reach asset owners on entirely different terms. Siemens, PTC, Hitachi, ABB and IBM lead. Workflow integration rather than sensing capability decides realised value. Only about 19% of condition alerts produce an actual work order, because turning an alert into a scheduled job with parts and labour is the step most deployments never built.
Market Definition
This report covers smart connected assets and operations: the sensing, connectivity, analytics and workflow software that monitors industrial assets and acts on what it observes. It spans maintenance workflow integration and work order automation, condition monitoring and diagnostics platforms, asset performance analytics and failure prediction, industrial connectivity gateways and edge devices, retrofit sensing kits for installed equipment, and the deployment and integration services supplied around them. It excludes production execution systems, enterprise asset management systems of record, process control hardware, building management systems, and fleet telematics for road vehicles.
Base Year Value
$28.4B in 2025 (MMA Primary Research Dataset, September 2026)
Forecast Period
2026 to 2036, eleven discrete annual values
CAGR
11.2% base case. Bull 12.5%. Bear 9.9%.
Fastest Growth Segment
Maintenance Workflow Integration And Work Order Automation: 16.8% CAGR
Fastest Growth Country
India: 18.4% CAGR
Fastest Growth Region
South Asia and Pacific: 13.4% CAGR
Largest Region
East Asia: 32% of 2025 global value
Market Leaders
Siemens, PTC, Hitachi, ABB and IBM lead on smart connected assets and operations software and services revenue. Source: MMA Analysis.
Primary Survey
n=3,800 procurement and R&D decision-makers, Q4 2025, six countries
Methodology
Demand-side build-up, cross-validated against public data, 47 expert interviews

Smart Connected Assets and Operations Market Forecast Scenarios

smart-connected-assets-and-operations-market-size-forecast-scenario-1790004231871
Between 2020 and 2025 the category compounded at 9.8%, and instrumentation ran far ahead of any change in behaviour. Plants added sensors and dashboards while maintenance departments kept working to the same interval-based schedules they always had, because changing a maintenance regime means arguing with insurers, warranty terms and a superintendent who has been right for twenty years.
The base case holds 11.2% on three mechanisms. Workflow integration keeps improving, which is the only thing that converts an alert into a scheduled job rather than into a notification somebody dismisses. Retrofit sensing keeps reaching installed equipment that will never be replaced. And industrial capacity keeps being built in regions where maintenance practice is being established rather than defended, which removes the argument entirely. Those three mechanisms run largely independently of one another.
The bull case at 12.5% assumes insurers and warranty providers begin accepting condition-based intervals in place of calendar ones, which would remove the largest single obstacle. The bear case at 9.9% is deployment fatigue, where organisations that instrumented heavily and changed nothing conclude the category does not work and stop funding further programmes regardless of what the technology now does.

Data Arrives, Nothing Changes

The instrumentation worked and the organisation did not move. Around 68% of industrial maintenance is still scheduled by interval rather than by observed condition, and only about 19% of condition alerts produce an actual work order. Plants have the data. What they lack is anybody willing to override a schedule insurers and experience both support.
TOP FIVE CONCENTRATION31%Very low, reflecting equipment makers competing against platforms and integrators
CALENDAR BASED MAINTENANCE SHARE68%Maintenance still scheduled by interval rather than by observed condition
ALERTS ACTED UPON19%Condition alerts producing an actual work order or intervention
RETROFIT ASSET SHARE57%Monitored equipment fitted with sensing after original installation
DEPLOYMENT TO VALUE PERIOD22 monthsFrom first sensor installed to any measurable maintenance outcome change
ASSET REMAINING LIFE17 yearsTypical remaining service life of equipment being instrumented today
Retrofit is where the volume actually sits. Around 57% of monitored equipment was fitted with sensing after original installation, because the assets that matter have around 17 years of remaining life and nobody replaces a working machine to get better telemetry. That makes retrofit sensing kits and gateway connectivity a larger commercial position than most platform vendors acknowledge, and it favours suppliers who understand old equipment.
Time to value is the number that kills programmes. It takes around 22 months from first sensor to any measurable change in maintenance outcome, and most of that is workflow integration rather than deployment. Maintenance workflow integration and work order automation grows at 16.8% against 11.2% for the market, because turning an alert into a scheduled job is the step nobody built into the original business case.
"I have stood in control rooms with beautiful dashboards showing a bearing degrading and watched the team wait for the scheduled overhaul in eleven weeks anyway. Nobody wants to be the person who opened a machine early and found nothing wrong."
Director, Industrial Operations and Asset Performance Practice · MMA Technology Practice · September 2026

Market Trends

Maintenance Calendars Survive Every Condition Programme

Around 68% of industrial maintenance is still scheduled by interval rather than by observed condition, and only about 19% of alerts produce an actual work order. The obstacle is governance rather than sensing: changing an interval means arguing with insurers, warranty terms and a superintendent whose judgement has been correct for two decades. Vendors selling analytics into that environment are supplying evidence to an organisation that has no mechanism for acting on it. Insurance terms and warranties frequently specify interval maintenance too, which means condition-based scheduling can void cover whatever the data shows.
Market Impact: India compounds at 18.4% yearly

Retrofit Carries More Volume Than New Equipment

Around 57% of monitored equipment was fitted with sensing after original installation, because assets being instrumented today carry roughly 17 years of remaining service life and nobody replaces a working machine for better telemetry. That makes retrofit kits and gateway connectivity a larger commercial position than platform vendors generally acknowledge. Suppliers who understand ageing equipment, its interfaces and its failure modes reach demand that new-equipment telemetry never touches at all. Mounting constraints, undocumented interfaces and unfamiliar failure modes are the actual engineering problem, and platform vendors have consistently underestimated it.
Market Impact: Value takes about 22 months

Market Opportunities and Growth Drivers

New Industrial Capacity Establishes Practice Rather Than Defending It

India compounds at 18.4%, ahead of every other market, because industrial capacity is being built and maintenance practice is being established rather than defended by anybody with twenty years of interval-based success behind them. East Asia holds 32% of spending on the same mechanism at larger scale. Organisations without an incumbent maintenance regime adopt condition-based intervals from the outset, which removes the governance argument that stalls programmes in mature plants. Establishing practice is considerably easier than changing practice that has worked correctly for decades. Nobody defends a regime they never had.
Market Impact: Calendar governs 68% of maintenance

Workflow Integration Converts Alerts Into Actual Jobs

Turning a condition alert into a scheduled work order with parts, labour and a window is the step most deployments skipped, which is why only around 19% of alerts produce any intervention at all. Maintenance workflow integration and work order automation grows at 16.8% against 11.2% for the market as organisations retrofit that missing layer. Deployment to measurable value runs around 22 months and most of that period is this integration work rather than sensing. Vendors quoting deployment timelines that exclude workflow integration are promising a schedule their own customers will not achieve.
Market Impact: Only 19% of alerts act

Market Restraints and Challenges

Insurers And Warranties Still Require Calendar Intervals

Insurance terms and equipment warranties frequently specify interval-based maintenance, which means condition-based scheduling can void cover regardless of what the data shows. The root cause is that underwriters price against documented regimes rather than against observed condition they cannot verify. Commercially this blocks the change that justifies the whole investment. Mitigation runs through insurer engagement programmes, through hybrid regimes that satisfy documentation while acting on condition, and through warranty negotiation at equipment purchase. Underwriter acceptance removes an obstacle that no product capability could ever have addressed on its own. Underwriters decide.
Market Impact: Only 19% of alerts get actioned

Deployment Fatigue Follows Programmes That Changed Nothing

Organisations that instrumented heavily and saw no maintenance outcome change conclude the category does not work, and that judgement persists for years afterwards. The root cause is that original business cases assumed behaviour change nobody was accountable for delivering. Commercially this poisons follow-on funding. Mitigation runs through business cases scoped to workflow integration rather than sensing, through smaller first deployments with committed outcome owners, and through measuring alerts actioned rather than sensors installed. That judgement persists for years and reaches other sites and other divisions long before anybody re-examines it.
Market Impact: Retrofit covers 57% of assets
4 additional market trends, 3 additional growth drivers, and 2 additional restraints and challenges are covered in the full report. Contact sales@marketmindsadvisory.com to access the complete intelligence.

Segment CAGR and Growth Architecture

Segmentation follows functional layer, since each carries quite different buyer, adoption friction and realised value. Six layers cover the market: maintenance workflow integration and work order automation, asset performance analytics and failure prediction, condition monitoring and diagnostics platforms, retrofit sensing kits, industrial connectivity gateways and edge devices, and deployment and integration services. Industry and route sit elsewhere.
smart-connected-assets-and-operations-market-market-share-analysis-1790004232459

Maintenance Workflow Integration And Work Order Automation

Maintenance workflow integration and work order automation grows at 16.8%, half again the market rate of 11.2%, because turning a condition alert into a scheduled work order with parts, labour and a maintenance window is the step most deployments simply never built. Only around 19% of alerts currently produce any intervention. This layer is also where most of the 22 month deployment to value period is actually consumed, which means vendors selling sensing without it are quoting a timeline their own customers will not achieve in practice. Preconfigured templates by asset class are what shorten it. Vendors selling sensing without this layer are quoting a value timeline their customers will not reach.
CAGR 16.8%

Retrofit Sensing Kits For Installed Equipment

Retrofit sensing kits compound at 14.1% because around 57% of monitored equipment was instrumented after original installation and assets being fitted today carry roughly 17 years of remaining service life. Nobody replaces a working machine to obtain better telemetry from it. This segment demands understanding of ageing equipment interfaces, mounting constraints and failure modes that new-equipment telemetry never encounters, which is why specialist suppliers hold positions here that large platform vendors have consistently struggled to take from them. Assets fitted today will still be running well into the next decade, which makes the installed base rather than new equipment the durable opportunity here. Specialists hold it firmly. Documentation rarely exists.
CAGR 14.1%
Full segment breakdown across 6 segments available in the complete report.

Regional Architecture and Country Demand Map

East Asia holds 32% of spending, above the usual band, because installed industrial asset base and new capacity construction both concentrate there at scale. North America follows at 24% on process industry instrumentation depth. India compounds fastest at 18.4% on new industrial capacity being established.

East Asia

East Asia takes 32% of spending, above the 30% band ceiling, because installed industrial asset base and new capacity construction both concentrate here at a scale no other region matches. Chinese manufacturing plants instrument at design stage where maintenance practice is being established rather than defended by an incumbent regime. Japanese and South Korean process industries hold older assets requiring retrofit sensing. Growth at 12.3% runs above the global rate on construction rather than on any change in mature plant behaviour. Regional integrators deliver most deployment work, which keeps services cost well below what Western vendors carry on comparable programmes. Governance arguments rarely arise on new plant. Retrofit remains substantial regardless.
Share: 32% | CAGR: 12.3% (2026 to 2036)

North America

North America accounts for 24% of spending, where process industry instrumentation depth is greatest and where calendar-based maintenance is also most entrenched through insurance and warranty terms. PTC and IBM both built positions here. Deployment fatigue is most visible in this region, since organisations instrumented earliest and many saw no maintenance outcome change at all. Growth at 11.7% sits above the global rate on workflow integration retrofit rather than on new sensing deployment. Workflow integration retrofit onto existing deployments is where regional spending is now concentrated rather than on further sensing. Insurance and warranty terms here specify intervals particularly rigidly, which blocks condition scheduling more firmly than technical factors ever do.
Share: 24% | CAGR: 11.7% (2026 to 2036)
Regional intelligence for 5 additional markets available in the complete report: Western Europe, South Asia and Pacific, Latin America, Middle East and Africa, Eastern Europe. Contact sales@marketmindsadvisory.com.
smart-connected-assets-and-operations-market-country-cagr-analysis-1790004233041

Where Asset Programmes Deliver Value

Maintenance governance rather than sensing capability limits what these programmes achieve, retrofit carries most of the volume, and time to value is consumed by workflow rather than by deployment. The four levers below follow those conditions rather than any argument about analytics sophistication. Each addresses a governance or delivery condition instead. Analytics converged already.

Sell The Work Order, Not The Alert

Only around 19% of condition alerts produce any intervention, because turning an alert into a scheduled job with parts, labour and a window is a step most deployments never built at all. Vendors delivering that integration convert evidence into outcomes rather than into dashboards. Those selling analytics alone are supplying an organisation that has no mechanism for acting on what they provide, and the business case fails accordingly. Dashboards are not an outcome. Business cases fail on exactly this gap, and the vendor is the one blamed for it afterwards.
Market Impact: Only 19% of alerts now produce any action

Build For Equipment That Will Never Be Replaced

Around 57% of monitored equipment was instrumented after original installation and assets fitted today carry roughly 17 years of remaining service life. Suppliers who understand ageing equipment interfaces, mounting constraints and failure modes reach volume that new-equipment telemetry never touches. Platform vendors treating retrofit as a lesser case are conceding the larger half of this market to specialists who took the awkward engineering seriously. Around 17 years of remaining life sits behind that decision, which is a long time to be the supplier nobody can displace. Awkward engineering wins here.
Market Impact: Retrofit now covers a full 57% of monitored assets

Engage Insurers Before Changing Any Interval

Insurance terms and equipment warranties frequently specify interval-based maintenance, so condition-based scheduling can void cover whatever the data shows. Around 68% of maintenance remains calendar-driven for exactly that reason. Vendors working with underwriters to accept condition evidence remove the obstacle that blocks the change justifying the whole investment, and that work reaches a constituency no product feature ever will. Around 68% of maintenance is still governed by calendar, and no analytics improvement has ever moved that figure at all. Product features never reach an underwriter. Underwriters answer to evidence rather than to features.
Market Impact: Calendar still governs a full 68% of maintenance

Scope Business Cases To Workflow Not Sensor Counts

Deployment to measurable value runs around 22 months and most of that is workflow integration rather than installation. Business cases built on sensors installed produce the deployment fatigue that poisons follow-on funding for years. Vendors scoping cases to alerts actioned and jobs scheduled survive the review that a sensor-count case reliably fails, and they set expectations their own delivery can actually meet. Sensor counts impress nobody at a review 22 months later. Scoping to alerts actioned and jobs scheduled sets an expectation delivery can actually meet, which protects the follow-on funding.
Market Impact: Value now takes around 22 months to appear

Who Controls the Margin Pool

Five vendors hold 31% of smart connected assets and operations spending, very low for industrial software, because equipment manufacturers, independent platform vendors and system integrators all reach asset owners on entirely different commercial terms. Siemens, PTC, Hitachi, ABB and IBM lead. All participants are assessed on connected asset software and services revenue rather than on broader automation, equipment or technology services businesses they also operate. Concentration this low has persisted for years and shows no sign of consolidating, given how differently those three participant types reach an asset owner.
Competition runs on workflow integration depth and retrofit capability far more than on analytics sophistication, which converged years ago. The second dimension is maintenance domain credibility, because a superintendent overriding a calendar interval needs to trust the evidence and the vendor supplying it more than they trust twenty years of their own successful practice.

Pressure is emerging from equipment manufacturers bundling monitoring with machines, which removes the separate purchase for new assets. Rankings shift where industrial capacity is built and where insurers accept condition evidence, particularly across India, China and the Gulf over the coming decade. Vendors without retrofit capability carry the most exposure to that bundling.
smart-connected-assets-and-operations-market-company-positioning-matrix-1790004233568

Competitive Moat and Risk Dimensions

SIEMENS

Moat: Equipment Domain Depth

Siemens combines monitoring software with deep knowledge of the equipment being monitored, which matters because a superintendent overriding a calendar interval needs to trust the failure model behind it. Around 68% of maintenance stays calendar-driven precisely because that trust is missing. Competitors with better analytics and no equipment heritage struggle to earn it.
SIEMENS

Risk: Retrofit Estate Coverage

Around 57% of monitored equipment is retrofitted and much of it was not built by any single manufacturer, which limits how far equipment heritage extends across a real plant. Mixed estates need suppliers indifferent to who made the machine. Domain depth on own equipment reaches part of an asset base and leaves the remainder to specialists in ageing mixed installations.
PTC

Moat: Workflow Integration Position

PTC connects condition data into maintenance execution rather than stopping at analytics, which addresses the step where only around 19% of alerts produce a work order. That integration consumes most of the 22 month time to value, so owning it shortens the timeline that kills programmes. Competitors delivering insight leave the hardest part unbuilt.
PTC

Risk: Equipment Bundling Pressure

Equipment manufacturers increasingly bundle monitoring with new machines, which removes the separate software purchase for assets bought today. Workflow integration matters most on mixed retrofitted estates rather than new equipment. A position dependent on organisations buying software separately weakens wherever the machine arrives already instrumented and connected.

Players Tracked

Prominent Players

Siemens
PTC
Hitachi
ABB
IBM

Other Key Players

SAP
Schneider Electric
Emerson
Honeywell
Rockwell Automation
GE Vernova
Aveva
Augury
Uptake Technologies
Samsara
Bosch Rexroth
Yokogawa Electric
Tata Consultancy Services
Infosys
SKF

Recent Developments

MARCH 2025

Organisations Retrofit Workflow Layers Onto Existing Deployments

Industrial operators added maintenance workflow integration to condition monitoring deployments that had produced alerts nobody acted upon, a programme development rather than any corporate transaction. Only around 19% of alerts had generated work orders, and most of the deployment period sits in this integration work rather than sensing.
Signal: Sensing was never the missing piece here, and buyers are now funding what actually was missing.
SEPTEMBER 2024

Insurers Begin Assessing Condition Based Maintenance Evidence

Several large industrial insurers began assessing condition-based maintenance evidence alongside documented interval regimes, an underwriting development rather than any acquisition or partnership. Around 68% of maintenance still remains calendar-driven partly because condition-based scheduling can void existing cover, which no analytics improvement addresses at all anywhere.
Signal: Underwriting acceptance removes an obstacle that no product capability could ever have removed by itself alone.
JUNE 2025

Indian Industrial Construction Adopts Condition Scheduling Directly

Indian industrial construction programmes adopted condition-based maintenance scheduling from commissioning rather than converting later, a practice development rather than any corporate event. India compounds at 18.4%, and organisations without an incumbent interval regime face none of the governance argument that stalls programmes in mature plants elsewhere.
Signal: Establishing new practice is far easier than changing practice that has worked correctly for many decades.

What Asset Programmes Cost

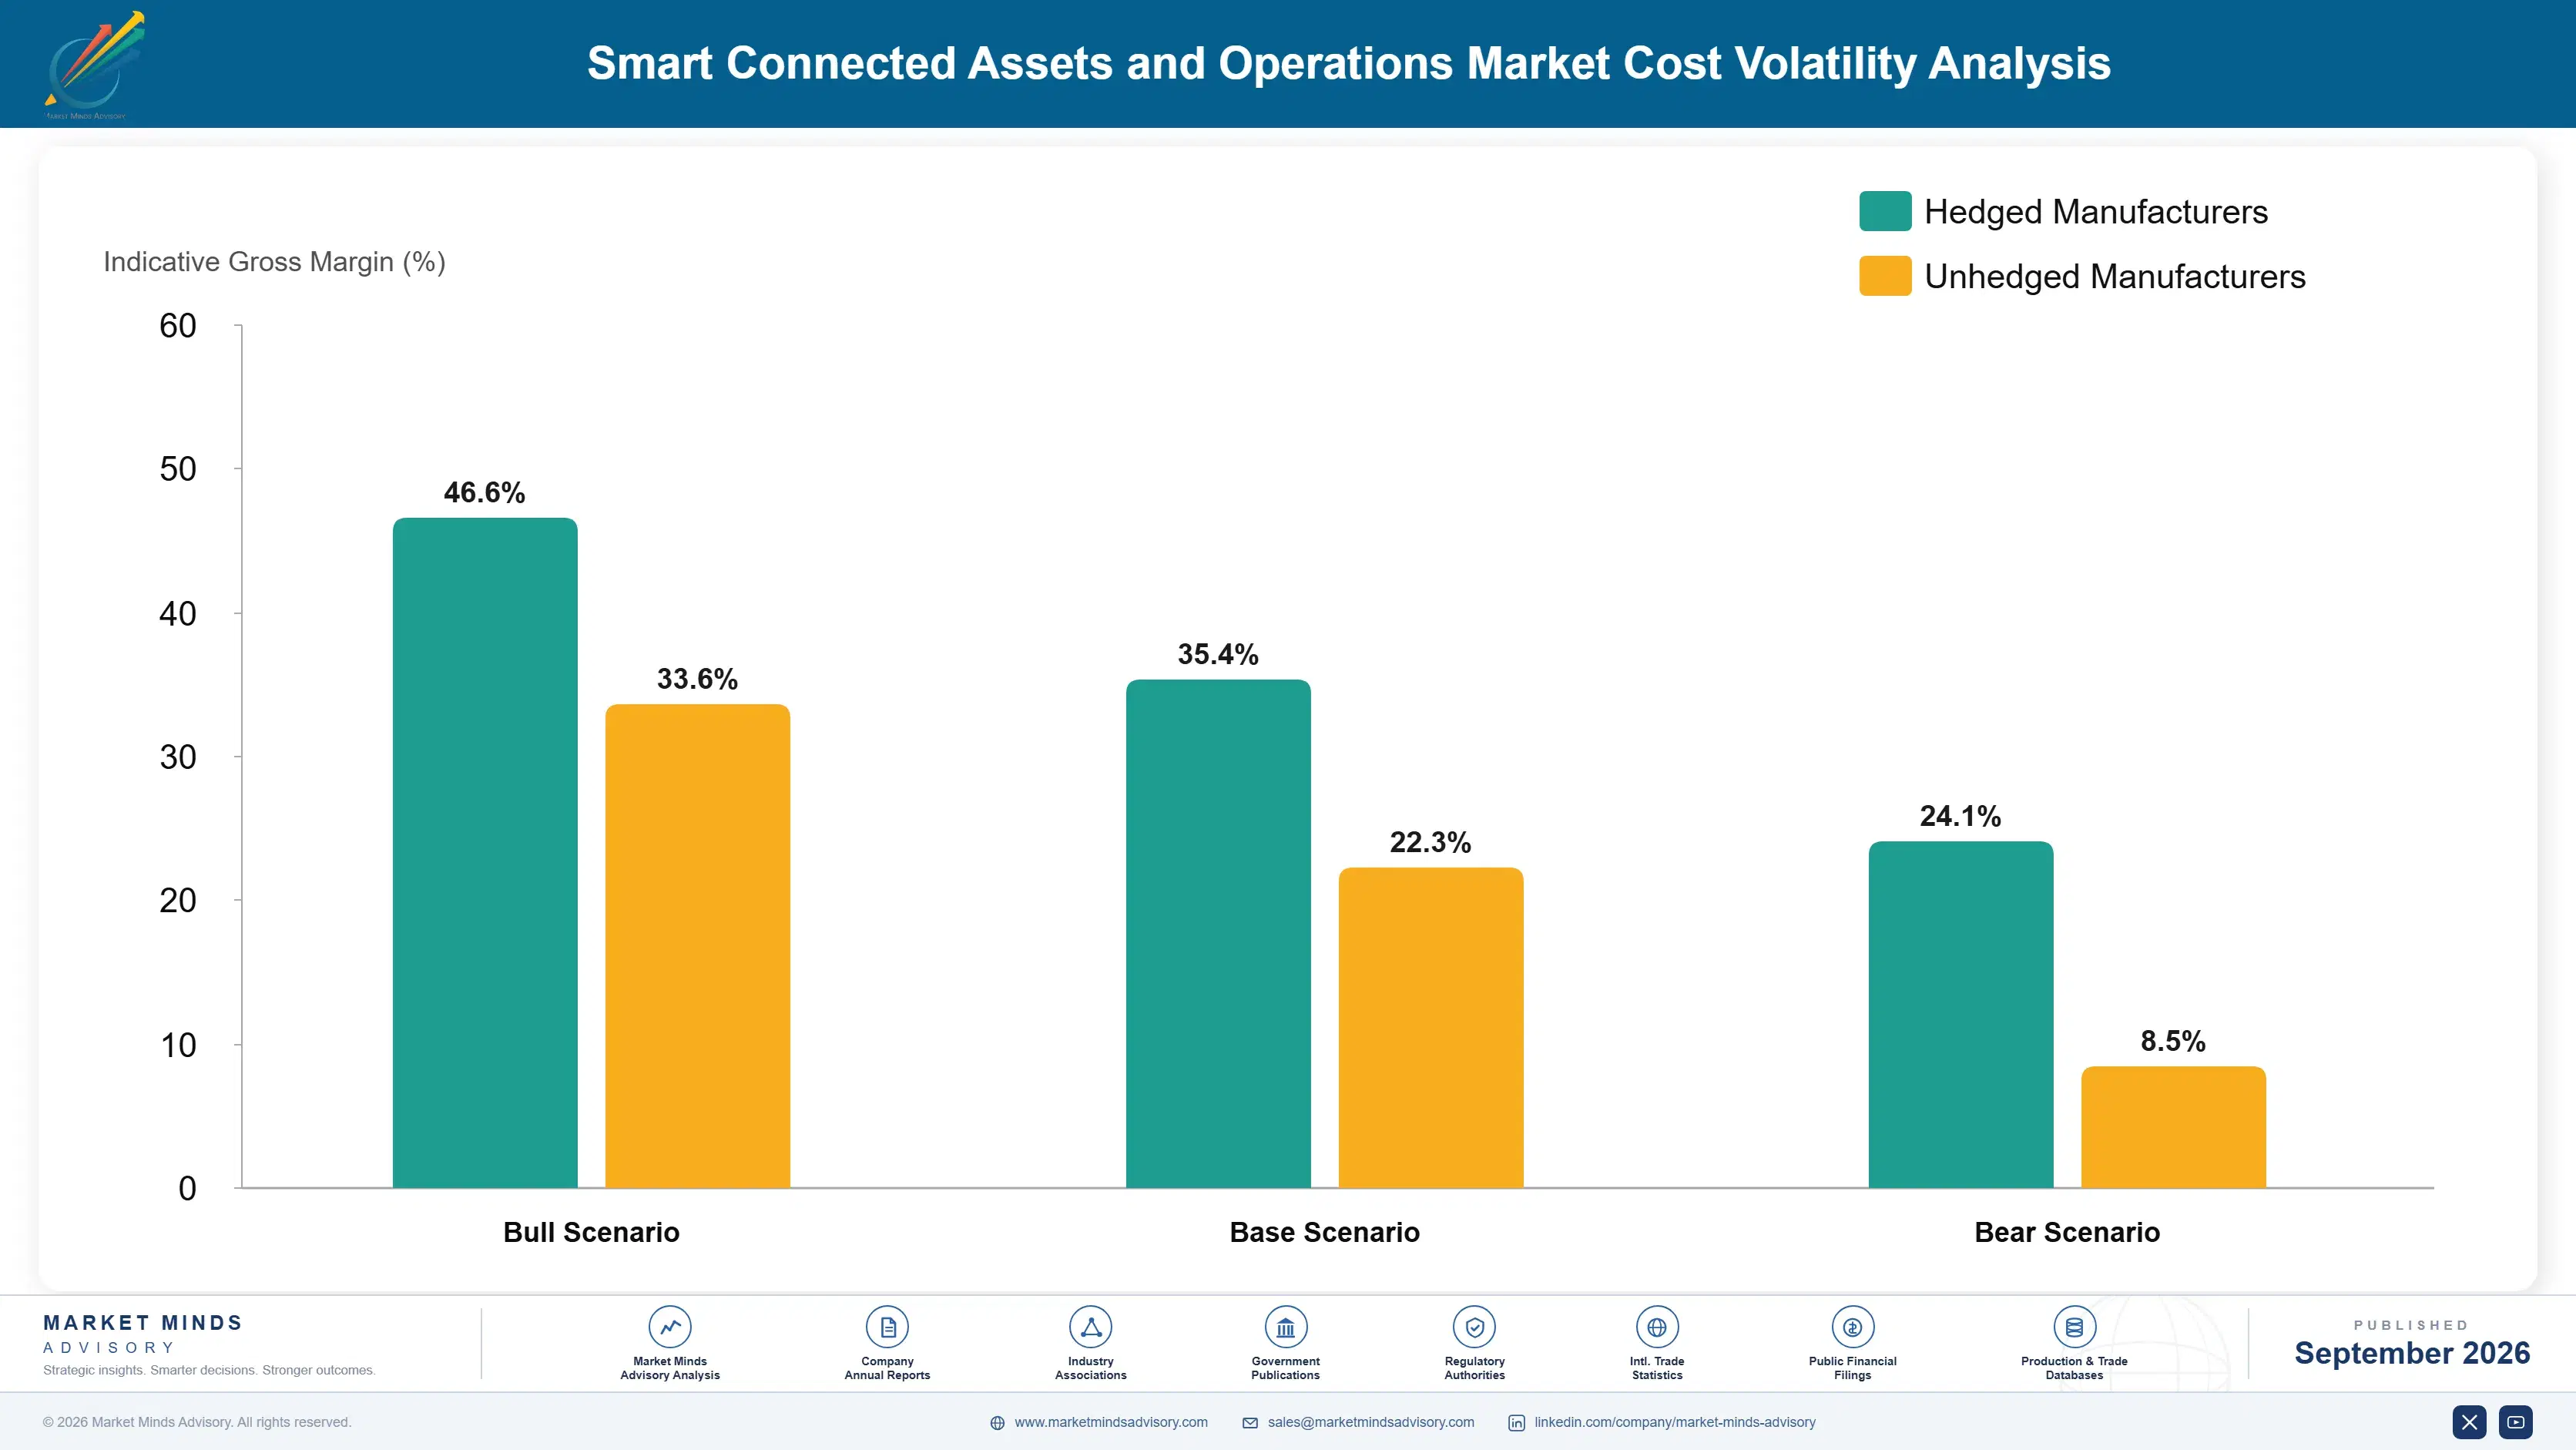
Deployment and integration services absorb roughly 34% of programme cost, weighted heavily toward workflow integration rather than sensor installation. Sensing hardware and gateways take around 21%, which is far less than most business cases assume. Platform engineering absorbs about 22% for vendors, and ongoing connectivity, hosting and support take most of the remaining balance across the deployment life.
Industrial integration labour costs rose through 2023 and 2024 as demand for engineers who understand both maintenance practice and software systems outpaced a supply that neither discipline trains for. PTC Annual Report 2024 and Siemens Annual Report 2024 both record services delivery capacity and platform investment among principal operating variables. Vendors with partner delivery networks scaled into demand that direct services organisations could not staff. Neither discipline trains for the combination.

The competitive disadvantage mechanism is services capacity rather than platform cost. A vendor whose product requires heavy integration carries delivery cost scaling with deployment count, while one shipping preconfigured workflow templates does not. Exposure concentrates among platform vendors without maintenance domain templates, since every deployment then becomes bespoke integration against a customer's existing maintenance system and practice.
smart-connected-assets-and-operations-market-cost-volatility-analysis-1790004233766

Ship Preconfigured Workflow Templates By Asset Class

Deployment and integration services absorb roughly 34% of programme cost, and most of it is workflow rather than sensor installation. Templates covering common asset classes and maintenance systems convert bespoke integration into configuration. The engineering investment is real and it directly attacks the 22 month time to value that produces deployment fatigue and kills follow-on funding.

Build Partner Delivery Capacity Ahead Of Demand

Industrial integration engineers who understand both maintenance practice and software are scarce because neither discipline trains for the combination. Certifying partner engineers ahead of pipeline converts a delivery ceiling into a variable cost. The investment looks premature until demand arrives, at which point building capacity takes far longer than closing the deals ever does.

Price Connectivity Against Actual Data Volumes

Ongoing connectivity, hosting and support run for the whole deployment life while revenue was frequently priced against installation. Charging against data volumes and monitored assets aligns cost with revenue over the years that follow. Vendors absorbing connectivity cost on a base that keeps growing are funding an obligation that the original contract never anticipated at all.

Portfolio Architecture for Margin Defence

Margin architecture separates on where realised value sits rather than on technical difficulty. Industrial connectivity gateways and edge devices earn least, since they are hardware competing against numerous suppliers with no differentiation available. Condition monitoring platforms sit above on analytics depth. Workflow integration, asset performance analytics and retrofit sensing kits earn most, because each addresses something the customer cannot currently do at all.
The volume versus premium tension runs between platform licensing and integration services, which reward opposite commercial behaviour entirely. Licensing scales across deployments at software margin with no delivery obligation. Integration carries the workflow work that determines whether any value appears and consumes around 34% of programme cost. Vendors licensing without integration ship the easy half and leave customers to fail at the difficult one.

High-value pools concentrate in workflow integration and in retrofit sensing, and neither is reached through analytics capability. Workflow requires maintenance domain knowledge and templates built against real systems. Retrofit requires understanding ageing equipment that nobody documented properly. Both explain why concentration sits at only 31% while the vendors actually delivering measurable outcomes are considerably fewer than the participant count suggests.

Volume / Commodity-Adjacent

Industrial connectivity gateways and edge devices, hardware competing against numerous suppliers where protocol support is table stakes and differentiation is essentially unavailable. The twelve point spread separates suppliers with volume manufacturing from those building at scales where assembly cost remains significant.
Gross Margin: 27% to 39%

Premium / Certified

Condition monitoring and diagnostics platforms and deployment and integration services, where analytics depth and delivery capability determine selection rather than any pricing comparison between vendors. The thirteen point spread tracks how much bespoke integration each vendor performs against configured template deployment.
Gross Margin: 46% to 59%

Sustainability / Regulatory / Next-Generation

Maintenance workflow integration and work order automation, asset performance analytics and failure prediction and retrofit sensing kits, each addressing something the customer cannot currently do. The sixteen point spread reflects maintenance domain depth and template coverage across common asset classes.
Gross Margin: 64% to 80%
smart-connected-assets-and-operations-market-portfolio-architecture-1790004234266

High-value Sub-segments and Strategic Watch-out

Maintenance Workflow Integration And Work Order Automation

Grows at 16.8% because turning an alert into a scheduled job is the step most deployments simply never built. The sixteen point spread reflects template coverage. Only around 19% of alerts currently produce any intervention at all today. Templates rather than analytics shorten deployment. Nobody built it.
Gross Margin: 64% to 80%

Retrofit Sensing Kits For Installed Equipment

Grows at 14.1% because around 57% of monitored equipment was instrumented after installation and assets carry seventeen years remaining. The sixteen point spread reflects ageing equipment expertise. Nobody replaces a working machine to obtain better telemetry from it. Specialists hold these positions firmly. Machines outlast programmes.
Gross Margin: 64% to 80%

Asset Performance Analytics And Failure Prediction

Grows at 12.4% on failure models that a maintenance superintendent will actually trust enough to override a schedule. The sixteen point spread reflects domain credibility. Analytics quality matters less than whether anybody acts on the output. Trust rather than accuracy decides it. Superintendents decide. Trust is the barrier.
Gross Margin: 64% to 80%

Industrial Connectivity Gateways And Edge Devices

Grows at 7.6%, slowest of the six layers, as hardware competing against numerous suppliers with protocol support as table stakes. The twelve point spread reflects manufacturing scale. Volume follows deployment counts rather than driving any demand independently. Protocol support is table stakes everywhere. Differentiation is absent.
Gross Margin: 27% to 39%

Why Superintendents Decide

The annuity here depends on whether maintenance behaviour actually changed. A deployment where alerts produce work orders demonstrates value continuously and renews without argument. One where around 68% of maintenance still runs to calendar carries full cost against an outcome nobody can evidence. Renewal separates those two, and vendors discover which they delivered when the business case gets examined against what the plant actually did differently.
Depth varies by whether the vendor reached maintenance execution. A platform connected into work order systems, parts availability and labour scheduling becomes part of how the plant runs and cannot be removed without disruption. A platform producing dashboards can be switched off with nobody noticing for weeks. That difference has almost nothing to do with analytics quality and everything to do with integration depth.

The buyer and the person who must change are different people. An operations director evaluated asset performance improvement against a capital case and signed. A maintenance superintendent evaluates whether opening a machine early on a recommendation risks their record and their credibility. An insurer evaluates whether documented intervals were followed. The superintendent decides more than the buyer does, and nobody sold to them.
smart-connected-assets-and-operations-market-end-use-penetration-index-1790004234761

What Wins Asset Programmes

These are among the four positions where our research anticipates prominent divergence between winners and laggards over the coming forecast period. Each is grounded in the demand model, the regulatory perimeter, and the announced capacity pipeline.
01 / EXECUTION LAYER OWNERSHIP

Deliver Work Orders, Not Dashboards

Only around 19% of condition alerts produce any intervention, because turning an alert into a scheduled job with parts, labour and a maintenance window is a step that most deployments simply never built at all. Vendors delivering that integration convert evidence into outcomes rather than into screens nobody acts upon. Those selling analytics alone are supplying an organisation that has no mechanism for acting on what arrives, and the business case fails at the first serious review of the programme.
02 / AGEING ESTATE CAPABILITY

Engineer For Machines Nobody Documented

Around 57% of monitored equipment was instrumented after original installation, and assets being fitted today carry roughly seventeen years of remaining service life ahead of them. Nobody replaces a working machine simply to obtain better telemetry from it. Suppliers who understand ageing equipment interfaces, mounting constraints and failure modes reach volume that new-equipment telemetry never touches, while platform vendors treating retrofit as a lesser case concede the larger half of a market they could have held comfortably for a decade.
03 / UNDERWRITER ENGAGEMENT WORK

Change The Policy Before The Schedule

Insurance terms and equipment warranties frequently specify interval-based maintenance, so condition-based scheduling can void cover regardless of what any monitoring evidence demonstrates. Around 68% of maintenance stays calendar-driven substantially for that reason rather than through any technical shortcoming. Vendors working with underwriters to accept condition evidence remove the obstacle blocking the change that justifies the entire investment, and reach a constituency no product feature ever will reach on their own through any product roadmap or feature release from any vendor.
04 / CASE SCOPING REALISM

Promise Jobs Scheduled, Not Sensors Installed

Deployment to measurable value runs around twenty-two months and most of that period is workflow integration rather than sensor installation anywhere on the plant. Business cases built on sensors installed produce exactly the deployment fatigue that poisons follow-on funding for years afterwards. Vendors scoping cases to alerts actioned and jobs scheduled survive the review a sensor-count case reliably fails, and set expectations their delivery can meet without overpromising anything to anybody at the outset or during the sale to the buyer.

Engagement Snapshot From the Field

A live engagement with an industry participant carrying material or product regulatory and market exposure ahead of a defining policy shift, showing how our research translates into a defensible multi-year portfolio strategy.
MARKET MINDS ADVISORY · CLIENT ENGAGEMENT SUMMARY
Smart Connected Assets and Operations Producer Strategic Portfolio Review and Transition Roadmap 2026·Investment Scenario on Smart Connected Assets and Operations Exposure Evaluation 2025-26
CLIENT PROFILE
A process manufacturer four years into a connected asset programme covering several thousand instrumented points, with maintenance still running entirely to the original interval schedule. Management had approved expansion to further sites, without establishing why the existing deployment had produced no measurable change in maintenance outcomes anywhere. Nobody had traced alerts through to work orders across four full years of operation.
STRATEGIC CHALLENGE
Engineering wanted expansion to additional sites for coverage consistency. Maintenance wanted the schedule left alone after an early intervention that found nothing wrong. Nobody had connected the two positions, and finance had begun questioning a business case whose promised savings had never appeared in any operating budget. Both positions had gone unexamined for years.
MMA APPROACH
MMA traced condition alerts through to work orders to establish how many produced intervention, and interviewed maintenance supervisors about why they declined to act. We reviewed insurance and warranty terms against condition-based scheduling. Work drew on 47 expert interviews conducted in Q4 2025 with manufacturers, platform vendors and industrial insurers.
KEY FINDINGS
  1. Around 14% of condition alerts produced a work order, and the rest were closed without action by supervisors who saw no mechanism for scheduling early work.
  2. Insurance terms required fully documented interval maintenance, which meant condition-based scheduling would have voided existing cover on 3 major asset classes entirely.
  3. Workflow integration into the maintenance system had never been built, and the original business case had not costed it (client-reported, unverified by MMA).
  4. Expanding to further sites would have replicated a deployment producing alerts that nobody could act upon, at proportionally the same capital cost.
CLIENT PROFILE
A process manufacturer four years into a connected asset programme covering several thousand instrumented points, with maintenance still running entirely to the original interval schedule. Management had approved expansion to further sites, without establishing why the existing deployment had produced no measurable change in maintenance outcomes anywhere. Nobody had traced alerts through to work orders across four full years of operation.
STRATEGIC CHALLENGE
Engineering wanted expansion to additional sites for coverage consistency. Maintenance wanted the schedule left alone after an early intervention that found nothing wrong. Nobody had connected the two positions, and finance had begun questioning a business case whose promised savings had never appeared in any operating budget. Both positions had gone unexamined for years.
MMA APPROACH
MMA traced condition alerts through to work orders to establish how many produced intervention, and interviewed maintenance supervisors about why they declined to act. We reviewed insurance and warranty terms against condition-based scheduling. Work drew on 47 expert interviews conducted in Q4 2025 with manufacturers, platform vendors and industrial insurers.
KEY FINDINGS
  1. Around 14% of condition alerts produced a work order, and the rest were closed without action by supervisors who saw no mechanism for scheduling early work.
  2. Insurance terms required fully documented interval maintenance, which meant condition-based scheduling would have voided existing cover on 3 major asset classes entirely.
  3. Workflow integration into the maintenance system had never been built, and the original business case had not costed it (client-reported, unverified by MMA).
  4. Expanding to further sites would have replicated a deployment producing alerts that nobody could act upon, at proportionally the same capital cost.
RECOMMENDED STRATEGY
Phase 1: Phase one: halt the site expansion, since it would replicate a deployment producing alerts that supervisors have no mechanism to act upon. Phase 2: Phase two: build workflow integration into the maintenance system so alerts generate scheduled work orders with parts and labour attached. Phase 3: Phase three: engage insurers on accepting condition evidence for the three asset classes where cover currently requires strictly documented intervals.
OUTCOME
The manufacturer halted expansion and built the workflow integration layer instead (client-reported, unverified by MMA). Alerts producing work orders rose substantially within two quarters, and insurer discussions opened on two of the three asset classes. Alerts actioned is now the programme metric rather than sensors installed, which outlasted the engagement.

Frequently Asked Questions

Foundational context covering the market sizes, CAGR, scope, country, region and competition that inform every finding below. This section is provided to cover basics and most often pre-purchase conversations, answered from the MMA Primary Research Dataset.

What is the current size of the Smart Connected Assets and Operations Market?

Global value reaches USD 31.6 billion in 2026, measured as connected asset software and services revenue. The 2025 base was USD 28.4 billion on the same basis.

How large will the Smart Connected Assets and Operations Market be by 2036?

The market reaches USD 91.4 billion by 2036, an increase of USD 59.8 billion across the forecast period. That represents 2.89 times expansion from the 2026 base.

What is the CAGR for the Smart Connected Assets and Operations Market 2026 to 2036?

The base case runs at 11.2% annually, with a bull case at 12.5% if insurers accept condition-based intervals and a bear case at 9.9% if deployment fatigue slows programme funding.

Which segment is growing fastest?

Maintenance workflow integration and work order automation grows at 16.8%, half again the market rate of 11.2%. Turning an alert into a scheduled job is what nobody built.

Who are the major companies in the Smart Connected Assets and Operations Market?

Siemens, PTC, Hitachi, ABB and IBM lead on software and services revenue, holding 31% between them. Aveva and Augury hold smaller specialist positions in the category.

Which country is growing fastest?

India leads at 18.4%, because industrial capacity is being built and maintenance practice established rather than defended by an incumbent regime. China and Vietnam follow.

Report Segmentation Architecture

The full report scope spans multiple orthogonal segmentation dimensions, with cross-tabulated demand data provided for each dimension pair. Coverage extends further to regional breakdowns, trend trajectories, and the competitive detail needed to support segment-level decision-making.

By Functional Layer

  • Maintenance Workflow Integration And Work Order Automation
  • Retrofit Sensing Kits For Installed Equipment
  • Asset Performance Analytics And Failure Prediction
  • Condition Monitoring And Diagnostics Platforms
  • Deployment And Integration Services
  • Industrial Connectivity Gateways And Edge Devices

By End-Use Industry

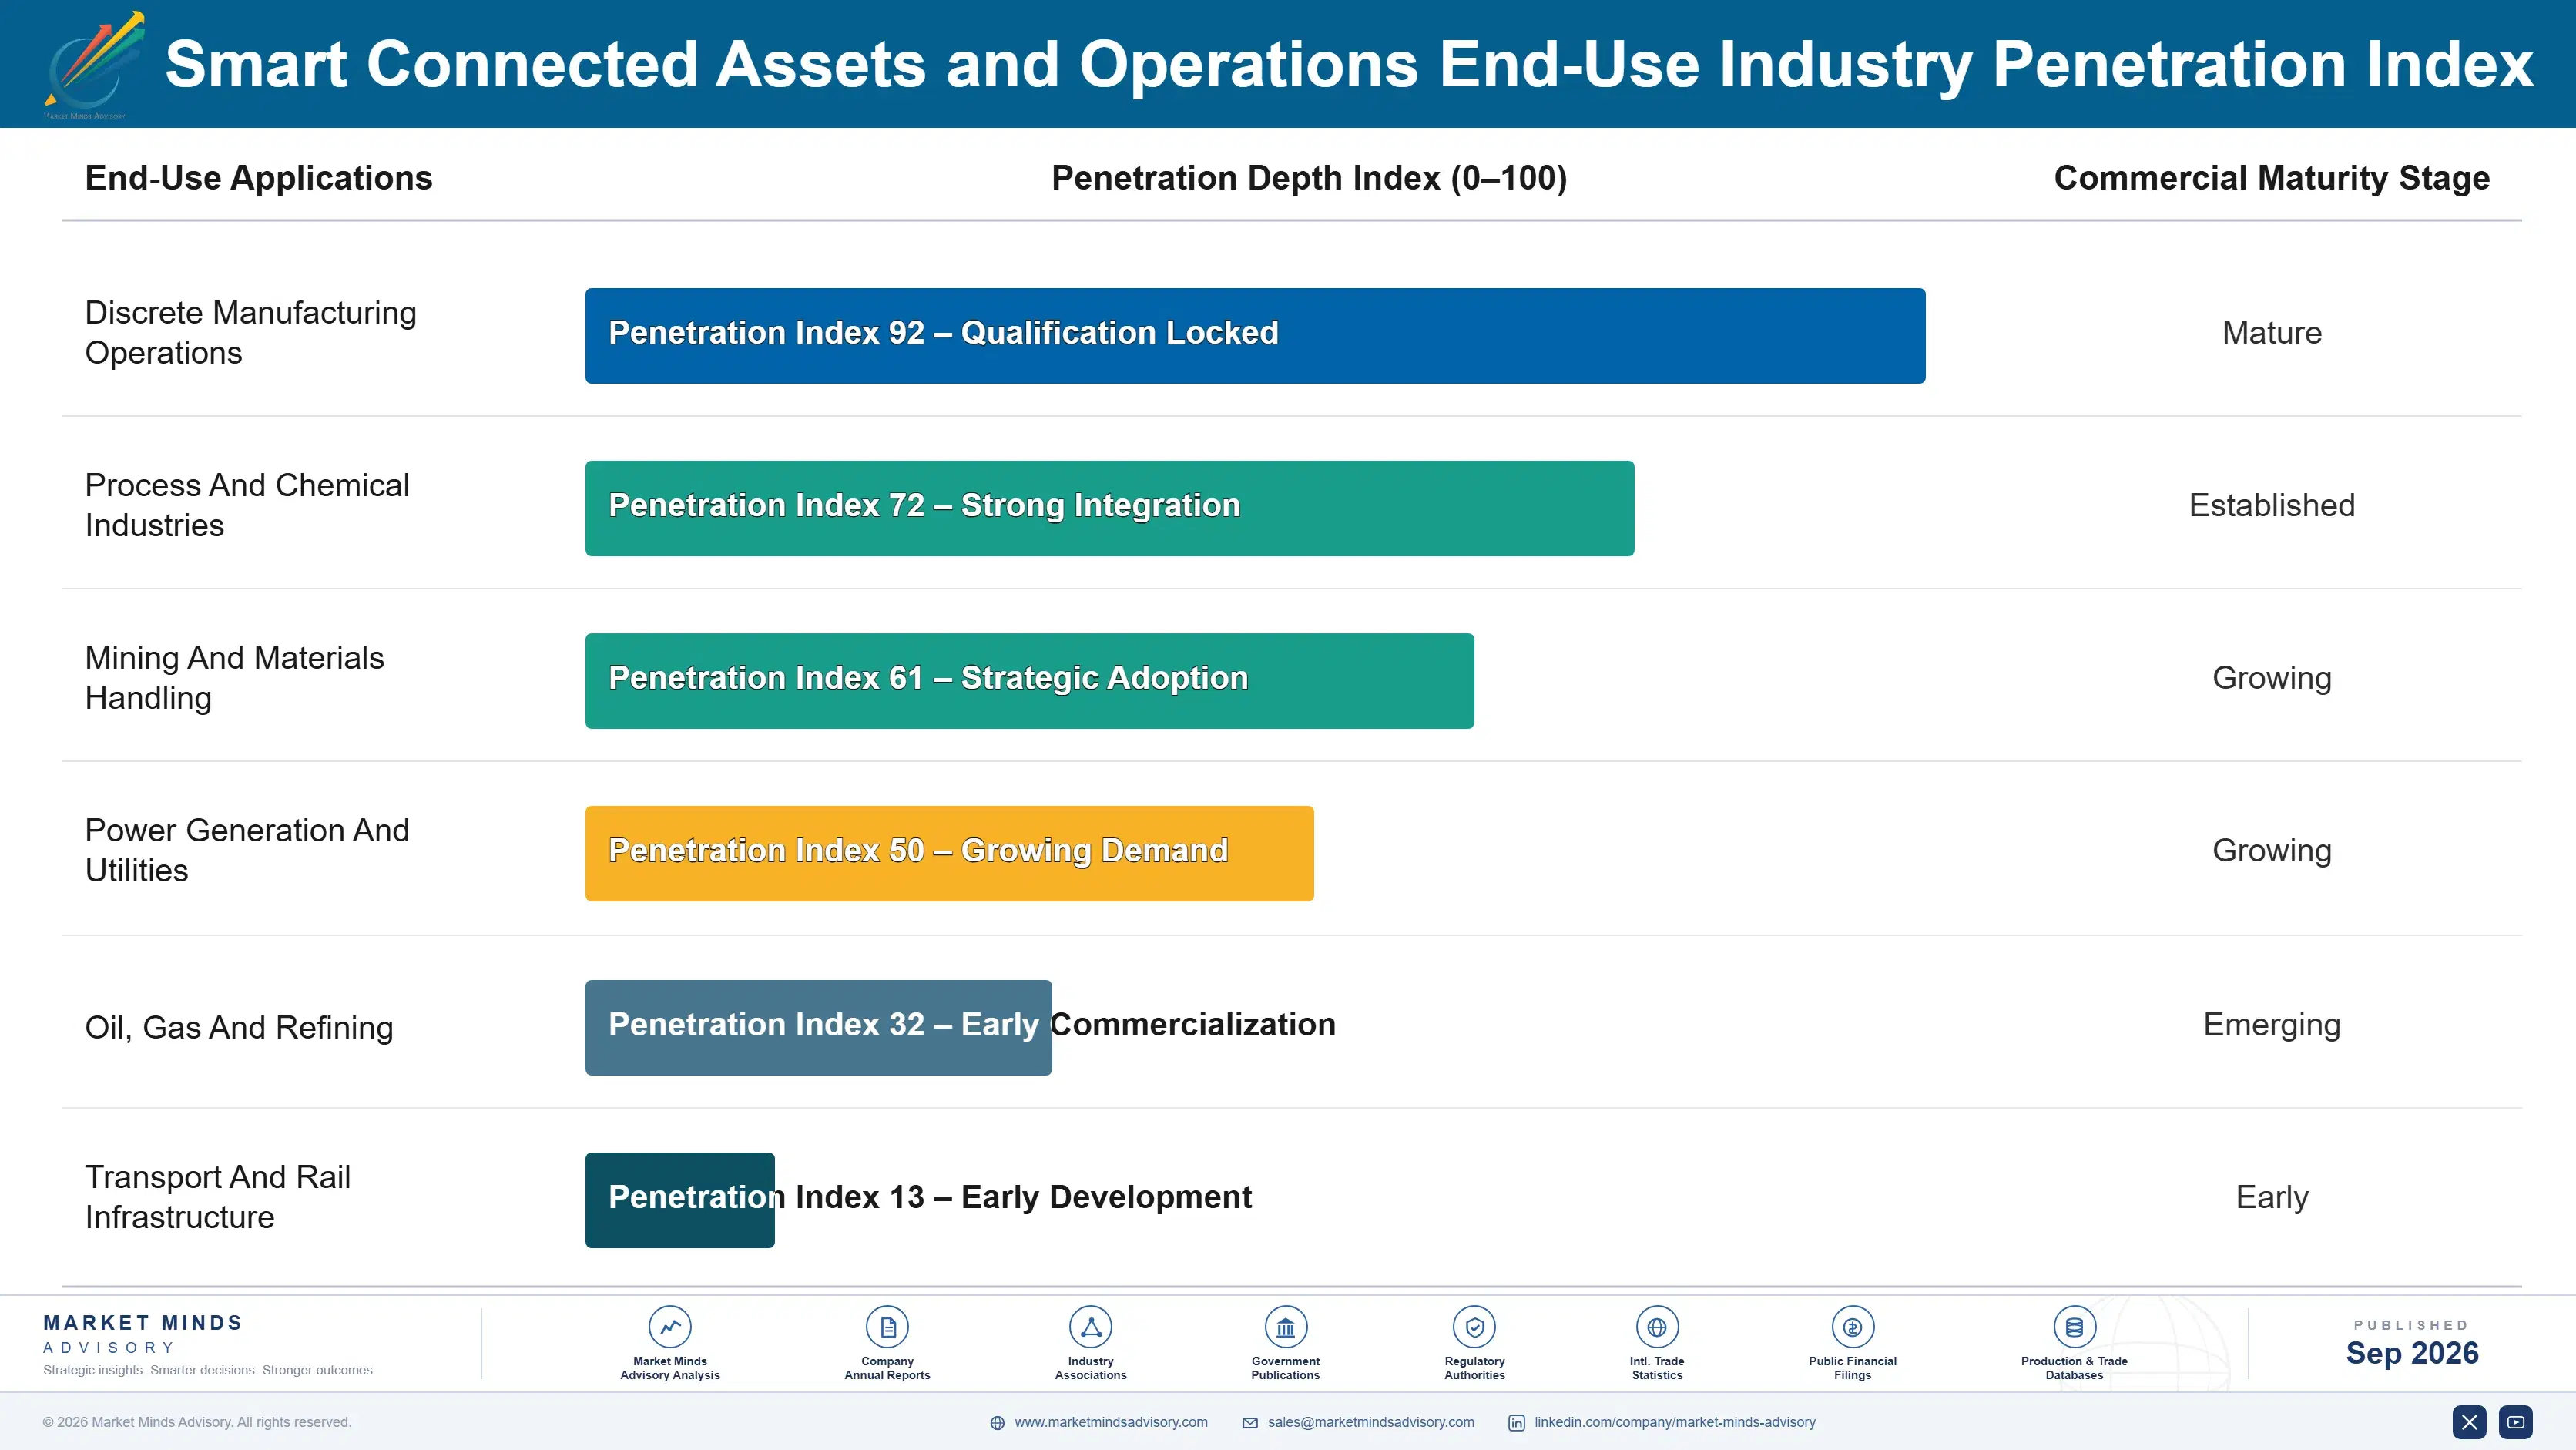
  • Discrete Manufacturing Operations
  • Process And Chemical Industries
  • Mining And Materials Handling
  • Power Generation And Utilities
  • Oil, Gas And Refining
  • Transport And Rail Infrastructure

By Commercial Dimension

  • Direct Enterprise Software Licensing
  • Equipment Manufacturer Bundled Monitoring
  • System Integrator Delivered Programmes
  • Outcome Based Service Contracting
  • Consumption Based Asset Pricing
  • Managed Monitoring Service Delivery

By Region

  • North America
  • Western Europe
  • East Asia
  • South Asia and Pacific
  • Latin America
  • Middle East and Africa
  • Eastern Europe

Scope, Methodology, and Coverage

Every figure in this report is reproducible from documented input assumptions. The scope below maps the historical period, the forecast horizon, the segmentation dimensions, and the countries covered, alongside the underlying primary and qualitative methodology.
Historical Period
2020 to 2025
Forecast Period
2026 to 2036
Base Year
2025 (USD billions; MMA Primary Research Dataset, September 2026)
Market Definition
This report covers smart connected assets and operations: the sensing, connectivity, analytics and workflow software monitoring industrial assets and acting on what it observes, spanning maintenance workflow integration and work order automation, condition monitoring and diagnostics platforms, asset performance analytics and failure prediction, industrial connectivity gateways and edge devices, retrofit sensing kits, and deployment and integration services. It excludes production execution systems, enterprise asset management systems of record, process control hardware, building management systems, and road vehicle telematics.
Quantitative Units
USD millions, connected asset software and services revenue basis; monitored assets and instrumented points; calendar maintenance share as a percentage; alerts producing work orders; retrofit share of monitored equipment; deployment to value periods in months; remaining asset service life in years.
Segmentation Dimensions
Functional layer; end-use industry; commercial delivery route; geography across seven regions.
Regions Covered
North America, Western Europe, East Asia, South Asia and Pacific, Latin America, Middle East and Africa, Eastern Europe
Countries Covered
China, Japan, South Korea, Taiwan, India, Singapore, Australia, Indonesia, United States, Canada, Mexico, Brazil, Chile, Germany, France, Italy, United Kingdom, Poland, Saudi Arabia, South Africa.
Key Companies Profiled
Siemens, PTC, Hitachi, ABB, IBM, SAP, Schneider Electric, Emerson, Honeywell, Rockwell Automation, GE Vernova, Aveva, Augury, Samsara, SKF.
Quantitative Methodology
Primary survey, n=3,800 respondents, Q4 2025, six countries; demand-side model with trade association cross-validation
Qualitative Methodology
47 expert interviews, Q4 2025; applied to validate demand model assumptions, identify emerging dynamics, and assess competitive positioning
Report Format
PDF and XLSX data workbook (Word format preview document)
Publisher
Market Minds Advisory
Report Code
MMA-2026-TEC-281
Published
September 2026
Contact
sales@marketmindsadvisory.com | www.marketmindsadvisory.com

Purchase the full Smart Connected Assets and Operations Market Report (2026 to 2036).

This report sizes the global smart connected assets and operations market from 2026 to 2036 across six functional layers, six industries and seven regions. It explains why around 68% of maintenance stays calendar-driven and only about 19% of condition alerts produce a work order, which is a governance problem rather than a sensing one. Retrofit accounting for around 57% of monitored equipment is analysed as the larger commercial position most platform vendors underweight. Deployment to value at around 22 months is examined against where that time is actually consumed. Regional analysis explains why East Asia holds 32% of spending.
Six functional layers sized through to 2036
Alert action rates quantified against maintenance scheduling practice
Retrofit share analysed against remaining asset service life
Twenty named vendors assessed on connected asset revenue
Four revenue levers with quantified commercial impact
Anonymised manufacturer programme review engagement documented in full

Built For The People Who Decide

From boardroom strategy to bench-side execution, this report is read cover-to-cover by leaders shaping the next decade of their industry, turning demand scenarios, market dynamics and valuation benchmarks into decisions.
CXOs/ Presidents/ VPs/ Managers
M&A and Corporate Development
Strategy Teams and R&D Heads
Procurement and Product Directors
Regulatory and Compliance Leaders
Investor Relations and Equity Analysts