

Market Minds Advisory
Smart Bathroom Market

Smart Bathroom Market: Smart Bathroom Market: Plumber Refusal, Water Regulation and Fixtures That Outlive Their Software 2026 to 2036

A bathroom tap lasts twenty-five years and the software inside it lasts about five. Nobody selling these fixtures has explained what happens in year six, and installers have already noticed.

Lead Analyst

Published

September 2026

Make Smarter Decisions with Customized Research Insights

Request a free sample report and evaluate market opportunities, growth trends, and competitive dynamics relevant to your business needs.

2025 MARKET VALUE$8.6BMarket Size 2025
2036 FORECAST VALUE$24.6BBase Case , 2026 to 2036
CAGR 2026 TO 203610.1 %Bull 11.3% / Bear 8.9%
INCREMENTAL OPPORTUNITY$15.2BNet 10- year value creation
EXPANSION MULTIPLE2.62x2036 value over 2026 base
Strategic Levers
M&A Pipeline
Regional Outlook
Country Rankings
Competitive Intelligence
Segmental Deep-dive
Call-Us : 91 93563 13602

Executive Snapshot and Market Trajectory.

A bathroom fixture lasts around twenty-five years and the software inside it lasts about five. Nobody selling these products has explained convincingly what happens in year six, and the installers who get called back have already noticed. Only around 29% of them recommend these products.
The market reaches USD 9.4 billion in 2026 and USD 24.6 billion by 2036, a 2.62 times expansion at 10.1% annually. Commercial water monitoring and leak detection grows at 15.2%, half again the market rate of 10.1%, because a building operator saves real money where a homeowner saves a novelty. East Asia holds 33% of spending on construction volume and Japanese fixture depth. Commercial buildings carry most revenue.
Five manufacturers hold 44% of spending, moderate for building products, because sanitaryware brands, electronics entrants and commercial specialists compete on entirely different terms. Lixil, Kohler, Toto, Roca Group and Geberit lead. Installer willingness to fit these products decides more than consumer demand does. Around 61% of revenue comes from hotels, offices and public buildings, where a leak is a measurable loss and monitoring systems recover installation cost in roughly three years. Regulation reaches specifiers directly.
Market Definition
This report covers smart bathroom products: sanitaryware, fittings and systems with electronic control, sensing or connectivity built in. It spans commercial water monitoring and leak detection systems, sensor-operated taps and flush systems, smart toilets and bidet seats, digital shower and thermostatic control systems, connected mirrors, lighting and ventilation controls, and the applications and building management integrations supplied with them. It excludes conventional sanitaryware without electronics, whole-building plumbing infrastructure, water heating appliances, general home automation hubs, and bathroom furniture without integrated systems.
Base Year Value
$8.6B in 2025 (MMA Primary Research Dataset, September 2026)
Forecast Period
2026 to 2036, eleven discrete annual values
CAGR
10.1% base case. Bull 11.3%. Bear 8.9%.
Fastest Growth Segment
Commercial Water Monitoring And Leak Detection: 15.2% CAGR
Fastest Growth Country
India: 16.8% CAGR
Fastest Growth Region
South Asia and Pacific: 12.3% CAGR
Largest Region
East Asia: 33% of 2025 global value
Market Leaders
Lixil, Kohler, Toto, Roca Group and Geberit lead on smart bathroom product revenue. Source: MMA Analysis.
Primary Survey
n=3,800 procurement and R&D decision-makers, Q4 2025, six countries
Methodology
Demand-side build-up, cross-validated against public data, 47 expert interviews

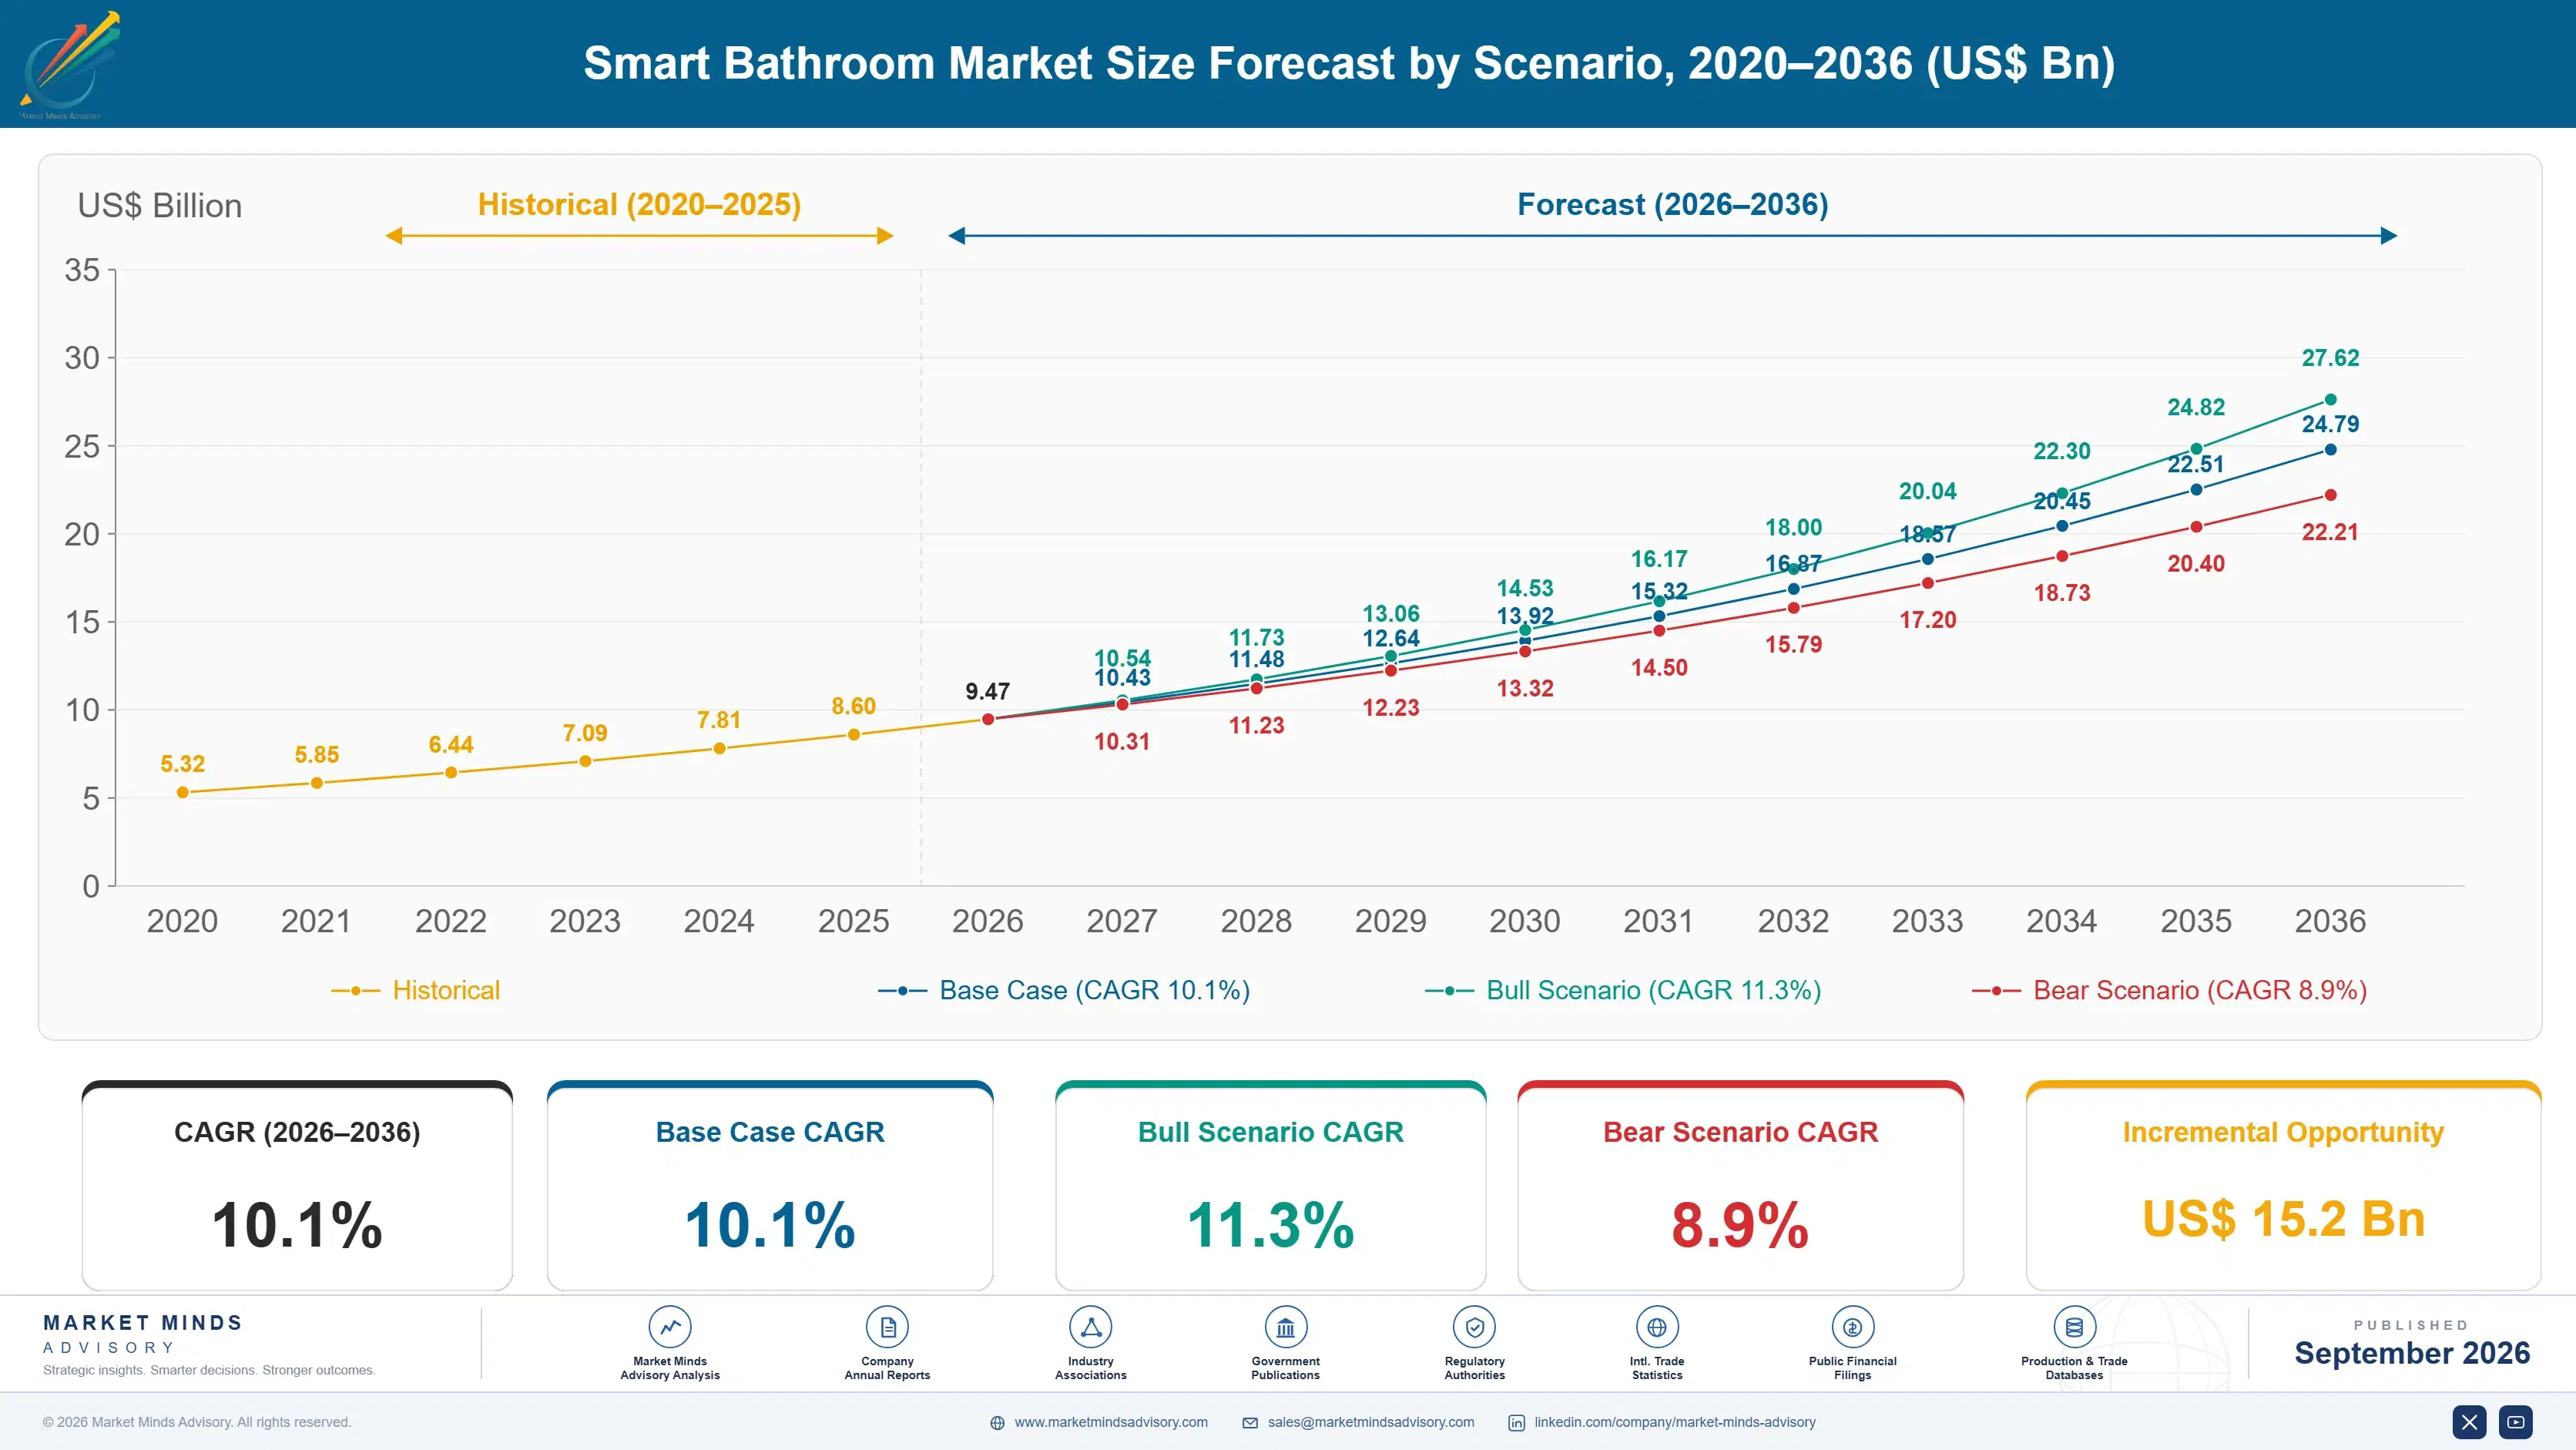
Smart Bathroom Market Forecast Scenarios

smart-bathroom-market-size-forecast-scenario-1790002911717
Between 2020 and 2025 the category compounded at 8.8%, and residential enthusiasm ran well ahead of installation reality. Manufacturers launched connected fixtures into a trade that had no reason to fit them, no training to support them and every reason to recommend something it could service in ten years. Commercial buyers moved faster because water leaks cost them money that homeowners simply never see.
The base case holds 10.1% on three mechanisms. Commercial water monitoring keeps expanding because a leak in a hotel or office is a measurable loss rather than an inconvenience. Water restriction regulation keeps tightening across water-stressed regions, which makes flow control a compliance requirement rather than a feature. And new construction keeps specifying sensor fittings in public and commercial washrooms as a hygiene standard rather than a choice. Those three mechanisms run largely independently.
The bull case at 11.3% assumes water pricing rises far enough that residential monitoring reaches a genuine payback, which would open a market that novelty has not. The bear case at 8.9% is a service reputation problem, where early connected fixtures reach software end of life while still plumbed in and the trade turns decisively against specifying anything with electronics inside it.

The Plumber Decides

The person who decides is not the person who buys. Only around 29% of trade installers actively recommend connected fixtures to residential customers, because they get called back when something stops working and they have no way to fix software. A fixture lasts around 25 years while its software gets updates for about five, and no manufacturer has a convincing answer for the twenty years in between.
TOP FIVE CONCENTRATION44%Moderate, reflecting sanitaryware brands competing against electronics entrants
FIXTURE SERVICE LIFE25 yearsExpected working life of installed sanitaryware and bathroom fittings
SOFTWARE SUPPORT PERIOD5 yearsTypical period connected fixture software receives updates after purchase
INSTALLER RECOMMENDATION RATE29%Trade installers actively recommending connected fixtures to residential customers
COMMERCIAL REVENUE SHARE61%Revenue from hotels, offices and public buildings rather than homes
LEAK DETECTION PAYBACK3 yearsTypical period for commercial monitoring systems to recover installation cost
Commercial buyers found a reason that residential buyers never did. Around 61% of revenue comes from hotels, offices and public buildings, where a leak is a measurable loss and monitoring systems recover installation cost in around three years. Commercial water monitoring and leak detection grows at 15.2% against 10.1% for the market. A building operator can calculate the saving; a homeowner is buying a preference.
Regulation is doing more than any product feature. Water restriction rules across water-stressed regions increasingly make flow control a compliance requirement rather than a choice, and public washroom hygiene standards specify sensor operation regardless of what anybody prefers. Those requirements reach specifiers and building codes, which is a considerably more reliable route to volume than persuading consumers to want something.
"Ask a plumber what they think of connected taps and you will get a very short answer. They are the ones standing in a bathroom in year eight explaining that the app no longer works and the manufacturer has moved on. Until somebody solves that, this stays a commercial market."
Director, Building Products and Water Technology Practice · MMA Construction and Industrial Equipment Practice · September 2026

Market Trends

Software Lifespan Falls Far Short Of Fixture Life

A bathroom fixture lasts around 25 years while the software inside it receives updates for roughly five, and no manufacturer has a convincing answer for the two decades in between. Installers get called back when something stops working and have no way to repair software they did not write. Only around 29% of trade installers actively recommend connected fixtures to residential customers, and that reluctance caps residential adoption far more effectively than price does. Manufacturers committing to long support periods and graceful degradation to conventional operation are the only ones addressing the objection at all.
Market Impact: India compounds at 16.8% yearly

Commercial Buyers Calculate What Homeowners Cannot

Around 61% of revenue comes from hotels, offices and public buildings, because a leak there is a measurable loss and monitoring recovers installation cost in roughly three years. Commercial water monitoring and leak detection grows at 15.2% against 10.1% for the market. A building operator produces a payback figure while a homeowner is buying a preference, and manufacturers selling both keep discovering that the residential proposition rests on enthusiasm rather than arithmetic. Insurers pressing building owners on water damage claims have added a second route into exactly the same decision.
Market Impact: East Asia holds 33% of spending

Market Opportunities and Growth Drivers

Water Regulation Converts Features Into Requirements

Water restriction rules across water-stressed regions increasingly make flow control and consumption monitoring compliance requirements rather than optional features anybody chooses. Public washroom hygiene standards specify sensor operation regardless of preference. Those requirements reach specifiers and building codes rather than consumers, which is a considerably more reliable route to volume than persuasion. India compounds at 16.8% partly on regulation arriving alongside construction rather than years afterwards. Consumer marketing persuades people whose plumber then talks them out of it during the quotation, which is why regulation converts where advertising does not.
Market Impact: Only 29% of installers recommend

Construction Volume Specifies At Design Rather Than Retrofit

New commercial and residential construction specifies connected fittings during design, where wiring, drainage and mounting are settled before anything is built and the installer objection never arises. East Asia holds 33% of spending largely on that basis. Retrofit into existing bathrooms is considerably harder, since power and connectivity rarely exist where fixtures sit. That divide is why this category grows with building programmes rather than with the far larger installed base. Battery and turbine-generator powered fittings are the only products that reach retrofit demand at any meaningful scale. Walls decide everything here.
Market Impact: Software lasts only 5 years

Market Restraints and Challenges

Installers Refuse What They Cannot Service

Only around 29% of trade installers actively recommend connected fixtures to residential customers, because they are the ones standing in a bathroom explaining that software no longer works. The root cause is that a fixture lasting 25 years carries software supported for about five. Commercially this caps residential adoption regardless of consumer interest. Mitigation runs through extended support commitments, through degradation to conventional operation when connectivity fails, and through installer training and warranty terms. The trade forms its view from year eight callbacks rather than from anything a manufacturer publishes at launch.
Market Impact: Fixtures outlive software 5 times

Retrofit Requires Power Where None Exists

Existing bathrooms rarely carry power or connectivity where fixtures sit, which makes retrofit considerably more disruptive than replacing a conventional fitting. The root cause is that bathroom electrical provision is settled during construction and regulated tightly for safety reasons. Commercially this confines growth to building programmes. Mitigation runs through battery and generator-powered fittings, through low-power wireless designs, and through products targeting refurbishment cycles when walls are open anyway. Refurbishment cycles when walls are already open are the practical window, and they arrive rarely across any installed base. Timing is the constraint.
Market Impact: Commercial supplies 61% of revenue
3 additional market trends, 4 additional growth drivers, and 2 additional restraints and challenges are covered in the full report. Contact sales@marketmindsadvisory.com to access the complete intelligence.

Segment CAGR and Growth Architecture

Segmentation follows product class and buyer context, since each carries quite different installation constraint, payback logic and service exposure. Six classes cover the market: commercial water monitoring and leak detection, sensor-operated taps and flush systems, digital shower and thermostatic control, smart toilets and bidet seats, connected mirrors, lighting and ventilation controls, and building management integration software.
smart-bathroom-market-market-share-analysis-1790002912348

Commercial Water Monitoring And Leak Detection

Commercial water monitoring and leak detection grows at 15.2%, half again the market rate of 10.1%, because a leak in a hotel or office building is a measurable loss and these systems recover installation cost in around three years. Around 61% of category revenue already comes from commercial buildings for related reasons. The buyer produces a payback figure rather than expressing a preference, which makes the sale considerably more predictable and largely insulates this segment from the installer reluctance limiting residential adoption elsewhere. Insurance pressure on water damage claims adds a second route into the same building operator decision. That combination makes it the most predictable revenue anywhere in this category.
CAGR 15.2%

Sensor-Operated Taps And Flush Systems

Sensor-operated taps and flush systems compound at 12.6% because public washroom hygiene standards specify sensor operation regardless of anybody's preference, which converts a product feature into a building code requirement. These fittings are also the most established connected products in the category, with service practices the trade already understands and battery-powered options that avoid the retrofit power problem entirely. That combination makes them the one connected fixture class installers fit without argument, which matters more commercially than any product advantage. Battery powered options also avoid the retrofit power obstacle entirely, which no other connected fitting class manages as cleanly. Service practices are already familiar to the trade. Argument rarely arises here.
CAGR 12.6%
Full segment breakdown across 6 segments available in the complete report.

Regional Architecture and Country Demand Map

East Asia holds 33% of spending, above the usual band, because construction volume, Japanese fixture technology depth and cultural adoption of advanced sanitaryware all reinforce one another. Western Europe follows at 22% on water regulation and commercial specification. India compounds fastest at 16.8% on regulation arriving with construction.

East Asia

East Asia takes 33% of spending, above the 30% band ceiling, because construction volume, Japanese fixture technology depth and long-established cultural adoption of advanced sanitaryware all reinforce one another directly. Toto and Lixil built the category here decades before it existed anywhere else, and Japanese households replace toilets with connected models as a normal purchase rather than a novelty. Chinese construction specifies at design stage at enormous volume. Growth at 11.1% runs above the global rate on construction rather than replacement. Trade familiarity built across decades here does not transfer to Western markets, which is why the same products face entirely different resistance elsewhere. Replacement demand is genuinely large. Novelty never applied here.
Share: 33% | CAGR: 11.1% (2026 to 2036)

Western Europe

Western Europe accounts for 22% of spending, where water restriction regulation and commercial building specification drive considerably more demand than residential preference does. Geberit and Roca Group both hold strong specification positions with architects and building services engineers. Trade installer reluctance is pronounced here, and residential adoption trails commercial substantially as a result. Growth at 8.5% is the slowest of any region, on mature construction volumes rather than any absence of regulatory pressure or product availability. Specification through architects and building services engineers is how almost all regional volume reaches a building at all. Residential adoption trails commercial substantially, and installer reluctance rather than regulation or product availability is what accounts for the gap.
Share: 22% | CAGR: 8.5% (2026 to 2036)
Regional intelligence for 5 additional markets available in the complete report: North America, South Asia and Pacific, Latin America, Middle East and Africa, Eastern Europe. Contact sales@marketmindsadvisory.com.
smart-bathroom-market-country-cagr-analysis-1790002913243

Where Bathroom Fixtures Are Won

Installers rather than consumers decide what gets fitted, commercial buyers can calculate a payback that homeowners cannot, and regulation reaches specifiers more reliably than marketing reaches anybody. The four levers below follow those conditions rather than any argument about product features. Each addresses a channel condition rather than a product one. Product features come last.

Commit To Support Beyond The Warranty Period

A fixture lasts around 25 years while its software gets updates for about 5, and only around 29% of installers recommend connected products because they get called back when it stops working. Manufacturers committing to long support periods and graceful degradation to conventional operation address the objection directly. That commitment costs real money and it is the only thing that converts the trade, which decides residential adoption far more than any consumer campaign does. Consumer campaigns reach nobody who decides. Support commitment converts the trade. Nothing else has worked. Trade opinion decides.
Market Impact: Only 29% of installers now recommend these products

Sell Payback To Buildings, Preference To Nobody

Around 61% of revenue comes from commercial buildings where monitoring recovers installation cost in roughly 3 years and a leak is a measurable loss. That buyer produces a figure rather than a feeling. Manufacturers marketing lifestyle benefits into residential channels are competing for enthusiasm while their commercial competitors compete on arithmetic, and the arithmetic converts considerably more reliably across every economic condition. Monitoring recovers installation cost in around 3 years on water savings alone, and insurers increasingly press the same building owners on water damage exposure. Preference does not survive scrutiny.
Market Impact: Commercial now supplies a full 61% of revenue

Reach Specifiers Through Regulation Not Advertising

Water restriction rules and public washroom hygiene standards increasingly make flow control and sensor operation compliance requirements rather than choices. Those requirements reach architects, building services engineers and codes rather than consumers. Manufacturers positioned with specifiers capture demand that regulation creates automatically, while those spending on consumer marketing are persuading people whose plumber will talk them out of it during the quotation anyway. Regulation converts around 61% of category revenue through commercial buildings without persuading a single consumer of anything. Codes carry demand automatically. Quotation is where consumer interest dies.
Market Impact: Commercial payback now runs about 3 short years

Design Around The Retrofit Power Problem

Existing bathrooms rarely carry power where fixtures sit, and bathroom electrical provision is regulated tightly for safety, which makes retrofit far more disruptive than replacing a conventional fitting. Battery and turbine-generator powered fittings remove that obstacle entirely. Manufacturers requiring mains connection are confined to new construction and to refurbishments where walls are already open, which is a small fraction of the installed base at any time. A fixture lasting 25 years against software supported for 5 makes the retrofit question harder still, since nobody wants to open walls twice. Retrofit stays hard.
Market Impact: Fixtures now outlive their software fully 5 times

Who Controls the Margin Pool

Five manufacturers hold 44% of smart bathroom spending, moderate for building products, because established sanitaryware brands, electronics entrants and commercial water management specialists compete on entirely different terms and rarely appear on the same shortlist. Lixil, Kohler, Toto, Roca Group and Geberit lead. All participants are assessed on smart bathroom product revenue rather than on broader sanitaryware, building products or water technology businesses. Concentration is unlikely to rise while three quite different types of participant keep entering from separate directions.
Competition runs on specification position and trade acceptance far more than on product capability, which converges quickly across serious manufacturers. The second dimension is service and support commitment, because a fixture outliving its software by two decades is the objection that decides residential adoption and no manufacturer has answered it convincingly.

Pressure is emerging from commercial water management specialists who reach building operators through the payback argument rather than through sanitaryware channels. Rankings shift where construction specifies at design stage and where water regulation tightens, particularly across India, the Gulf and East Asia at present. Sanitaryware brands without water management depth carry the most exposure to that entry.
smart-bathroom-market-company-positioning-matrix-1790002914169

Competitive Moat and Risk Dimensions

TOTO

Moat: Category Establishment Depth

Toto built connected sanitaryware into a normal household purchase across Japan decades before the category existed elsewhere, which gives it manufacturing scale, service practice and trade familiarity no competitor has matched. Installers there fit these products without the reluctance visible in Western markets. That established base also funds development that manufacturers entering recently must justify against uncertain volumes.
TOTO

Risk: Western Trade Resistance

Trade familiarity built across decades in Japan does not transfer to Western markets where only around 29% of installers recommend connected fixtures and service practices are unfamiliar. Product quality does not address that objection. Category leadership in one market and trade resistance in others leaves growth dependent on markets where the installer problem remains entirely unsolved.
GEBERIT

Moat: Specification Channel Position

Geberit holds specification relationships with architects and building services engineers who decide commercial washroom fittings before construction begins, which is where regulation-driven demand actually lands. Around 61% of category revenue comes from commercial buildings. Competitors reaching consumers or retail channels are addressing a decision that specifiers have usually already taken during design.
GEBERIT

Risk: Residential Channel Absence

Commercial specification strength leaves residential volume to competitors whenever the installer objection is eventually solved and that market opens. Building specification is a narrower base than housing. A position concentrated in commercial washrooms grows with construction cycles rather than with the far larger replacement demand that residential bathrooms generate continuously.

Players Tracked

Prominent Players

Lixil
Kohler
Toto
Roca Group
Geberit

Other Key Players

Grohe
Hansgrohe
Villeroy and Boch
Duravit
Ideal Standard
Moen
Delta Faucet
Jaquar Group
Cera Sanitaryware
Sloan Valve
Zurn Elkay
Bradley Corporation
Oras Group
Vitra
Panasonic

Recent Developments

MARCH 2025

Insurers Press Building Owners On Water Damage Prevention

Property insurers increasingly required or incentivised leak detection systems in commercial buildings during policy renewal, an underwriting development rather than any corporate transaction. Monitoring systems recover installation cost in around three years on water savings alone, and insurance pressure adds a second route into the same building operator decision.
Signal: Insurance pressure now reaches building owners through a channel that product marketing never reaches at all.
SEPTEMBER 2024

Early Connected Fixtures Reach Software End Of Support

Connected bathroom fixtures installed in the previous decade began losing application support while remaining plumbed in and functional, a product lifecycle development rather than any corporate event. Fixtures last around twenty-five years while software receives updates for roughly five, and installers are the ones explaining that gap to customers.
Signal: The trade forms its view from year eight callbacks rather than from any launch material a manufacturer publishes.
JUNE 2025

Indian Water Regulation Arrives Alongside Construction Programmes

Indian water restriction rules and building standards tightened alongside major construction activity, a regulatory development rather than any acquisition. India compounds at 16.8%, and regulation arriving with construction rather than years afterwards means specification happens at design stage where installation objections never arise at all.
Signal: Regulation reaching specifiers converts the demand that consumer persuasion has consistently and expensively failed to reach.

What A Fixture Costs

Ceramic body, brassware and mechanical components absorb roughly 41% of connected fixture cost, and those inputs move with energy and metal prices that no manufacturer controls. Electronics including sensors, valves and control boards take around 23%. Software development and ongoing support absorb about 14%, and that spending continues long after the unit has shipped and been paid for.
Brass and ceramic firing energy costs rose sharply across European manufacturing through 2022 and 2023 while electronics content pulled the same components automotive and appliance demand also required. Geberit Annual Report 2024 and Lixil Annual Report 2024 both record energy and component cost among principal operating variables. Manufacturers with Asian ceramic capacity absorbed considerably less of the firing energy exposure than European producers did. Freight against energy cost moved decisively one way.

The competitive disadvantage mechanism is post-sale software cost rather than manufacturing input price. A manufacturer supporting connected fixtures carries development and hosting cost across a base that keeps growing while revenue from those units was collected once at sale. Exposure concentrates among manufacturers with large connected installed bases and no recurring revenue, since every additional unit shipped adds support obligation without adding anything to offset it.
smart-bathroom-market-cost-volatility-analysis-1790002914511

Design Graceful Degradation To Conventional Operation

Software development and support absorb about 14% of cost and continue long after revenue was collected at sale, while fixtures last around twenty-five years. Products that keep working as conventional fittings when connectivity ends cap that obligation without stranding a customer. The engineering discipline is deciding what the fixture must still do with no software at all behind it.

Source Ceramic Capacity Away From High Energy Costs

Ceramic body and brassware absorb roughly 41% of fixture cost and firing energy is the largest single variable within it across European production. Asian ceramic capacity carries materially lower energy exposure at equivalent quality. The trade is freight and lead time against energy cost, and it moved decisively in one direction across the past three years.

Attach Recurring Revenue To Connected Commercial Systems

Connected fixtures generate support obligation without recurring revenue when sold as products alone, and the installed base grows faster than the shipment revenue supporting it. Commercial monitoring sold as a subscribed service aligns the two properly. Building operators accept that model where homeowners will not, which is another reason commercial applications carry better economics than residential ones.

Portfolio Architecture for Margin Defence

Margin architecture separates on buyer type rather than on product sophistication. Connected mirrors, lighting and ventilation controls earn least, since they compete against general home automation products with no plumbing barrier. Smart toilets and digital showers sit above on fixture value. Commercial water monitoring, sensor taps and building management integration earn most, because each reaches a buyer with an arithmetic case rather than a preference.
The volume versus premium tension runs between residential fixtures and commercial systems, which reward opposite commercial behaviour entirely. Residential requires retail and trade channel coverage against installer reluctance and consumer price sensitivity. Commercial requires specification relationships and payback evidence at far better margins. Manufacturers built for residential distribution find the commercial specification channel difficult to enter and slow to reward.

High-value pools concentrate in commercial monitoring and in specification-driven sensor fittings, and neither is reached through consumer brand strength. Monitoring requires water management expertise and building integration that sanitaryware brands rarely hold. Specification requires architect and engineer relationships built over years. Both explain why five manufacturers hold only 44% while water management specialists take share from a completely different direction.

Volume / Commodity-Adjacent

Connected mirrors, lighting and ventilation controls, competing directly against general home automation products that carry no plumbing installation barrier at all. The twelve point spread separates manufacturers sourcing electronics at scale from those specifying bespoke assemblies for low volumes.
Gross Margin: 24% to 36%

Premium / Certified

Smart toilets and bidet seats and digital shower and thermostatic control systems, where fixture value and brand position support pricing that accessories cannot reach. The thirteen point spread tracks ceramic and brassware sourcing exposure against manufacturers producing in lower energy cost locations.
Gross Margin: 41% to 54%

Sustainability / Regulatory / Next-Generation

Commercial water monitoring and leak detection, sensor-operated taps and flush systems and building management integration software, each reaching a buyer with an arithmetic case. The sixteen point spread reflects specification channel depth and whether recurring revenue attaches to the installed base.
Gross Margin: 58% to 74%
smart-bathroom-market-portfolio-architecture-1790002915387

High-value Sub-segments and Strategic Watch-out

Commercial Water Monitoring And Leak Detection

Grows at 15.2% because a leak in a hotel or office is a measurable loss recovered in around three years. The sixteen point spread reflects recurring revenue attachment. Insurance pressure adds a second route into the same building operator decision. Buyers produce a figure rather than a preference.
Gross Margin: 58% to 74%

Sensor-Operated Taps And Flush Systems

Grows at 12.6% because public washroom hygiene standards specify sensor operation regardless of anybody's preference. The sixteen point spread reflects specification depth. Battery powered options avoid the retrofit power problem that constrains other connected fittings. The trade fits these without argument. Codes rather than preference specify them.
Gross Margin: 58% to 74%

Smart Toilets And Bidet Seats

Grows at 9.4% on established Japanese demand and slower Western adoption held back by installer reluctance. The thirteen point spread reflects ceramic sourcing exposure. Software support obligation attaches to a fixture lasting twenty-five years in service. Japanese households replace these as normal purchases. Western adoption trails badly.
Gross Margin: 41% to 54%

Connected Mirrors, Lighting And Ventilation Controls

Grows at 6.7%, slowest of the six classes, competing against general home automation products with no plumbing barrier protecting them. The twelve point spread reflects electronics sourcing scale. Differentiation against consumer electronics brands is genuinely difficult here. No plumbing barrier protects this category. Consumer brands compete directly.
Gross Margin: 24% to 36%

Why Trades Gate Adoption

The annuity here is the specification rather than the customer. A fitting specified into a building code or a commercial standard sells continuously without persuading anybody, because compliance rather than preference drives the purchase. Around 61% of revenue arrives that way through commercial buildings. A residential fixture must be wanted by a consumer and then approved by an installer who gets called back in year eight, which is a much harder sale.
Depth varies by who has to service the product. A commercial building has a maintenance contract, a facilities team and a supplier relationship that continues after installation. A household has a plumber found through a search who has never seen that product before and cannot get parts for it in year twelve. That difference explains the two channels entirely.

The buyer has moved toward the specifier and away from the consumer. A homeowner evaluated appearance and features against a renovation budget and a plumber's opinion. A building services engineer evaluates compliance with water and hygiene standards against a design package. A facilities manager evaluates leak losses against a payback figure. Only the first buyer has to be persuaded, and only the first one usually says no.
smart-bathroom-market-end-use-penetration-index-1790002916177

What Wins Bathroom Specifications

These are among the four positions where our research anticipates prominent divergence between winners and laggards over the coming forecast period. Each is grounded in the demand model, the regulatory perimeter, and the announced capacity pipeline.
01 / SUPPORT COMMITMENT LENGTH

Promise The Twenty Years, Not Five

A bathroom fixture lasts around twenty-five years while the software inside it receives updates for roughly five, and only around 29% of installers recommend connected products because they are the ones explaining that gap. Manufacturers committing to long support periods and graceful degradation to conventional operation address the objection directly and expensively. That commitment is the only thing that converts a trade which decides residential adoption far more than any consumer campaign ever will reach a homeowner at all in the first place.
02 / PAYBACK BUYER TARGETING

Sell Arithmetic, Not Aspiration

Around 61% of category revenue comes from commercial buildings where water monitoring recovers installation cost in roughly three years and a leak is a measurable operating loss. That buyer produces a figure while a homeowner is expressing a preference about their bathroom. Manufacturers marketing lifestyle benefits into residential channels compete for enthusiasm while commercial competitors compete on arithmetic that converts far more reliably in any economic condition, including a difficult one and against every competitor selling on feelings rather than numbers.
03 / SPECIFICATION CHANNEL ACCESS

Follow Codes, Not Consumer Campaigns

Water restriction rules and public washroom hygiene standards increasingly make flow control and sensor operation compliance requirements rather than choices anybody makes voluntarily. Those requirements reach architects, building services engineers and building codes rather than consumers directly. Manufacturers positioned with specifiers capture demand regulation creates automatically, while consumer marketing spend persuades people whose plumber talks them out of it during the quotation before anything is ordered, which is where the residential proposition reliably dies before any order is placed anywhere.
04 / POWER INDEPENDENCE DESIGN

Work Without Rewiring The Bathroom

Existing bathrooms rarely carry power where fixtures sit and bathroom electrical provision is tightly regulated for safety, which makes retrofit far more disruptive than replacing a conventional fitting would be. Battery and turbine-generator powered fittings remove that obstacle completely. Manufacturers requiring mains connection are confined to new construction and to refurbishments where walls happen to be open, which is a small fraction of the installed base at any given moment across any national housing stock in any given year anywhere.

Engagement Snapshot From the Field

A live engagement with an industry participant carrying material or product regulatory and market exposure ahead of a defining policy shift, showing how our research translates into a defensible multi-year portfolio strategy.
MARKET MINDS ADVISORY · CLIENT ENGAGEMENT SUMMARY
Smart Bathroom Producer Strategic Portfolio Review and Transition Roadmap 2026·Investment Scenario on Smart Bathroom Exposure Evaluation 2025-26
CLIENT PROFILE
A sanitaryware manufacturer with a connected residential range selling well below plan while its commercial sensor fittings exceeded target, and a growing support obligation on units shipped years earlier. Management had approved additional consumer marketing spend, without establishing why the residential range was failing in the channel it depended on. Nobody had asked the installers anything.
STRATEGIC CHALLENGE
Marketing wanted more consumer advertising to build residential demand. Engineering wanted a new connected feature set to differentiate against competitors. Nobody had asked installers anything, and the support obligation on the existing connected base was rising while the revenue from those units had been collected years earlier. Both proposals assumed the problem was demand.
MMA APPROACH
MMA surveyed trade installers on what they recommended and why, and traced residential sales that reached quotation against those that completed. We modelled the growing software support obligation against the shipped connected base and its remaining service life. Work drew on 47 expert interviews conducted in Q4 2025 with installers, specifiers and building operators.
KEY FINDINGS
  1. Around 68% of residential enquiries that reached quotation were talked out of the connected option by the installer rather than lost on price.
  2. Installers cited inability to service or repair the software as the primary reason, rather than product quality or the customer's own budget constraints.
  3. Support obligation on the shipped connected base would exceed the original margin on those units within 7 years (client-reported, unverified by MMA).
  4. Commercial fittings sold through specification channels never encountered the installer objection at all, because the decision had already been taken at design stage.
CLIENT PROFILE
A sanitaryware manufacturer with a connected residential range selling well below plan while its commercial sensor fittings exceeded target, and a growing support obligation on units shipped years earlier. Management had approved additional consumer marketing spend, without establishing why the residential range was failing in the channel it depended on. Nobody had asked the installers anything.
STRATEGIC CHALLENGE
Marketing wanted more consumer advertising to build residential demand. Engineering wanted a new connected feature set to differentiate against competitors. Nobody had asked installers anything, and the support obligation on the existing connected base was rising while the revenue from those units had been collected years earlier. Both proposals assumed the problem was demand.
MMA APPROACH
MMA surveyed trade installers on what they recommended and why, and traced residential sales that reached quotation against those that completed. We modelled the growing software support obligation against the shipped connected base and its remaining service life. Work drew on 47 expert interviews conducted in Q4 2025 with installers, specifiers and building operators.
KEY FINDINGS
  1. Around 68% of residential enquiries that reached quotation were talked out of the connected option by the installer rather than lost on price.
  2. Installers cited inability to service or repair the software as the primary reason, rather than product quality or the customer's own budget constraints.
  3. Support obligation on the shipped connected base would exceed the original margin on those units within 7 years (client-reported, unverified by MMA).
  4. Commercial fittings sold through specification channels never encountered the installer objection at all, because the decision had already been taken at design stage.
RECOMMENDED STRATEGY
Phase 1: Phase one: stop the additional consumer marketing spend, since roughly 68% of quoted residential enquiries were lost at the installer rather than to competitors. Phase 2: Phase two: commit to a long support period with graceful degradation to conventional operation, and train installers on servicing what remains. Phase 3: Phase three: shift range investment toward commercial specification fittings, where the installer objection never arises during the purchase decision at all.
OUTCOME
The manufacturer stopped its consumer campaign, committed to extended support with conventional fallback and redirected range investment toward commercial fittings (client-reported, unverified by MMA). Installer recommendation improved measurably once servicing was addressed, and commercial revenue grew ahead of plan. Support obligation is now modelled before any connected product launch.

Frequently Asked Questions

Foundational context covering the market sizes, CAGR, scope, country, region and competition that inform every finding below. This section is provided to cover basics and most often pre-purchase conversations, answered from the MMA Primary Research Dataset.

What is the current size of the Smart Bathroom Market?

Global value reaches USD 9.4 billion in 2026, measured as smart bathroom product revenue across six classes. The 2025 base was USD 8.6 billion on the same basis.

How large will the Smart Bathroom Market be by 2036?

The market reaches USD 24.6 billion by 2036, an increase of USD 15.2 billion across the forecast period. That represents 2.62 times expansion from the 2026 base.

What is the CAGR for the Smart Bathroom Market 2026 to 2036?

The base case runs at 10.1% annually, with a bull case at 11.3% if water pricing gives residential monitoring a payback and a bear case at 8.9% if trade resistance hardens further.

Which segment is growing fastest?

Commercial water monitoring and leak detection grows at 15.2%, half again the market rate of 10.1%. A leak in a hotel or office is a measurable loss.

Who are the major companies in the Smart Bathroom Market?

Lixil, Kohler, Toto, Roca Group and Geberit lead on smart bathroom revenue, holding 44% between them. Grohe and Hansgrohe hold smaller positions in the category.

Which country is growing fastest?

India leads at 16.8%, as water regulation arrives alongside construction rather than years afterwards and specification happens at design stage. Saudi Arabia and Vietnam follow.

Report Segmentation Architecture

The full report scope spans multiple orthogonal segmentation dimensions, with cross-tabulated demand data provided for each dimension pair. Coverage extends further to regional breakdowns, trend trajectories, and the competitive detail needed to support segment-level decision-making.

By Product Class And Buyer Context

  • Commercial Water Monitoring And Leak Detection
  • Sensor-Operated Taps And Flush Systems
  • Building Management Integration Software
  • Smart Toilets And Bidet Seats
  • Digital Shower And Thermostatic Control
  • Connected Mirrors, Lighting And Ventilation Controls

By End-Use Industry

  • Hotels And Hospitality Operations
  • Commercial Offices And Workplaces
  • Residential New Build Housing
  • Residential Renovation And Replacement
  • Healthcare And Aged Care Facilities
  • Public Buildings And Transport Terminals

By Commercial Dimension

  • Architect And Engineer Specification
  • Plumbing Merchant And Trade Distribution
  • Direct Developer Procurement
  • Retail And Consumer Channel
  • Facilities Management Framework Supply
  • Subscribed Monitoring Service Delivery

By Region

  • North America
  • Western Europe
  • East Asia
  • South Asia and Pacific
  • Latin America
  • Middle East and Africa
  • Eastern Europe

Scope, Methodology, and Coverage

Every figure in this report is reproducible from documented input assumptions. The scope below maps the historical period, the forecast horizon, the segmentation dimensions, and the countries covered, alongside the underlying primary and qualitative methodology.
Historical Period
2020 to 2025
Forecast Period
2026 to 2036
Base Year
2025 (USD billions; MMA Primary Research Dataset, September 2026)
Market Definition
This report covers smart bathroom products: sanitaryware, fittings and systems with electronic control, sensing or connectivity built in, spanning commercial water monitoring and leak detection, sensor-operated taps and flush systems, smart toilets and bidet seats, digital shower and thermostatic control, connected mirrors, lighting and ventilation controls, and building management integration. It excludes conventional sanitaryware without electronics, building plumbing infrastructure, water heating appliances, general home automation hubs, and bathroom furniture.
Quantitative Units
USD millions, smart bathroom product revenue basis; fittings and systems installed; fixture service life in years; software support periods in years; installer recommendation rates; commercial share of revenue; monitoring payback periods in years.
Segmentation Dimensions
Product class and buyer context; end-use building type; commercial specification route; geography across seven regions.
Regions Covered
North America, Western Europe, East Asia, South Asia and Pacific, Latin America, Middle East and Africa, Eastern Europe
Countries Covered
Japan, China, South Korea, India, Australia, Singapore, Vietnam, Indonesia, Germany, France, United Kingdom, Italy, Spain, Netherlands, Poland, United States, Canada, Brazil, Saudi Arabia, United Arab Emirates.
Key Companies Profiled
Lixil, Kohler, Toto, Roca Group, Geberit, Grohe, Hansgrohe, Villeroy and Boch, Duravit, Ideal Standard, Moen, Jaquar Group, Sloan Valve, Zurn Elkay, Vitra.
Quantitative Methodology
Primary survey, n=3,800 respondents, Q4 2025, six countries; demand-side model with trade association cross-validation
Qualitative Methodology
47 expert interviews, Q4 2025; applied to validate demand model assumptions, identify emerging dynamics, and assess competitive positioning
Report Format
PDF and XLSX data workbook (Word format preview document)
Publisher
Market Minds Advisory
Report Code
MMA-2026-CON-221
Published
September 2026
Contact
sales@marketmindsadvisory.com | www.marketmindsadvisory.com

Purchase the full Smart Bathroom Market Report (2026 to 2036).

This report sizes the global smart bathroom market from 2026 to 2036 across six product classes, six building types and seven regions. It explains why fixtures lasting around twenty-five years against software supported for roughly five leaves only around 29% of installers willing to recommend connected products. Commercial buildings supplying around 61% of revenue are analysed as the segment where a payback figure replaces a preference. Water regulation reaching specifiers rather than consumers is examined as the most reliable route to volume. Regional analysis explains why East Asia holds 33% of spending.
Six product classes sized through to 2036
Software support periods quantified against fixture service life
Installer recommendation rates analysed across residential channels
Twenty named manufacturers assessed on smart bathroom revenue
Four revenue levers with quantified commercial impact
Anonymised manufacturer connected range engagement documented in full

Built For The People Who Decide

From boardroom strategy to bench-side execution, this report is read cover-to-cover by leaders shaping the next decade of their industry, turning demand scenarios, market dynamics and valuation benchmarks into decisions.
CXOs/ Presidents/ VPs/ Managers
M&A and Corporate Development
Strategy Teams and R&D Heads
Procurement and Product Directors
Regulatory and Compliance Leaders
Investor Relations and Equity Analysts