Market Minds Advisory
Small Wind Turbine Market

Small Wind Turbine Market: Small Wind Turbine Market: Hybrid Attachment, Certification and the Retreat From Residential, 2026 to 2036

Solar took the residential market outright, leaving small wind to earn its position where winter darkness, telecom uptime rules and marine duty make a turbine the only thing that keeps producing power reliably.

Lead Analyst

Published

September 2026

Make Smarter Decisions with Customized Research Insights

Request a free sample report and evaluate market opportunities, growth trends, and competitive dynamics relevant to your business needs.

2025 MARKET VALUE$1.7BMarket Size 2025
2036 FORECAST VALUE$3.7BBase Case , 2026 to 2036
CAGR 2026 TO 20367.4 %Bull 8.6% / Bear 6.2%
INCREMENTAL OPPORTUNITY$1.9BNet 10- year value creation
EXPANSION MULTIPLE2.04x2036 value over 2026 base
Strategic Levers
M&A Pipeline
Regional Outlook
Country Rankings
Competitive Intelligence
Segmental Deep-dive
Call-Us : 91 93563 13602

Executive Snapshot and Market Trajectory.

Solar won the argument this industry spent a decade having. Small wind lost residential and grid-connected domestic work almost completely, and what survives is the duty solar cannot cover alone: dark winters, year-round telecom uptime, marine sites and hybrid pairings. Nobody wanted to say that out loud for years.
That reframing explains where the growth sits. Machines rated 20 to 50 kW grow at 11.1%, half again the market rate of 7.4%, because farms, telecom sites and small commercial buildings have load profiles a turbine of that size actually matches. Below 5 kW the market is shrinking against solar. Some 58% of units now go in alongside solar rather than instead of it, which is the commercial reality every manufacturer has had to accept.
Concentration is unusually low, with five manufacturers holding 29% of measured unit shipments and Chinese producers supplying most world volume. Reliability, not price, remains the constraint on the whole category, and only 41% of shipped models carry recognised certification. Rare earth magnet supply and pricing sit almost entirely in one country, which is a commercial exposure nobody in this industry has solved. That exposure reaches everyone at once.
Market Definition
The small wind turbine market covers horizontal and vertical axis wind turbines of rated capacity up to 100 kW supplied for off-grid, hybrid and grid-connected distributed generation, spanning residential, agricultural, telecom, marine, remote monitoring and small commercial applications. Sizing is measured at manufacturer revenue for the turbine, generator, controller and tower supplied as a unit. Utility scale turbines above 100 kW, standalone inverters and batteries sold separately, installation labour, and operations and maintenance services are excluded.
Base Year Value
$1.7B in 2025 (MMA Primary Research Dataset, September 2026)
Forecast Period
2026 to 2036, eleven discrete annual values
CAGR
7.4% base case. Bull 8.6%. Bear 6.2%.
Fastest Growth Segment
Turbines Rated 20 to 50 kW: 11.1% CAGR
Fastest Growth Country
India: 11.8% CAGR
Fastest Growth Region
South Asia and Pacific: 9.6% CAGR
Largest Region
East Asia: 36% of 2025 global value
Market Leaders
Bergey Windpower, Ghrepower Green Energy, Eocycle Technologies, Ryse Energy, Anhui Hummer Dynamo. Source: MMA Analysis based on company disclosures and measured unit shipment volume.
Primary Survey
n=3,800 procurement and R&D decision-makers, Q4 2025, six countries
Methodology
Demand-side build-up, cross-validated against public data, 47 expert interviews

Small Wind Turbine Market Forecast Scenarios

small-wind-turbine-market-size-forecast-scenario-1788412411187
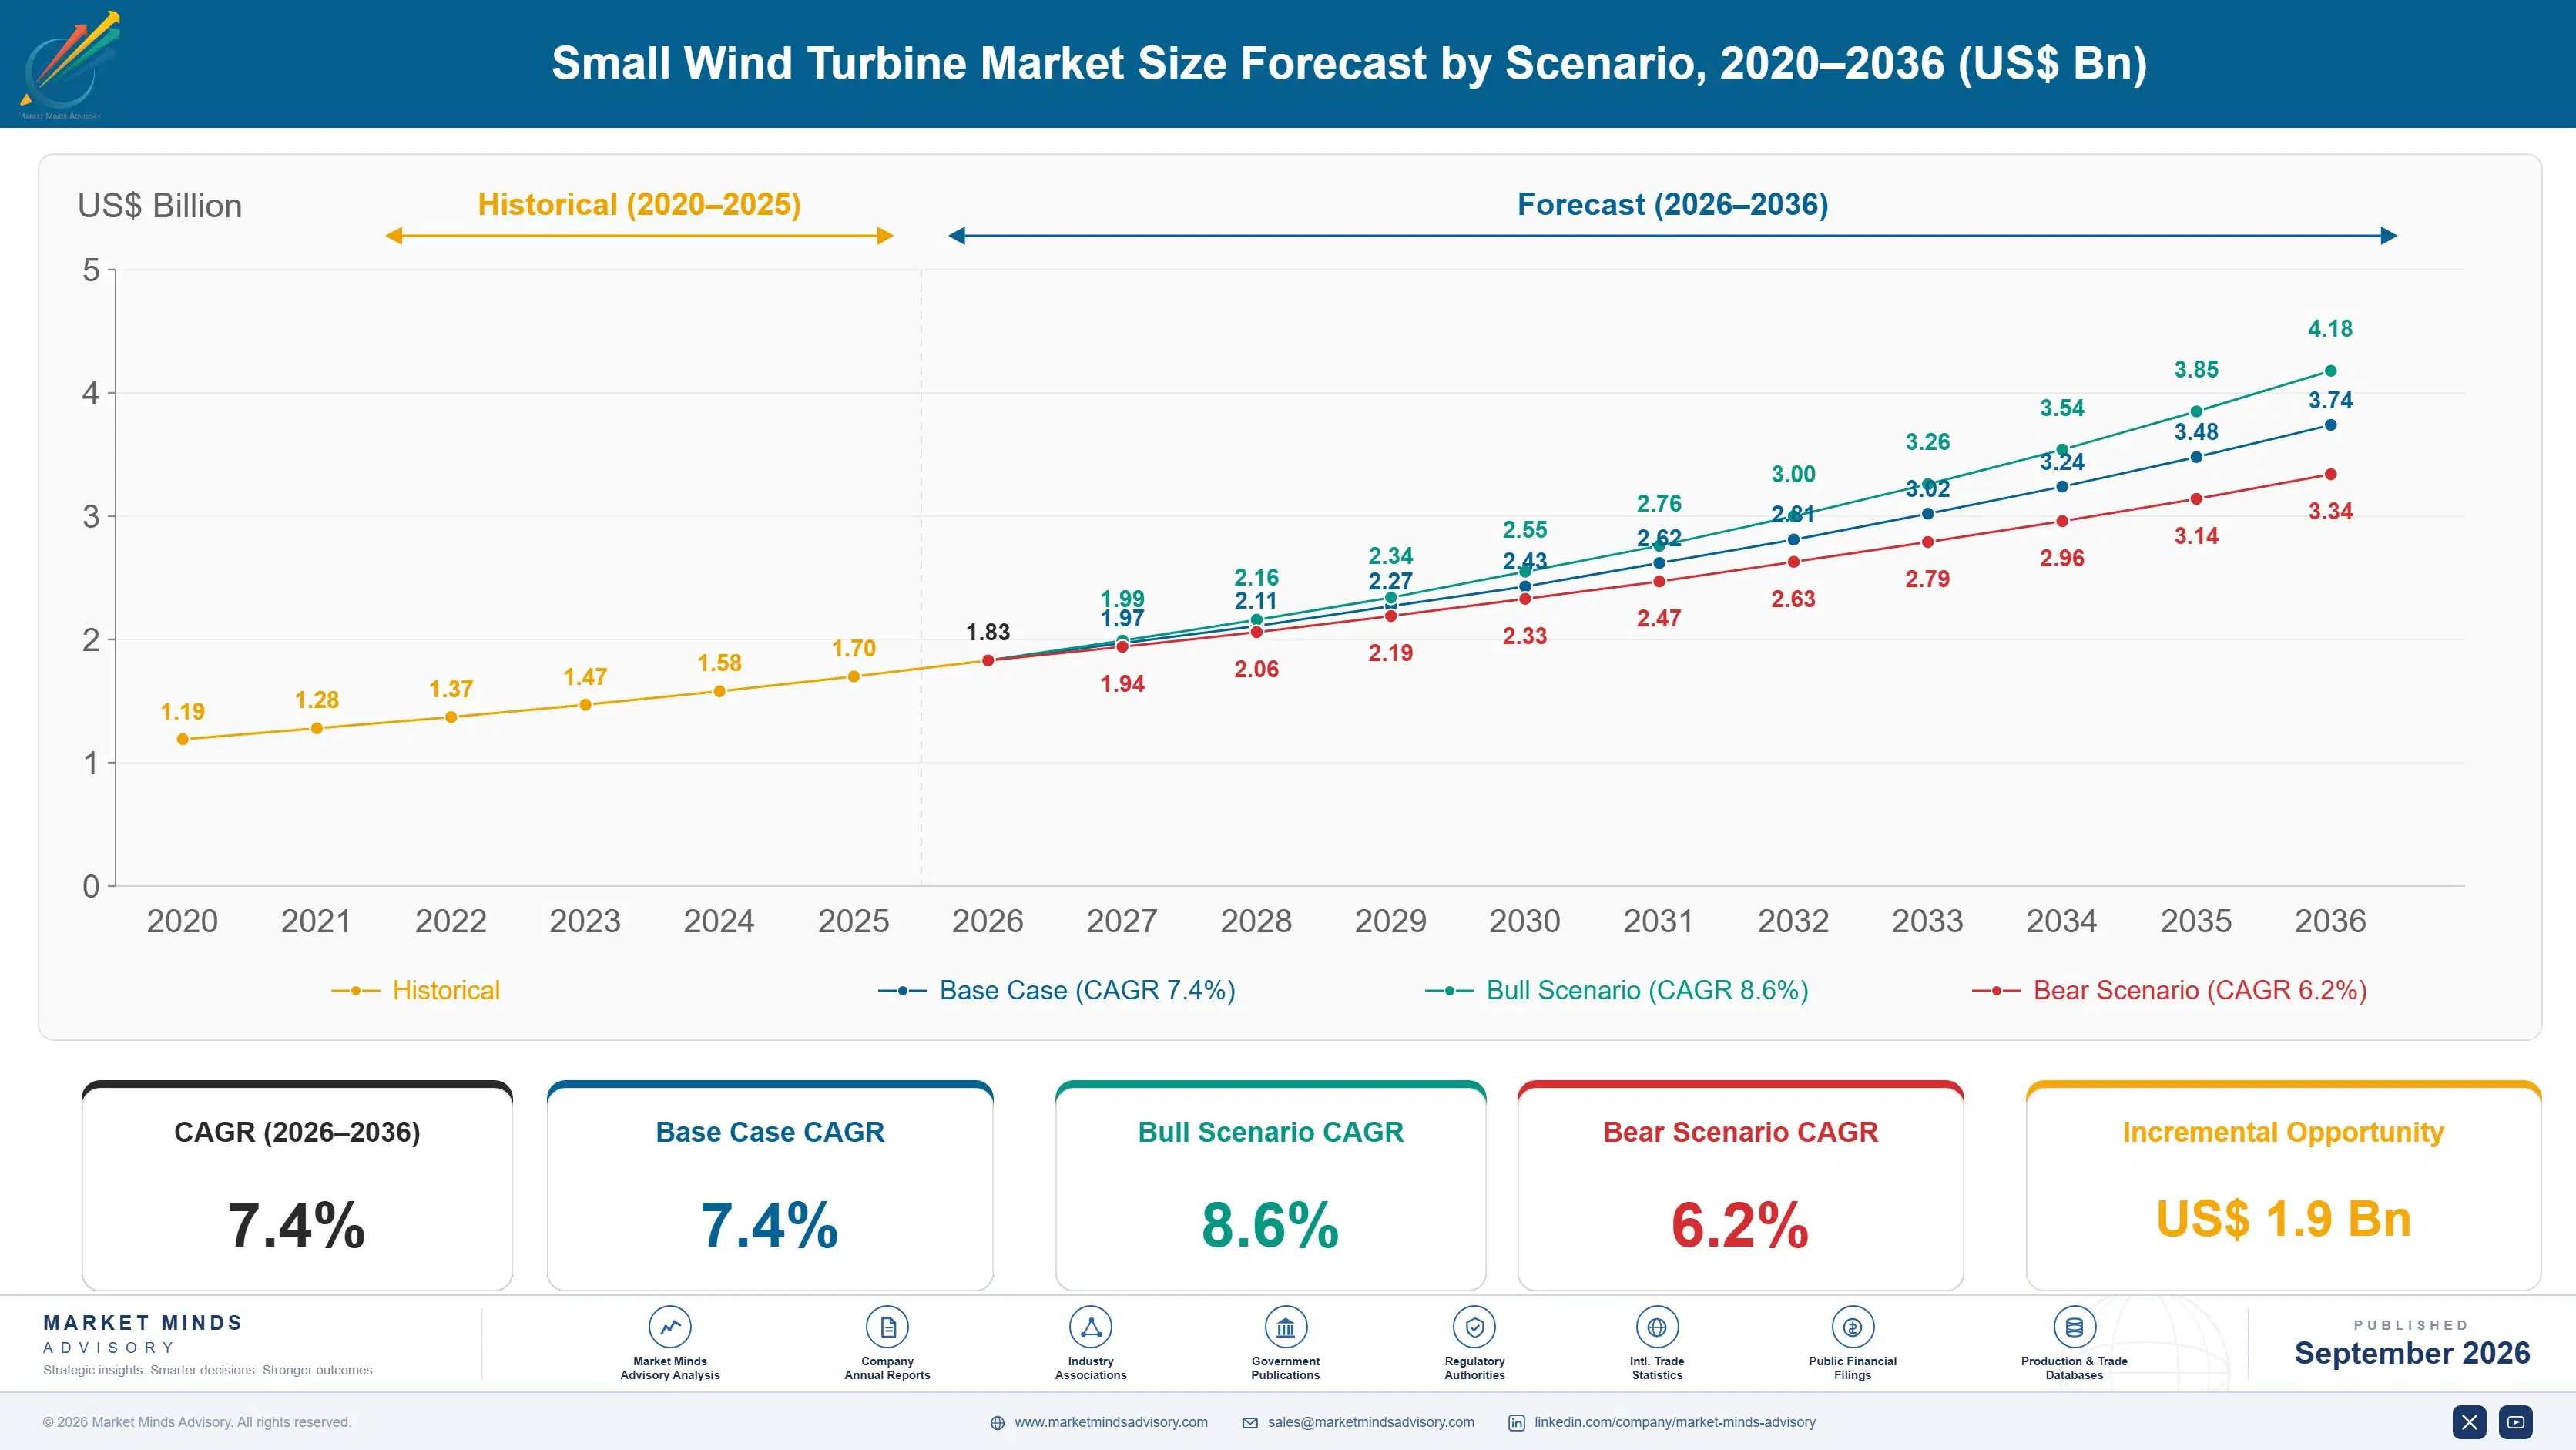
Between 2020 and 2025 the market compounded at 6.2%, and the number hides two opposite movements. Residential and micro-scale demand fell steadily as rooftop solar prices collapsed and small wind's reliability reputation caught up with it. Meanwhile off-grid telecom, agricultural and hybrid applications grew consistently, particularly across China, India and sub-Saharan Africa, where the alternative was diesel rather than solar.
The 7.4% base case rests on three commercial mechanisms. Hybrid system design has become the default for off-grid sites, and wind and solar are seasonally anti-correlated in most temperate and high-latitude locations, which cuts required battery capacity substantially. Telecom operators are replacing diesel at tower sites under fuel cost and emissions pressure, and they buy on uptime rather than on payback. And certification requirements have started removing the unreliable products that damaged buyer confidence for a decade.
The bull case is telecom tower diesel replacement accelerating across Africa and South Asia, where hundreds of thousands of sites still run on fuel deliveries. The bear case is battery storage costs falling far enough that solar plus storage covers winter duty on its own, which would remove the hybrid argument that currently carries most of this market's growth.

What Is Left After Solar Took The Easy Sites

Small wind competes against rooftop solar and loses on every metric that matters to a homeowner. Solar costs a fraction per installed kilowatt, has no moving parts, needs no planning argument about noise, and works on a roof rather than requiring a tower and a wind resource assessment. That contest ended years ago, and manufacturers who kept selling against it wasted a decade of effort and capital.
TOP FIVE CONCENTRATION29%Share of measured unit shipments held by leading manufacturers
INSTALLED COSTUSD 5,400/kWTypical installed cost per rated kilowatt for grid-connected units
CERTIFIED MODEL SHARE41%Portion of shipped models carrying recognised certification to standard
TYPICAL CAPACITY FACTOR21%Average annual output against rated capacity across installed fleet
DESIGN SERVICE LIFE20 yearsDesign life before major refurbishment or replacement becomes necessary
HYBRID ATTACHMENT RATE58%Portion of units installed alongside solar in combined systems
What solar does badly is winter at high latitude, and continuous output for uninterruptible loads. A site at 55 degrees north receives little solar resource between November and February, exactly when heating and lighting demand peaks. Wind resource runs opposite to that. Pairing the two cuts the battery capacity a site needs, and 58% of units now ship into that configuration.
Reliability is the industry's own wound. Failure rates on residential turbines through the 2010s were bad enough that installers stopped recommending them and lenders stopped financing them, and the reputation has outlasted the products that caused it. Certification to recognised standards is the repair mechanism, but only 41% of shipped models carry it, and a great many low-cost units still reach buyers with no independent verification at all.
"The industry spent fifteen years trying to be a smaller version of utility wind, and that was the wrong ambition entirely. The winning position is being the component that makes a solar hybrid work through December, which is a modest role but a defensible and genuinely growing one."
Director, Distributed Generation and Off-Grid Systems Practice · MMA Energy and Power Practice · September 2026

Market Trends

Hybrid Pairing Replaces Standalone Wind As The Default

Wind and solar resource run opposite to each other across most temperate and high-latitude sites, with wind strongest in the months when solar produces least. Designing the two together cuts the battery capacity an off-grid site requires, sometimes by a third, and battery cost usually dominates the system budget. That changes the commercial case entirely: the turbine is no longer competing with solar on cost per kilowatt hour, it is reducing the storage bill. Some 58% of small wind units now ship into hybrid configurations, and manufacturers who sell through system integrators rather than direct have adapted fastest to it.
Market Impact: Covers 400 sites per framework
Certification Becomes The Gate Rather Than A Marketing Claim

Failure rates through the 2010s destroyed buyer confidence badly enough that installers and lenders withdrew from the category across several markets. Certification to IEC 61400-2 and to national schemes has become the mechanism for rebuilding it, and public procurement, incentive eligibility and insurance now increasingly require it outright. Only 41% of shipped models currently carry recognised certification, which means a majority of world volume still reaches buyers unverified. Testing a model costs a meaningful fraction of a small manufacturer's annual revenue and takes a year or more, which is why the share moves so slowly.
Market Impact: Serves 40 kW average load

Market Opportunities and Growth Drivers

Telecom Tower Diesel Replacement Buys On Uptime Not Payback

Hundreds of thousands of telecom towers across Africa and South Asia still run on diesel delivered by road, where fuel theft, delivery failure and generator maintenance dominate site operating cost. Tower companies buy power reliability, not energy, and a hybrid combining solar, wind and battery removes most fuel deliveries entirely. Wind matters specifically because it produces at night and through monsoon cloud when solar does not, cutting the battery bank a site needs. Procurement runs through framework awards covering hundreds of sites at once, which changes the sales model completely for manufacturers used to selling individually.
Market Impact: Cuts financing to 3 lenders

Agricultural Load Profiles Match Mid-Range Turbine Output

A farm running irrigation pumps, milking parlours, grain drying or cold storage has a load profile that a machine of 20 to 50 kW covers well, and it has land, tower clearance and no planning objection from neighbours it does not have. Rural electricity tariffs have risen sharply enough across several markets that self-generation pays without any subsidy at all. This is why the 20 to 50 kW class grows at 11.1% while the sub-5 kW residential classes shrink against solar. The buyer is a business making an investment decision, not a household making a values decision.
Market Impact: Concentrates 90% of magnet supply

Market Restraints and Challenges

Reliability Reputation Outlasts The Products That Caused It

Residential turbines sold through the 2010s failed at rates that destroyed installer and lender confidence across several national markets, and buyers still meet those stories before any current product. The root cause was manufacturers scaling utility design assumptions down without recognising that small turbines see far more turbulent wind, get far less maintenance and have no operator watching them. Commercial impact runs through financing as much as demand, since lenders price the category as risky. Mitigation runs through certification, longer warranties backed by parent company balance sheets, and remote monitoring that proves fleet performance rather than merely claiming it.
Market Impact: Reaches 58% hybrid attachment

Permanent Magnet Supply Sits In One Country

Almost every small wind generator uses neodymium iron boron permanent magnets, and both the rare earth separation and the magnet manufacturing that follow it are overwhelmingly concentrated in China, as USGS commodity reporting documents each year. Export controls and price movements therefore reach every manufacturer in the industry at once, regardless of where the turbine is assembled. The root cause is decades of separation and magnet capacity locating in one place for cost reasons. Participants are exploring electrically excited generator designs, ferrite magnet alternatives at an efficiency penalty, and magnet recycling, though none has reached commercial scale.
Market Impact: Covers 41% of shipped models
3 additional market trends, 4 additional growth drivers, and 2 additional restraints and challenges are covered in the full report. Contact sales@marketmindsadvisory.com to access the complete intelligence.

Segment CAGR and Growth Architecture

Segmentation follows rated capacity, which is how the industry is regulated, certified and sold, and which maps directly onto application. Each class serves a distinct buyer with a distinct load profile, from battery charging on boats and monitoring stations at the bottom to farms, telecom sites and small commercial buildings at the top of the range.
small-wind-turbine-market-market-share-analysis-1788412411768

Turbines Rated 20 to 50 kW

This class covers farms, telecom sites and small commercial buildings, where the load profile matches the machine and the buyer is a business making an investment calculation rather than a household making a statement. Land, tower clearance and neighbour distance are all available, which removes the planning obstacles that killed residential wind. Rural tariff increases have made self-generation pay without subsidy across several markets. Growth at 11.1% is half again the market rate of 7.4%, and the class is now the commercial centre of the whole industry. Certification matters most here, because these buyers finance the purchase and lenders ask for evidence. The reputational damage from residential failures still reaches these buyers too.
CAGR 11.1%

Turbines Rated 50 to 100 kW

The upper end of the small wind definition serves community projects, larger agricultural operations, island and remote community power schemes, and industrial sites with genuine wind resource. Machines here approach utility engineering in construction, with pitch control, active yaw and condition monitoring that smaller classes cannot justify, and reliability is correspondingly better. Public programmes for remote community power in Canada, Scotland and the Nordic countries buy in this class specifically. Growth of 10.4% trails only the class below it. Grid connection studies and planning consent take longer than the machine itself does, which is the practical constraint on how fast this segment can actually grow. Few manufacturers compete here seriously.
CAGR 10.4%
Full segment breakdown across 6 segments available in the complete report.

Regional Architecture and Country Demand Map

Small wind demand follows off-grid need, wind resource and manufacturing location rather than electricity consumption. East Asia dominates both production and installed units, and the Western markets that once led the industry have contracted sharply since incentive schemes closed. Reliability history still shapes who buys what.

East Asia

Chinese manufacturers produce the majority of world small wind units, and East Asia at 36% sits well above the 30% ceiling of the standard band for that reason alone. Domestic demand is genuine rather than purely export driven: rural off-grid supply, wind and solar hybrid street lighting deployed by the hundred thousand, and monitoring stations across remote terrain all consume units in volume. Pricing is a fraction of Western equivalents, and certification coverage across those products is correspondingly thin. Japanese and Korean demand is small and concentrated in marine and telecom applications, where reliability requirements favour imported certified machines over the regional low-cost supply. Export volume follows the same cost position.
Share: 36% | CAGR: 8.2% (2026 to 2036)

North America

At 18% the region sits below the standard band, and the collapse of residential small wind explains all of it: rooftop solar took the market, most state incentive programmes closed, and installer networks moved on. What grows now is agricultural, sitting in the 20 to 50 kW class where farms have land, clearance and rising rural tariffs. Remote community power programmes across Alaska and northern Canada buy hybrid systems for genuine winter reasons rather than policy ones. American manufacturers hold strong positions in the certified mid-range and compete poorly on price at the bottom of the market. Framework buying has not arrived here in the way it has across African telecom markets, so sales remain stubbornly individual.
Share: 18% | CAGR: 6.4% (2026 to 2036)
Regional intelligence for 5 additional markets available in the complete report: Western Europe, South Asia and Pacific, Latin America, Middle East and Africa, Eastern Europe. Contact sales@marketmindsadvisory.com.
small-wind-turbine-market-country-cagr-analysis-1788412412292

Where Small Wind Margin Actually Sits

Four positions carry margin in a market that lost its original mass application and has to earn a narrower one. Each depends on capability built ahead of the order, whether certification, channel access or system design competence, and none of them can be assembled quickly once a tender is already on the table. Timing decides all four.

Sell Through Hybrid System Integrators Not Direct

With 58% of units going into hybrid systems, the buying decision increasingly sits with the integrator designing the system rather than with the end user, and that integrator is choosing between a turbine and additional battery capacity. Manufacturers who present output data in a form that feeds system modelling win that comparison; those selling on rated power alone lose it. The channel also removes installation and service obligations. Direct sales still dominate at most manufacturers, which is a decade-old habit rather than a considered choice. The comparison being made is against batteries, not against solar.
Market Impact: Reaches the 58% of units bought through integrators

Certify Models Before Buyers Are Forced To Ask

Only 41% of shipped models carry recognised certification, and incentive eligibility, public procurement and lender acceptance increasingly require it outright rather than preferring it. Testing costs a meaningful share of a small manufacturer's annual revenue and takes upward of a year, so the decision has to be made well before the requirement bites. Certified models command roughly 20% higher pricing and reach buyers uncertified products cannot access at all. This is the single clearest dividing line in the industry today. Manufacturers who deferred it are now watching tenders they cannot bid on at all.
Market Impact: Commands roughly 20% higher pricing on every unit

Win Telecom Framework Awards At Scale

Tower companies procure through frameworks covering hundreds of sites at once, sometimes 400 or more, and they buy uptime rather than energy cost. That suits a manufacturer able to supply, spare and support at volume across difficult geography, and excludes everybody else regardless of product quality. The qualification runs on field failure data and service response, not on specification sheets. Winning one framework changes a small manufacturer's scale entirely, which is why the tender process rewards preparation done years in advance. Spare holdings across the territory matter more than product specification here.
Market Impact: Covers 400 sites in a single framework award

Design Around The Magnet Supply Concentration

Neodymium magnet supply and pricing sit almost entirely in one country, which reaches every manufacturer at once when export controls or prices move. Electrically excited generator designs, ferrite alternatives at roughly 5% efficiency penalty, and magnet recycling all reduce that exposure, and none is yet at commercial scale anywhere. A manufacturer holding a qualified alternative design when the next disruption arrives can supply while competitors cannot. The engineering work has to be done during calm periods, which is precisely when nobody funds it. Very few manufacturers have started this work at all.
Market Impact: Removes the 90% magnet supply concentration risk entirely

Who Controls the Margin Pool

Measured on unit shipment volume, the basis used throughout this section, the top five hold 29%. That is remarkably fragmented, and it reflects an industry of small private manufacturers serving national markets with little cross-border scale. The gap between leaders and the rest is certification coverage and service network reach rather than product engineering, since the underlying technology is mature and widely understood across the whole industry.
Competition runs on certification, warranty backing and channel position rather than on rated efficiency, which buyers have learned tells them very little about annual output. Chinese manufacturers hold most world volume at pricing Western producers do not attempt to match, and compete in export markets wherever certification is not required. Western manufacturers hold the certified mid-range and the applications where a lender or public buyer demands evidence.

Pressure comes from two directions. Telecom framework procurement is consolidating demand into awards only larger suppliers can serve, which will thin the field considerably. And certification requirements spreading through incentive and procurement rules will remove uncertified products from the markets that pay best. Rankings shift where manufacturers invested in testing and service capability rather than in additional model variants nobody asked for.
small-wind-turbine-market-company-positioning-matrix-1788412412807

Competitive Moat and Risk Dimensions

BERGEY WINDPOWER

Moat: Longest certified field record

Decades of installed machines with documented field performance give the company evidence no newer entrant can produce, and in a category damaged by reliability failures that is what lenders and public buyers want. Certification across its range covers the applications where verification is mandatory. Dealer relationships built over years hold in agricultural markets where trust travels by word of mouth.
BERGEY WINDPOWER

Risk: Narrow product range exposure

A concentrated range in the mid-size classes means the company depends on agricultural and remote community demand holding up, with no low-cost position to fall back on. Chinese competition at a fraction of the price is reaching certified status gradually. Scaling manufacturing to serve a large telecom framework award would require capital the business has not deployed at that speed.
GHREPOWER GREEN ENERGY

Moat: Volume manufacturing cost position

Manufacturing scale across generators, blades and towers within a domestic supply chain that includes magnet production gives a cost position Western manufacturers cannot approach. Volume across hybrid street lighting and rural off-grid supply keeps production lines loaded regardless of export demand. That loading is what allows aggressive pricing on export tenders without any loss to the underlying business economics.
GHREPOWER GREEN ENERGY

Risk: Certification and service reach

Access to markets where recognised certification is mandatory depends on testing programmes that take years and on service networks the company does not yet hold outside its home region. Buyers financing a purchase want a warranty backed by something local. Trade measures aimed at Chinese energy equipment could restrict access to exactly the higher-priced markets the company wants.

Players Tracked

Prominent Players

Bergey Windpower
Ghrepower Green Energy
Eocycle Technologies
Ryse Energy
Anhui Hummer Dynamo

Other Key Players

Aeolos Wind Energy
Qingdao Greef New Energy Equipment
SD Wind Energy
Primus Windpower
Superwind
Braun Windturbinen
Sonkyo Energy
Tozzi Nord
Windside Production
Wind Simplicity
Halus Power Systems
Turbowinds
Ropatec
Qingdao Anhua New Energy Equipment
Shandong Huaya Industry

Recent Developments

APRIL 2025

Bergey Windpower completes certification testing on updated platform

The company completed independent performance and safety testing on a revised mid-range machine, extending recognised certification coverage across its product line. Certification governs eligibility for public procurement and incentive programmes in several markets, and increasingly determines whether lenders will finance an agricultural installation. Testing took most of a year.
Signal: Certification has stopped being a marketing claim and become the actual condition of market access here.
NOVEMBER 2024

Chinese manufacturer expands blade and generator production capacity

A domestic Chinese small wind manufacturer commissioned expanded blade moulding and generator assembly capacity, an organic capacity expansion rather than any acquisition. Stated demand came from hybrid street lighting deployment and export orders into South Asian and African off-grid markets. Domestic hybrid lighting demand remains the larger outlet.
Signal: Volume manufacturing stays concentrated exactly where the rare earth magnet and component supply chain already sits.
JUNE 2025

African tower operator awards multi-site hybrid supply contract

A telecom tower company awarded a framework contract covering several hundred sites for wind, solar and battery hybrid supply, an award decision rather than a joint venture. Diesel displacement and fuel delivery security were cited as the drivers rather than energy cost alone. Service commitments were written in.
Signal: Framework awards at this scale reward manufacturers who can genuinely support hundreds of remote sites reliably.

Magnets, Blades And Tower Steel

Permanent magnet material accounts for roughly 18% of turbine manufactured cost, blade composite around 21%, tower and foundation steel near 26%, and power electronics the balance. Neodymium iron boron magnets depend on rare earth separation and magnet manufacturing that USGS commodity reporting documents as concentrated overwhelmingly in China, regardless of where the ore itself was originally mined.
Rare earth pricing moved sharply through the 2021 to 2023 period and again under export control announcements, with neodymium and praseodymium oxide prices more than doubling and then falling back within a single eighteen month window. Manufacturers holding fixed-price dealer contracts absorbed the movement directly, and several small producers disclosed margin compression in that period. Steel pricing added a second layer of movement over the same window.

The disadvantage mechanism is scale of purchasing rather than geography. A manufacturer shipping tens of thousands of units annually negotiates magnet supply on entirely different terms from one shipping hundreds, and in this fragmented industry most participants are firmly in the second group. Chinese manufacturers buy inside the supply chain rather than from it. Western producers carry the material premium and the freight, which is why they compete on certification.
small-wind-turbine-market-cost-volatility-analysis-1788412413002

Ferrite magnet designs at an efficiency penalty

Ferrite magnets are cheap, widely available outside China and entirely free of export control risk, at the cost of roughly 5% generator efficiency and additional mass. For off-grid applications where the wind resource is good and mass is not critical, that trade is commercially acceptable, and the supply security is worth more than the lost output.

Electrically excited generator alternatives

Wound rotor designs remove permanent magnets from the machine entirely, eliminating the exposure at the cost of additional complexity, brushes or slip rings and a maintenance item that off-grid sites would rather not have. Development work has to be funded during calm supply periods, which is precisely when no manufacturer wants to pay for it.

Volume aggregation through purchasing consortia

Small manufacturers buying magnets, composites and power electronics jointly reach terms that individually they cannot, and several regional associations have organised exactly this. It requires agreeing common specifications with competitors, which is culturally difficult in an industry of owner-managed businesses, but the cost difference is genuinely material. Several regional associations have already organised exactly this successfully.

Portfolio Architecture for Margin Defence

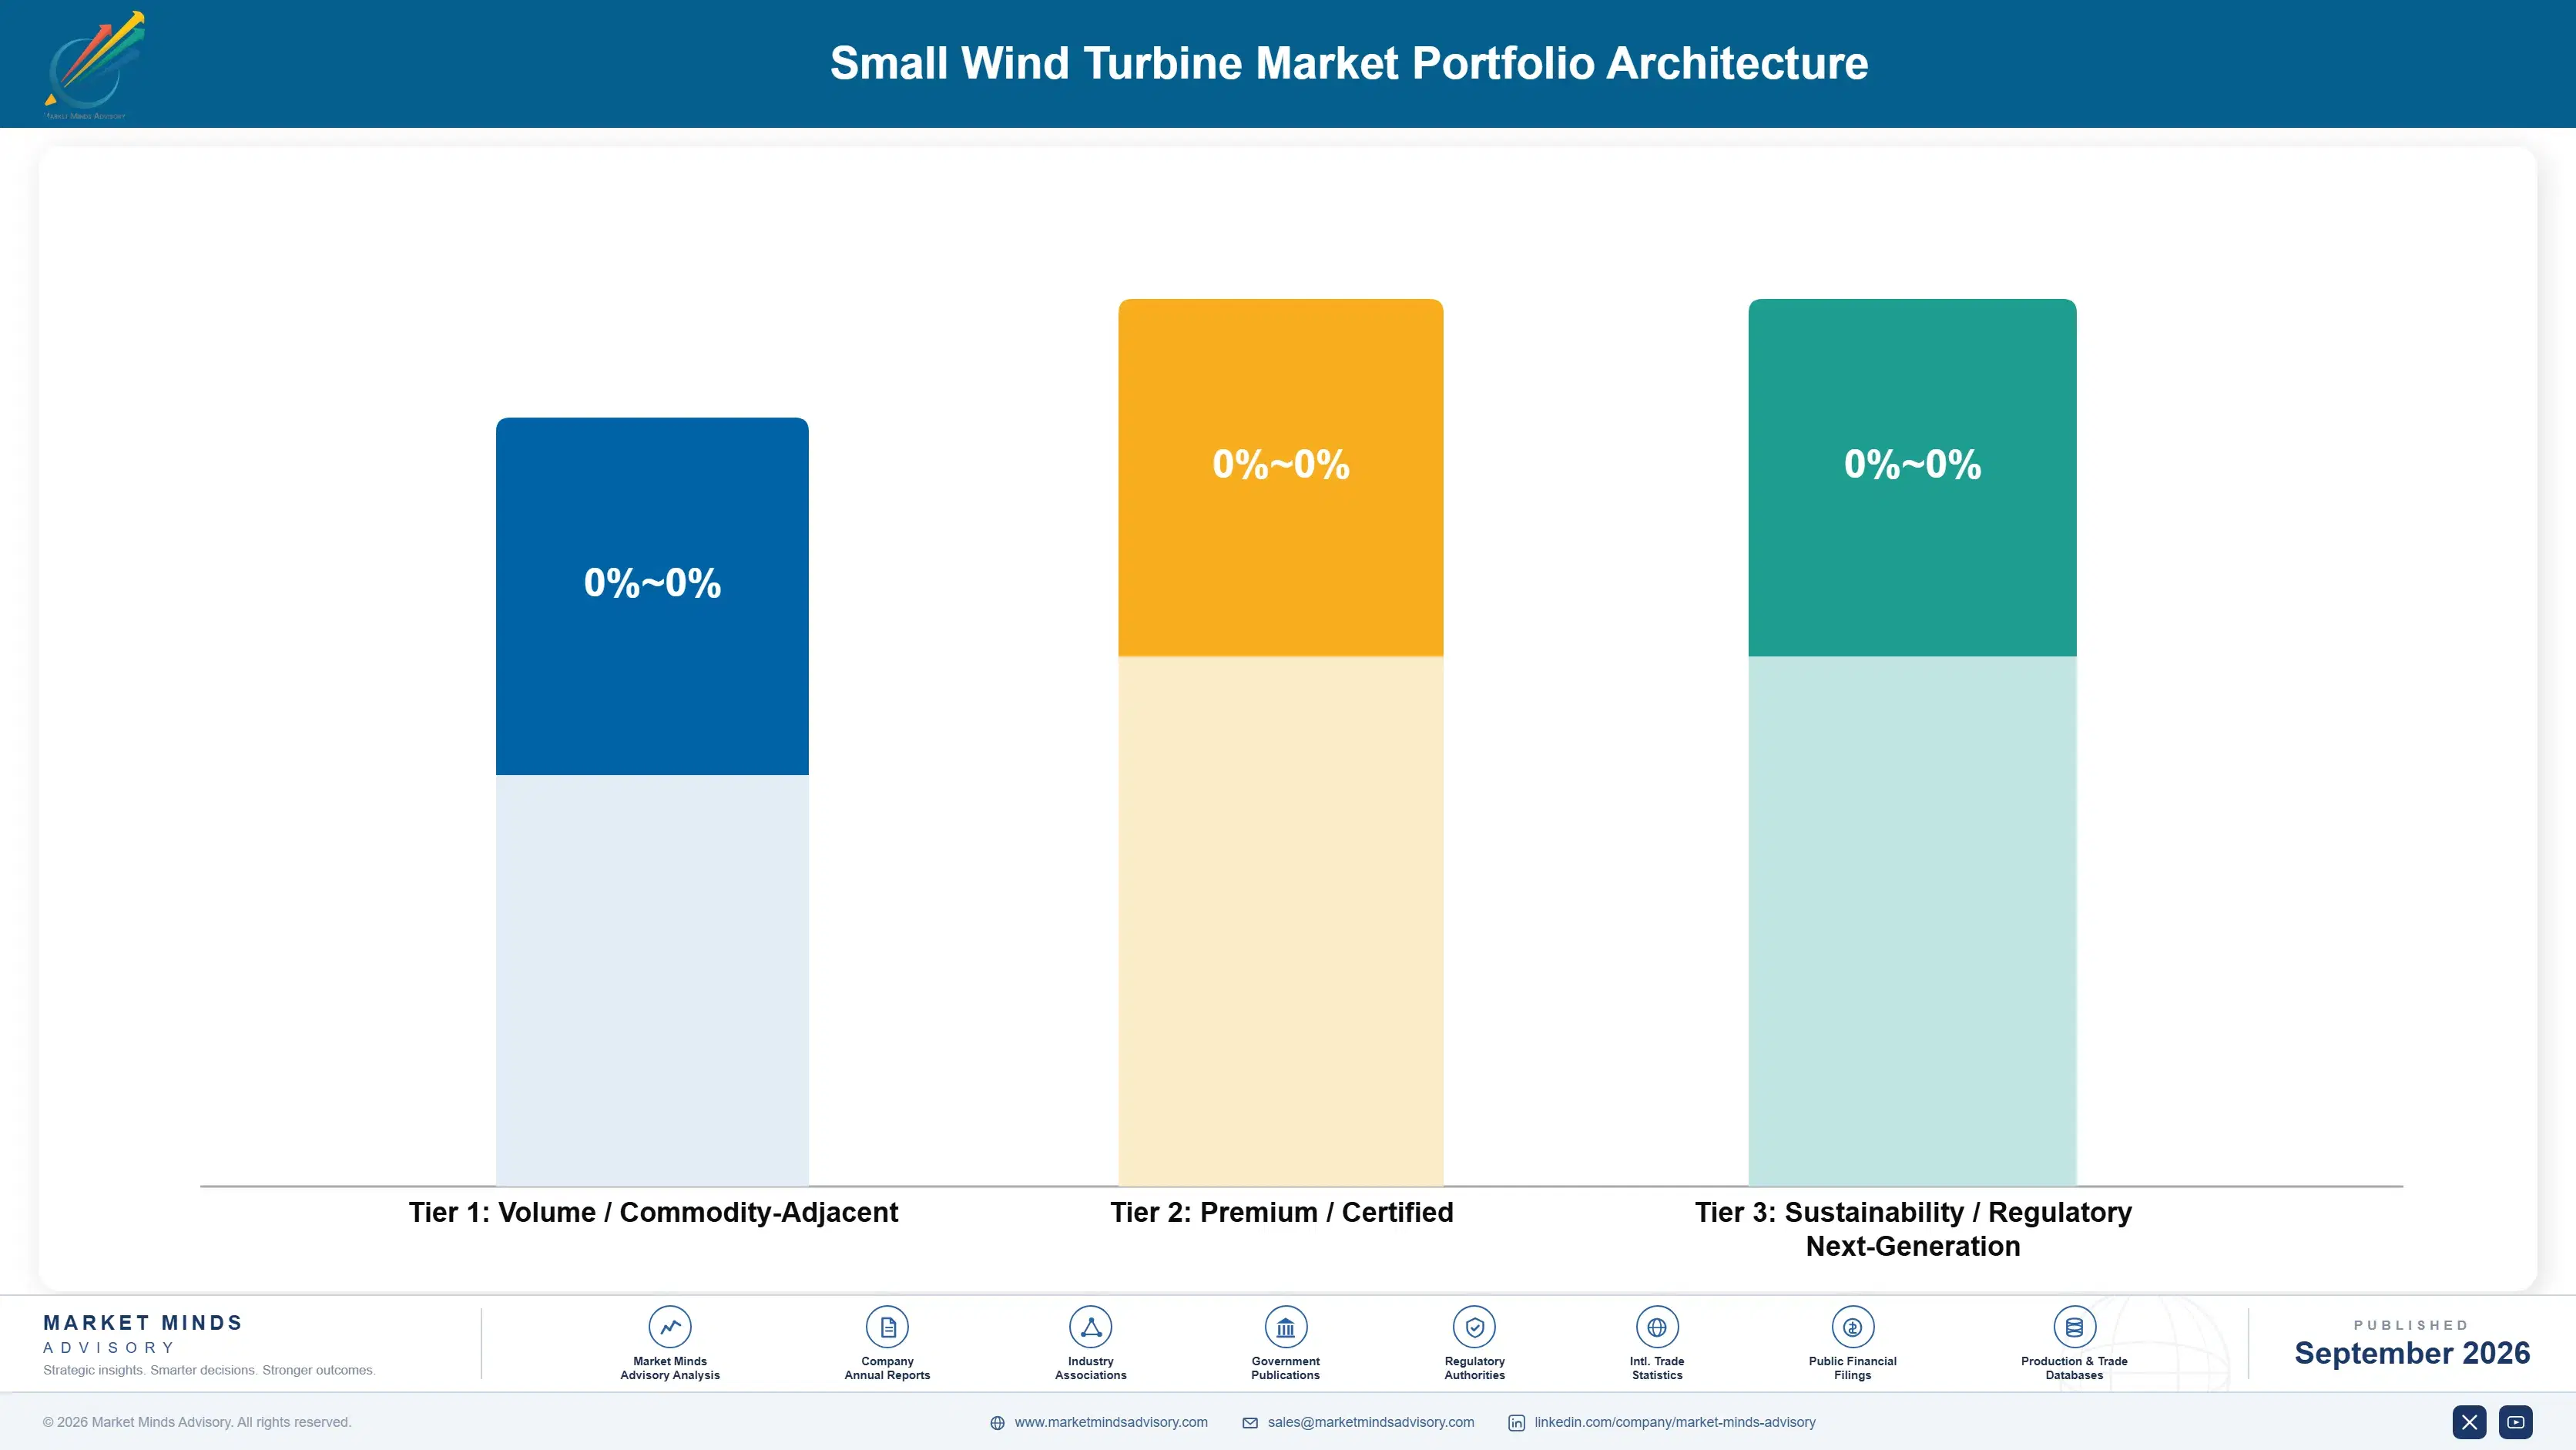
Margin separates almost entirely by whether the product is certified and who is paying. Uncertified machines sold into price-driven off-grid markets compete against each other on nothing but cost, and margin reflects that. Certified machines sold to farms, telecom operators and public buyers are chosen on evidence of field performance, and pricing runs roughly 20% higher because the alternative is not a cheaper turbine but no eligible product at all.
The volume against premium tension is real but resolvable. Volume production of low-cost machines keeps blade moulds and generator lines loaded, which matters in a capital-intensive process, and Chinese manufacturers use exactly that loading to price export tenders aggressively. Western manufacturers cannot follow and should not try, since their cost base makes the volume position unwinnable. Choosing the certified position deliberately is a better answer than competing badly in both.

High-value pools sit where evidence rather than price decides: telecom framework awards, publicly funded remote community power, and lender-financed agricultural installations. Each requires certification and documented field performance, which a new entrant needs years to accumulate. The pools are modest in unit terms and carry most of the industry's actual profit.

Volume / Commodity-Adjacent

Uncertified machines below 5 kW sold into price-driven off-grid and hybrid lighting markets, competing on cost alone. Margin depends entirely on manufacturing scale and component purchasing terms, both of which favour Chinese producers decisively.
Gross Margin: 11 to 17%

Premium / Certified

Certified machines in the 5 to 50 kW range sold to agricultural, small commercial and lender-financed buyers. The 7 point range reflects whether the manufacturer sells direct or through integrators, and how much service obligation the price carries.
Gross Margin: 22 to 29%

Sustainability / Regulatory / Next-Generation

Telecom framework supply, publicly funded remote community systems and magnet-free generator designs. The 10 point range reflects how differently framework pricing and public procurement land, and how few suppliers qualify for either.
Gross Margin: 27 to 37%
small-wind-turbine-market-portfolio-architecture-1788412413495

High-value Sub-segments and Strategic Watch-out

Telecom Framework Supply

Largest and best value pool available, with awards covering hundreds of sites and buyers purchasing uptime rather than energy cost. Qualification runs on field failure data and service response, which excludes most manufacturers before pricing is ever discussed. Winning one changes a manufacturer's scale entirely.
Gross Margin: 28 to 37%

Certified Agricultural Machines

Growing at 11.1% in the 20 to 50 kW class as rural tariffs rise and farms self-generate without subsidy. Certification is what makes the purchase financeable, and lenders now ask for it before agreeing to fund any installation at all. Rising rural tariffs do the rest of the work.
Gross Margin: 23 to 29%

Off-Grid Micro Turbines

The volume core that keeps manufacturing loaded, sold into markets where price is the only consideration and certification is not required. Necessary for scale rather than attractive on returns, and Chinese producers hold it comprehensively. Chinese producers hold it through component supply chain position rather than product design.
Gross Margin: 11 to 17%

Residential Grid-Connected Units

Comprehensively lost to rooftop solar, with incentive schemes closed and installer networks moved on in every major Western market. Revenue continues through replacement of existing installations, but no manufacturer should commit new development capital here. Existing installations should be serviced and the position quietly harvested.
Gross Margin: 12 to 18%

Who Actually Signs The Order

Annuity economics are thin and come from the framework agreement, not any replacement cycle, since a turbine designed for 20 years rarely gets replaced on schedule. A telecom framework covering hundreds of sites delivers revenue visibility individual sales never approach, and it renews on service performance rather than on price. Manufacturers holding one framework run a different business from those selling unit by unit.
Adoption depth varies enormously by buyer type. Telecom operators specify deeply, covering failure rates, spare holdings, response times and remote monitoring, and switching supplier mid-framework is genuinely disruptive for them. Farms buy once, on a lender's terms, and the relationship afterwards is a warranty rather than a partnership. Off-grid and lighting buyers treat turbines as interchangeable commodities and switch on price without hesitation.

The buyer profile has changed completely. Small wind was once sold to households making an environmental decision, through installers who also sold solar. It is now sold to procurement functions at tower companies, to farm businesses working with agricultural lenders, and to public programme managers running remote community power. All three ask for evidence rather than enthusiasm, which is why certification has become the commercial dividing line it now is.
small-wind-turbine-market-end-use-penetration-index-1788412413982

Where This Industry Should Compete

These are among the four positions where our research anticipates prominent divergence between winners and laggards over the coming forecast period. Each is grounded in the demand model, the regulatory perimeter, and the announced capacity pipeline.
01 / HYBRID CHANNEL POSITION

Sell to the integrator, not the end user

With 58% of units now going into hybrid systems, the decision sits with the integrator choosing between a turbine and additional battery capacity rather than with any end user comparing generation options. Manufacturers who present measured output in a form that feeds system modelling win that comparison, and those selling on rated power alone consistently lose it. Direct selling persists at most manufacturers as a decade-old habit rather than as any considered commercial choice, and it costs them the growing half of the market.
02 / CERTIFICATION INVESTMENT TIMING

Certify before procurement rules force the question

Only 41% of shipped models carry recognised certification, while incentive eligibility, public procurement and lender acceptance increasingly require it outright rather than merely preferring it, which shrinks the accessible market for everyone else. Testing costs a meaningful share of a small manufacturer's annual revenue and takes upward of a year, so the decision has to be taken well before the requirement actually bites. Certified models command roughly 20% higher pricing and reach buyers that uncertified products cannot access at any price at all.
03 / FRAMEWORK AWARD READINESS

Build service reach before the telecom tender arrives

Tower companies procure across hundreds of sites at once and qualify suppliers on field failure data and service response rather than on any specification sheet whatsoever, however impressive it looks. A manufacturer without spare holdings and response capability across difficult geography is excluded before pricing is discussed at all. Winning a single framework changes a small manufacturer's scale entirely, which is why the preparation, particularly spare holdings and local response capability, has to happen years ahead of the tender itself.
04 / MAGNET EXPOSURE MANAGEMENT

Qualify a magnet-free design during calm periods

Neodymium magnet supply and pricing sit almost entirely in one country and reach every manufacturer in this industry simultaneously whenever export controls tighten or prices move sharply in either direction. Ferrite alternatives at roughly 5% efficiency penalty and electrically excited designs both reduce the exposure, and neither is at commercial scale anywhere in the industry today. The engineering work must be funded when supply is calm, which is exactly the moment nobody in this industry has ever been willing to pay for it.

Engagement Snapshot From the Field

A live engagement with an industry participant carrying material or product regulatory and market exposure ahead of a defining policy shift, showing how our research translates into a defensible multi-year portfolio strategy.
MARKET MINDS ADVISORY · CLIENT ENGAGEMENT SUMMARY
Small Wind Turbine Producer Strategic Portfolio Review and Transition Roadmap 2026·Investment Scenario on Small Wind Turbine Exposure Evaluation 2025-26
CLIENT PROFILE
A telecom tower company operating several thousand sites across four sub-Saharan markets, with annual revenue reported at approximately USD 480 million (client-reported, unverified by MMA). Site power was supplied by diesel generators with fuel delivered by road, and energy costs represented a substantial share of total site operating expenditure across the entire tower portfolio in every market.
STRATEGIC CHALLENGE
Solar and battery retrofits had cut fuel consumption materially but left sites still running generators through monsoon cloud and overnight peaks, which was where the residual cost sat. Management could not tell whether adding wind to the hybrid was worth the capital or whether more battery capacity would be the cheaper answer at each individual site.
MMA APPROACH
MMA modelled wind and solar resource correlation at site level across the four markets, priced the battery capacity that wind addition would displace, and assessed small wind manufacturers on documented field failure rates and service reach rather than on rated specifications. Framework contracting structures used by comparable operators elsewhere were benchmarked in detail.
KEY FINDINGS
  1. Wind addition displaced more battery capacity than its own cost at roughly 30% of sites, concentrated in coastal and elevated locations where resource ran genuinely anti-correlated with solar.
  2. Manufacturer rated power figures bore almost no relationship to measured annual output at these sites, and supplier selection on specification alone would have produced poor outcomes.
  3. Only three of the eleven manufacturers assessed could demonstrate spare holdings and response capability across the client's geography, which narrowed the field before any pricing discussion.
  4. Framework contracting across several hundred sites would secure pricing roughly a fifth below site-by-site procurement, alongside far better service commitments than individual orders had achieved.
CLIENT PROFILE
A telecom tower company operating several thousand sites across four sub-Saharan markets, with annual revenue reported at approximately USD 480 million (client-reported, unverified by MMA). Site power was supplied by diesel generators with fuel delivered by road, and energy costs represented a substantial share of total site operating expenditure across the entire tower portfolio in every market.
STRATEGIC CHALLENGE
Solar and battery retrofits had cut fuel consumption materially but left sites still running generators through monsoon cloud and overnight peaks, which was where the residual cost sat. Management could not tell whether adding wind to the hybrid was worth the capital or whether more battery capacity would be the cheaper answer at each individual site.
MMA APPROACH
MMA modelled wind and solar resource correlation at site level across the four markets, priced the battery capacity that wind addition would displace, and assessed small wind manufacturers on documented field failure rates and service reach rather than on rated specifications. Framework contracting structures used by comparable operators elsewhere were benchmarked in detail.
KEY FINDINGS
  1. Wind addition displaced more battery capacity than its own cost at roughly 30% of sites, concentrated in coastal and elevated locations where resource ran genuinely anti-correlated with solar.
  2. Manufacturer rated power figures bore almost no relationship to measured annual output at these sites, and supplier selection on specification alone would have produced poor outcomes.
  3. Only three of the eleven manufacturers assessed could demonstrate spare holdings and response capability across the client's geography, which narrowed the field before any pricing discussion.
  4. Framework contracting across several hundred sites would secure pricing roughly a fifth below site-by-site procurement, alongside far better service commitments than individual orders had achieved.
RECOMMENDED STRATEGY
Phase 1: Phase one: rank all sites by measured wind and solar correlation and target hybrid wind addition only where displaced battery cost exceeds turbine capital. Phase 2: Phase two: shortlist manufacturers on documented field failure data and regional service reach, disregarding rated power comparisons entirely during selection. Phase 3: Phase three: contract a multi-site framework with service commitments and spare holding obligations written into the agreement from the outset.
OUTCOME
Within ten months the client had contracted a framework covering several hundred sites, reduced modelled battery capacity requirements by 24% on the targeted sites, and reported site energy cost down 11% across the deployed portfolio (client-reported, unverified by MMA). Deployment across the remaining markets continues into the coming year.

Frequently Asked Questions

Foundational context covering the market sizes, CAGR, scope, country, region and competition that inform every finding below. This section is provided to cover basics and most often pre-purchase conversations, answered from the MMA Primary Research Dataset.

What is the current size of the Small Wind Turbine Market?

The market was valued at USD 1.7 billion in 2025 and reaches USD 1.83 billion in 2026. Growth now comes from hybrid, telecom and agricultural applications rather than residential installations.

How large will the Small Wind Turbine Market be by 2036?

MMA forecasts USD 3.74 billion by 2036, an increase of USD 1.91 billion over the 2026 base. That represents an expansion multiple of 2.04 times.

What is the CAGR for the Small Wind Turbine Market 2026 to 2036?

The base case CAGR is 7.4%, with a bull case of 8.6% and a bear case of 6.2%. The historical rate between 2020 and 2025 was 6.2%.

Which segment is growing fastest?

Turbines rated 20 to 50 kW grow at 11.1%, half again the market rate of 7.4%. Farms and telecom sites have load profiles that match this class well.

Who are the major companies in the Small Wind Turbine Market?

Bergey Windpower, Ghrepower Green Energy, Eocycle Technologies, Ryse Energy and Anhui Hummer Dynamo lead on measured unit shipments. Together they account for roughly 29% of the market.

Which country is growing fastest?

India grows fastest at 11.8%, driven by telecom tower hybridisation and rural off-grid supply where diesel delivery is difficult. Domestic manufacturing has developed around the smaller ratings.

Report Segmentation Architecture

The full report scope spans multiple orthogonal segmentation dimensions, with cross-tabulated demand data provided for each dimension pair. Coverage extends further to regional breakdowns, trend trajectories, and the competitive detail needed to support segment-level decision-making.

By Rated Capacity Class

  • Below 1 kW
  • 1 to 5 kW
  • 5 to 10 kW
  • 10 to 20 kW
  • 20 to 50 kW
  • 50 to 100 kW

By End-Use Industry

  • Agriculture and Rural Enterprise
  • Telecom Infrastructure
  • Residential and Small Commercial
  • Marine and Offshore Monitoring
  • Remote Community Power
  • Industrial and Mining Sites

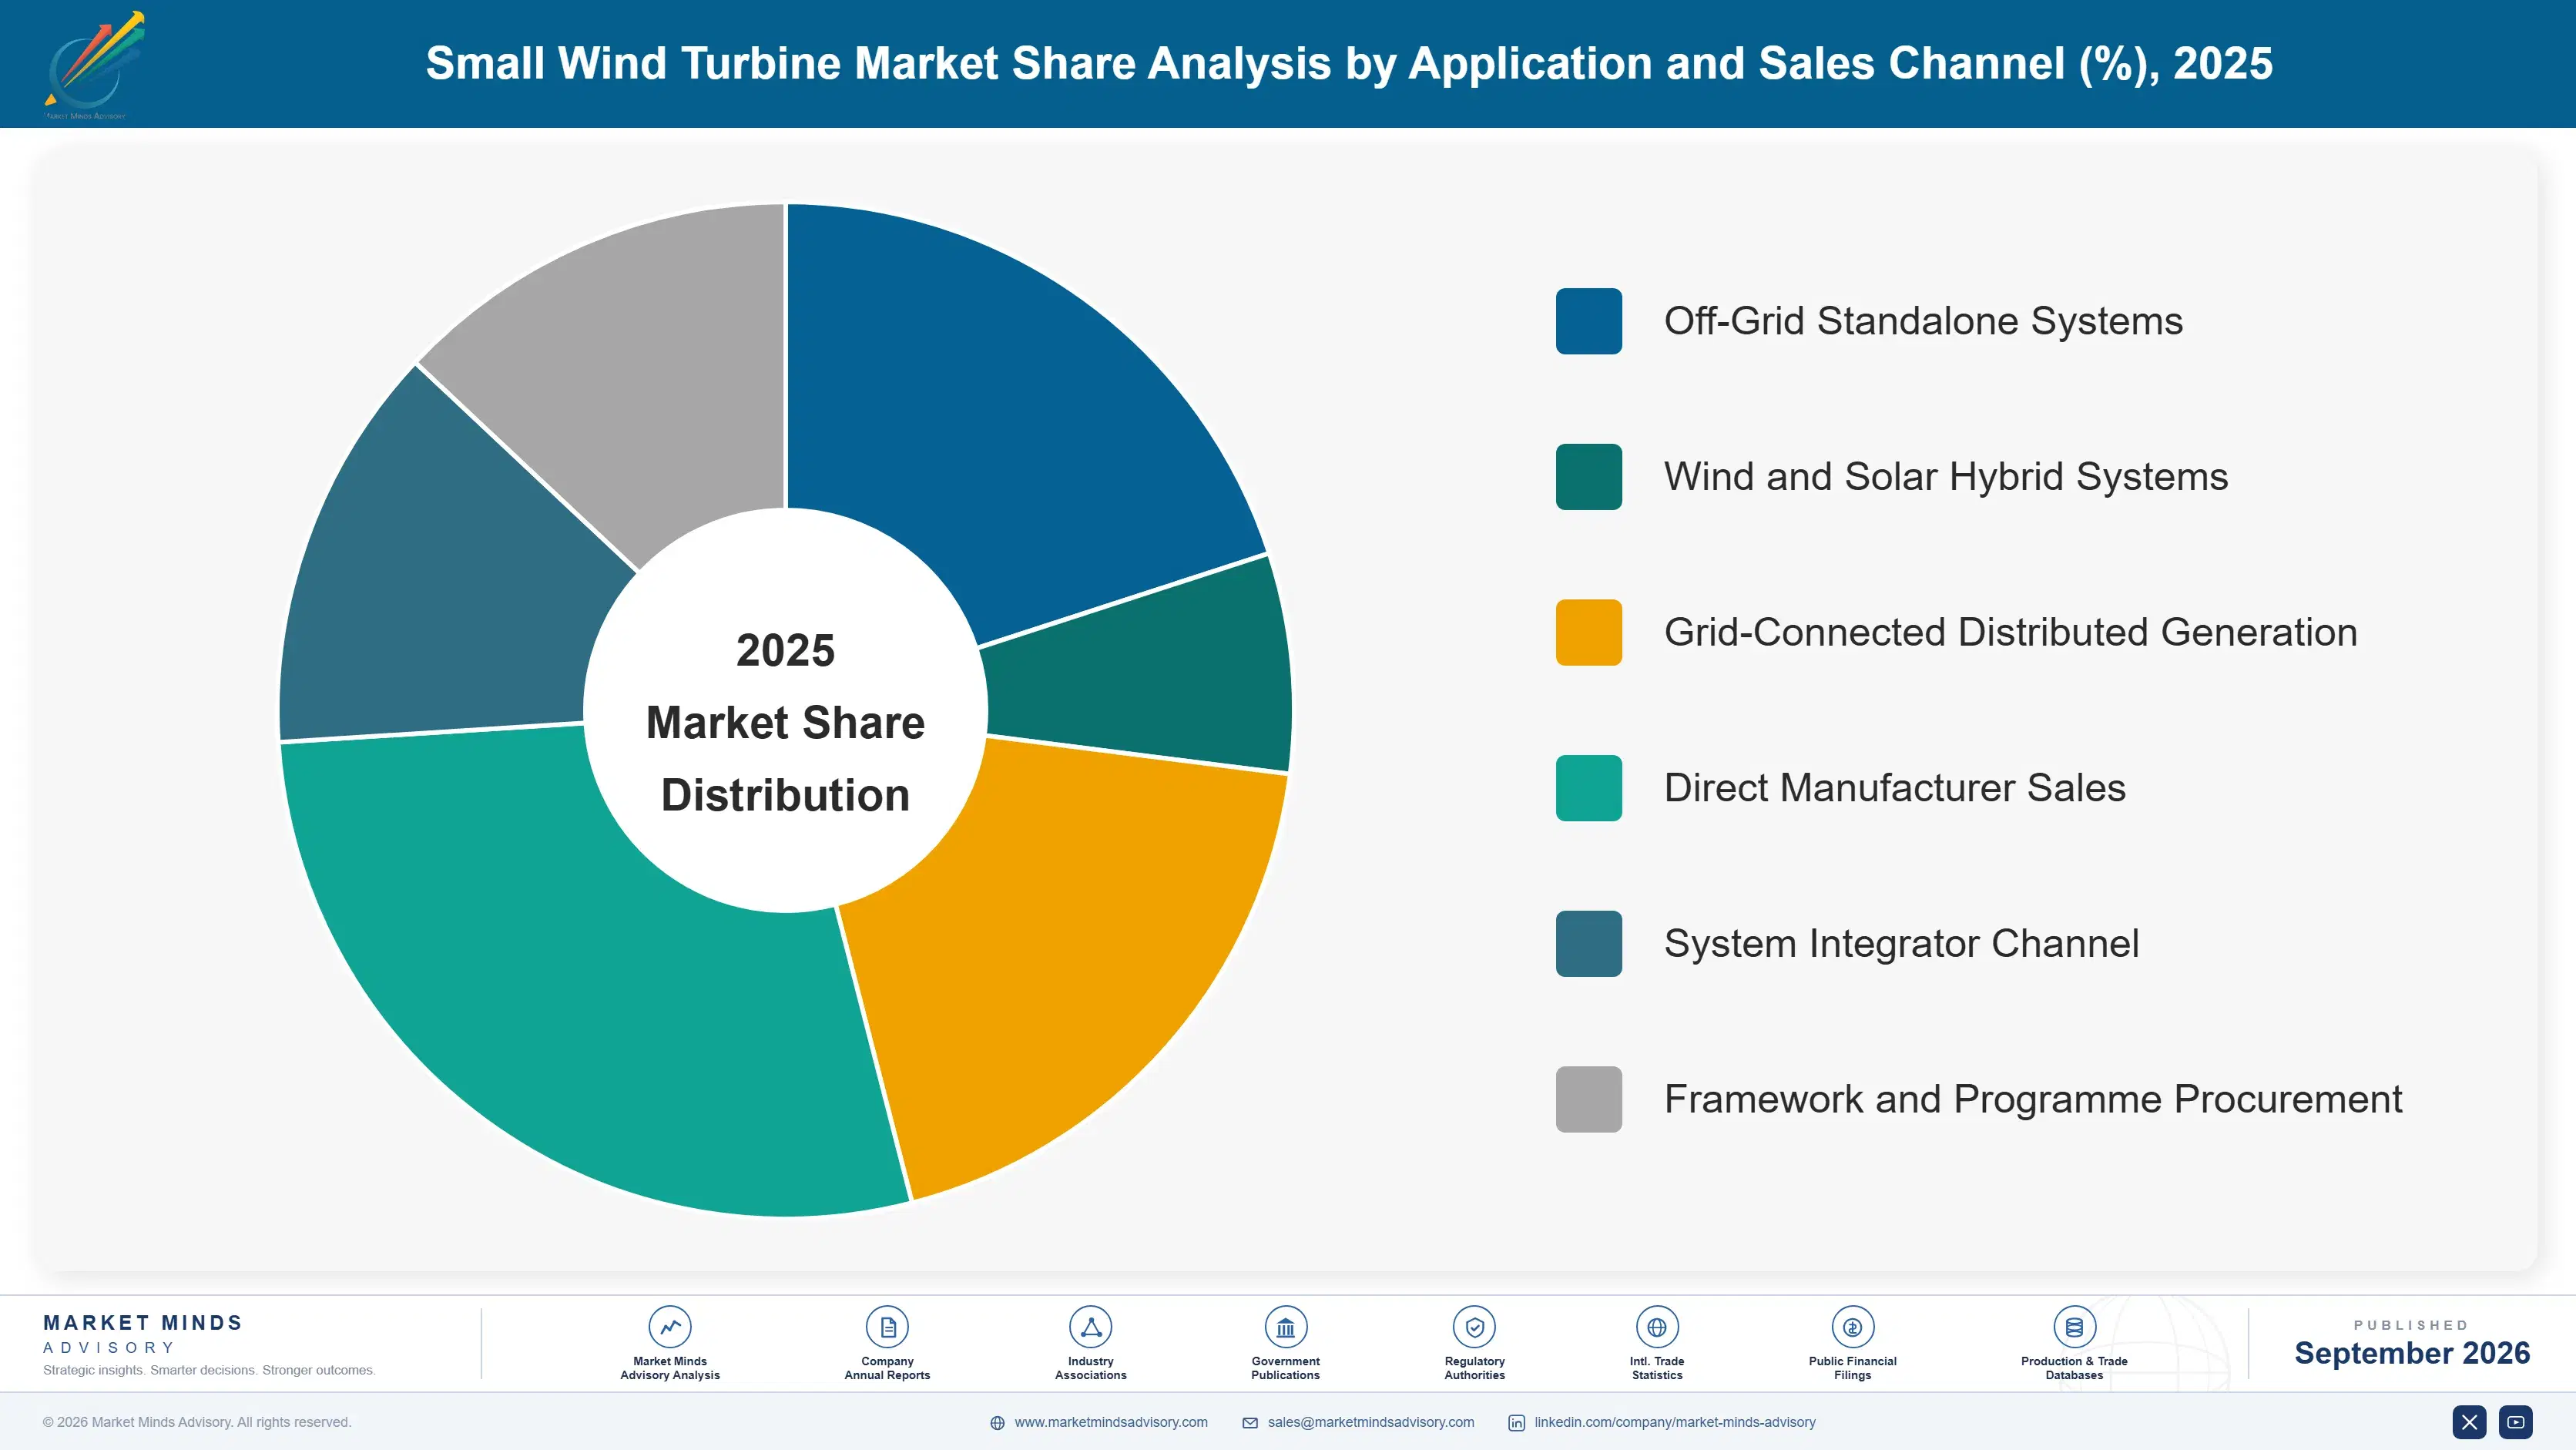
By Application and Sales Channel

  • Off-Grid Standalone Systems
  • Wind and Solar Hybrid Systems
  • Grid-Connected Distributed Generation
  • Direct Manufacturer Sales
  • System Integrator Channel
  • Framework and Programme Procurement

By Region

  • East Asia
  • North America
  • Western Europe
  • South Asia and Pacific
  • Latin America
  • Middle East and Africa
  • Eastern Europe

Scope, Methodology, and Coverage

Every figure in this report is reproducible from documented input assumptions. The scope below maps the historical period, the forecast horizon, the segmentation dimensions, and the countries covered, alongside the underlying primary and qualitative methodology.
Historical Period
2020 to 2025
Forecast Period
2026 to 2036
Base Year
2025 (USD billions; MMA Primary Research Dataset, September 2026)
Market Definition
The small wind turbine market covers horizontal and vertical axis wind turbines of rated capacity up to 100 kW supplied for off-grid, hybrid and grid-connected distributed generation, spanning residential, agricultural, telecom, marine, remote monitoring and small commercial applications. Sizing is measured at manufacturer revenue for the turbine, generator, controller and tower supplied as a unit. Utility scale turbines above 100 kW, standalone inverters and batteries sold separately, installation labour, and operations and maintenance services are excluded.
Quantitative Units
USD millions at manufacturer revenue, with supporting unit shipments and installed capacity in megawatts by region
Segmentation Dimensions
Rated capacity class, end-use industry, application and sales channel, region
Regions Covered
East Asia, North America, Western Europe, South Asia and Pacific, Latin America, Middle East and Africa, Eastern Europe
Countries Covered
China, India, Japan, Australia, Indonesia, United States, Canada, United Kingdom, Germany, Spain, Italy, Sweden, Poland, Ukraine, Brazil, Argentina, Chile, Kenya
Key Companies Profiled
Bergey Windpower, Ghrepower Green Energy, Eocycle Technologies, Ryse Energy, Anhui Hummer Dynamo, Aeolos Wind Energy, Qingdao Greef New Energy Equipment, SD Wind Energy, Primus Windpower, Superwind, Braun Windturbinen, Sonkyo Energy, Tozzi Nord, Windside Production, Wind Simplicity, Halus Power Systems, Turbowinds, Ropatec, Qingdao Anhua New Energy Equipment, Shandong Huaya Industry
Quantitative Methodology
Primary survey, n=3,800 respondents, Q4 2025, six countries; demand-side model with trade association cross-validation
Qualitative Methodology
47 expert interviews, Q4 2025; applied to validate demand model assumptions, identify emerging dynamics, and assess competitive positioning
Report Format
PDF and XLSX data workbook (Word format preview document)
Publisher
Market Minds Advisory
Report Code
MMA-2026-ENE-521
Published
September 2026
Contact
sales@marketmindsadvisory.com | www.marketmindsadvisory.com

Purchase the full Small Wind Turbine Market Report (2026 to 2036).

The full report treats small wind as a component of hybrid system design rather than as a competitor to solar, which is the framing error that has made this market look like a failure when its surviving applications are growing steadily. It sizes six rated capacity classes with individual growth rates, seven regions built from off-grid need and wind resource, and the certification coverage that now determines market access. Competitive analysis covers twenty manufacturers on a consistent unit shipment basis, with certification and service reach treated as the decisive variables. Input cost modelling breaks out magnet, composite and steel exposure by manufacturer scale.
Six capacity classes with individual growth rates
Hybrid attachment rates by application and region
Certification coverage mapped across shipped models
Telecom framework procurement structures and requirements
Twenty manufacturers on consistent unit shipment basis
Rare earth magnet and composite cost exposure

Built For The People Who Decide

From boardroom strategy to bench-side execution, this report is read cover-to-cover by leaders shaping the next decade of their industry, turning demand scenarios, market dynamics and valuation benchmarks into decisions.
CXOs/ Presidents/ VPs/ Managers
M&A and Corporate Development
Strategy Teams and R&D Heads
Procurement and Product Directors
Regulatory and Compliance Leaders
Investor Relations and Equity Analysts