Market Minds Advisory
Small Space Furniture Market

Small Space Furniture Market: Small Space Furniture Market. Motorized Transforming Units Turn a Compromise Category Into a Design Statement

Urban apartment renters increasingly demand documented weight capacity and transformation mechanism durability before buying convertible furniture, leaving manufacturers of basic folding designs struggling to justify premium pricing across most urban retail channels.

Lead Analyst

Published

September 2026

Make Smarter Decisions with Customized Research Insights

Request a free sample report and evaluate market opportunities, growth trends, and competitive dynamics relevant to your business needs.

2025 MARKET VALUE$8.4BMarket Size 2025
2036 FORECAST VALUE$18.8BBase Case , 2026 to 2036
CAGR 2026 TO 20367.6 %Bull 8.8% / Bear 6.4%
INCREMENTAL OPPORTUNITY$9.8BNet 10- year value creation
EXPANSION MULTIPLE2.08x2036 value over 2026 base
Strategic Levers
M&A Pipeline
Regional Outlook
Country Rankings
Competitive Intelligence
Segmental Deep-dive
Call-Us : 91 93563 13602

Executive Snapshot and Market Trajectory.

Urban apartment renters increasingly demand documented weight capacity and transformation mechanism durability before buying convertible furniture, leaving manufacturers of basic folding designs struggling to justify premium pricing across nearly every urban retail channel nationwide. That shift is already reshaping how retailers position and price competing furniture lines across the industry.
Multifunctional and convertible furniture remains the largest category by revenue, but smart and motorized transforming units and modular sectional seating are growing far faster as renters chase both automated space transformation and flexible configuration in the same purchase decision. East Asia commands the deepest manufacturing and consumer demand anywhere in the category, reflecting China, Japan, and South Korea's dense urban living patterns where compact apartment living is the housing default.
Competition concentrates among a mix of established global furniture retailers and specialized transforming furniture developers building motorized mechanism capability from the ground up. Mechanism durability certification, weight capacity credibility, and urban retailer distribution partnerships are together reshaping which manufacturers can convert one-time apartment furnishing purchases into durable, multi-move customer relationships across the coming decade of continued global urban densification. That gap keeps widening across retail channels.
Market Definition
The small space furniture market covers multifunctional and convertible furniture, modular and sectional small-space seating, foldable and nesting tables, compact storage and space-saving cabinetry, wall-mounted and space-saving desks, and smart and motorized transforming furniture designed for compact residential living. It excludes standard full-size furniture and outdoor or commercial furniture not designed specifically for space-constrained interiors.
Base Year Value
$8.4B in 2025 (MMA Primary Research Dataset, August 2026)
Forecast Period
2026 to 2036, eleven discrete annual values
CAGR
7.6% base case. Bull 8.8%. Bear 6.4%.
Fastest Growth Segment
Smart and Motorized Transforming Furniture: 13.0% CAGR
Fastest Growth Country
India: 10.5% CAGR
Fastest Growth Region
South Asia and Pacific: 9.6% CAGR
Largest Region
East Asia: 30% of 2025 global value
Market Leaders
IKEA, Wayfair Inc., Resource Furniture LLC, Ori Living Inc., Clei S.r.l. Source: MMA Analysis based on company annual reports.
Primary Survey
n=3,800 procurement and R&D decision-makers, Q4 2025, six countries
Methodology
Demand-side build-up, cross-validated against public data, 47 expert interviews

Small Space Furniture Market Forecast Scenarios

small-space-furniture-market-size-forecast-scenario-1788167564256
Between 2020 and 2025 the market grew near a 6.6% annual pace as urban apartment sizes steadily shrank across major metropolitan markets, before motorized transformation technology accelerated adoption sharply from 2023 onward as manufacturers began embedding automated mechanisms into flagship product lines across the industry already. across the industry. nationwide already. across the sector. overall.
The base case carries the market to a 7.6% CAGR on three commercial mechanisms: smart and motorized transforming furniture scaling as renters chase automated space transformation, modular sectional seating demand growing as flexible configuration becomes a genuine purchase driver for changeable living arrangements, and multifunctional furniture demand holding steady as established manufacturers continue expanding into adjacent apartment and dormitory retail channels. That combination is expected to persist through most of the forecast window.
The bull case at 8.8% assumes motorized transformation technology spreads faster than currently modelled across multiple manufacturer product lines simultaneously. The bear case at 6.4% assumes premium mechanism pricing continues constraining mainstream adoption longer than expected, holding category growth closer to existing basic folding furniture volume. Both scenarios assume no major disruption to existing furniture manufacturing supply chains.

Motorized Mechanisms Redraw a Compromise Category

Three forces converge on this category at once. Urban renters need documented weight capacity and mechanism durability that satisfies genuine multi-year ownership expectations in small footprints, property developers need differentiated amenity furniture that justifies premium unit pricing against conventional apartment layouts, and budget-conscious buyers need reliable basic folding designs that meet core safety standards without premium mechanism features.
TOP PRODUCER SHAREChina, 38%Share of global output manufactured in Chinese facilities today
AVERAGE UNIT PRICEUSD 620 per pieceBlended average retail price across small space furniture categories
HARDWARE COST SHARE36% of COGSWood and hardware component share of total unit production cost
MULTIFUNCTIONAL SEGMENT SHARE34% of volumeTotal unit volume sold into multifunctional furniture applications
PRODUCT DEVELOPMENT CYCLE16 to 24 monthsTypical time to bring a new transforming design to market
MARKET CONCENTRATIONCR5: 26%Combined share held by the five largest manufacturers
Commercially, the category rewards manufacturers who can pair documented mechanism durability with genuine weight capacity credibility rather than relying on design aesthetics alone. Manufacturers that can guarantee both transformation reliability and structural safety command pricing that unverified competitors cannot access, which is why property developers and premium retailers increasingly default to a narrow pool of established manufacturers rather than stocking whichever piece claims the lowest price point. That preference has hardened as several early motorized transforming furniture designs suffered well-publicized mechanism failures that damaged consumer trust across the category.
Over the next decade, mechanism durability certification, weight capacity credibility, and urban retailer distribution partnerships will decide which manufacturers convert one-time apartment furnishing purchases into durable multi-move customer relationships. Manufacturers without genuine durability credentials risk losing premium urban retail placement entirely as mechanism reliability continues becoming a primary purchase driver across the category.
"A murphy bed used to be a novelty. Now it has to survive a decade of daily use in a four-hundred-square-foot apartment, and that is a genuine engineering problem, not just a design one."
Director, Compact and Multifunctional Living Furniture Practice · MMA Compact and Multifunctional Living Furniture Practice · August 2026

Market Trends

Motorized Mechanisms Automate Furniture Room Transformation

Manufacturers increasingly embed motorized mechanisms into flagship transforming furniture as renters demand documented automated transformation rather than manual folding and lifting. Ori Living and Bumblebee Spaces have both launched motorized product lines specifically to serve this demand, since automated transformation now requires electronics engineering that standard furniture manufacturers cannot provide without dedicated technology investment. This shift is pulling renter interest away from conventional manual folding designs toward premium motorized units that command substantially higher price points across most urban retail channels. Retailers now treat this capability as a baseline requirement on flagship product launches across the category.
Market Impact: Adds 10% to urban apartment demand
Modular Seating Adapts to Changeable Living Arrangements

Urban renters increasingly favor modular and sectional seating that reconfigures for roommates, guests, and changing apartment layouts over fixed-format sofas and chairs. Resource Furniture and Clei have both expanded modular product lines specifically to serve this demand, since flexible configuration increasingly differentiates premium urban positioning from commodity fixed-format alternatives. This shift is pulling manufacturer investment toward modular formats that carry meaningfully higher margin protection than fixed-format seating typically provides. That flexibility increasingly extends well beyond seating into adjacent storage and sleeping furniture applications. Retailers now treat this configuration depth as a baseline requirement on premium urban product lines.
Market Impact: Adds 9% to Indian category volume

Market Opportunities and Growth Drivers

Shrinking Urban Apartment Sizes Sustain Category Demand

Sustained shrinkage in average urban apartment size, particularly across major gateway cities facing housing affordability pressure, continues driving demand for furniture that delivers full functionality within a fraction of conventional floor space. Multiple property developers have published amenity specification standards specifically built around documented space-saving furniture performance, giving manufacturers with proven durability data a direct competitive advantage in securing developer specification decisions. That space-driven demand has proven durable across multiple housing cycles rather than a passing trend. Manufacturers without this documented reliability record increasingly struggle to win developer specification decisions at all.
Market Impact: Margin can swing 11 points

India's Rapid Urbanization Sustains Volume Growth

India's rapidly expanding urban population, combined with shrinking apartment sizes across major metropolitan markets, sustains substantial volume growth as domestic and international manufacturers compete for market share. Domestic manufacturers have established local production partnerships specifically to serve this demand, since Indian urban renters increasingly research durability and warranty credentials before purchase decisions. That urbanization-driven growth has proven durable across multiple product cycles rather than a temporary surge. Retailers increasingly favour manufacturers that document this clearly across their entire product catalog. International manufacturers without a local production presence increasingly struggle to win Indian retail placement at all today.
Market Impact: Premium pricing delays adoption 20 months

Market Restraints and Challenges

Wood and Hardware Cost Volatility Compresses Manufacturer Margin

Wood and metal hardware component costs have swung sharply in recent years as global furniture and construction materials demand moved independent of any change in downstream small space furniture demand, since these inputs serve much larger furniture and construction industries whose demand dwarfs the small space furniture category specifically. The root cause is broad materials market volatility rather than any category-specific supply issue, meaning manufacturers absorb the same price swings affecting the entire furniture materials industry. Manufacturers are mitigating this through longer-term material contracts and increased design flexibility across hardware generations.
Market Impact: Motorized furniture demand grows 15% yearly

Premium Mechanism Pricing Constrains Mainstream Adoption

Premium pricing well above conventional folding furniture continues constraining mainstream consumer adoption of motorized transforming units spanning sixteen to twenty-four months longer than manufacturers would otherwise prefer, limiting how quickly automated furniture can actually reach price-sensitive renters regardless of manufacturer production capacity. The root cause is genuine component cost structure rather than any manufacturer-side pricing strategy failure, since motorized mechanisms remain fundamentally more expensive to produce than manual alternatives. Manufacturers are mitigating this by pursuing component cost reduction roadmaps and by expanding rental furniture financing programmes. That financing approach lets manufacturers reach budget-constrained renters years before mechanism costs decline.
Market Impact: Modular seating demand grows past 8%
3 additional market trends, 4 additional growth drivers, and 3 additional restraints and challenges are covered in the full report. Contact sales@marketmindsadvisory.com to access the complete intelligence.

Segment CAGR and Growth Architecture

Segmentation follows product type, a single classification logic, since multifunctional, modular seating, foldable tables, compact storage, wall-mounted desks, and motorized transforming furniture each require distinct engineering disciplines rather than differing by price tier or distribution channel across the value chain. That single dimension keeps comparisons across categories consistent and auditable for every regional buyer.
small-space-furniture-market-market-share-analysis-1788167564816

Smart and Motorized Transforming Furniture

Smart and motorized transforming furniture grows fastest at 13.0%, about 1.71 times the overall 7.6% rate, as renters increasingly demand documented automated transformation that conventional manual folding furniture cannot provide. This segment demands electronics engineering and mechanism reliability testing that traditional furniture manufacturers cannot simply add without dedicated technology investment. Ori Living and Bumblebee Spaces lead qualified motorized supply, competing on documented mechanism reliability and weight capacity performance rather than price alone. Growth concentrates around premium urban apartment and developer amenity applications, where automated transformation increasingly justifies retail pricing well above conventional folding units. Investors and developer partners increasingly track mechanism milestones as a leading indicator of near-term product readiness.
CAGR 13.0%

Modular and Sectional Small-Space Seating

Modular and sectional small-space seating grows at 9.0%, the second-fastest segment, as urban renters increasingly favor reconfigurable seating over fixed-format sofas for changeable living arrangements. Resource Furniture and Clei lead qualified modular supply, competing on documented reconfiguration flexibility and structural durability rather than raw unit volume alone. Unlike fixed-format seating, this segment sells substantially into shared-living and frequent-mover retail channels rather than conventional single-family furniture applications, so reconfiguration ease and durability testing matter as much as design aesthetics itself to a purchase decision. Developer buyers increasingly treat reconfiguration flexibility as a prerequisite before evaluating any new supplier relationship for shared-living projects. That heightened scrutiny lengthens qualification timelines but rewards manufacturers with existing developer relationships already established across the market.
CAGR 9.0%
Full segment breakdown across 6 segments available in the complete report.

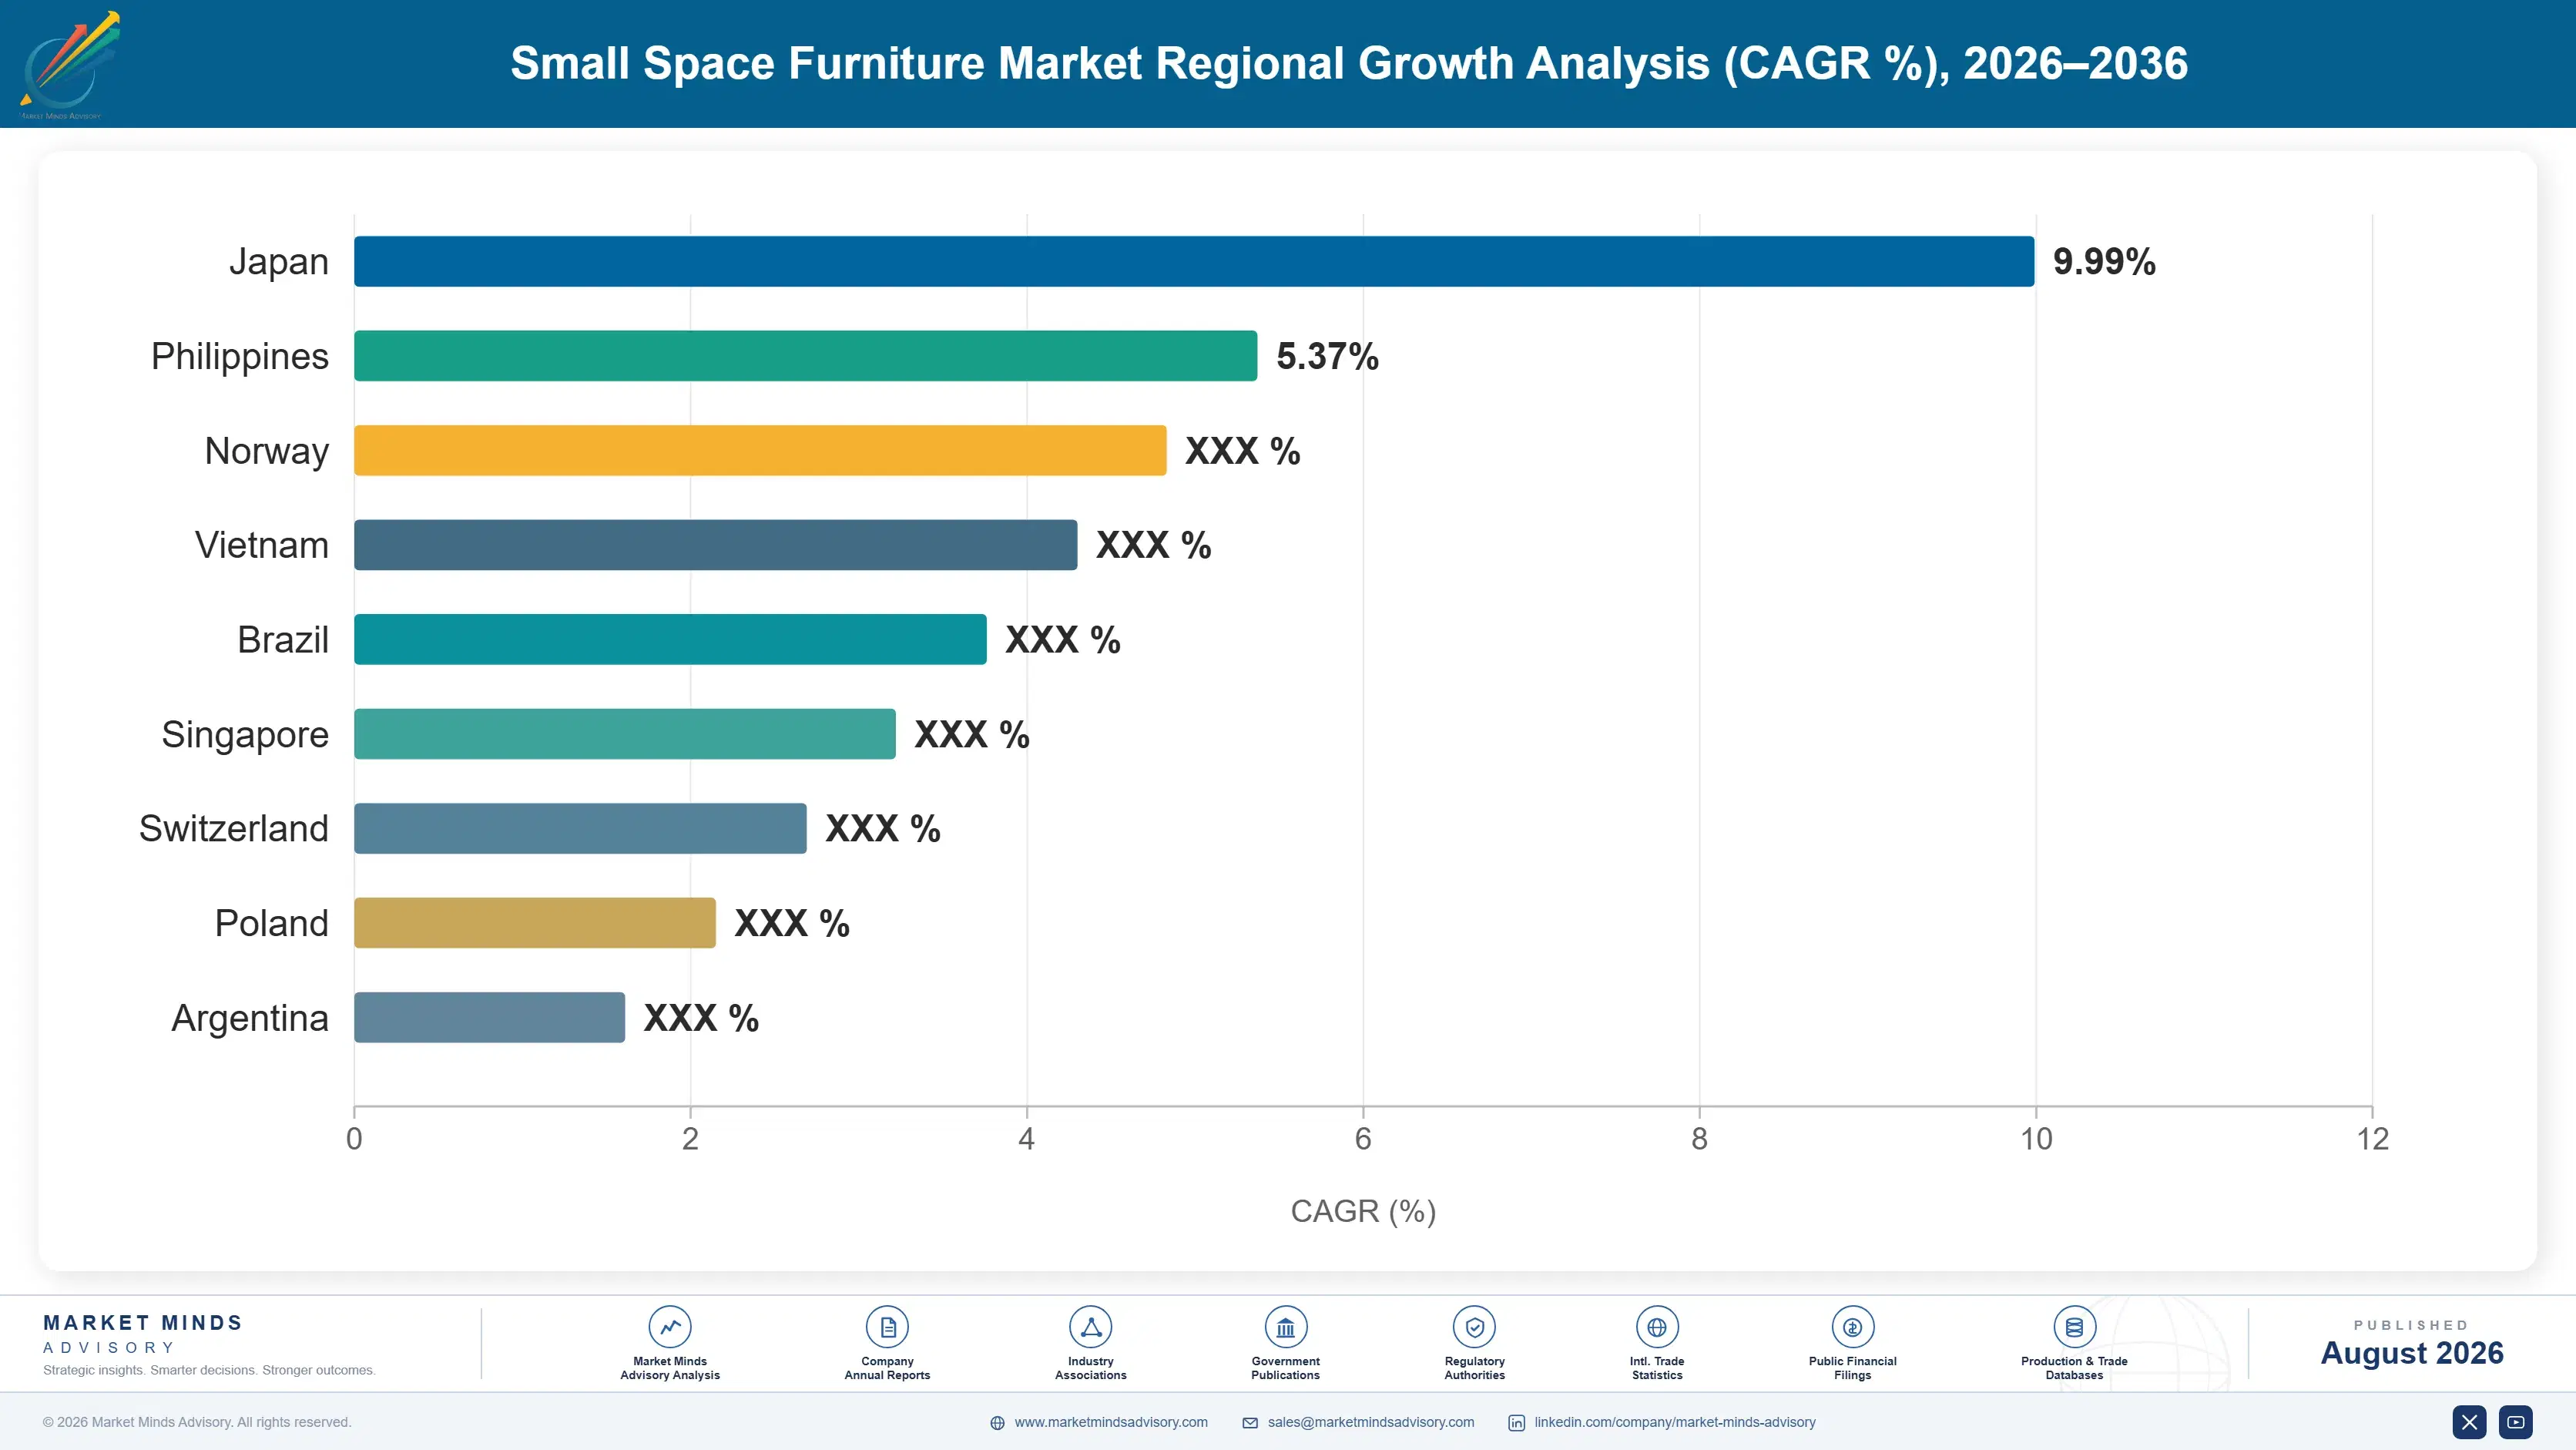
Regional Architecture and Country Demand Map

East Asia leads on dense urban living patterns and manufacturing scale, while South Asia and Pacific posts the fastest growth as rapid urbanization accelerates across expanding metropolitan populations. East Asia holds 30% of global value, well ahead of the smallest region's modest contribution to worldwide demand.

North America

United States and Canadian urban renters' growing preference for space-efficient furniture, reinforced by persistent housing affordability pressure across major gateway cities, give North America 24% of global value despite a domestic manufacturing base smaller than East Asia's. Wayfair and Resource Furniture's domestic distribution operations supply both premium and mid-market urban customers from established retail networks. United States property developers increasingly specify documented durability testing before furnishing amenity units nationwide. Growth of 6.8% tracks urban housing demand more directly than any broader manufacturing trend on its own, reflecting the region's still-developing small-space furniture adoption curve. Continued housing pressure across major metro markets keeps that demand growing steadily each year. That trend is expected to continue through the forecast window.
Share: 24% | CAGR: 6.8% (2026 to 2036)

Western Europe

Germany, Italy, and France's established compact furniture design heritage, anchored by decades of European small-apartment living tradition, give Western Europe 20% of global value despite a domestic manufacturing base smaller than East Asia's. Clei, headquartered within the region, holds deep design heritage built around transforming furniture innovation since pioneering the category decades ago. Italian and German retailers increasingly specify documented mechanism certification even beyond baseline safety standards already required. Growth of 6.1%, the slowest major region, reflects an already mature compact furniture design market rather than any underlying demand weakness. That regulatory framework is expected to keep the region a reliable certified consumption base for years to come. Regulatory interest in mechanism safety keeps pricing power intact for documented brands.
Share: 20% | CAGR: 6.1% (2026 to 2036)
Regional intelligence for 5 additional markets available in the complete report: East Asia, South Asia and Pacific, Latin America, Middle East and Africa, Eastern Europe. Contact sales@marketmindsadvisory.com.
small-space-furniture-market-country-cagr-analysis-1788167565331

Where Mechanism Reliability Creates Retail Margin

Margin in this category increasingly sits in mechanism durability depth and weight capacity credibility rather than in raw manufacturing scale alone. Manufacturers converting that capability into premium motorized and certified contracts are pulling well ahead of competitors still selling undifferentiated basic folding furniture into a price-sensitive replacement channel. That gap increasingly decides which manufacturers earn premium contracts.

Build Motorized Mechanism Reliability Testing Programmes

Manufacturers that build documented motorized mechanism reliability testing ahead of confirmed buyer skepticism can access premium pricing that manual-only competitors cannot obtain regardless of the price they offer. Ori Living's reliability programme illustrates how testing investment made years before consumer trust concerns intensified converts directly into preferred-brand status once renters expect genuine multi-year mechanism reliability from a premium unit. That investment typically takes 18 to 26 months but opens the broadest possible premium urban customer base available industry-wide. Competitors lacking this testing are increasingly locked out of premium urban evaluation regardless of price offered during negotiation.
Market Impact: Reliability testing lifts device pricing roughly 30% overall

Develop Documented Weight Capacity Certification Systems

Manufacturers that develop documented weight capacity certification ahead of confirmed developer demand capture amenity specification contracts that lower-certification competitors cannot fulfil once developers require guaranteed structural safety documentation across their entire property portfolio. Resource Furniture's certification programme shows how testing investment made before scrutiny intensified converts directly into preferred-vendor status once developers need proven safety evidence. That investment typically takes 14 to 20 months but lifts blended margin by roughly 15% once fully achieved. Competitors lacking certification increasingly lose renewal bids entirely once developers require documented compliance assurance. That evidence advantage compounds with every additional developer contract secured.
Market Impact: Weight certification lifts blended margin nearly 15% overall

Diversify Wood and Hardware Sourcing Across Regions

Manufacturers that diversify wood and hardware component sourcing across multiple qualified regions capture cost stability that single-source competitors cannot match when any one supplier's price spikes unexpectedly during a period of constrained global materials demand. That diversification typically adds 6% to 11% to procurement cost but secures the delivery reliability that developer and retail contracts increasingly require as a standing condition of the relationship itself. Developer customers increasingly require documented evidence of this resilience before awarding any large, multi-year supply contract. Developer customers increasingly require documented evidence of this resilience before awarding any large, multi-year supply contract of meaningful scale.
Market Impact: Diversified sourcing adds roughly 6% to 11% cost

Establish Urban Retailer Distribution Partnership Programmes

Manufacturers that establish documented urban retailer distribution partnership programmes ahead of confirmed placement demand capture retail contracts that competitors without curated urban retail relationships cannot access once premium retailers specify preferred brands from the earliest catalog planning stages. This approach typically adds 5% to 10% to trade marketing cost relative to standard retail distribution, but lets manufacturers secure placement years before a competing brand can intervene. Retailers increasingly require documented partnership terms before specifying any large-scale product line across their portfolio. Retailers increasingly require documented partnership terms before specifying any large-scale product line across their entire seasonal catalog.
Market Impact: Retailer partnerships add roughly 5% to 10% cost

Who Controls the Margin Pool

Concentration sits at a low CR5 of 26%, reflecting a category where mechanism durability credibility and weight capacity certification, not raw manufacturing scale alone, allow a long tail of smaller regional producers to coexist alongside a handful of scaled global furniture brands. IKEA leads on documented mainstream retail distribution and manufacturing breadth, and the gap to smaller challengers is measured in certification investment rather than in production capacity alone.
All participants are assessed on unit shipment volume across retail and developer specification channels, a consistent basis given how widely mechanism durability depth varies by manufacturer across the category. Current competitive activity concentrates on three fronts: motorized mechanism reliability development, weight capacity certification programmes, and wood and hardware sourcing diversification. That pattern spans every major manufacturer competing in the category.

Emerging pressure comes from motorized furniture technology startups scaling mechanism reliability faster than legacy manufacturers expected, backed by venture funding and direct urban retail marketing reach. Rankings are likely to shift toward manufacturers combining mechanism reliability with weight capacity credibility, since neither design heritage nor manufacturing scale alone decides premium urban specification decisions anymore in this category.
small-space-furniture-market-company-positioning-matrix-1788167565856

Competitive Moat and Risk Dimensions

IKEA

Moat: Deepest mainstream retail scale

IKEA's established global retail network and documented design heritage give it retail and developer placement access that newer entrants cannot replicate without years of brand-building investment. That scale lets it serve premium and mainstream urban segments simultaneously with proven reliability documentation across a very broad product portfolio.
IKEA

Risk: Motorized Mechanism Development Lag

IKEA's manual-mechanism heritage leaves it comparatively less advanced in motorized transformation development than newer entrants purpose-built around automated mechanisms from the outset, risking premium positioning erosion as motorization becomes the primary purchase driver. IKEA would need substantial engineering talent acquisition to close this gap against purpose-built motorized competitors.
RESOURCE FURNITURE LLC

Moat: Strong transforming furniture credibility

Resource Furniture's established mechanism engineering capability and documented durability testing give it premium contract access that mass-market competitors must contest through lengthy reliability-building processes that discerning developers increasingly require. That reputation also feeds premium pricing power that supports continued investment in mechanism development ahead of competitors.
RESOURCE FURNITURE LLC

Risk: Premium Price Point Vulnerability

Resource Furniture's premium pricing strategy leaves it exposed to renovation budget tightening during economic downturns in a way that value-tier competitors positioned below the premium segment are not, particularly among cost-sensitive urban renters. Diversifying into more accessible mid-tier lines would help offset this exposure over the medium term.

Players Tracked

Prominent Players

IKEA
Wayfair Inc.
Resource Furniture LLC
Ori Living Inc.
Clei S.r.l.

Other Key Players

West Elm
CB2
Article.com Inc.
Expand Furniture
BDI
MASH Studios
Bumblebee Spaces Inc.
Smart Furniture
La Fete Design Studio
Hafele
Murphy Door Inc.
Flexispot
Room and Board
Zinus Inc.
South Shore Furniture

Recent Developments

FEBRUARY 2025

Ori Living Expands Motorized Mechanism Manufacturing Capacity

Ori Living completed an organic capacity expansion at its motorized mechanism manufacturing facility to meet growing demand from multiple urban developer channels. The expansion was an organic capacity build, not an acquisition or joint venture, adding dedicated production volume ahead of anticipated demand. Additional output becomes available early 2026.
Signal: An organic expansion, not a transaction, shows manufacturers investing well ahead of anticipated future demand growth.
JUNE 2025

Resource Furniture Signs Developer Specification Agreement

Resource Furniture signed a multi-year developer specification agreement with a national residential builder to provide certified transforming furniture across an expanded amenity programme. The arrangement was a supply agreement, not an acquisition or joint venture, securing guaranteed volume ahead of the builder's schedule. Rollout begins in Q1 2026.
Signal: A supply agreement, not a merger, shows developer demand now drives multi-year sourcing decisions ahead of schedule.
OCTOBER 2025

Wayfair Acquires Minority Stake in Smart Furniture Startup

Wayfair acquired a minority equity stake in a smart furniture technology startup developing novel motorized transformation sensors for compact living applications. The transaction was an equity investment rather than a full acquisition or merger, giving Wayfair early technology access without full development risk. Initial deployment is planned for late 2026.
Signal: A minority stake, not a full acquisition, shows manufacturers hedging smart furniture technology bets rather carefully.

Wood and Motorized Component Exposure

Wood and metal hardware components account for roughly 36% of unit cost, sourced from established furniture material and hardware suppliers across China, the United States, and Vietnam, with motorized mechanisms and electronics adding a further 16% to 24% depending on automation depth and certification category required for the specific product involved. Qualification requirements limit how quickly manufacturers shift toward alternative material suppliers.
Wood and hardware prices climbed sharply through 2022 and 2023 as global furniture manufacturing demand rebounded against constrained lumber and metal production capacity across major producing regions. The US Census Bureau has documented furniture materials supply concentration as a persistent manufacturing industry concern given the limited number of qualified producing facilities, and manufacturers without long-term material contracts absorbed the cost spike directly into margin during the worst months of that period.

Exposure varies considerably by manufacturer scale and material sourcing diversity across the industry. Larger integrated manufacturers like IKEA hedge material exposure through long-term supply partnerships, while smaller regional manufacturers buying materials on constrained markets absorb price swings immediately into unit cost with no buffer available. That gap leaves smaller manufacturers disadvantaged during volatile periods. That gap leaves smaller manufacturers competing at a persistent disadvantage during volatile periods.
small-space-furniture-market-cost-volatility-analysis-1788167566051

Secure long-term wood and hardware supply contracts

Locking wood and hardware component volume through long-term supplier contracts protects production schedules from constrained supply during periods of peak furniture manufacturing demand across the industry. This trades some pricing flexibility for delivery certainty that developer contracts increasingly require as a standing condition of doing business at all. Manufacturers without such contracts risk delays whenever markets tighten unexpectedly.

Invest in flexible manufacturing platform architecture

Manufacturers shipping sufficient volume can justify investing in flexible manufacturing platforms that accommodate multiple material generations, capturing supply flexibility currently unavailable to single-architecture competitors while gaining direct control over cost timing over the medium to long term horizon. That flexibility typically pays back within three to five years for larger manufacturers shipping enough volume.

Diversify material sourcing across producing regions

Qualifying material suppliers across multiple regions simultaneously reduces exposure to any single region's trade policy disruption or production capacity constraint event. Manufacturers with diversified sourcing recovered from the 2022 to 2023 spike measurably faster than single-source buyers did, protecting margin through the worst of that volatility. Diversification also shortens lead times when a producing region faces export limits.

Portfolio Architecture for Margin Defence

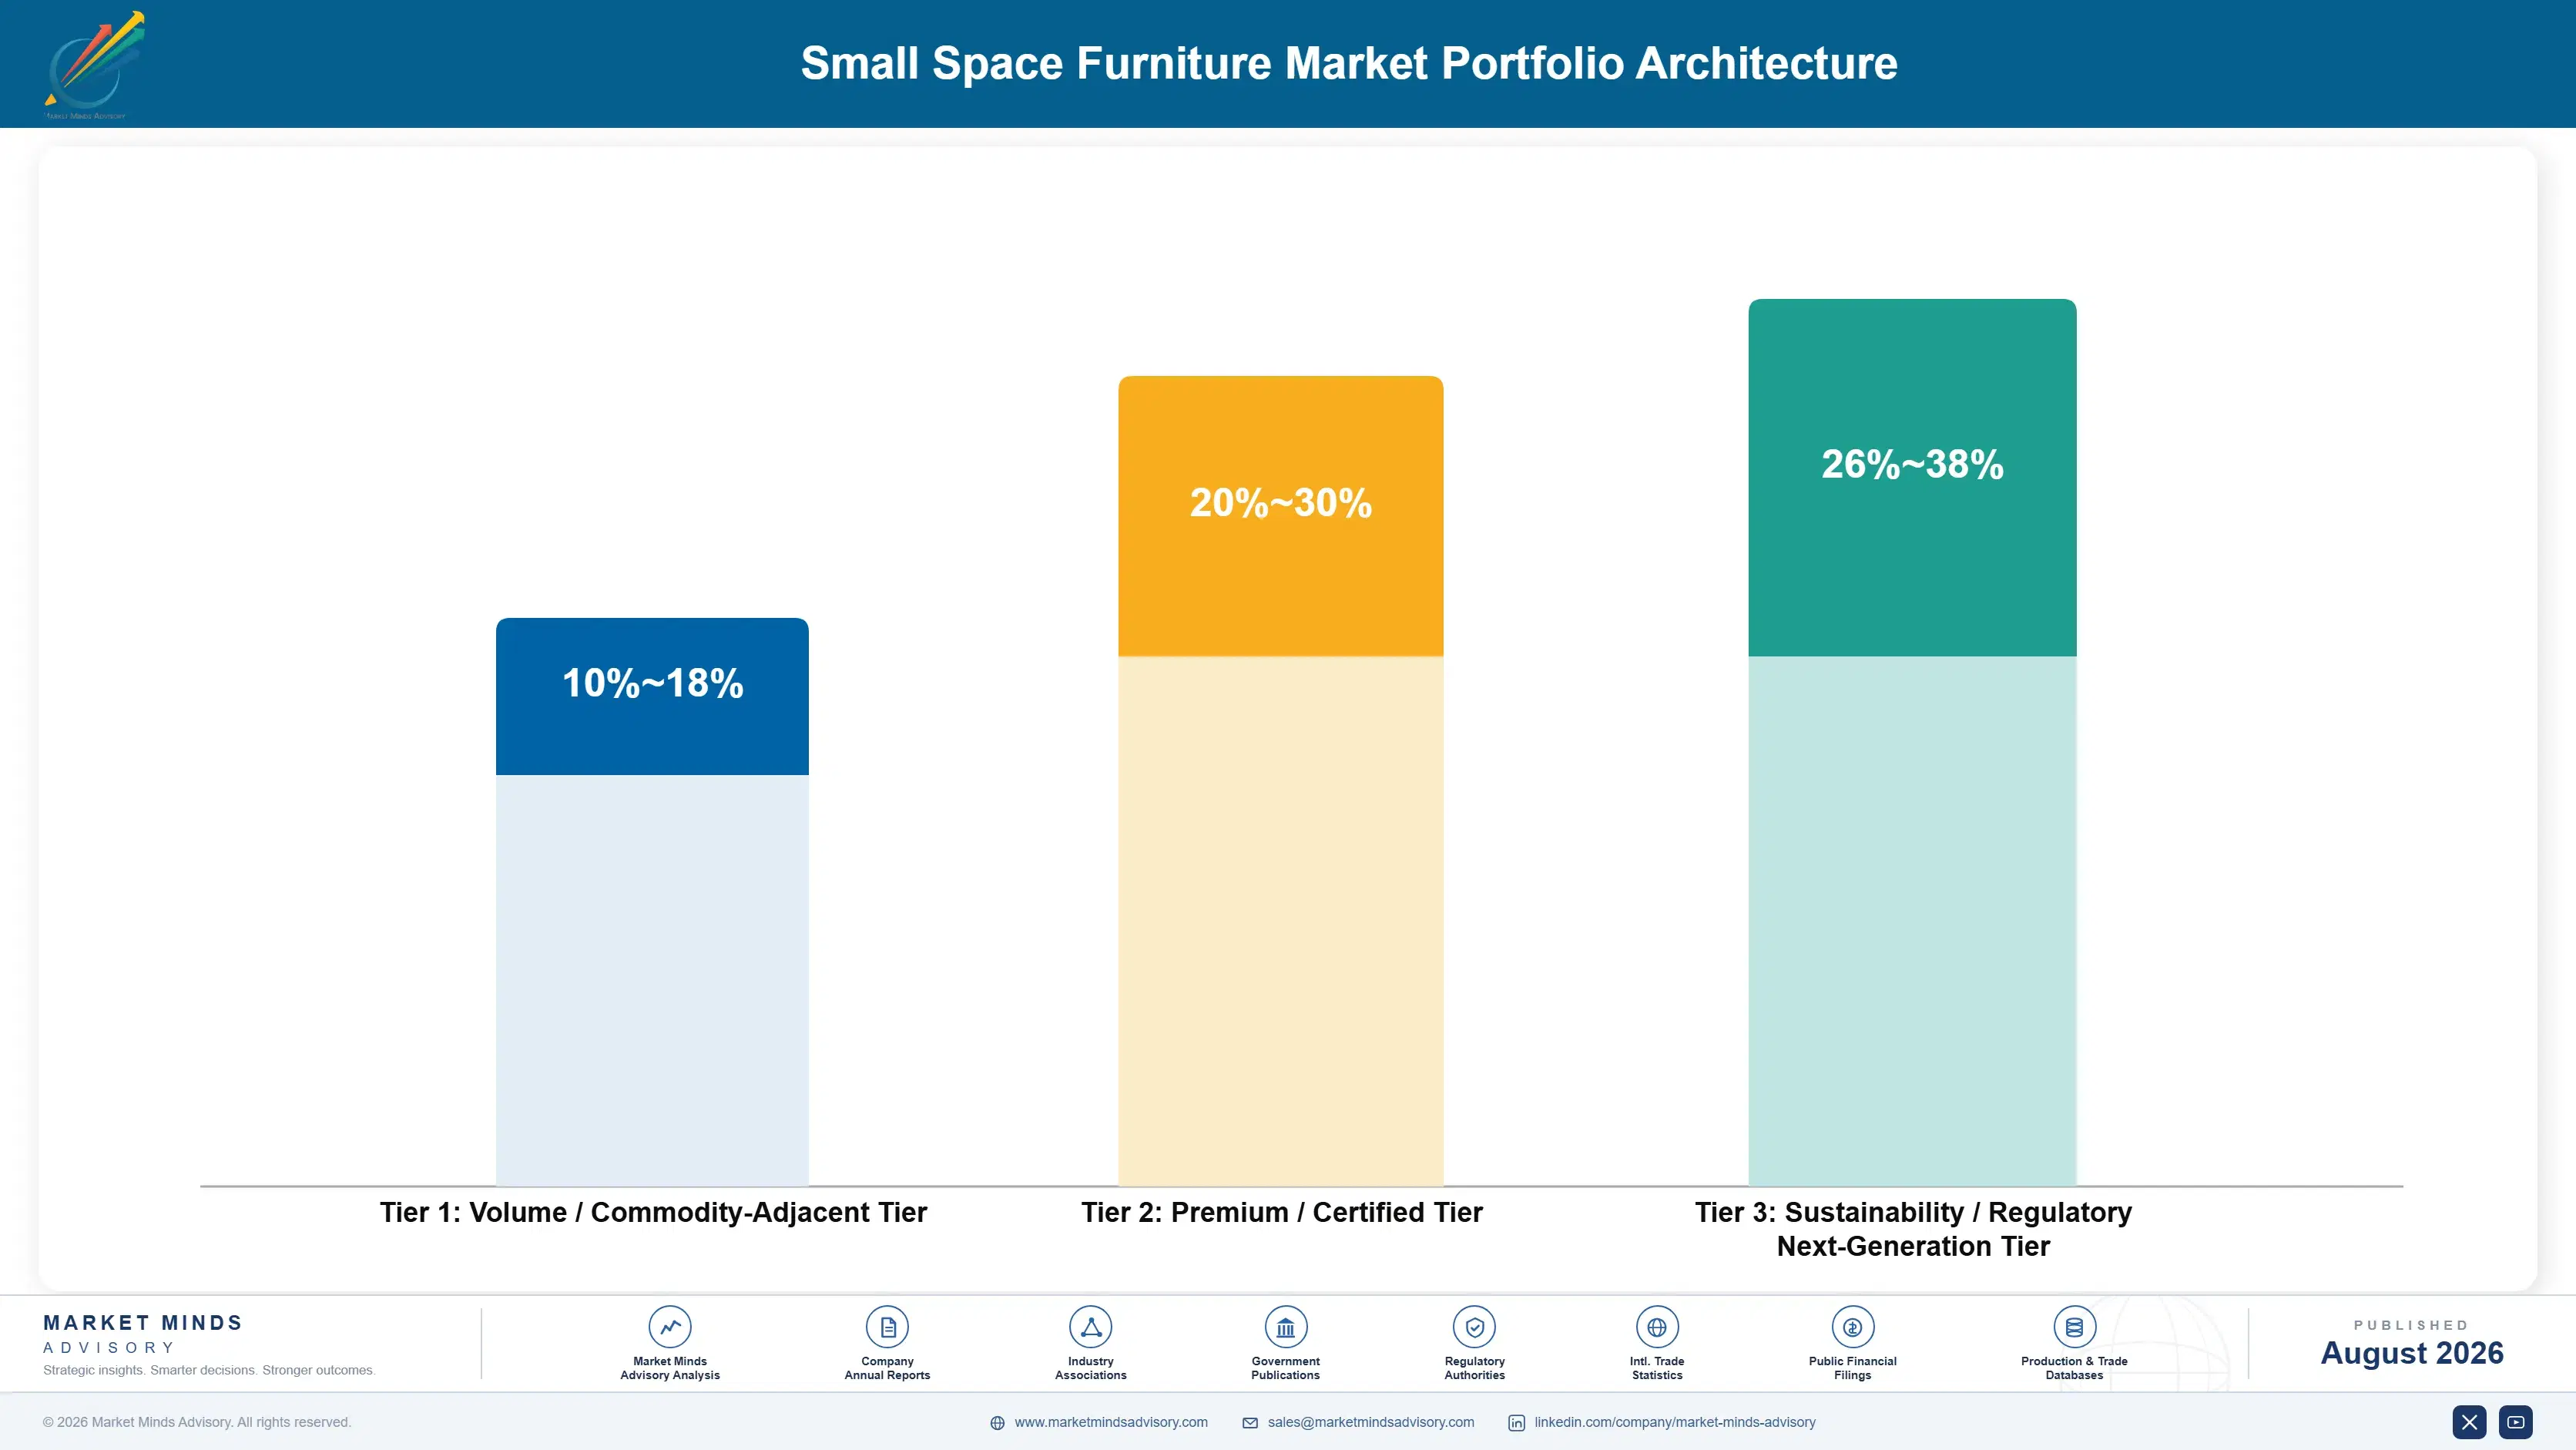
The portfolio splits into three tiers with clear margin separation tied to mechanism durability depth and product category served. Commodity-grade basic folding furniture for basic apartment applications compete on price and earn thin margins, certified modular and structural units earn considerably more, and smart motorized systems carry the highest margin given their electronics integration barriers and developer relationship depth protecting that position from new entrants.
The tension between volume and premium reflects category directly: developers and premium renters investing in motorized platforms reward documented mechanism performance and structural credentials over price, pulling manufacturers toward sustained technology investment year after year, while much of the commodity basic folding segment still buys on price alone with manufacturing scale mattering more than mechanism depth. Manufacturers running multiple product lines must manage genuinely distinct hardware, electronics, and developer relations organisations without letting either investment starve the other of resources.

High-value margin pools concentrate in smart motorized and certified modular contracts, where documented mechanism performance and structural credentials both reward proven manufacturer capability directly and consistently. The volume core of commodity basic folding furniture sale remains necessary for manufacturing scale but contributes comparatively little to blended margin across the portfolio as a whole.

Volume / Commodity-Adjacent Tier

Commodity-grade basic folding furniture sold into basic apartment and value-tier applications, competing primarily on price with limited technology investment behind them overall. Order volume typically substitutes for software differentiation in most purchase decisions here.
Gross Margin: 10-18%

Premium / Certified Tier

Certified modular and structurally tested units sold under documented durability performance into mainstream developer and retail contracts across multiple buyer segments worldwide. Developer reliability matters as much as price to most specification decisions.
Gross Margin: 20-30%

Sustainability / Regulatory / Next-Generation Tier

Smart motorized systems engineered specifically for the most demanding mechanism reliability and certification requirements available in the category today, commanding the deepest premium. Manufacturers here typically hold exclusive multi-year relationships with premium developer partners.
Gross Margin: 26-38%
small-space-furniture-market-portfolio-architecture-1788167566555

High-value Sub-segments and Strategic Watch-out

Smart and Motorized Transforming Furniture

High value and the fastest-growing category at 13.0% CAGR, carrying both a mechanism-technology premium and genuine electronics development barriers to entry that protect early movers from new entrants over time. Manufacturers already qualified here hold a durable multi-year advantage over prospective new entrants. Managers rarely switch suppliers once qualified.
Gross Margin: 26-38%

Modular and Sectional Small-Space Seating

High value with strong growth, sustained by renters specifying documented reconfiguration flexibility across multiple living arrangements. Margin varies with the durability testing depth a manufacturer holds. That relationship depth compounds across successive renovation cycles over a developer's full project pipeline. Certified vendors earn repeat business each cycle.
Gross Margin: 20-30%

Multifunctional and Convertible Furniture

The volume core, competing on price and reliability across most mainstream apartment and dormitory applications worldwide. Margin stays thin because manufacturing scale, not mechanism depth, dominates decisions in this segment. Manufacturers here compete mainly on distribution reach and unit cost rather than mechanism depth. Scale advantages compound over time.
Gross Margin: 10-18%

Foldable and Nesting Tables

The strategic watch-out, where buyer willingness to pay a documentation premium remains largely unproven across niche budget applications today. Margin range is wide because pricing power varies sharply by individual customer relationship. Manufacturers that misjudge this segment risk overinvesting in documentation buyers ultimately will not pay for.
Gross Margin: 12-22%

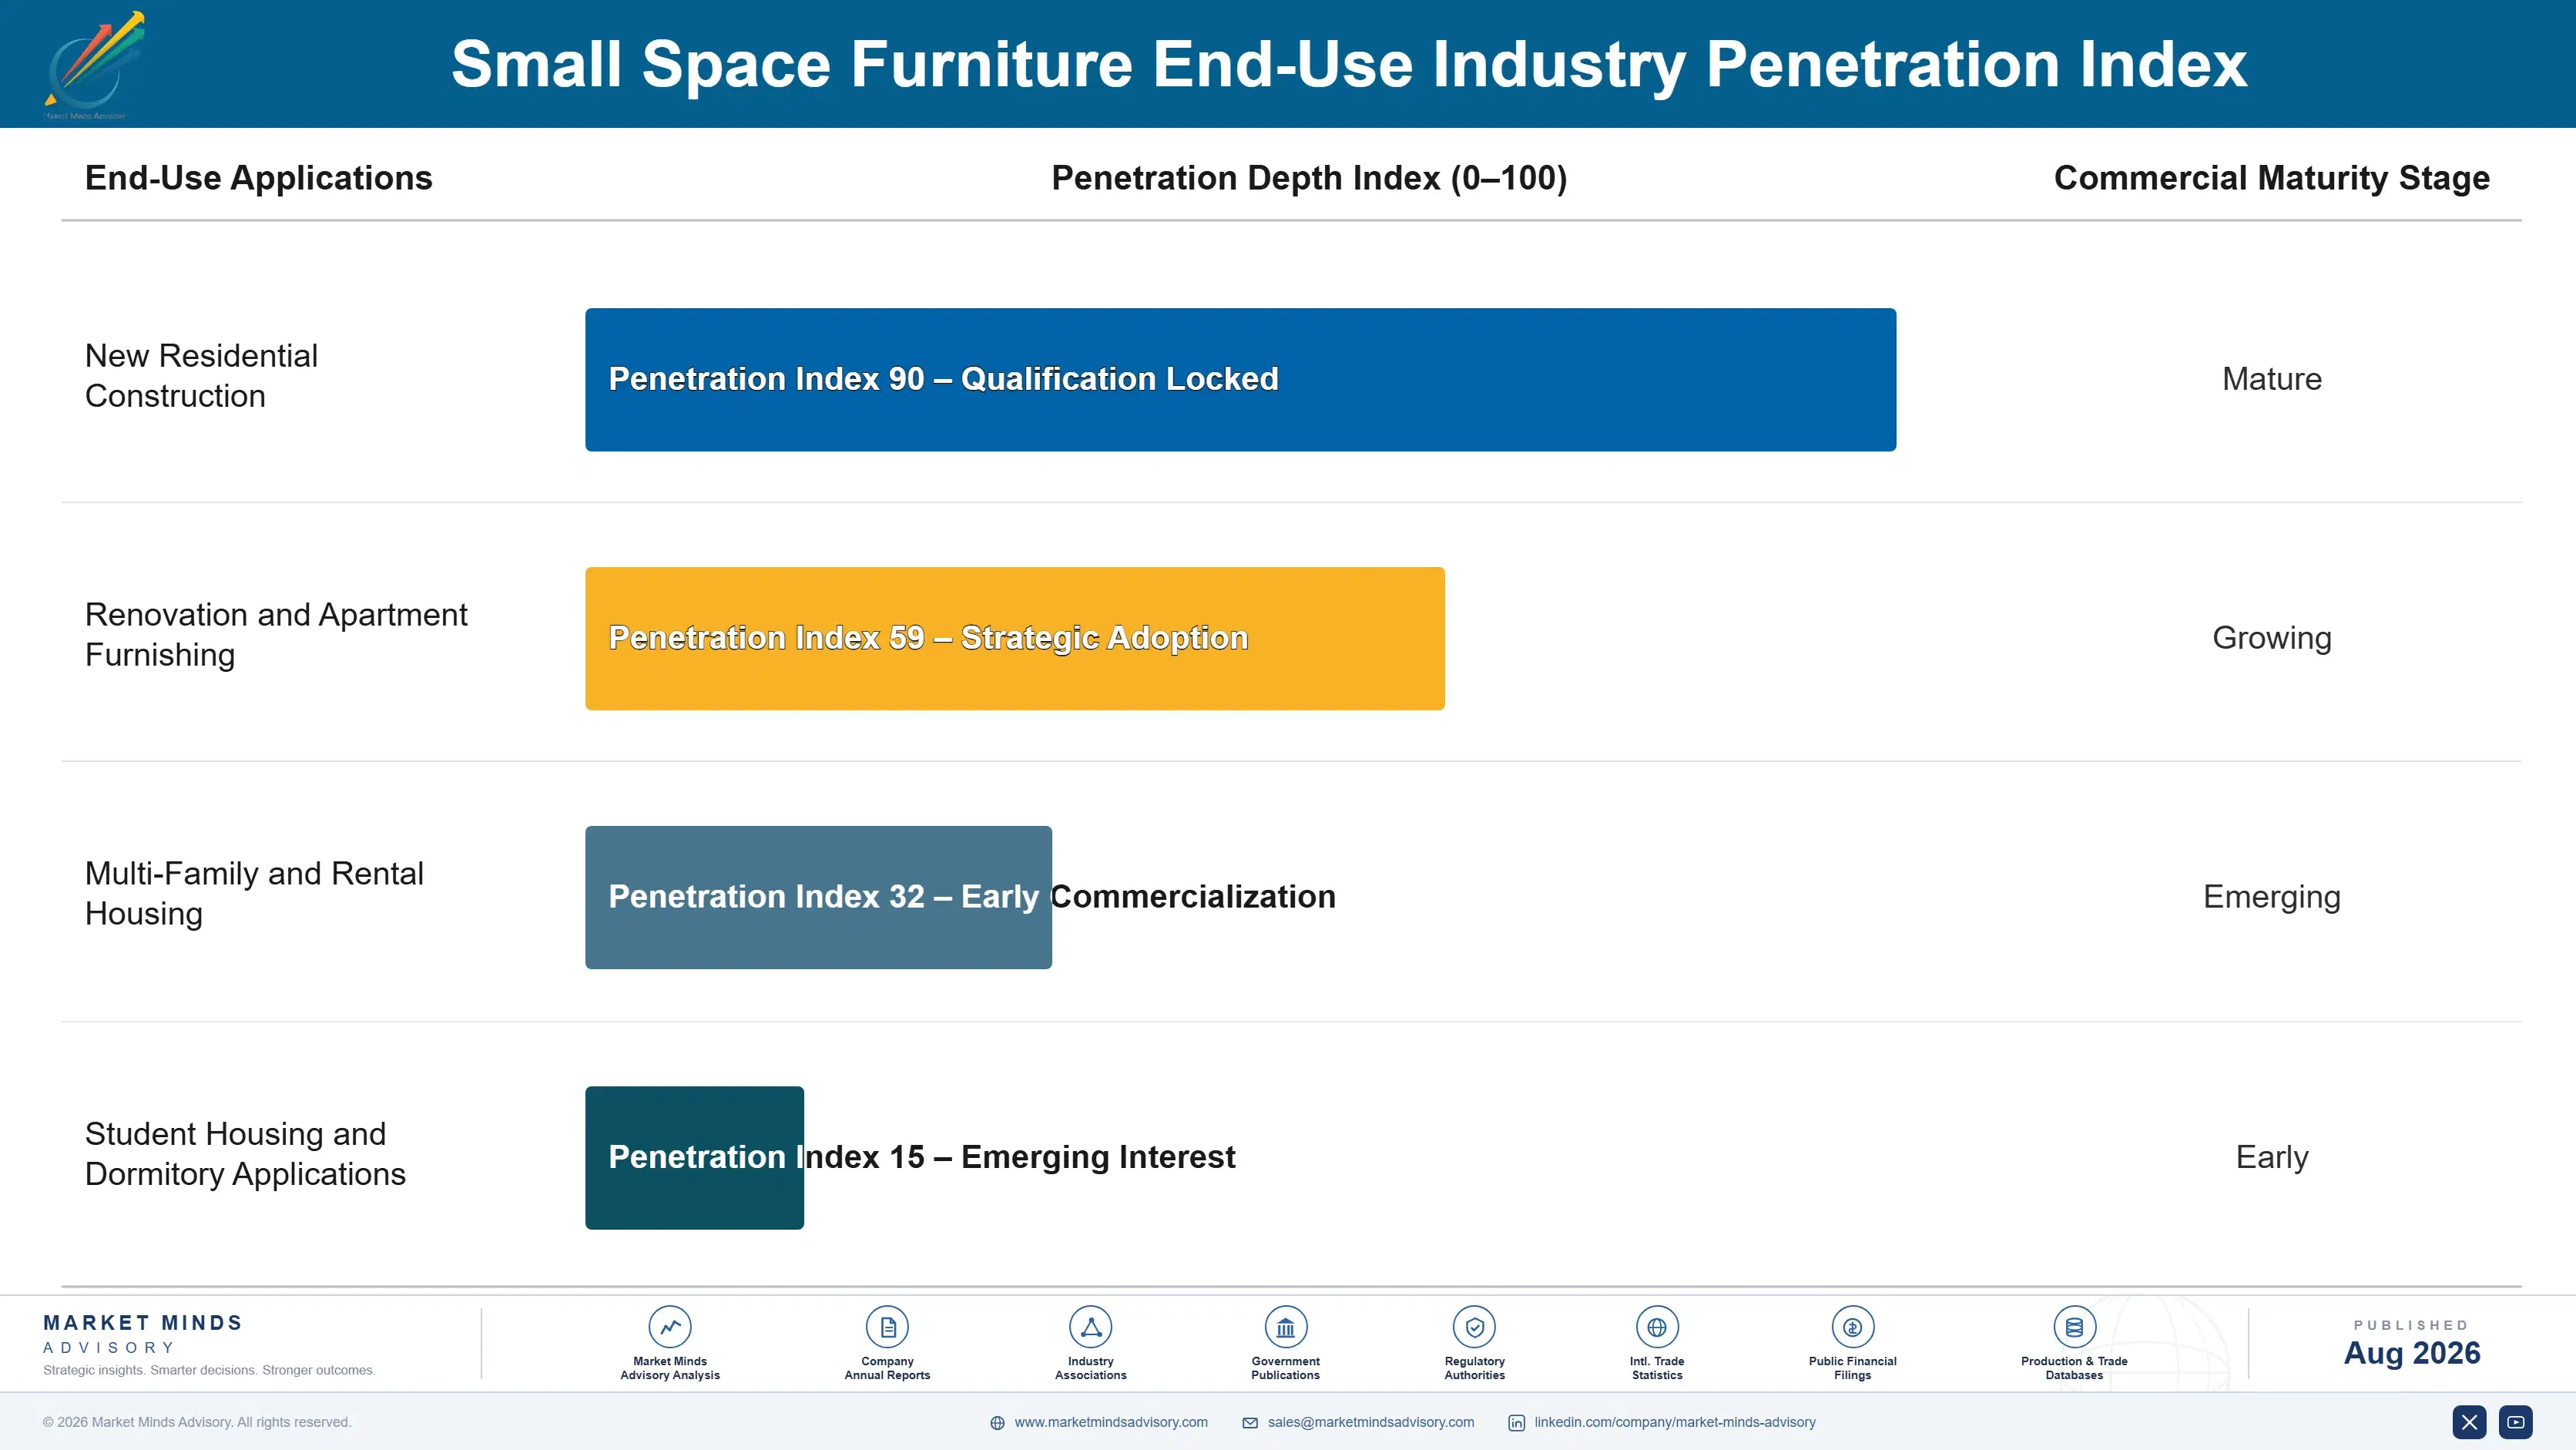
Developer Specification Lock-In and Renter Trust

Demand behaves like an annuity once a manufacturer wins developer amenity specification: developers rarely switch furniture vendors mid-property-portfolio, since replacing a specified line means repeating months of design coordination and installation compatibility review against a product that already has proven durability performance. That repeat-purchase pattern gives incumbent qualified manufacturers a durable revenue base that newer competitors cannot easily displace once specification has been established across a developer's ongoing project pipeline.
Adoption depth varies sharply by buyer category. Premium developers and design-conscious renters have converted deepest, since documented mechanism reliability and weight capacity requirements make qualified sourcing close to mandatory for responsible specification decisions. Mid-market replacement buyers adopt more selectively, weighing furniture cost against apartment budget on a project-by-project basis, while budget renters remain the shallowest adopters, often defaulting to whatever basic folding unit is available that budget cycle.

Buyer profiles are shifting generationally. Younger urban renters increasingly default to documented mechanism-certified manufacturers without evaluating manual-only alternatives as heavily, treating automated transformation as a baseline requirement rather than an optional consideration. That default is spreading faster among new-construction renters than among legacy replacement buyers, who weigh proven reliability track record most heavily at the point of purchase decision.
small-space-furniture-market-end-use-penetration-index-1788167567042

Mechanism Reliability Beats Legacy Manufacturing Scale

These are among the four positions where our research anticipates prominent divergence between winners and laggards over the coming forecast period. Each is grounded in the demand model, the regulatory perimeter, and the announced capacity pipeline.
01 / MECHANISM RELIABILITY STRATEGY

Manufacturers without reliability data will lose developer specification by 2029

Developers increasingly default to manufacturers holding documented motorized mechanism reliability testing. Manual-only manufacturers cannot supply the genuine transformation durability that both developers and premium renters now expect from a premium unit. Ori Living's reliability programme shows how addressable premium pricing follows directly from testing investment completed years earlier rather than from any late entry attempt, and that gap will keep compounding as motorized furniture technology spreads across every major urban segment worldwide, rewarding manufacturers that invested in testing well before consumer trust concerns intensified broadly.
02 / WEIGHT CERTIFICATION TIMING

Early certification investment will decide long-term developer contract share

Developers increasingly require documented weight capacity certification before approving any major furniture specification decision. Manufacturers without that capability cannot bid on these contracts regardless of the price they offer during negotiation. Resource Furniture's certification programme shows how testing completed years before scrutiny intensified converts directly into preferred-vendor status that competitors cannot quickly replicate, and that advantage keeps compounding as more developers require documented structural safety evidence, leaving unverified competitors further behind with each passing developer procurement cycle across the industry.
03 / MATERIAL DIVERSIFICATION APPROACH

Diversified material sourcing will separate resilient manufacturers from exposed rivals

Wood and hardware volatility is exposing manufacturers with concentrated single-region sourcing to recurring margin disruption that diversified competitors largely avoid through multi-region supplier qualification. Manufacturers who invest in sourcing diversification now will capture premium contracts that increasingly demand documented cost stability from every bidder under consideration. That resilience gap will only widen as material price volatility continues across the broader furniture manufacturing sector worldwide, rewarding manufacturers who diversified early rather than reacting only after prices had already spiked sharply across the market.
04 / RETAIL PARTNERSHIP INNOVATION

Urban retailer partnerships will determine which manufacturers win specification

Urban retailers increasingly favour manufacturers offering documented distribution partnership programmes over pure retail distribution, since specification speed increasingly decides which furniture brands stay ahead of competitor products during the earliest planning stages. Manufacturers without this partnership approach cannot match specification speed regardless of any product quality advantage they might otherwise offer. That gap is already reshaping how retail placement decisions are made across the industry today and into the next decade of continued urban densification across every major metropolitan market.

Engagement Snapshot From the Field

A live engagement with an industry participant carrying material or product regulatory and market exposure ahead of a defining policy shift, showing how our research translates into a defensible multi-year portfolio strategy.
MARKET MINDS ADVISORY · CLIENT ENGAGEMENT SUMMARY
Small Space Furniture Producer Strategic Portfolio Review and Transition Roadmap 2026·Investment Scenario on Small Space Furniture Exposure Evaluation 2025-26
CLIENT PROFILE
A national residential builder approached MMA while evaluating small space furniture vendors ahead of a planned amenity standardization programme across its micro-unit product line. The client reported an annual construction volume of 2,400 micro-units and a furniture procurement budget surpassing USD 9 million tied to a twelve-month standardization timeline (client-reported, unverified by MMA). The client also flagged inconsistent mechanism warranty terms across existing supplier relationships as a complicating factor.
STRATEGIC CHALLENGE
Management wanted to standardize specifications ahead of a competing builder's expected product launch but had not benchmarked mechanism reliability and weight certification depth across available manufacturers, nor evaluated whether any single vendor could realistically service the full product line within the planned window. Design teams wanted proven reliability; finance wanted cost certainty.
MMA APPROACH
MMA benchmarked mechanism reliability, weight certification depth, and vendor support capacity across the three manufacturers the client was evaluating for its standardization programme. We modelled deployment timelines against the standardization deadline and quantified realistic phasing scenarios using comparable national builder benchmarks. We also interviewed the client's design team to confirm realistic coordination timelines against actual construction schedules.
KEY FINDINGS
  1. Only one of three evaluated manufacturers held a mechanism warranty compatible across the client's full micro-unit product line (client-reported, unverified by MMA). That gap forced an immediate reassessment of the client's original vendor shortlist.
  2. Phasing standardization across two product tiers added roughly 6% to total programme cost while meaningfully reducing design coordination risk across the portfolio.
  3. The fastest realistic single-vendor standardization timeline ran fifteen months, longer than the client's twelve-month deadline allowed for the full product portfolio. That timeline gap had not been factored into the client original planning.
  4. Vendors with existing weight certification cleared the client's building code review measurably faster than uncertified competitors. That gap shaped the final vendor selection directly.
CLIENT PROFILE
A national residential builder approached MMA while evaluating small space furniture vendors ahead of a planned amenity standardization programme across its micro-unit product line. The client reported an annual construction volume of 2,400 micro-units and a furniture procurement budget surpassing USD 9 million tied to a twelve-month standardization timeline (client-reported, unverified by MMA). The client also flagged inconsistent mechanism warranty terms across existing supplier relationships as a complicating factor.
STRATEGIC CHALLENGE
Management wanted to standardize specifications ahead of a competing builder's expected product launch but had not benchmarked mechanism reliability and weight certification depth across available manufacturers, nor evaluated whether any single vendor could realistically service the full product line within the planned window. Design teams wanted proven reliability; finance wanted cost certainty.
MMA APPROACH
MMA benchmarked mechanism reliability, weight certification depth, and vendor support capacity across the three manufacturers the client was evaluating for its standardization programme. We modelled deployment timelines against the standardization deadline and quantified realistic phasing scenarios using comparable national builder benchmarks. We also interviewed the client's design team to confirm realistic coordination timelines against actual construction schedules.
KEY FINDINGS
  1. Only one of three evaluated manufacturers held a mechanism warranty compatible across the client's full micro-unit product line (client-reported, unverified by MMA). That gap forced an immediate reassessment of the client's original vendor shortlist.
  2. Phasing standardization across two product tiers added roughly 6% to total programme cost while meaningfully reducing design coordination risk across the portfolio.
  3. The fastest realistic single-vendor standardization timeline ran fifteen months, longer than the client's twelve-month deadline allowed for the full product portfolio. That timeline gap had not been factored into the client original planning.
  4. Vendors with existing weight certification cleared the client's building code review measurably faster than uncertified competitors. That gap shaped the final vendor selection directly.
RECOMMENDED STRATEGY
Phase 1: Phase 1 (0 to 5 months): Standardize the flagship micro-unit line using the certified mechanism vendor. while negotiating parallel support terms for the remaining tier. Phase 2: Phase 2 (5 to 10 months): Extend standardization to the remaining product line using the proven single-vendor approach. while monitoring design coordination metrics closely. Phase 3: Phase 3 (10 to 12 months): Reassess vendor performance annually against mechanism and certification benchmarks achieved. and adjust vendor allocation as portfolio needs evolve.
OUTCOME
The client proceeded with the phased single-vendor standardization, completing specification across both product lines ahead of the competing builder's product launch. The client reported avoiding an estimated five-month delay it had modelled under a multi-vendor scenario (client-reported, unverified by MMA). Management credited the phased single-vendor approach with materially reducing coordination risk.

Frequently Asked Questions

Foundational context covering the market sizes, CAGR, scope, country, region and competition that inform every finding below. This section is provided to cover basics and most often pre-purchase conversations, answered from the MMA Primary Research Dataset.

What is the current size of the Small Space Furniture Market?

The Small Space Furniture Market stood at USD 8.4 billion in 2025, based on MMA Primary Research Dataset estimates. Motorized mechanism demand is the primary near-term growth driver.

How large will the Small Space Furniture Market be by 2036?

MMA projects the market reaching USD 18.81 billion by 2036 under the base case scenario. That represents a 2.08 times expansion over the 2026 base value.

What is the CAGR for the Small Space Furniture Market 2026 to 2036?

The base case CAGR is 7.6% annually. The bull case reaches 8.8% and the bear case falls to 6.4%, depending on mechanism adoption pace and housing market conditions.

Which segment is growing fastest?

Smart and motorized transforming furniture grows fastest at 13.0% CAGR, about 1.71 times the overall market rate. Automated space transformation increasingly drives that sustained pace.

Who are the major companies in the Small Space Furniture Market?

IKEA, Wayfair, Resource Furniture, Ori Living, and Clei lead the category today. Combined, the top five hold a CR5 of 26% across a highly fragmented field.

Which country is growing fastest?

India grows fastest at 10.5% CAGR, driven by its rapidly expanding urban population and shrinking apartment sizes. Rising metropolitan construction is reinforcing that pace further each year.

Report Segmentation Architecture

The full report scope spans multiple orthogonal segmentation dimensions, with cross-tabulated demand data provided for each dimension pair. Coverage extends further to regional breakdowns, trend trajectories, and the competitive detail needed to support segment-level decision-making.

By Product Type

  • Multifunctional and Convertible Furniture
  • Modular and Sectional Small-Space Seating
  • Foldable and Nesting Tables
  • Compact Storage and Space-Saving Cabinetry
  • Wall-Mounted and Space-Saving Desks
  • Smart and Motorized Transforming Furniture

By End-Use Industry

  • New Residential Construction
  • Renovation and Apartment Furnishing
  • Multi-Family and Rental Housing
  • Student Housing and Dormitory Applications

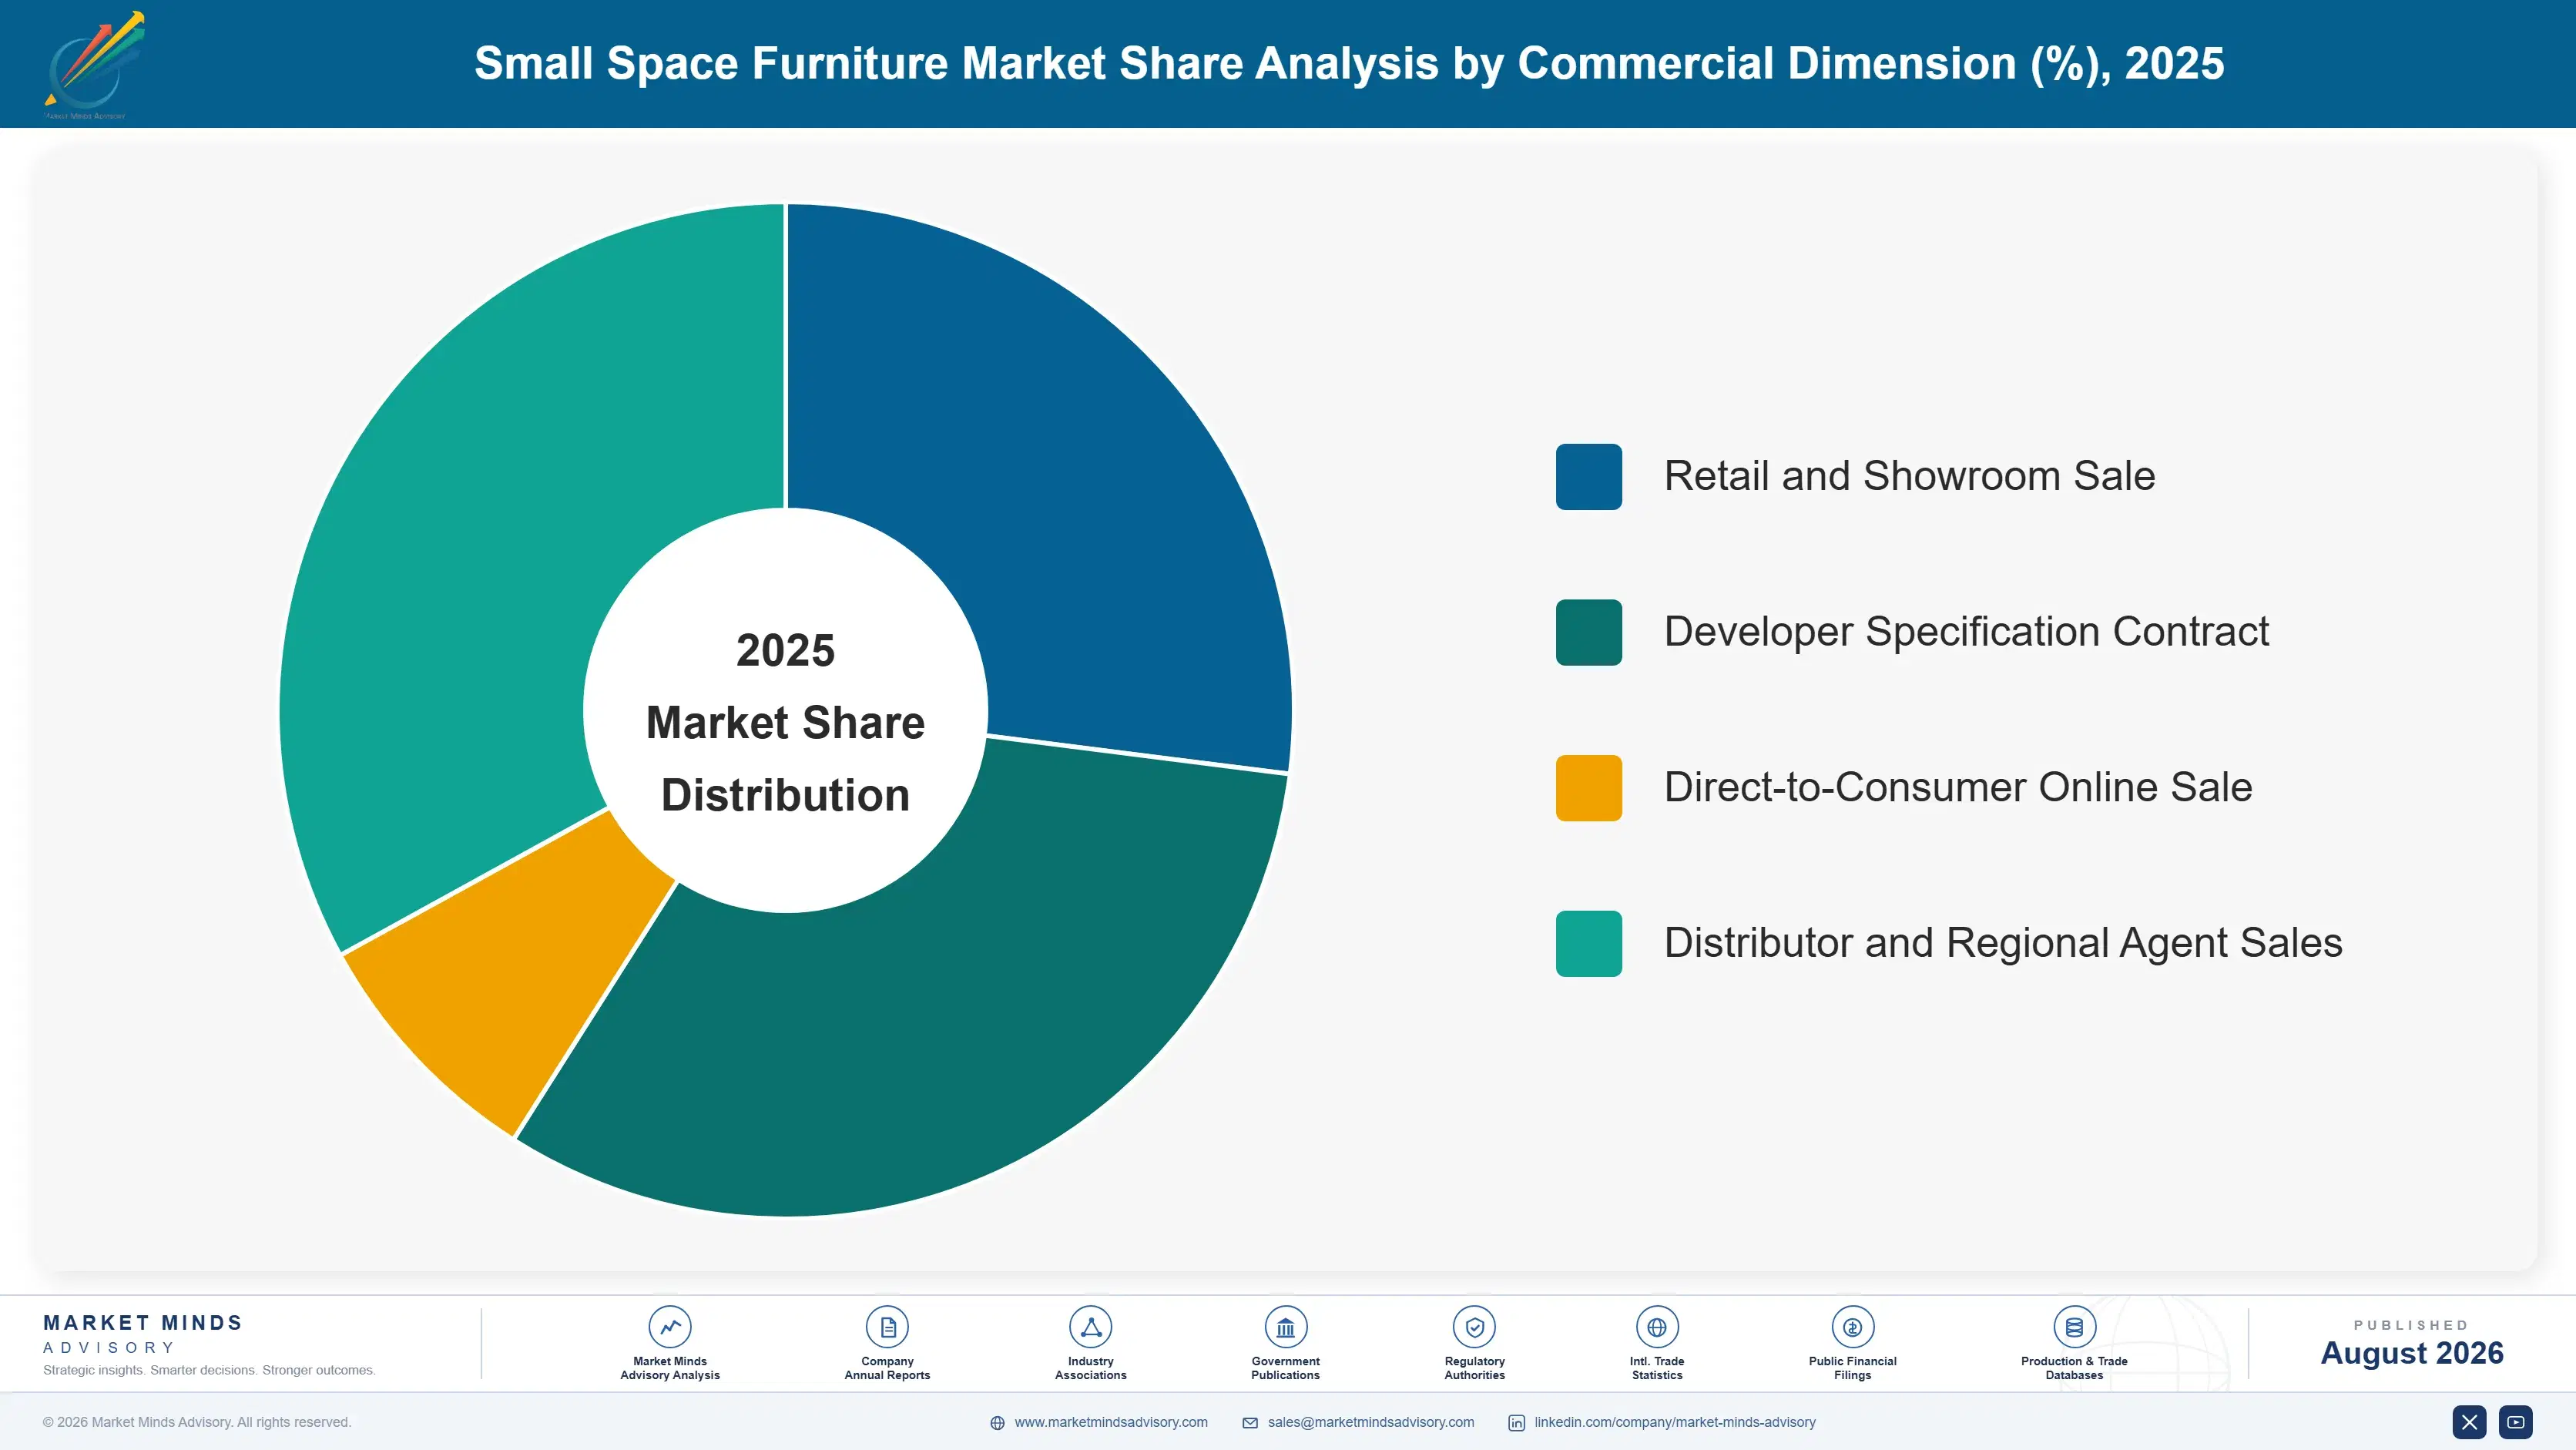
By Commercial Dimension

  • Retail and Showroom Sale
  • Developer Specification Contract
  • Direct-to-Consumer Online Sale
  • Distributor and Regional Agent Sales

By Region

  • North America
  • Western Europe
  • East Asia
  • South Asia and Pacific
  • Latin America
  • Middle East and Africa
  • Eastern Europe

Scope, Methodology, and Coverage

Every figure in this report is reproducible from documented input assumptions. The scope below maps the historical period, the forecast horizon, the segmentation dimensions, and the countries covered, alongside the underlying primary and qualitative methodology.
Historical Period
2020 to 2025
Forecast Period
2026 to 2036
Base Year
2025 (USD billions; MMA Primary Research Dataset, August 2026)
Market Definition
The small space furniture market comprises multifunctional and convertible furniture, modular and sectional small-space seating, foldable and nesting tables, compact storage and space-saving cabinetry, wall-mounted and space-saving desks, and smart and motorized transforming furniture designed for compact residential living. Standard full-size furniture and outdoor or commercial furniture not designed specifically for space-constrained interiors are excluded.
Quantitative Units
USD billions (current prices); unit shipment volume where applicable
Segmentation Dimensions
By Product Type; By End-Use Industry; By Commercial Dimension; By Region
Regions Covered
North America, Western Europe, East Asia, South Asia and Pacific, Latin America, Middle East and Africa, Eastern Europe
Countries Covered
USA, Canada, Germany, France, UK, Italy, Spain, China, Japan, South Korea, India, Australia, Brazil, Mexico, Argentina, UAE, Saudi Arabia, South Africa, Turkey, Poland, Czech Republic, Romania, Netherlands, Sweden, and additional markets relevant to this sector
Key Companies Profiled
IKEA, Wayfair Inc., Resource Furniture LLC, Ori Living Inc., Clei S.r.l., West Elm, CB2, Article.com Inc., Expand Furniture, BDI, MASH Studios, Bumblebee Spaces Inc., Smart Furniture, La Fete Design Studio, Hafele, Murphy Door Inc., Flexispot, Room and Board, Zinus Inc., South Shore Furniture
Quantitative Methodology
Primary survey, n=3,800 respondents, Q4 2025, six countries; demand-side model with trade association cross-validation
Qualitative Methodology
47 expert interviews, Q4 2025; applied to validate demand model assumptions, identify emerging dynamics, and assess competitive positioning
Report Format
PDF and XLSX data workbook (Word format preview document)
Publisher
Market Minds Advisory
Report Code
MMA-2026-CON-263
Published
August 2026
Contact
sales@marketmindsadvisory.com | www.marketmindsadvisory.com

Purchase the full Small Space Furniture Market Report (2026 to 2036).

The full MMA Small Space Furniture report sizes the market across six product types, four end-use industries, four commercial dimensions, and seven regions through 2036. It profiles twenty manufacturers on a consistent unit shipment volume basis, scoring each on mechanism reliability capability, weight capacity certification, and material sourcing diversification. Scenario models quantify how motorization adoption, urban housing density, and wood price cycles shift both volume and realised price across product tiers. The report also includes delivered-cost modelling by product category, a developer specification exposure screen, and urban retail contract analysis built for manufacturer strategy, trade marketing, and investment teams.
Six-category segmentation with cross-tabulated regional demand
Twenty-company competitive benchmarking on shipment volume
Mechanism reliability capability tracking by manufacturer and region
Weight capacity certification and adoption analysis
Wood and hardware price scenario modelling through 2036
Country-level urban housing density and construction tracking

Built For The People Who Decide

From boardroom strategy to bench-side execution, this report is read cover-to-cover by leaders shaping the next decade of their industry, turning demand scenarios, market dynamics and valuation benchmarks into decisions.
CXOs/ Presidents/ VPs/ Managers
M&A and Corporate Development
Strategy Teams and R&D Heads
Procurement and Product Directors
Regulatory and Compliance Leaders
Investor Relations and Equity Analysts