Market Minds Advisory
Small Office Home Office (SOHO) Servers Market

Small Office Home Office (SOHO) Servers Market: Small Office Home Office (SOHO) Servers Market: Entry Systems, Storage Appliances and On-Premises Retention, 2026 to 2036

Cloud subscription took the workloads that justified an entry server, and storage appliances took the rest. What remains is bought because the data is not permitted to leave the premises at all.

Lead Analyst

Published

September 2026

Make Smarter Decisions with Customized Research Insights

Request a free sample report and evaluate market opportunities, growth trends, and competitive dynamics relevant to your business needs.

2025 MARKET VALUE$8.4BMarket Size 2025
2036 FORECAST VALUE$13.8BBase Case , 2026 to 2036
CAGR 2026 TO 20364.6 %Bull 5.8% / Bear 3.4%
INCREMENTAL OPPORTUNITY$5.0BNet 10- year value creation
EXPANSION MULTIPLE1.57x2036 value over 2026 base
Strategic Levers
M&A Pipeline
Regional Outlook
Country Rankings
Competitive Intelligence
Segmental Deep-dive
Call-Us : 91 93563 13602

Executive Snapshot and Market Trajectory.

This category was hollowed out from both sides and then stabilised. Cloud subscription took the workloads that once justified buying a server, and storage appliances absorbed the file and backup duties that justified the box itself. What remains is bought for reasons price cannot address at all.
Storage appliances running containers now represent 44% of units and grow at 6.9%, half again the market rate of 4.6%, which means the fastest part of a server market is not really a server. East Asia holds 29% of system revenue on the largest small business population anywhere, connectivity that varies enormously by province, and the Taiwanese vendors who defined the appliance category outright.
Five vendors hold 58% of system revenue and two of them build appliances rather than servers, which describes the drift better than any share figure could. Around 23% of purchases now replace a subscription the buyer decided to leave, and the replacement cycle has stretched to roughly 6.8 years. Vendors defending a general purpose proposition are defending something that stopped existing a decade ago, while the best accounts buy under obligation rather than by comparison.
Market Definition
This market covers entry-level server systems for small office and home office deployment, typically supporting fewer than twenty-five users, including tower and micro-tower servers, rack-mount entry servers, NAS-based server appliances, mini and fanless server appliances, ruggedised edge enclosure servers, and blade and modular micro-chassis systems, with bundled operating system and management software counted within the system it ships with. It excludes enterprise and datacentre servers, cloud infrastructure services, standalone network switching, desktop workstations, and pure consumer storage products.
Base Year Value
$8.4B in 2025 (MMA Primary Research Dataset, September 2026)
Forecast Period
2026 to 2036, eleven discrete annual values
CAGR
4.6% base case. Bull 5.8%. Bear 3.4%.
Fastest Growth Segment
NAS-Based Server Appliances: 6.9% CAGR
Fastest Growth Country
India: 8.6% CAGR
Fastest Growth Region
South Asia and Pacific: 6.7% CAGR
Largest Region
East Asia: 29% of 2025 global value
Market Leaders
Dell Technologies, HPE, Lenovo, Synology, and QNAP lead the field. Source: MMA Primary Research Dataset, July 2026.
Primary Survey
n=3,800 procurement and R&D decision-makers, Q4 2025, six countries
Methodology
Demand-side build-up, cross-validated against public data, 47 expert interviews

Small Office Home Office (SOHO) Servers Market Forecast Scenarios

small-office-home-office-soho-servers-market-size-forecast-scenario-1790010186315
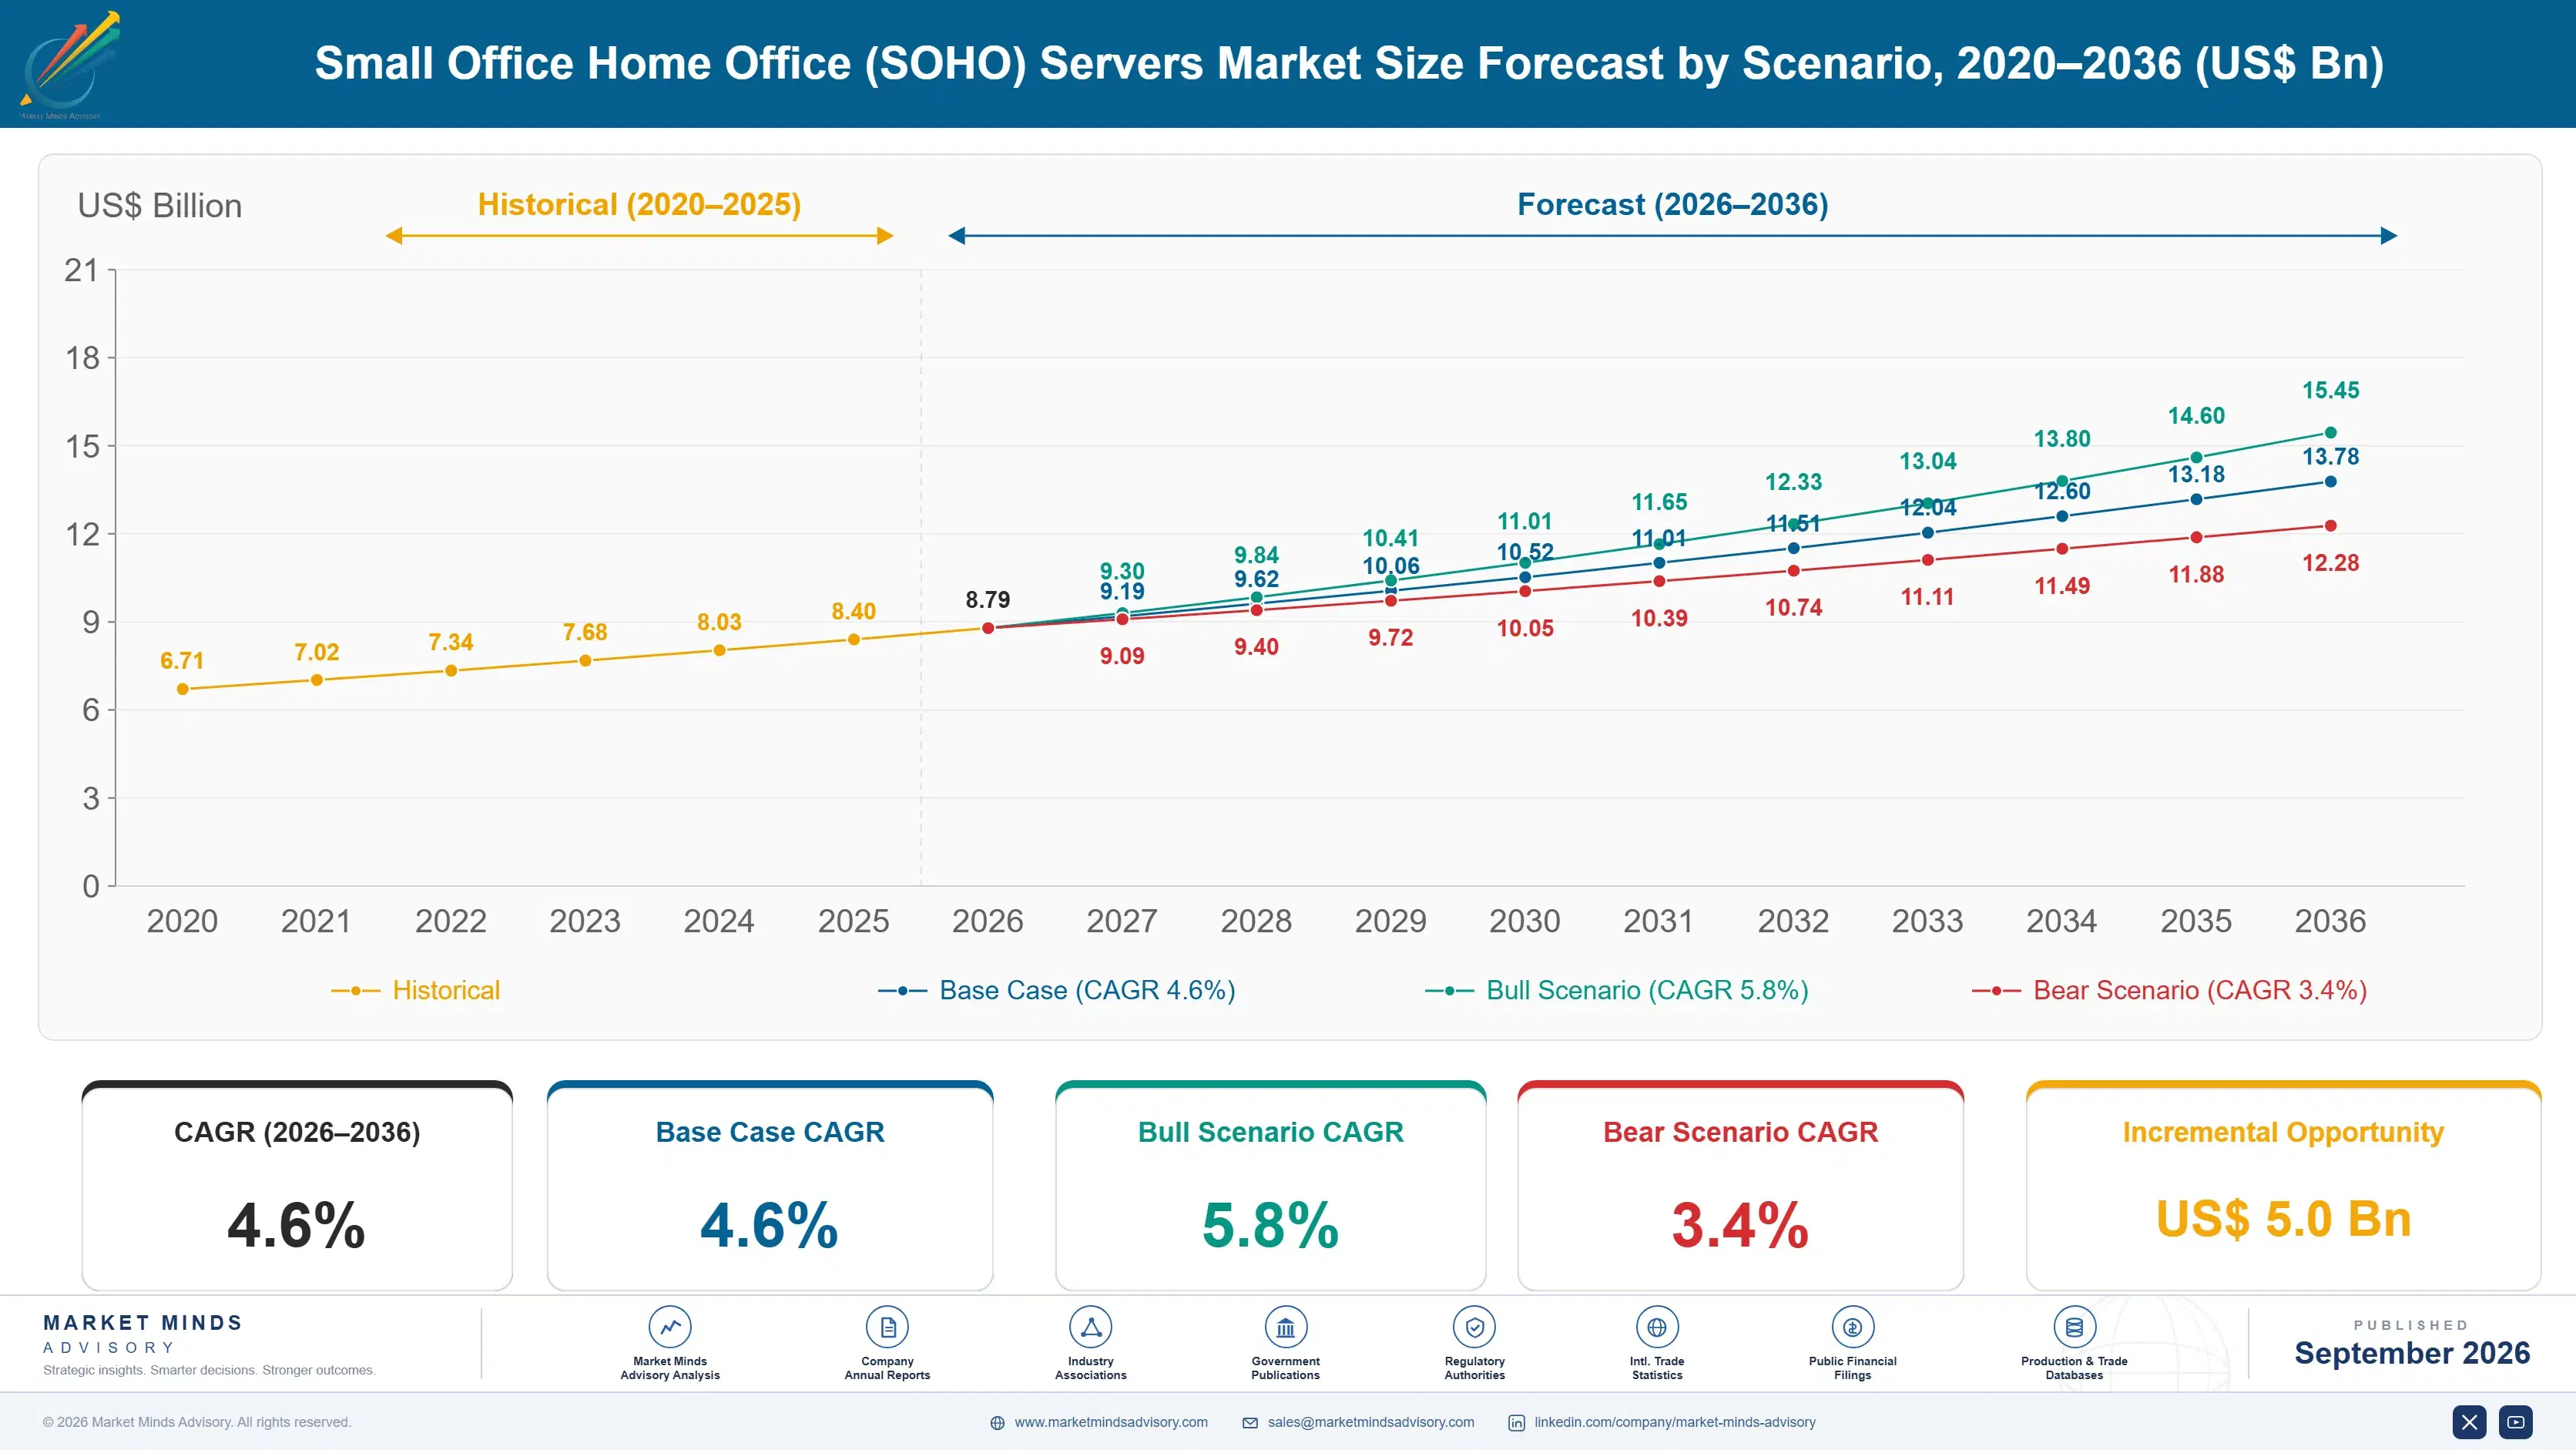
Between 2020 and 2025 the category lost its default position and found a narrower one. Remote working pushed small firms toward subscription services faster than anybody had forecast, and unit shipments fell for three consecutive years before flattening. Historical growth of 3.6% came almost entirely from rising system prices as remaining buyers specified more storage and memory, not from any recovery in the number of boxes shipped.
The base case at 4.6% rests on three mechanisms. Data residency obligations and client contract terms keep a defined population of small firms on premises regardless of what cloud costs. Subscription repatriation continues at a modest but persistent rate, already accounting for 23% of purchases. And local inference workloads give small firms a reason to buy compute they had stopped buying, which lifts specification and price rather than unit counts.
The bull case at 5.8% depends on data residency rules widening to cover professional services and healthcare records in more jurisdictions, which would enlarge the population that has no cloud option. The bear case at 3.4% is appliance substitution running further than expected, where buyers meet their requirement with a storage device costing a third as much and the server sale simply disappears.

What Survives The Subscription

Nobody buys an entry server as a default any more, and that is the single most important thing about this market. The general purpose small office server lost its argument to subscription services roughly a decade ago and is not getting it back. What survives is a narrower and more defensible population of buyers whose requirement cannot be met by anything a subscription offers.
TOP FIVE CONCENTRATION58%Share of system revenue held by the leading vendors
CLOUD REPATRIATION SHARE23%Purchases replacing a subscription the buyer chose to leave
AVERAGE SELLING PRICEUSD 1,940Delivered price averaged across all entry server categories
REPLACEMENT CYCLE LENGTH6.8 yearsTypical interval before a small office replaces its server
APPLIANCE SHARE OF UNITS44%Units shipping as storage appliances rather than conventional servers
RESELLER CHANNEL SHARE71%Systems sold through resellers rather than direct vendor channels
Three reasons account for most of it. Data that is contractually or legally not permitted to leave the premises. Line of business applications that were never rewritten and run nowhere else. And connectivity that is unreliable or expensive enough that a cloud dependency becomes an operational risk rather than a convenience. Price barely features in any of the three arguments.
The drift toward appliances is the other defining feature. Storage devices that run containers now cover a large part of what a small office actually needed, at roughly a third of the price, and they represent 44% of units shipped. Two of the five leading vendors by revenue build those rather than servers, which tells you where the category is heading without needing a forecast.
"We kept asking small firms why they still owned a server and almost nobody said cost. They said their client contract forbids the data leaving, or the practice management software runs nowhere else. Those are not objections a cloud provider can discount away, which is precisely why the category stopped shrinking."
Practice Director, Infrastructure and Small Business Technology · MMA Technology Practice · September 2026

Market Trends

Storage Appliances Absorb What Servers Once Did

A storage appliance running containers covers file serving, backup, a small database, and several application workloads for roughly a third of what an entry server costs, and it arrives configured rather than requiring somebody to build it. Those devices now represent 44% of units and grow at 6.9%. Two of the five leading vendors by revenue build appliances rather than servers. The distinction between the two categories has become mostly a matter of chassis and vendor heritage rather than anything a buyer experiences directly. Buyers stopped noticing the difference some time ago.
Market Impact: Country grows at 8.6%

Subscription Repatriation Runs At A Persistent Rate

Small firms that moved everything to subscription services have been running the arithmetic again, and a recurring bill compared against a system amortised across 6.8 years does not always favour the subscription. Around 23% of purchases now replace a service the buyer decided to leave. The moves are partial rather than wholesale: file storage, backup, and specific applications come back while email and collaboration stay. Vendors who position against cloud entirely miss what is actually happening here. The buyer keeps whichever service is genuinely cheaper to rent and brings home whatever is not. That distinction is commercially precise.
Market Impact: Prices reach USD 1,940

Market Opportunities and Growth Drivers

Data Residency Obligations Remove The Cloud Option

Professional services client agreements, healthcare record rules, and national data localisation requirements each define a population of small firms for whom off-premises storage is simply not permitted, and that population buys hardware regardless of what subscription pricing does. Indian localisation requirements have widened considerably and Indian growth of 8.6% leads every country covered. The buyer here is not comparing options on cost. They are meeting an obligation with the cheapest system that satisfies it. Vendors who can evidence how a configuration satisfies particular terms win those accounts without discounting at all.
Market Impact: Cycle stretches to 6.8 years

Local Inference Gives Small Firms Compute Reasons Again

Document processing, transcription, and retrieval over private files can now run on a modest local system, and small firms in law, accountancy, and healthcare have obvious reasons to keep that work on premises rather than sending client material to a service. It lifts specification and price rather than unit counts, which is why average selling prices reached USD 1,940 while shipments stayed flat. Appliance vendors added inference accelerators before the traditional server vendors did. Traditional server vendors followed roughly a year later, which is a pattern this category has now repeated three separate times.
Market Impact: Appliances cost 33% as much

Market Restraints and Challenges

Replacement Cycles Have Stretched Beyond Six Years

Small offices now keep a server about 6.8 years, and the root cause is that nothing forces the decision: the workload has not grown, the hardware has not failed, and support expiry alone rarely persuades an owner who is not experiencing a problem. Commercially this makes demand slow, lumpy, and hard to forecast for a channel carrying inventory. Vendors respond with subscription hardware bundles, security support terms that create a genuine deadline, and trade-in programmes that lower the replacement threshold. The channel carries the cost of that unpredictability rather than the vendor.
Market Impact: Appliances reach 44% of units

Appliance Substitution Eliminates The Server Sale Entirely

A buyer who meets their requirement with a storage appliance at a third of the price does not buy a smaller server; they buy no server, and the root cause is that appliance capability caught up with what small offices actually run. Commercially this removes revenue from traditional vendors rather than shifting it. Those vendors respond by building appliance lines of their own, by bundling management software that appliances lack, and by competing on support coverage where appliance vendors are thin. Appliances already take 44% of units shipped. Support coverage is the remaining defensible difference.
Market Impact: Drives 23% of purchases
4 additional market trends, 3 additional growth drivers, and 2 additional restraints and challenges are covered in the full report. Contact sales@marketmindsadvisory.com to access the complete intelligence.

Segment CAGR and Growth Architecture

Segmentation follows system form factor. Six categories cover the market: tower and micro-tower servers, rack-mount entry servers, NAS-based server appliances, mini and fanless server appliances, ruggedised edge enclosure servers, and blade and modular micro-chassis systems. Bundled operating system and management software is counted within the system it ships with rather than separately. Refurbished systems sit within their original form factor.
small-office-home-office-soho-servers-market-market-share-analysis-1790010186854

NAS-Based Server Appliances

Appliances grow at 6.9%, half again the market rate of 4.6%, and they now account for 44% of units shipped. A device that arrives configured and runs containers covers file serving, backup, a small database, and several applications for roughly a third of an entry server's delivered price, which is most of what a small office was ever running. Two of the five leading vendors by revenue build these rather than servers. Inference accelerators appeared in appliance lines before traditional server lines carried them, which says something uncomfortable about where product development attention has moved. Support coverage remains the one dimension where traditional vendors still hold a defensible advantage over them.
CAGR 6.9%

Mini And Fanless Server Appliances

Mini and fanless systems grow at 6.1% by serving deployments where a conventional server cannot physically go: retail back offices, clinics, workshops, and branch premises with no server room, no cooling, and no tolerance for noise. Ruggedisation is a secondary benefit rather than the purchase reason for most buyers. Growth is supported by local inference workloads that these systems now handle adequately, and by multi-site small businesses standardising on one small box per location. The channel sells them as an appliance rather than as infrastructure, which suits how buyers think about the purchase. Delivered price sits well below conventional tower systems, which is what actually opens these deployments up. Multi-site groups standardise readily.
CAGR 6.1%
Full segment breakdown across 6 segments available in the complete report.

Regional Architecture and Country Demand Map

Regional shares track where small businesses retain on-premises systems rather than where hardware is assembled, and they follow data residency rules and connectivity reliability more closely than economic size. All seven regions sit inside the standard bands on this measure. Unit counts and revenue diverge sharply across the seven.

East Asia

China holds the largest population of small businesses anywhere and connectivity quality varies enormously between coastal cities and inland provinces, which makes a cloud dependency an operational risk for a great many of them. Data localisation rules add a second reason that has nothing to do with cost. Taiwanese vendors defined the storage appliance category and sell it aggressively across the region. Japanese and Korean demand skews toward conventional systems bought through established channel relationships. Growth of 5.6% runs above the world rate, and share of 29% is the highest of the seven regions. Chinese domestic vendors have taken most of the conventional server volume, leaving imported systems concentrated at the higher specifications.
Share: 29% | CAGR: 5.6% (2026 to 2036)

North America

Professional services firms bound by client agreements that forbid data leaving controlled premises account for a substantial share of what still gets bought here, alongside medical and dental practices running management software that was never rewritten for anything else. Subscription repatriation is more visible in this region than anywhere, since these buyers moved earliest and have now had several years of recurring bills to compare against. Growth of 3.9% is modest. Share of 25% reflects high system prices rather than unit volumes, which have been flat for years. Appliance substitution has run slower here than in price sensitive regions, since support terms and documented response commitments matter more to the buyers who remain in this market at all.
Share: 25% | CAGR: 3.9% (2026 to 2036)
Regional intelligence for 5 additional markets available in the complete report: Western Europe, South Asia and Pacific, Latin America, Middle East and Africa, Eastern Europe. Contact sales@marketmindsadvisory.com.
small-office-home-office-soho-servers-market-country-cagr-analysis-1790010187383

Where Vendors Still Earn Here

Four commercial moves separate vendors earning properly from those defending a general purpose proposition that lost its argument a decade ago. Each accepts that the remaining buyer has a specific reason to own hardware, and that reason is almost never the price of the alternative. Cost comparisons against subscription pricing persuade almost nobody who is still buying.

Sell Against Obligation Rather Than Against Cloud

Buyers who cannot place data off premises are not comparing options; they are meeting a requirement, and price sensitivity in those accounts is far lower than the category average suggests. Vendors who qualify on obligation first, and can evidence how a system satisfies specific residency or client contract terms, close at roughly 2.6 times the rate of those leading with cost comparisons. The work is understanding professional body guidance and localisation rules by market, which is commercial rather than technical. It has to be redone for every market served, which is why few vendors bother.
Market Impact: Closes 2.6 times more accounts qualified on obligation

Build An Appliance Line Before Losing The Account

Appliances already take 44% of units, and a buyer who meets their requirement with one does not buy a smaller server. Traditional vendors who added appliance lines retained roughly 71% of accounts that downsized, against far fewer for those who offered only conventional systems. It cannibalises server revenue deliberately, at lower absolute value per unit but with the management software and support attachment intact, which is the part that recurs and the part worth defending. The account survives the downsizing, and that decides who gets asked next time. Nothing else survives it.
Market Impact: Retains 71% of accounts that choose to downsize

Create A Replacement Deadline That Actually Lands

Small offices keep systems 6.8 years because nothing forces a decision, and support expiry alone rarely persuades an owner with no problem to solve. Security update terms with a stated end date, communicated to the reseller rather than the end customer, shorten the observed cycle by 11 to 16 months among accounts where the channel actively works it. The deadline has to be real and consistently honoured, because a deferred cut-off teaches the whole channel to ignore the next one. Vendors who extend cut-off dates twice find the third announcement carries no weight.
Market Impact: Shortens observed replacement cycles 11 to 16 months

Ship Inference Capability Into Entry Systems Early

Local document processing, transcription, and retrieval give small professional firms a reason to buy compute they had stopped buying, and the privacy argument for keeping that work on premises writes itself in law, accountancy, and healthcare. Systems specified with inference accelerators carry delivered prices 38 to 52% above equivalent conventional configurations. Appliance vendors moved first here and traditional server vendors followed, which is an uncomfortable pattern that has now repeated three times in this category. Traditional vendors followed roughly a year behind on each occasion, and lost share each time.
Market Impact: Lifts delivered system prices 38 to 52% higher

Who Controls the Margin Pool

Concentration is high and the composition is unusual. Five vendors hold 58% of system revenue, measured consistently on that basis across all participants, and two of them build storage appliances rather than servers. That mix is the clearest statement anybody could make about where the category has drifted, and it happened without a single acquisition between the two groups.
Competition currently turns on three things: channel coverage and reseller economics, since 71% of systems reach buyers that way; management software and support terms, which appliances have historically been thin on; and delivered price at the appliance end, where Taiwanese vendors set expectations that traditional vendors struggle to meet profitably. Support response commitments decide the least price sensitive accounts, where traditional vendors retain a genuine advantage.

Pressure comes from two directions. Appliance vendors keep adding capability that removes reasons to buy a conventional server. Meanwhile subscription providers continue absorbing general purpose workloads at the other end. Rankings will shift toward vendors covering both form factors under one management and support arrangement, because that is what holds an account through a downsizing decision. Vendors holding only conventional systems face the weakest position here.
small-office-home-office-soho-servers-market-company-positioning-matrix-1790010187911

Competitive Moat and Risk Dimensions

DELL TECHNOLOGIES

Moat: Channel Depth And Support

Reseller coverage built over decades reaches small business buyers who never contact a vendor directly, and 71% of systems in this category are sold that way. Support terms and next-business-day coverage in markets where appliance vendors are thin give resellers something to sell beyond specification, which sustains margin they can actually earn.
DELL TECHNOLOGIES

Risk: Cost Base Against Appliances

Competing at appliance prices means accepting a delivered cost structure built for enterprise volumes and enterprise margins, which does not translate downward comfortably. Every account that meets its requirement with a device costing a third as much is revenue that does not return at the next refresh, and the substitution is accelerating.
SYNOLOGY

Moat: Software On Commodity Hardware

An operating environment that makes a storage device behave like a managed server, refined over many product generations, is what buyers are actually paying for rather than the enclosure around it. Competitors matching the hardware specification at lower prices have repeatedly failed to match that software, and small office buyers notice the difference immediately.
SYNOLOGY

Risk: Thin Enterprise Support Coverage

Support and field coverage remain lighter than traditional vendors offer, which excludes the company from buyers whose client contracts or professional obligations require a documented response commitment. Those are precisely the accounts with the least price sensitivity in the entire category, and building comparable coverage is expensive and slow.

Players Tracked

Prominent Players

Dell Technologies
HPE
Lenovo
Synology
QNAP

Other Key Players

Supermicro
ASUSTOR
TerraMaster
Western Digital
Buffalo
Netgear
Fujitsu
Inspur
TYAN
ASRock Rack
Shuttle
Zyxel
Seagate
Acer
iXsystems

Recent Developments

JANUARY 2026

Synology Adds Local Inference Accelerator To Small Business Appliances

Synology released appliance configurations carrying an inference accelerator for document processing and retrieval over private files, positioned at professional services firms that will not send client material to an external service under any circumstances. Configurations were priced well above equivalent conventional appliance models. Early demand concentrated in accountancy practices.
Signal: Appliance vendors reached this workload before traditional server vendors did, repeating a pattern seen twice before.
AUGUST 2025

QNAP Expands Taiwanese Assembly Capacity For Appliance Lines

QNAP completed an organic capacity expansion at its Taiwanese assembly operations, funded internally with no partner or external investment involved, after appliance lead times extended across several product lines during the preceding eighteen months. The company said appliance demand had outrun assembly throughput rather than component supply.
Signal: Capacity rather than demand had constrained appliance shipments, which suggests substitution ran faster than reported volumes showed.
MAY 2025

Dell Restructures Small Business Channel Toward Bundled Terms

Dell restructured its small business reseller programme around bundled hardware, management software, and support terms rather than system margin alone, a channel programme change involving no acquisition, joint venture, or equity investment of any kind. Reseller compensation now weights software and support attachment above system margin across the programme.
Signal: Traditional vendors are defending accounts through attachment because system margin alone no longer holds resellers. Margin moved to attachment.

What Builds An Entry System

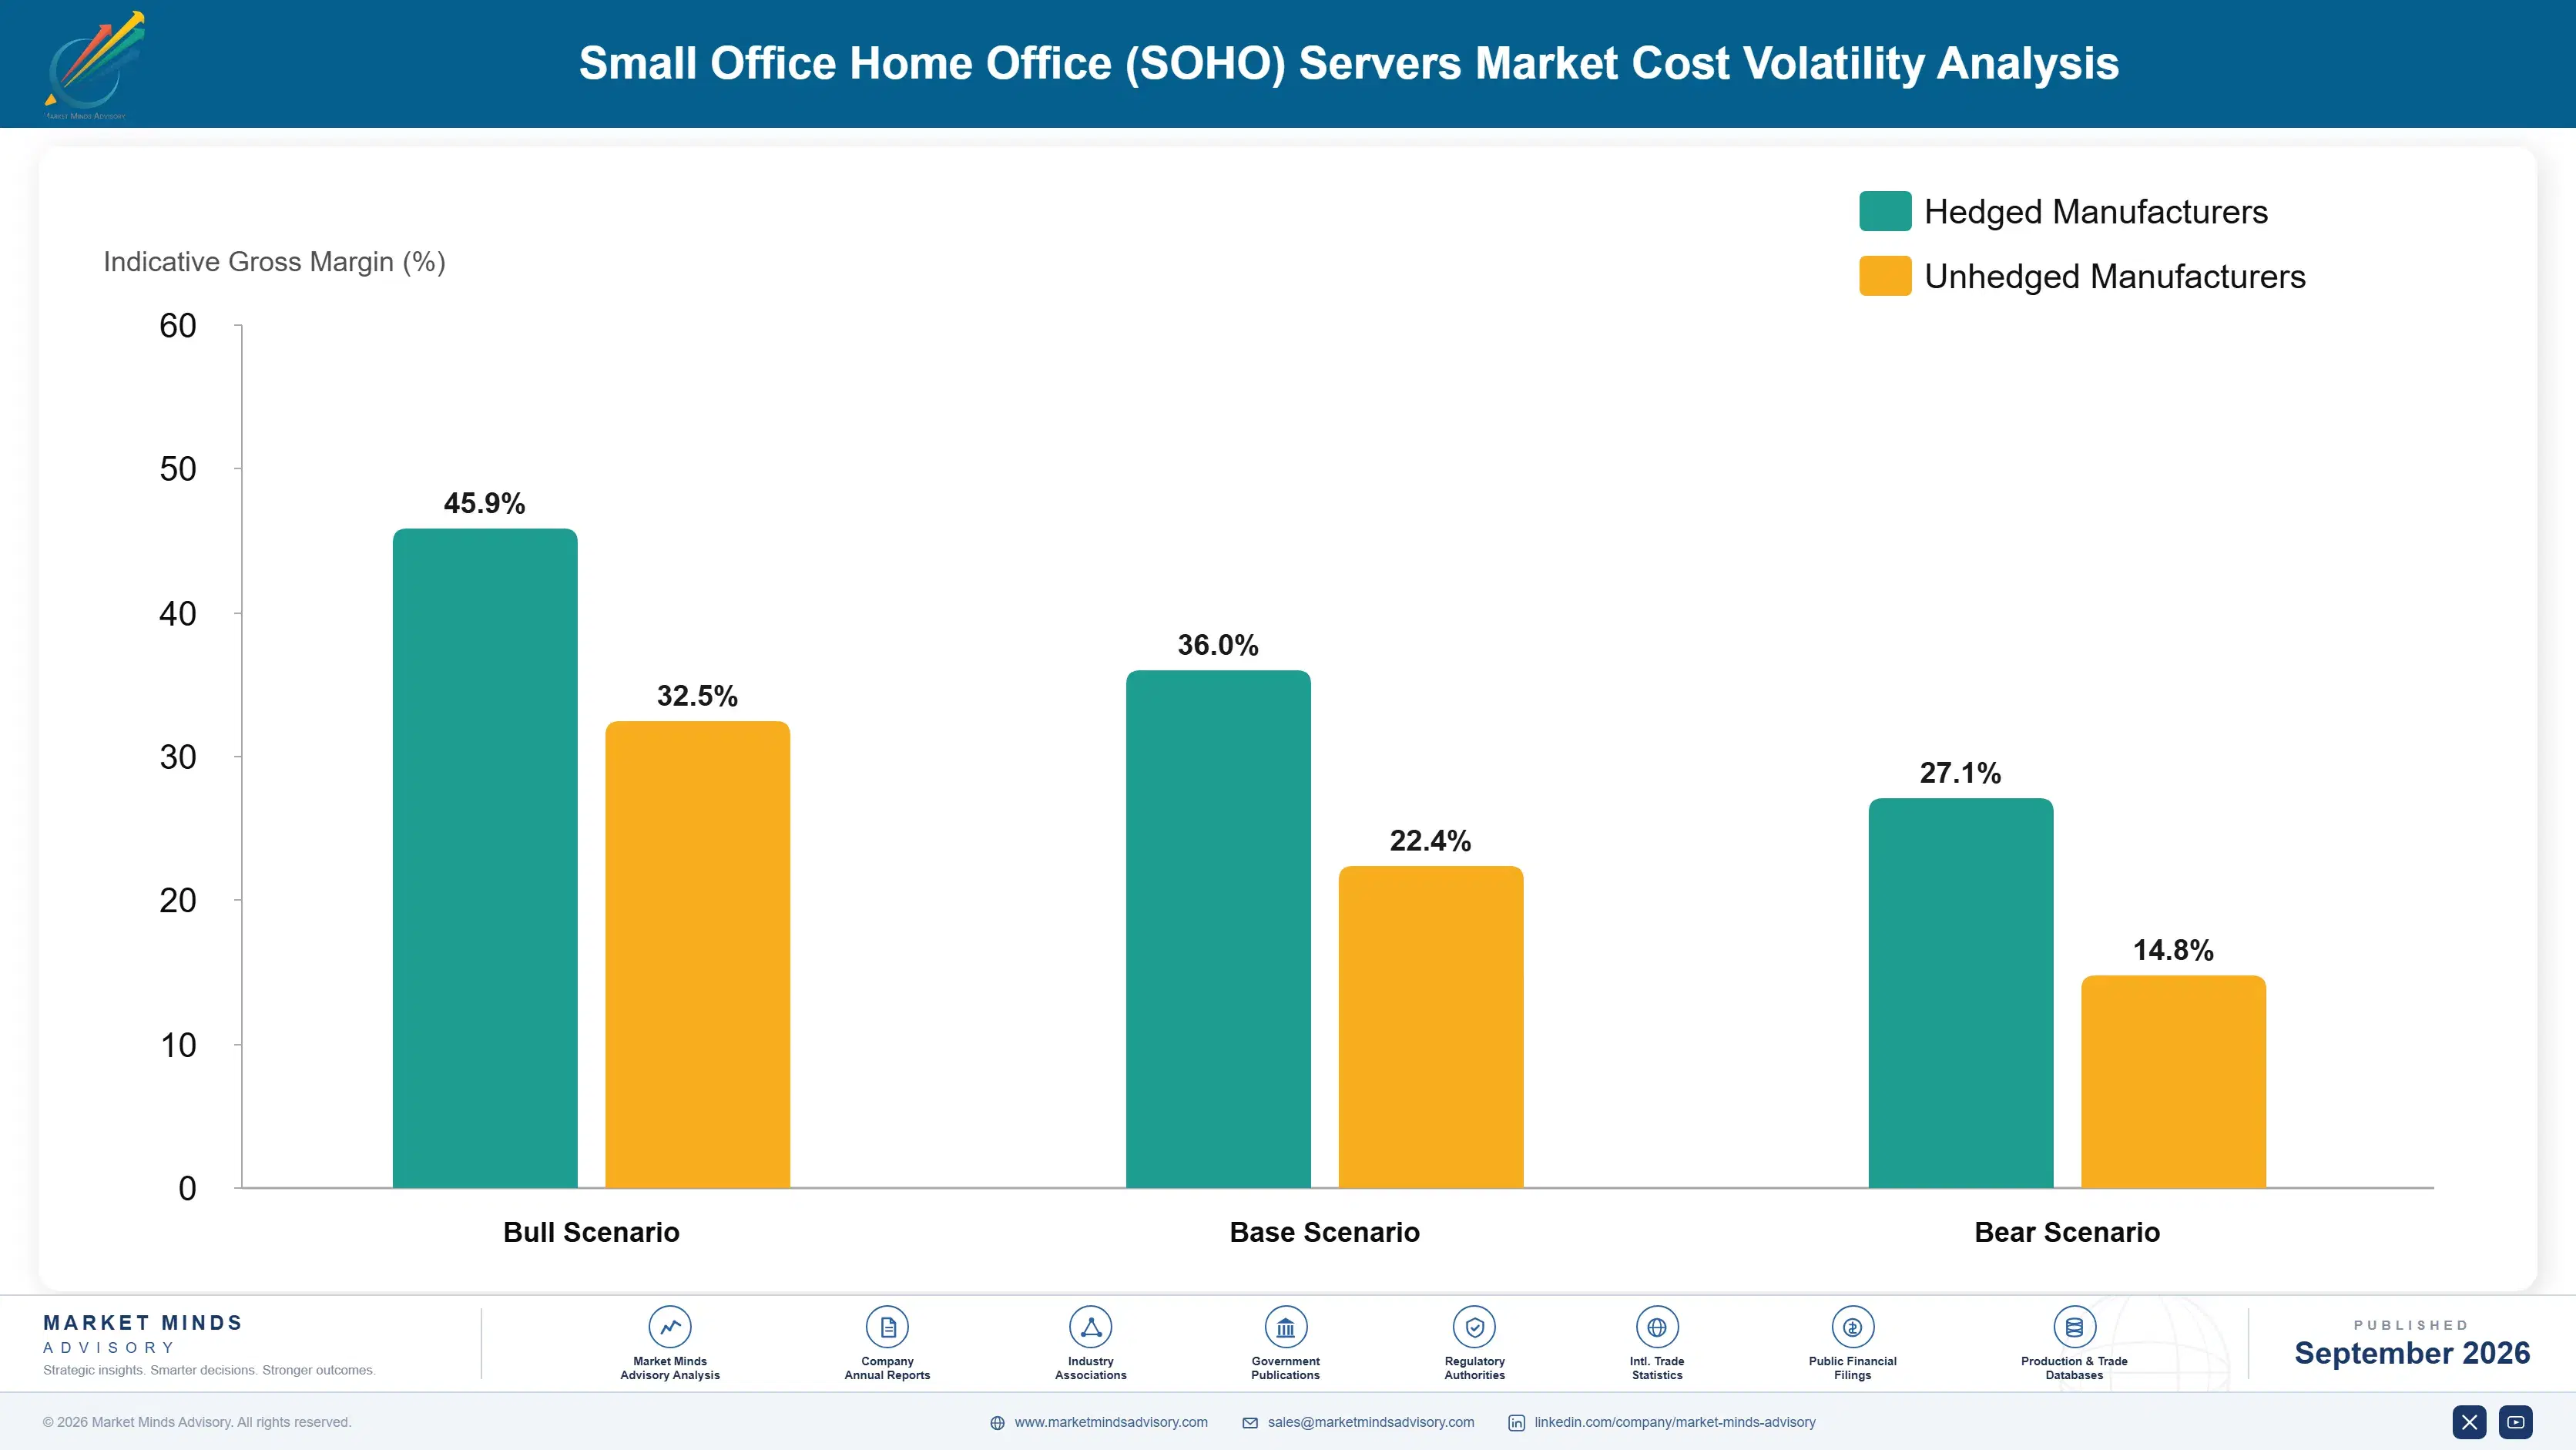
Three input groups dominate system cost. Processors and memory run 34% to 42% of cost of goods sold from a small number of Taiwanese, Korean, and American suppliers. Storage media takes 22% to 30%, with the wide range reflecting how differently appliance and conventional server configurations are specified. Chassis, power supply, and board assembly add 16% to 22%, most of it manufactured in China and Taiwan.
Memory and storage pricing moved sharply through 2024 and 2025 as datacentre demand absorbed supply, and several vendors described the margin effect directly in their annual reports for those years. SEMI equipment data showed the capacity response arriving too late to relieve the period. Entry systems felt it more than enterprise lines, because memory and storage represent a larger proportion of a low-priced system's total cost.

The competitive disadvantage mechanism runs through purchasing scale rather than design capability. A vendor buying memory and storage at small business volumes pays materially more per unit than one whose enterprise business absorbs the same components at scale, and that gap decides delivered price in a category where buyers compare on it. Exposure varies by vendor type, and appliance specialists without an enterprise line are weakest.
small-office-home-office-soho-servers-market-cost-volatility-analysis-1790010188108

Share Component Purchasing With Enterprise Product Lines

Memory and storage represent a larger share of a low-priced system's cost than an enterprise one, so purchasing scale decides delivered price more than design does. Vendors whose entry systems draw on enterprise component volumes hold an advantage that appliance specialists cannot match at all, and it widens whenever datacentre demand tightens supply. Appliance specialists feel it worst.

Standardise Board And Chassis Across Product Families

Distinct board designs and enclosures across form factors multiply tooling, qualification, and inventory obligations across a category where individual product volumes are modest at best. A shared board and chassis platform spanning tower, mini, and appliance lines concentrates purchasing, shortens qualification, and reduces the inventory that long component lead times otherwise force a vendor to carry.

Move Value Toward Management Software And Support

Software and support terms carry no component cost, no lead time, and no exposure to memory pricing cycles of any kind. Vendors shifting value there protect margin when component costs rise and gain the attachment that holds an account through a downsizing decision, which is worth considerably more than the hardware margin being defended.

Portfolio Architecture for Margin Defence

Margin follows attachment rather than hardware. Conventional entry servers sold on specification are close to commodity, with delivered price decided by component purchasing scale that small vendors cannot match. Appliances earn better than their prices suggest, because software rather than the enclosure is what buyers are paying for. Management software, support contracts, and residency-qualified configurations earn most of all. That hierarchy has been stable for years and shows no sign of inverting.
The tension between volume and premium runs through why the buyer owns hardware. Price-driven small firms buy the cheapest device meeting their requirement, generate meaningful unit volume, and leave almost nothing behind. Firms bound by client contracts or residency obligations pay properly, because the alternative is not a cheaper system but a compliance failure they cannot accept.

High-value pools concentrate where somebody outside the business dictates the arrangement: professional services under client agreements, healthcare practices under record rules, and firms in jurisdictions with data localisation requirements. Those buyers show the least price sensitivity in the category by a wide margin. Where the choice is genuinely free, the cheapest adequate appliance wins and everybody prices accordingly. Nobody pays a premium for a free choice.

Volume / Commodity-Adjacent

Conventional entry servers and basic appliances sold on specification and delivered price, where component purchasing scale decides the outcome. The ten-point range reflects the gap between vendors sharing enterprise component volumes and appliance specialists buying at their own smaller scale.
Gross Margin: 17% to 27%

Premium / Certified

Systems configured against documented residency, client contract, or professional body requirements, sold with support terms that satisfy a stated obligation. Price sensitivity is low because the alternative is non-compliance. The ten-point range separates documented qualification from general business positioning.
Gross Margin: 34% to 44%

Sustainability / Regulatory / Next-Generation

Management software, support contracts, and inference-capable configurations for private document workloads. No component cost, no lead time, and revenue that can recur rather than arriving once every seven years. The sixteen-point range reflects how differently perpetual and subscription licensing recognise value.
Gross Margin: 52% to 68%
small-office-home-office-soho-servers-market-portfolio-architecture-1790010188613

High-value Sub-segments and Strategic Watch-out

Management Software And Support

Highest value in the category and the only element capable of recurring rather than arriving once every 6.8 years alongside the hardware. It holds accounts through downsizing decisions. The sixteen-point range reflects the gap between perpetual licensing and subscription terms across vendor approaches. Vendors neglecting it lose the refresh.
Gross Margin: 54% to 70%

Residency-Qualified Configurations

High value with moderate growth, sold to buyers meeting an obligation rather than comparing options, which is why price sensitivity is the lowest anywhere in this market. The ten-point range separates vendors with documented qualification evidence from those asserting general suitability. Qualification work is repeated for each market served.
Gross Margin: 38% to 48%

Storage Appliance Systems

Volume core and the fastest growing segment at 6.9%, now 44% of units, where software rather than the enclosure is what buyers actually pay for. The ten-point range reflects purchasing scale differences between appliance specialists and vendors with enterprise component volumes. Support coverage remains the one genuine gap.
Gross Margin: 26% to 36%

Conventional Tower Server Supply

The strategic watch-out. Appliances remove the reason to buy one, subscription services took the general purpose workloads, and delivered price is decided by component purchasing scale rather than product merit. The ten-point range reflects purchasing position and nothing commercially defensible. Very little here is commercially defensible now.
Gross Margin: 15% to 25%

How Revenue Repeats Here

System revenue arrives once and then waits about 6.8 years, because nothing forces a replacement decision in a small office where the workload has not grown and the hardware has not failed. Management software licences, support contracts, and storage expansion are what recur, and they are the only reason a vendor hears from an account between purchases. Vendors treating those as an afterthought have no relationship to defend when the refresh finally arrives.
Attachment depth varies enormously by why the buyer owns hardware. A professional services firm whose configuration is documented against client contract terms will not change vendors without redoing that qualification work, and it rarely bothers. A firm that bought the cheapest adequate device has no attachment whatsoever and buys on price again.

The buyer has shifted from an internal technical person toward the reseller and the practice owner. Small firms once employed somebody who specified hardware. Most no longer do, and 71% of systems now reach buyers through resellers who make the actual recommendation. Vendors selling specifications to end customers are addressing a participant who has largely stopped existing in this segment.
small-office-home-office-soho-servers-market-end-use-penetration-index-1790010189102

Where This Market Rewards

These are among the four positions where our research anticipates prominent divergence between winners and laggards over the coming forecast period. Each is grounded in the demand model, the regulatory perimeter, and the announced capacity pipeline.
01 / OBLIGATION LED QUALIFICATION

The best accounts are not comparing anything

Firms bound by client agreements, healthcare record rules, or national localisation requirements cannot place data off premises and therefore buy hardware regardless of what subscription pricing does at any point. Vendors qualifying on obligation first, with evidence of how a configuration satisfies specific terms, close at roughly 2.6 times the rate of those leading on cost. The work is regulatory and commercial rather than technical, and it has to be repeated per market, because guidance and localisation rules differ everywhere they apply.
02 / DELIBERATE APPLIANCE CANNIBALISATION

Downsizing accounts leave entirely without an alternative

Appliances take 44% of units and a buyer meeting their requirement with one does not purchase a smaller server instead. Vendors offering an appliance line retained roughly 71% of accounts that downsized, while those holding only conventional systems lost them outright at the refresh. The absolute value per unit falls, but management software and support attachment survive, and that attachment is what determines who gets asked next time, and that question is worth more than the hardware margin conceded in the end.
03 / REPLACEMENT DEADLINE DISCIPLINE

Nothing forces a decision at seven years

Small offices keep systems roughly 6.8 years because the workload has not grown, nothing has failed, and support expiry alone does not persuade an owner with no problem to solve. Security update terms with a stated and honoured end date, worked through the reseller rather than the end customer, shorten the observed cycle by 11 to 16 months. A deferred cut-off teaches the entire channel to disregard the next one permanently, which is why discipline matters more than the announcement itself does.
04 / CHANNEL ECONOMICS OWNERSHIP

Resellers make the recommendation, not the vendor

Around 71% of systems reach small business buyers through resellers, and most of those buyers no longer employ anybody who specifies hardware independently of that advice. Vendors selling specifications directly to end customers are addressing a participant who has largely disappeared from this segment over the past decade. Reseller margin has to come from support and software attachment, because system margin alone no longer sustains the relationship, and vendors who ignore that find their resellers recommending somebody else to their small business clients.

Engagement Snapshot From the Field

A live engagement with an industry participant carrying material or product regulatory and market exposure ahead of a defining policy shift, showing how our research translates into a defensible multi-year portfolio strategy.
MARKET MINDS ADVISORY · CLIENT ENGAGEMENT SUMMARY
Small Office Home Office (SOHO) Servers Producer Strategic Portfolio Review and Transition Roadmap 2026·Investment Scenario on Small Office Home Office (SOHO) Servers Exposure Evaluation 2025-26
CLIENT PROFILE
An accountancy and advisory group operating nineteen offices across three countries, employing roughly 640 staff and holding client financial records under engagement terms that restrict where data may be stored. The group had migrated most workloads to subscription services during 2021 and was spending approximately USD 1.4 million annually on them (client-reported, unverified by MMA).
STRATEGIC CHALLENGE
Two large clients had introduced engagement terms requiring their records to remain within specified national borders on systems the group controlled directly. Meanwhile the subscription bill had grown 61% in four years without any corresponding increase in headcount or activity, and nobody internally could explain the divergence when the board asked about it.
MMA APPROACH
MMA separated workloads by whether client terms permitted off-premises storage, priced on-premises alternatives against subscription cost across a seven year horizon, and assessed what management and support capability the group would need to run local systems without rebuilding an internal technical function it had already disbanded. Reseller support capability was assessed at every office.
KEY FINDINGS
  1. Only 22% of stored data was actually restricted by client engagement terms, but it was distributed across every workload rather than isolated, which had made the restriction look total.
  2. Subscription cost per user had risen 61% in four years while usage stayed flat, driven by tier changes and feature bundling the group had accepted without any review.
  3. On-premises systems for the restricted data alone paid back against subscription cost in 3.4 years, and appliances covered the requirement at roughly a third of conventional server cost.
  4. No office retained anybody able to administer a server, so any local system had to be managed by the existing reseller under a support arrangement rather than internally.
CLIENT PROFILE
An accountancy and advisory group operating nineteen offices across three countries, employing roughly 640 staff and holding client financial records under engagement terms that restrict where data may be stored. The group had migrated most workloads to subscription services during 2021 and was spending approximately USD 1.4 million annually on them (client-reported, unverified by MMA).
STRATEGIC CHALLENGE
Two large clients had introduced engagement terms requiring their records to remain within specified national borders on systems the group controlled directly. Meanwhile the subscription bill had grown 61% in four years without any corresponding increase in headcount or activity, and nobody internally could explain the divergence when the board asked about it.
MMA APPROACH
MMA separated workloads by whether client terms permitted off-premises storage, priced on-premises alternatives against subscription cost across a seven year horizon, and assessed what management and support capability the group would need to run local systems without rebuilding an internal technical function it had already disbanded. Reseller support capability was assessed at every office.
KEY FINDINGS
  1. Only 22% of stored data was actually restricted by client engagement terms, but it was distributed across every workload rather than isolated, which had made the restriction look total.
  2. Subscription cost per user had risen 61% in four years while usage stayed flat, driven by tier changes and feature bundling the group had accepted without any review.
  3. On-premises systems for the restricted data alone paid back against subscription cost in 3.4 years, and appliances covered the requirement at roughly a third of conventional server cost.
  4. No office retained anybody able to administer a server, so any local system had to be managed by the existing reseller under a support arrangement rather than internally.
RECOMMENDED STRATEGY
Phase 1: Phase one: isolate the client-restricted data and move it to appliances in four regional offices, sized for that workload alone rather than for everything. Phase 2: Phase two: renegotiate remaining subscription tiers against documented usage rather than accepting the bundled terms the group had been renewing unexamined. Phase 3: Phase three: place management and support of the local systems with the existing reseller under stated response terms that satisfy client engagement obligations.
OUTCOME
Both client engagement requirements were met without losing either account (client-reported, unverified by MMA). Total infrastructure spend fell 18% against the prior year despite adding hardware. The appliances cost USD 96,000 against a conventional server estimate of roughly USD 290,000 for equivalent coverage. Payback against subscription cost is projected at 3.1 years.

Frequently Asked Questions

Foundational context covering the market sizes, CAGR, scope, country, region and competition that inform every finding below. This section is provided to cover basics and most often pre-purchase conversations, answered from the MMA Primary Research Dataset.

What is the current size of the Small Office Home Office (SOHO) Servers Market?

The market was worth USD 8.4 billion in 2025 and reaches USD 8.8 billion in 2026. Value covers entry server systems and the software bundled with them.

How large will the Small Office Home Office (SOHO) Servers Market be by 2036?

MMA forecasts USD 13.8 billion by 2036, an increase of USD 5.0 billion across the forecast period. That represents 1.57 times the 2026 base of USD 8.8 billion.

What is the CAGR for the Small Office Home Office (SOHO) Servers Market 2026 to 2036?

The base case compound annual growth rate is 4.6%, with a bull case at 5.8% and a bear case at 3.4%. Historical growth from 2020 to 2025 ran at 3.6%.

Which segment is growing fastest?

NAS-based server appliances grow at 6.9%, half again the market rate of 4.6%, and already account for 44% of units shipped. Software rather than the enclosure is what buyers pay for.

Who are the major companies in the Small Office Home Office (SOHO) Servers Market?

Dell Technologies, HPE, Lenovo, Synology, and QNAP lead, together holding 58% of system revenue. Two of the five build storage appliances rather than conventional servers.

Which country is growing fastest?

India grows at 8.6%, driven by data localisation requirements that widened considerably alongside connectivity outside major cities that makes any cloud dependency a genuine operational risk.

Report Segmentation Architecture

The full report scope spans multiple orthogonal segmentation dimensions, with cross-tabulated demand data provided for each dimension pair. Coverage extends further to regional breakdowns, trend trajectories, and the competitive detail needed to support segment-level decision-making.

By System Form Factor

  • Tower and Micro-Tower Servers
  • Rack-Mount Entry Servers
  • NAS-Based Server Appliances
  • Mini and Fanless Server Appliances
  • Ruggedised Edge Enclosure Servers
  • Blade and Modular Micro-Chassis Systems

By End-Use Industry

  • Professional and Financial Services
  • Healthcare and Dental Practices
  • Retail and Hospitality
  • Creative, Media and Design
  • Light Manufacturing and Workshops
  • Education and Non-Profit Organisations

By Commercial Dimension

  • Reseller and Systems Integrator Channel
  • Direct Vendor Purchase
  • Managed Service Provider Supply
  • Online Retail and Distribution
  • Hardware Subscription Bundle
  • Refurbished and Trade-In Programme

By Region

  • East Asia
  • North America
  • Western Europe
  • South Asia and Pacific
  • Latin America
  • Middle East and Africa
  • Eastern Europe

Scope, Methodology, and Coverage

Every figure in this report is reproducible from documented input assumptions. The scope below maps the historical period, the forecast horizon, the segmentation dimensions, and the countries covered, alongside the underlying primary and qualitative methodology.
Historical Period
2020 to 2025
Forecast Period
2026 to 2036
Base Year
2025 (USD billions; MMA Primary Research Dataset, September 2026)
Market Definition
This market covers entry-level server systems for small office and home office deployment, typically supporting fewer than twenty-five users, including tower and micro-tower servers, rack-mount entry servers, NAS-based server appliances, mini and fanless server appliances, ruggedised edge enclosure servers, and blade and modular micro-chassis systems, with bundled operating system and management software counted within the system it ships with. It excludes enterprise and datacentre servers, cloud infrastructure services, network switching, desktop workstations, and consumer storage products.
Quantitative Units
USD billions, system and bundled software revenue
Segmentation Dimensions
System form factor, end-use industry, commercial dimension, region
Regions Covered
East Asia, North America, Western Europe, South Asia and Pacific, Latin America, Middle East and Africa, Eastern Europe
Countries Covered
China, Japan, South Korea, Taiwan, United States, Canada, Mexico, Germany, United Kingdom, France, Italy, Spain, Netherlands, Switzerland, Sweden, India, Indonesia, Vietnam, Thailand, Australia, Brazil, Argentina, Colombia, Chile, Saudi Arabia, United Arab Emirates, Nigeria, South Africa, Poland, Czechia
Key Companies Profiled
Dell Technologies, HPE, Lenovo, Synology, QNAP, Supermicro, ASUSTOR, TerraMaster, Western Digital, Buffalo, Netgear, Fujitsu, Inspur, TYAN, ASRock Rack, Shuttle, Zyxel, Seagate, Acer, iXsystems
Quantitative Methodology
Primary survey, n=3,800 respondents, Q4 2025, six countries; demand-side model with trade association cross-validation
Qualitative Methodology
47 expert interviews, Q4 2025; applied to validate demand model assumptions, identify emerging dynamics, and assess competitive positioning
Report Format
PDF and XLSX data workbook (Word format preview document)
Publisher
Market Minds Advisory
Report Code
MMA-2026-TEC-681
Published
September 2026
Contact
sales@marketmindsadvisory.com | www.marketmindsadvisory.com

Purchase the full Small Office Home Office (SOHO) Servers Market Report (2026 to 2036).

The full report sizes the small office and home office server market across six form factors, seven regions, and thirty countries, with forecasts to 2036 under base, bull, and bear cases. It examines why the category stopped shrinking, what remains of the buyer population after subscription services took the general purpose workloads, and how storage appliances now absorb the requirement at roughly a third of conventional system cost. Competitive analysis covers twenty participants evaluated consistently on system revenue, with detailed treatment of channel economics and software attachment. Cost structure, margin architecture, and regional residency drivers are analysed throughout. Primary research includes 3,800 survey responses and 47 expert interviews.
Six system form factors sized and forecast separately
Twenty participants evaluated on system and software revenue
Regional data residency and connectivity drivers across seven geographies
Margin architecture by form factor and attachment type
Replacement cycle and repatriation analysis across installed systems
Appliance substitution economics against conventional entry server cost

Built For The People Who Decide

From boardroom strategy to bench-side execution, this report is read cover-to-cover by leaders shaping the next decade of their industry, turning demand scenarios, market dynamics and valuation benchmarks into decisions.
CXOs/ Presidents/ VPs/ Managers
M&A and Corporate Development
Strategy Teams and R&D Heads
Procurement and Product Directors
Regulatory and Compliance Leaders
Investor Relations and Equity Analysts