Market Minds Advisory
SLI Battery Market

SLI Battery Market: SLI Battery Market: Chemistry Mix, Lead Recovery Economics and the Twelve Volt Survival, 2026 to 2036

Unit volumes have stopped growing while value climbs, because stop-start and hybrid duty destroys conventional batteries and pushes replacement demand toward constructions costing more than twice as much. Nobody notices the shift.

Lead Analyst

Published

September 2026

Make Smarter Decisions with Customized Research Insights

Request a free sample report and evaluate market opportunities, growth trends, and competitive dynamics relevant to your business needs.

2025 MARKET VALUE$29.0BMarket Size 2025
2036 FORECAST VALUE$46.6BBase Case , 2026 to 2036
CAGR 2026 TO 20364.4 %Bull 5.6% / Bear 3.2%
INCREMENTAL OPPORTUNITY$16.3BNet 10- year value creation
EXPANSION MULTIPLE1.54x2036 value over 2026 base
Strategic Levers
M&A Pipeline
Regional Outlook
Country Rankings
Competitive Intelligence
Segmental Deep-dive
Call-Us : 91 93563 13602

Executive Snapshot and Market Trajectory.

Almost everything written about this market gets the electrification question wrong. A battery electric vehicle still carries a twelve volt battery to run controls, safety systems and to wake the traction pack, so unit demand survives even as the drivetrain changes completely. The chemistry changes rather than the count.
What is actually changing is chemistry, not volume. Stop-start and hybrid duty cycles destroy conventional flooded batteries, so replacement demand has shifted toward absorbent glass mat construction that costs around 2.4 times as much and grows at 6.6%, half again the market rate of 4.4%. Units barely move while value climbs, and 76% of everything sold is replacement rather than original fitment. Forecasts built from vehicle production data have missed this entirely for a decade.
Five manufacturers hold 42% of measured unit shipments, and the real division is between those who smelt lead and those who buy it. Lead is 68% of manufactured cost and 96% of scrap returns into a closed loop, so a vertically integrated maker earns on the recovery spread while an assembler pays market price. Smelter closures under emission rules have tightened recycled lead supply considerably. Permitting decides everything.
Market Definition
The SLI battery market covers starting, lighting and ignition batteries supplying twelve volt electrical systems in road vehicles, spanning conventional flooded lead-acid, enhanced flooded, absorbent glass mat, valve regulated gel, heavy commercial vehicle flooded and lithium iron phosphate auxiliary constructions, across original equipment fitment and replacement supply. Sizing is measured at manufacturer revenue. Traction batteries for electric propulsion, stationary and motive industrial batteries, chargers, battery management electronics and battery recycling services sold separately are excluded.
Base Year Value
$29.0B in 2025 (MMA Primary Research Dataset, September 2026)
Forecast Period
2026 to 2036, eleven discrete annual values
CAGR
4.4% base case. Bull 5.6%. Bear 3.2%.
Fastest Growth Segment
Absorbent Glass Mat Batteries: 6.6% CAGR
Fastest Growth Country
India: 7.4% CAGR
Fastest Growth Region
South Asia and Pacific: 6.6% CAGR
Largest Region
East Asia: 31% of 2025 global value
Market Leaders
Clarios, GS Yuasa, East Penn Manufacturing, Camel Group, Exide Industries. Source: MMA Analysis based on company annual reports and measured unit shipment volume.
Primary Survey
n=3,800 procurement and R&D decision-makers, Q4 2025, six countries
Methodology
Demand-side build-up, cross-validated against public data, 47 expert interviews

SLI Battery Market Forecast Scenarios

sli-battery-market-size-forecast-scenario-1788412391761
Between 2020 and 2025 the market compounded at 3.2%, and unit volumes contributed almost none of it. Parc growth was slow across developed markets and semiconductor shortages suppressed new vehicle output. What lifted value instead was chemistry mix, as vehicles fitted with stop-start systems reached replacement age in numbers and workshops began fitting glass mat batteries where flooded units had previously gone.
The 4.4% base case rests on three commercial mechanisms. The vehicle parc keeps expanding across South Asia, Southeast Asia and Latin America, adding replacement demand on a four year cycle regardless of what happens to new vehicle sales. Stop-start and hybrid penetration in the parc continues rising, and those vehicles require the more expensive constructions. And lead pricing, which passes through directly, is supported by recycled supply constrained by smelter closures rather than scrap availability.
The bull case is hybrid penetration rising faster than assumed across the replacement parc, which pulls mix toward glass mat sooner and lifts average selling price. The bear case is lithium auxiliary batteries reaching replacement age in volume during the forecast period, since those units last long enough to extend the replacement interval carrying this market.

Flat Units, Rising Value, Misread Everywhere

This is an aftermarket business wearing an automotive supplier's clothes. Around 76% of units are replacement rather than original fitment, sold through distributors, workshops and retailers to a driver whose battery has just failed. New vehicle production matters far less than the size and age of the existing parc, which is why forecasts built from vehicle sales data keep failing.
TOP FIVE CONCENTRATION42%Share of measured unit shipments held by leading manufacturers
AFTERMARKET VOLUME SHARE76%Portion of units sold as replacement rather than original fitment
LEAD COST SHARE68%Lead as portion of finished battery manufactured cost
CLOSED-LOOP RECOVERY96%Portion of scrap batteries returned into the recycling loop
REPLACEMENT INTERVAL4.1 yearsTypical service life before replacement in ordinary passenger use
GLASS MAT PRICE MULTIPLE2.4xPrice of glass mat construction against conventional flooded equivalent
Duty cycle rather than electrification is reshaping the product. A stop-start vehicle cycles its battery many times an hour rather than once a trip, and flooded construction fails early. Enhanced flooded and glass mat constructions were developed for it, and glass mat costs around 2.4 times a conventional equivalent. As stop-start vehicles reach replacement age, workshops fit the expensive product because the cheap one fails.
The profit sits in the smelter, not the assembly line. Lead is 68% of manufactured cost, and 96% of scrap batteries return into a closed recovery loop that is the most complete recycling system in any industry. A manufacturer smelting its own returns earns the spread between scrap and refined lead; an assembler does not. Emission rules have closed smelters and made that position more valuable.
"The received wisdom is that electric vehicles kill this market, and it is simply wrong. Every electric car on the road carries a twelve volt battery that will need replacing, and hybrid duty is harder on batteries than anything a conventional engine ever did to them."
Director, Automotive Aftermarket and Energy Storage Practice · MMA Automotive Practice · September 2026

Market Trends

Stop-Start Duty Pushes Mix Toward Expensive Constructions

A stop-start vehicle restarts its engine many times during an ordinary trip, and each restart draws heavily from a battery that has been supporting electrical load with the engine off. Conventional flooded construction fails early under that treatment, sometimes within two years. Enhanced flooded and absorbent glass mat designs were engineered for the duty and now dominate fitment on those vehicles, at roughly 2.4 times conventional pricing for glass mat. As the stop-start parc reaches replacement age in volume, workshops fit the expensive product because the cheap alternative visibly does not survive, which lifts value without any unit growth.
Market Impact: Returns every 4.1 years
Electric Vehicles Keep The Twelve Volt Battery

A battery electric vehicle still needs a twelve volt supply for lighting, controls, safety systems, door locks and to wake the traction battery contactors, because running those loads from a high voltage pack is neither safe nor practical. The unit is smaller and the duty gentler than in a combustion vehicle, and several manufacturers now fit lithium iron phosphate rather than lead. Unit demand therefore survives electrification even as value per unit changes. Forecasts predicting collapse in this market have consistently confused the traction battery with the auxiliary one sitting beside it.
Market Impact: Cuts service life 2 years

Market Opportunities and Growth Drivers

Vehicle Parc Expansion Drives Replacement Demand Independently

Replacement volume follows the size and age of the vehicle parc rather than new vehicle sales, and the parc keeps expanding across South Asia, Southeast Asia, Latin America and Africa even in years when new registrations disappoint. A battery fitted today returns as replacement demand in roughly 4.1 years without any commercial effort. India grows at 7.4%, the fastest of any country, on a parc expanding faster than anywhere and a replacement cycle shortened further by heat and poor road surfaces. This demand is unusually predictable. Nothing about it requires commercial effort.
Market Impact: Moves 68% of product cost

Hybrid Penetration Shortens Battery Service Life

Full and mild hybrid vehicles work their twelve volt battery considerably harder than any conventional vehicle, cycling it constantly to support electrical load while the engine is stopped and drawing heavily on restart. Service life falls accordingly, which shortens the replacement interval and raises the construction required. Hybrid share of new sales has risen sharply across most major markets as an alternative to full electrification. Every hybrid entering the parc becomes a customer for a more expensive battery on a shorter cycle, which is the most favourable combination this market has.
Market Impact: Extends interval past 4.1 years

Market Restraints and Challenges

Lead Price Movement Passes Straight Through Thin Margins

Lead at 68% of manufactured cost against a thin conversion margin means any price movement dominates the result, and battery pricing follows the metal with a lag that manufacturers rarely control. The root cause is a product whose value is overwhelmingly the material inside it. Commercial impact falls hardest on assemblers buying refined lead, since integrated manufacturers offset movement through their own scrap intake. Mitigation runs through lead index-linked customer pricing, hedging on metal exchanges and, most effectively, owning secondary smelting capacity that turns exposure into a spread rather than a cost.
Market Impact: Costs 2.4 times conventional pricing

Lithium Auxiliary Batteries Would Extend Replacement Intervals

A lithium iron phosphate twelve volt battery lasts considerably longer than a lead-acid equivalent in the same duty, which is attractive to a vehicle manufacturer and unattractive to anyone selling replacements on a four year cycle. The root cause is simply better cycle life. Commercial impact arrives slowly, since fitment today only reaches the replacement market years later, but it compounds once it begins. Manufacturers are responding by developing their own lithium auxiliary products, by pursuing the original equipment fitment that determines later replacement chemistry, and by building recovery capability for a chemistry their smelters cannot process.
Market Impact: Retains 1 battery per vehicle
3 additional market trends, 4 additional growth drivers, and 2 additional restraints and challenges are covered in the full report. Contact sales@marketmindsadvisory.com to access the complete intelligence.

Segment CAGR and Growth Architecture

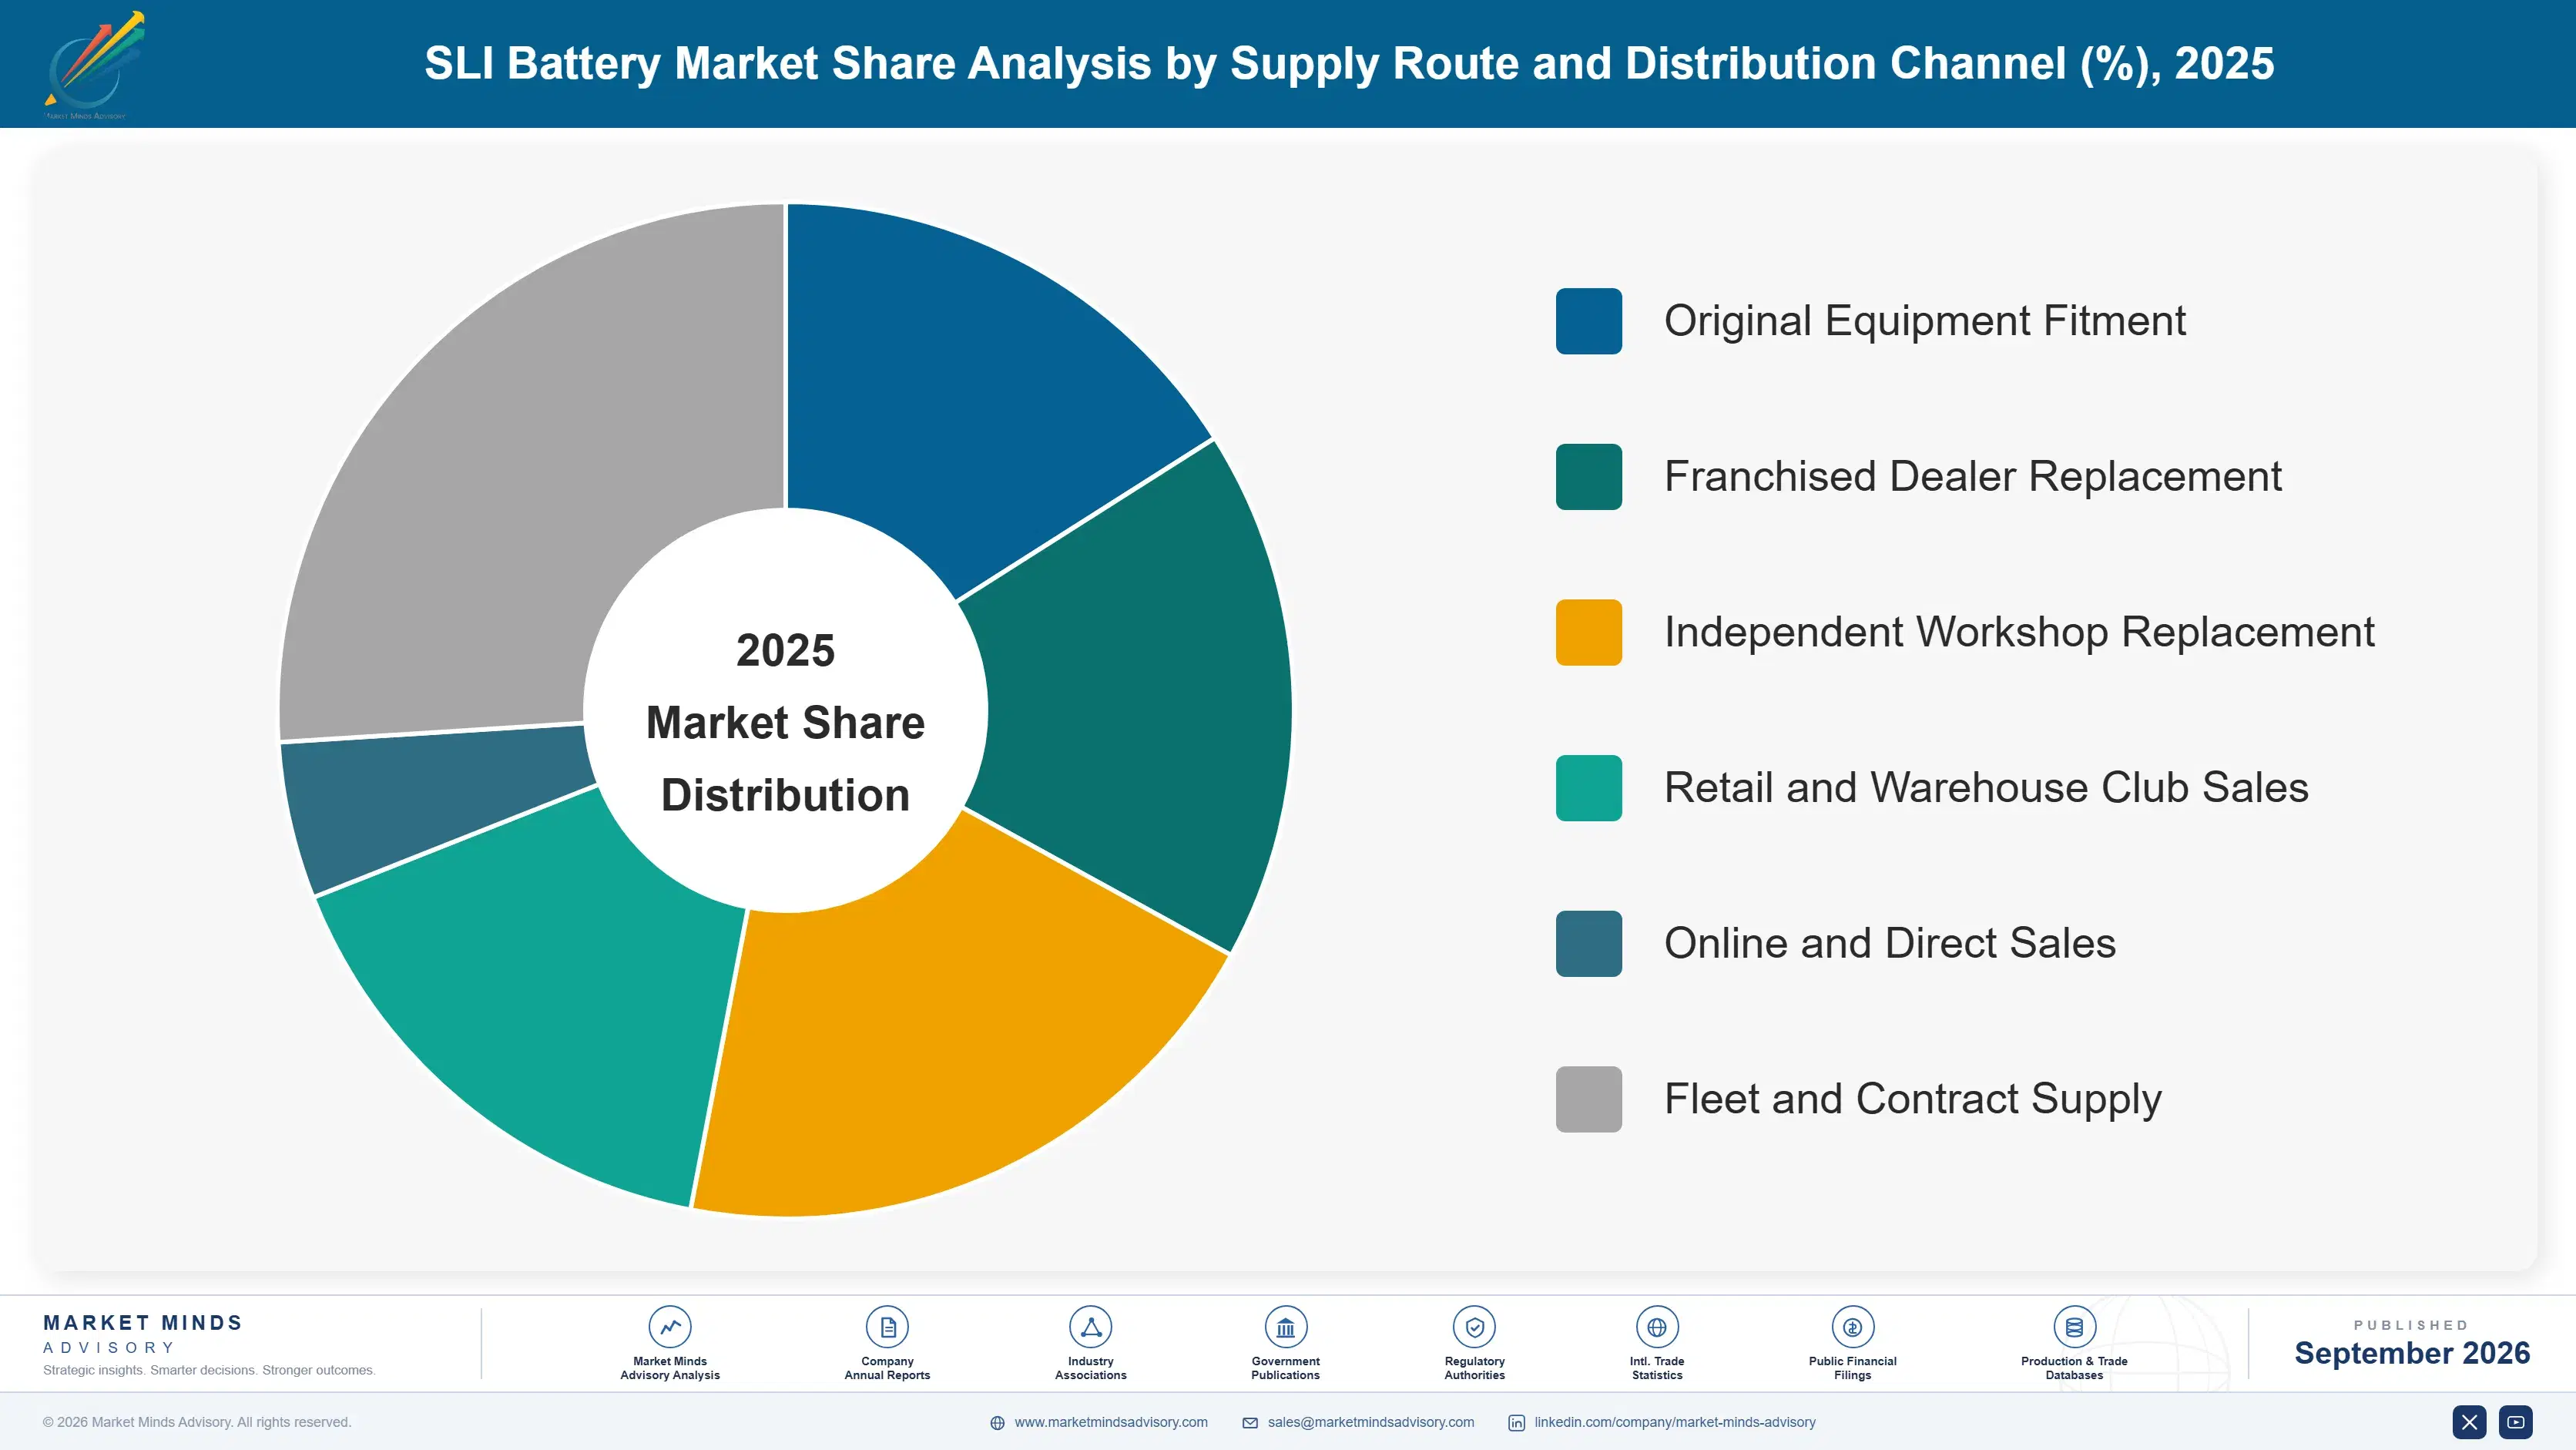
Segmentation follows battery construction, which determines cycle durability, cost, the duty a vehicle can impose and whether a workshop may substitute one product for another. Flooded, enhanced flooded, glass mat, gel, heavy vehicle and lithium auxiliary constructions occupy genuinely separate positions, and downward substitution is a warranty problem rather than a saving. Growth differs sharply between them.
sli-battery-market-market-share-analysis-1788412392297

Absorbent Glass Mat Batteries

Glass mat construction holds electrolyte in a fibre mat rather than as free liquid, which allows much deeper cycling and far better vibration resistance than flooded designs manage. It was developed for stop-start and hybrid duty, and as those vehicles reach replacement age in volume it is taking a rising share of aftermarket fitment. Pricing runs around 2.4 times a conventional flooded equivalent, so the mix shift lifts market value without any unit growth. Growth at 6.6% is half again the market rate of 4.4%. Workshops cannot substitute a cheaper flooded battery into a stop-start vehicle without the warranty consequences becoming visible quickly. The upgrade happens whether the driver understands it or not.
CAGR 6.6%

Lithium Iron Phosphate Twelve Volt Batteries

Lithium auxiliary batteries are appearing as original fitment in electric and premium combustion vehicles, where lower mass, longer life and better cold performance justify a cost that lead-acid does not approach. Volumes remain small against the flooded and glass mat base, and growth of 6.2% understates the percentage rate because the starting point is so low. The commercial significance is what happens later: fitment today determines replacement chemistry years from now, and a lithium unit lasts long enough to extend the interval this market depends on. Lead-acid manufacturers cannot process these through existing smelting operations, which is a genuine problem. Recovery capability for it has to be built separately from anything already owned.
CAGR 6.2%
Full segment breakdown across 6 segments available in the complete report.

Regional Architecture and Country Demand Map

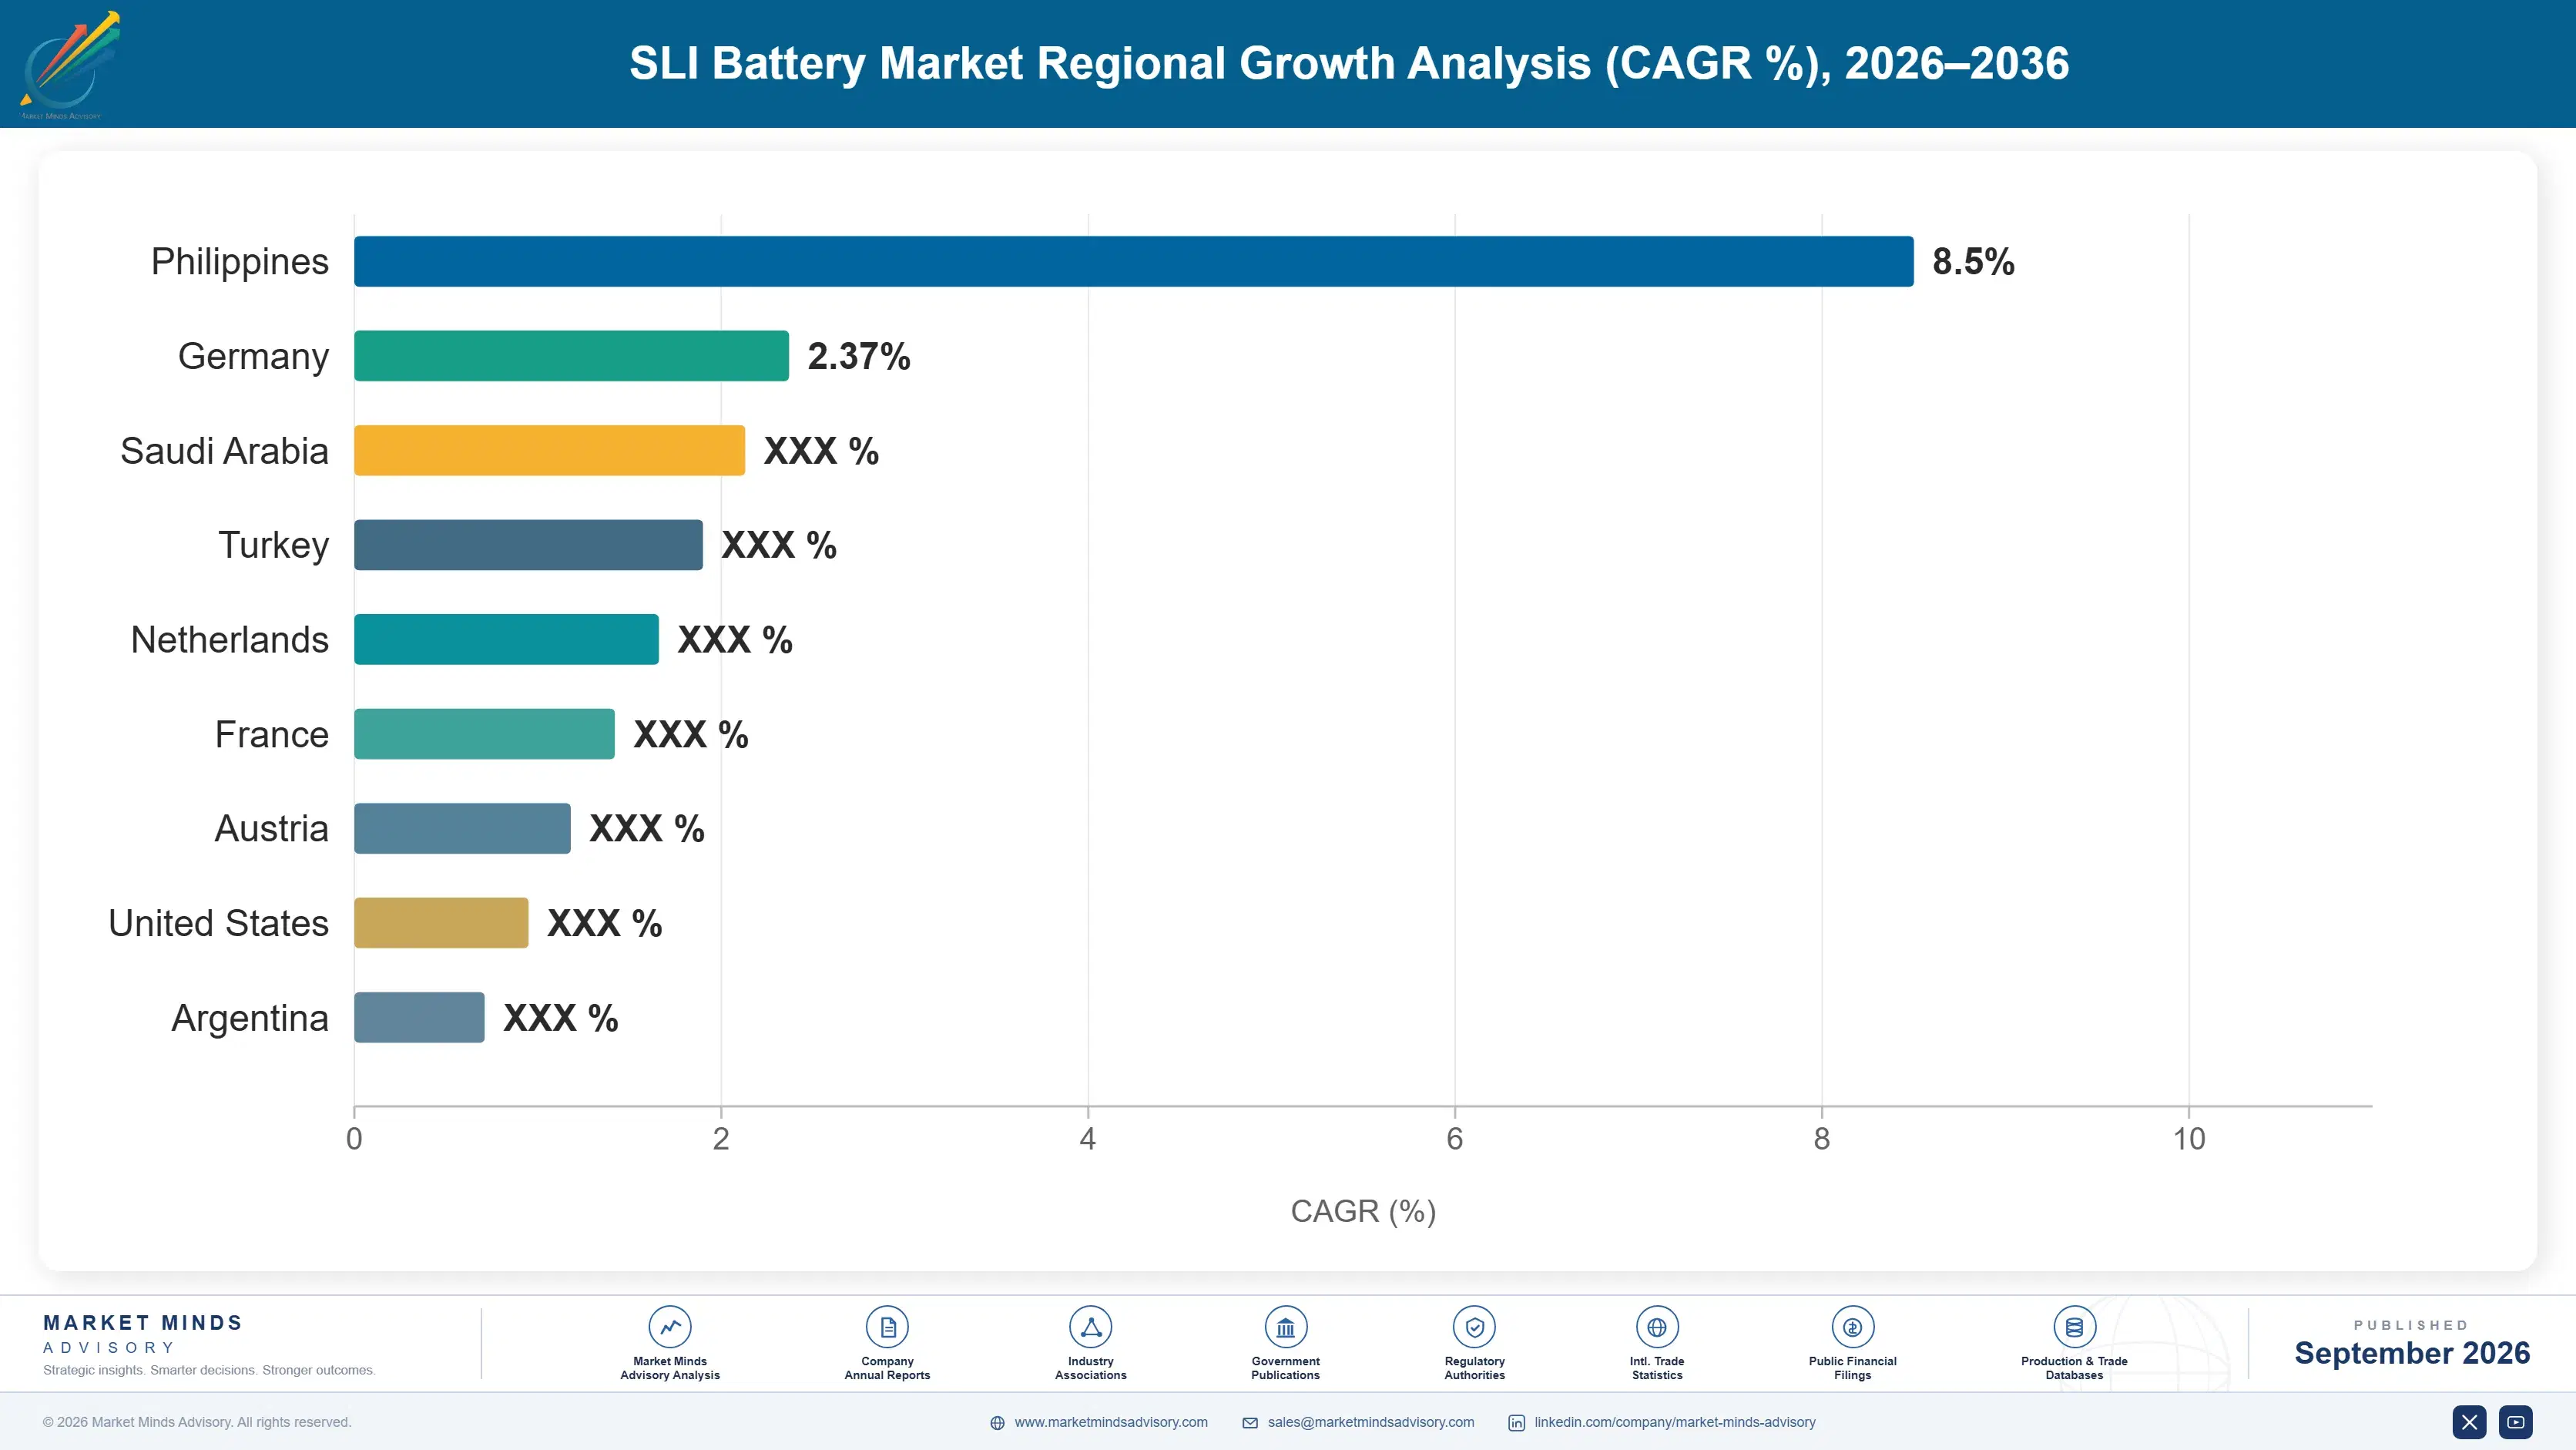
Demand follows the size, age and duty of the vehicle parc rather than new vehicle sales or economic output. East Asia leads on parc scale and manufacturing base, while replacement cycles run shortest where heat and road conditions are worst. New vehicle sales mislead badly.

East Asia

China holds the largest vehicle parc adding replacement demand anywhere, and East Asia at 31% sits marginally above the 30% ceiling of the standard band because the region also manufactures a very large share of world battery output. Domestic producers dominate on cost, with a fragmented base of smaller assemblers consolidating under tightening lead smelting emission rules. Japanese and Korean manufacturers hold original equipment fitment across their domestic vehicle industries and export glass mat product into European and American aftermarkets. Electric vehicle penetration here is the highest anywhere, which is changing auxiliary battery chemistry earlier than elsewhere. Consolidation here is being driven by permitting rather than by any commercial pressure.
Share: 31% | CAGR: 5.4% (2026 to 2036)

North America

A large, old and heavily driven vehicle parc generates enormous replacement volume, and retail channels including national parts chains and warehouse clubs carry a share of that business unmatched anywhere else in the world. Extreme heat across the southern states shortens service life materially, pulling the regional replacement interval below four years. Secondary lead smelting capacity has contracted under emission permitting, which has made the remaining integrated positions considerably more valuable. Growth of 3.6% reflects a mature parc where mix upgrade rather than unit expansion carries almost all the value. Warranty comebacks from flooded batteries fitted into stop-start vehicles have pushed the larger chains toward proper fitment data. Retail chains carry unusual weight in this market.
Share: 22% | CAGR: 3.6% (2026 to 2036)
Regional intelligence for 5 additional markets available in the complete report: Western Europe, South Asia and Pacific, Latin America, Middle East and Africa, Eastern Europe. Contact sales@marketmindsadvisory.com.
sli-battery-market-country-cagr-analysis-1788412392820

Where Battery Margin Genuinely Comes From

Four positions carry margin in a product that is mostly metal sold through an aftermarket nobody controls. Each depends on assets or channel relationships assembled over years, and the most valuable of them is a permitted smelter that no competitor can now build inside a reasonable timeframe. The others are channel work rather than capital.

Own Permitted Secondary Lead Smelting Capacity

Lead is 68% of manufactured cost and 96% of scrap returns into a closed loop, so a manufacturer smelting its own returns earns the spread between scrap and refined metal while an assembler simply pays market price. Emission permitting has closed capacity across North America and tightened it in China, and a new secondary smelter now takes the better part of a decade to permit. That converts an existing asset into something a competitor cannot replicate at any price. The position is worth more today than when it was built.
Market Impact: Controls the 68% metal share of product cost

Push Aftermarket Mix Toward Glass Mat

Glass mat construction prices at roughly 2.4 times conventional flooded and grows at 6.6% against a market at 4.4%, and the stop-start parc reaching replacement age makes the upgrade genuinely necessary rather than merely profitable. The commercial work is with workshops and distributors, who will fit the cheaper product unless they understand the warranty exposure of doing so. Manufacturers supplying fitment guidance and vehicle lookup data capture the upgrade; those shipping product to a shelf do not. This is channel education rather than product development. Distributors will not do this work themselves.
Market Impact: Captures the full 2.4 times upgrade price step

Secure Lithium Auxiliary Original Fitment Now

Original equipment fitment today determines replacement chemistry years later, so a manufacturer absent from lithium twelve volt platforms is surrendering an aftermarket it will want in the 2030s. The segment grows at 6.2% from a base small enough that percentage figures understate what is happening. It also requires recovery capability for a chemistry existing smelters cannot process at all, which is a genuine capital question rather than a product one. Manufacturers treating lithium auxiliary as a threat rather than a position are choosing to lose it. The decision has to be taken well ahead.
Market Impact: Positions early for the 6.2% auxiliary segment growth

Index Customer Pricing To Refined Lead

With 68% of cost in a traded metal and conversion margin thin, fixed pricing to distributors across a quarter is a metal bet rather than a commercial decision. Index-linked pricing moves that exposure to buyers who understand it, and large distributors accept indexation more readily than manufacturers expect because the alternative is a visible risk premium. Retail channels resist because shelf pricing cannot move weekly. The manufacturers managing this well are those combining indexation with their own smelting spread. Combining indexation with a smelting spread is what genuinely removes the exposure rather than merely relocating it.
Market Impact: Covers the whole 68% metal cost exposure properly

Who Controls the Margin Pool

Measured on unit shipment volume, the basis used throughout this section, the top five hold 42%. That is moderate concentration for an automotive component, and it reflects an aftermarket served regionally because batteries are heavy, cheap relative to their mass and uneconomic to ship far. The gap between the leaders and the rest is smelting position and distribution depth rather than any difference in battery engineering.
Competition runs on channel access, brand recognition at the point a driver's battery fails, and increasingly on fitment data telling a workshop which construction a given vehicle requires. Chinese manufacturers hold enormous domestic volume and export on price. Indian and Turkish producers serve their regions and export into adjacent markets. The established international manufacturers hold original equipment fitment and the premium replacement channels in developed markets.

Pressure builds from two directions. Smelter permitting is consolidating the industry by attrition, since assemblers without recovery capacity are exposed to a metal cost the integrated players partly control. And lithium auxiliary fitment is beginning to determine replacement chemistry for the next decade, which favours manufacturers already on those platforms. Rankings shift where manufacturers held smelting assets and pursued lithium fitment rather than defending flooded volume.
sli-battery-market-company-positioning-matrix-1788412393341

Competitive Moat and Risk Dimensions

CLARIOS

Moat: Integrated recovery and fitment scale

Extensive recycling and smelting capacity paired with original equipment fitment across many vehicle platforms gives both a metal cost advantage and the fitment position that determines replacement demand years later. Scale in glass mat production matches where the aftermarket mix is moving. Permitted smelting capacity in particular is an asset competitors cannot now build within any commercially useful timeframe.
CLARIOS

Risk: Lithium auxiliary chemistry transition

Smelting assets that create the current advantage cannot process lithium iron phosphate, so a chemistry shift in auxiliary batteries erodes the integrated position rather than simply changing the product. Original equipment relationships help but do not transfer the recovery economics. Heavy exposure to developed market parcs also means limited participation in the parc expansion driving growth elsewhere.
GS YUASA

Moat: Original equipment technical position

Long-standing fitment relationships across Japanese vehicle manufacturers give access to platforms worldwide and the technical engagement that determines specification years before a vehicle reaches replacement age. Capability across both lead-acid and lithium chemistries positions the company for the auxiliary battery transition rather than against it. Aftermarket brand recognition in Asian markets supports premium pricing.
GS YUASA

Risk: Limited Western aftermarket depth

Distribution reach in North American and European replacement channels is thinner than domestic competitors hold, which limits participation in the aftermarket that carries 76% of this market's volume. Recovery and smelting capacity outside its home region is more limited than the integrated competitors hold. Exposure to Japanese vehicle manufacturer volumes concentrates risk in a small number of customer relationships.

Players Tracked

Prominent Players

Clarios
GS Yuasa
East Penn Manufacturing
Camel Group
Exide Industries

Other Key Players

Amara Raja Energy and Mobility
Leoch International Technology
Chaowei Power
Tianneng Power
Sebang Global Battery
Hankook AtlasBX
Banner Batterien
FIAMM Energy Technology
Furukawa Battery
EnerSys
Crown Battery
Trojan Battery
Rombat
MUTLU Aku
Monbat

Recent Developments

AUGUST 2024

European battery regulation collection provisions advance for automotive

Provisions of the European Union battery regulation covering collection targets, recycled content and due diligence moved into application for automotive batteries. Lead-acid already meets the collection and content thresholds comfortably, so the practical burden falls on documentation and traceability rather than on any change in process.
Signal: Regulation that formalises an existing position quietly turns compliance paperwork into a barrier facing every importer.
MARCH 2025

Manufacturer announces investment in domestic lead recovery capacity

A leading battery manufacturer announced investment in additional domestic recovery and processing capacity, an organic capacity expansion rather than any acquisition. Emission permitting constraints on secondary smelting and the value of controlling refined metal supply were both cited as the reasoning behind it. Permitting timelines were noted explicitly.
Signal: Recovery capacity is now defended as a competitive asset rather than treated as an environmental obligation.
NOVEMBER 2024

Automaker specifies lithium auxiliary battery across vehicle platform

A vehicle manufacturer moved to lithium iron phosphate twelve volt auxiliary batteries across a platform, a product specification decision rather than any corporate transaction. Mass reduction, cycle life and cold performance were cited, with the change applying to both electric and combustion variants of the platform.
Signal: Fitment decisions taken now quietly determine which chemistry the replacement market will be selling next decade.

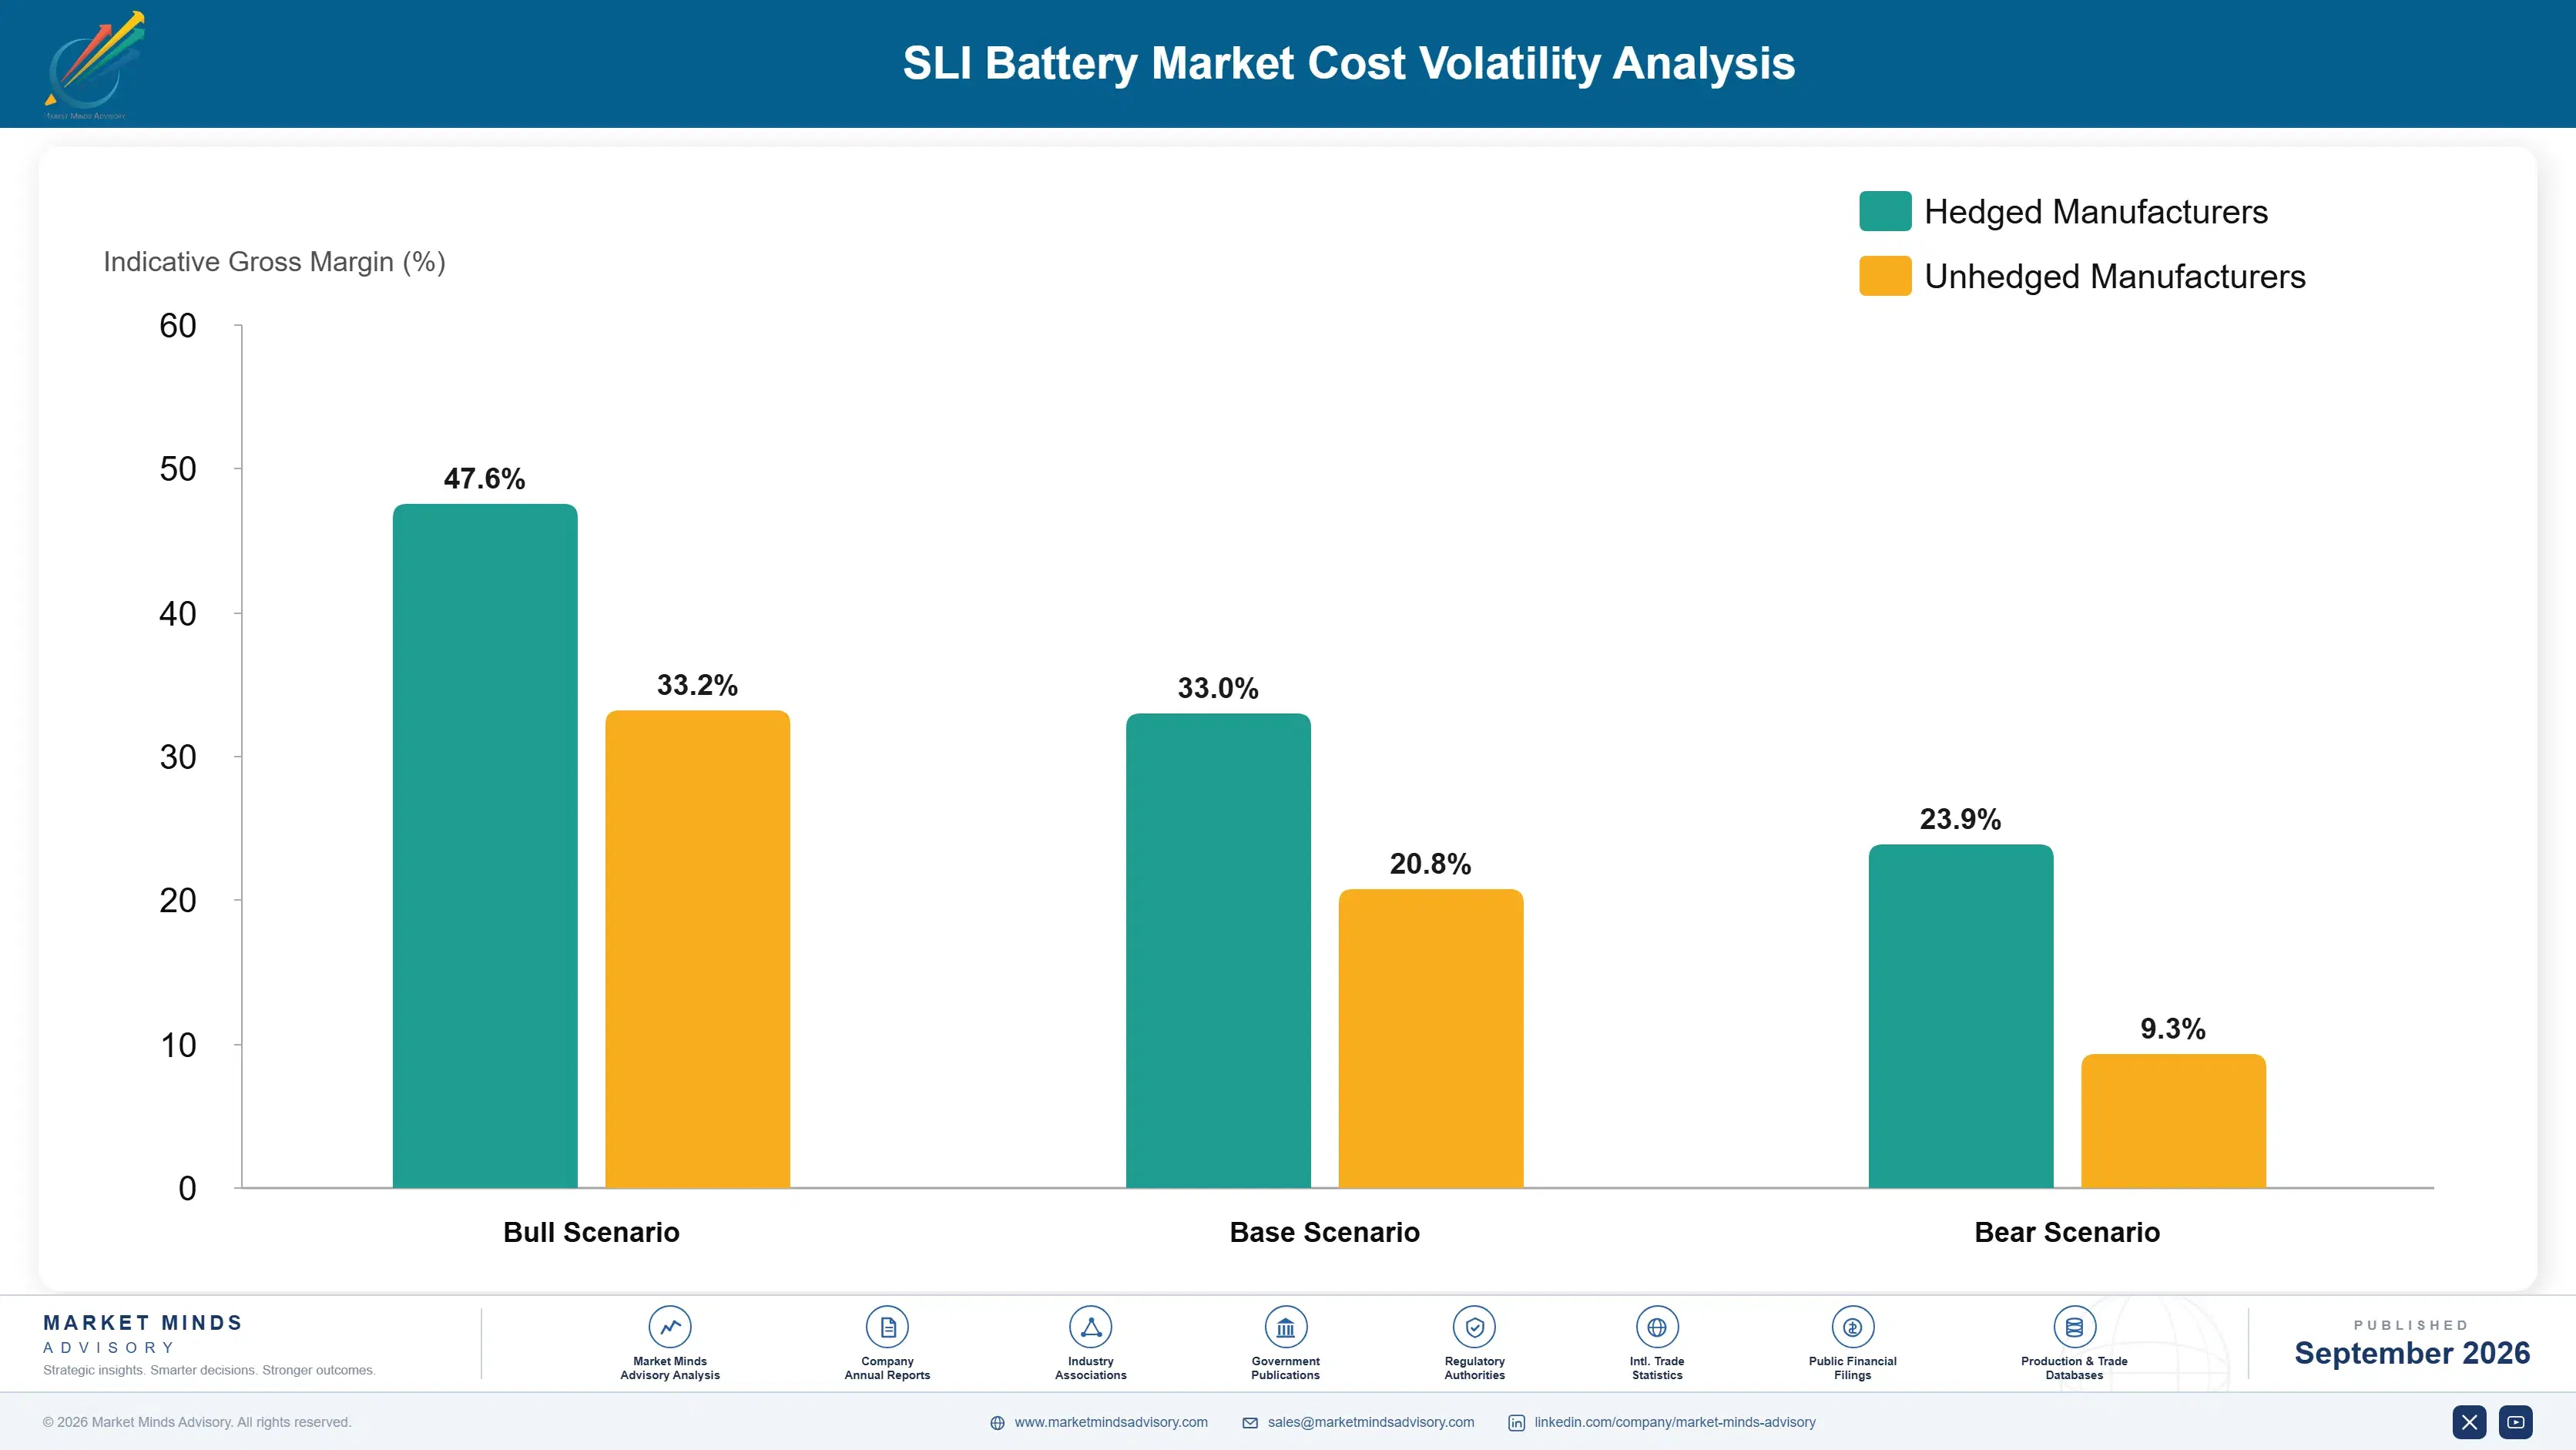
Lead, Polypropylene And Separators

Lead accounts for roughly 68% of manufactured cost, polypropylene casing around 9%, separators and glass mat material near 8%, and acid, alloy additives and assembly the balance. Lead supply divides between primary mine production concentrated in China, Australia and Peru, which USGS commodity reporting documents each year, and secondary recovery from scrap batteries, which supplies the majority of what this industry actually consumes.
Lead moved from roughly USD 1,800 per tonne to above USD 2,400 across recent years, and the movement passes through to battery pricing with a lag manufacturers do not control. Secondary smelter closures under emission permitting, which EPA lead standards enforcement drove across North America, tightened recovered supply independently of scrap collection. Manufacturers buying refined metal absorbed both effects; those smelting their own returns captured a widening spread instead.

The disadvantage mechanism is asset ownership rather than purchasing scale. An integrated manufacturer takes scrap through its own distribution, smelts it and consumes the output, so metal movement becomes a spread. An assembler buys at market and sells into an aftermarket that resists price increases. No amount of purchasing skill closes that gap, and permitting means it cannot be closed by building one.
sli-battery-market-cost-volatility-analysis-1788412393536

Closed-loop scrap collection through own distribution

Taking scrap batteries back through the same distributors and workshops that sell replacements secures feedstock for a manufacturer's own smelting and denies it to competitors bidding for the same material. Core charge structures make the return economically automatic, and the collection rate of 96% shows how completely the mechanism works when it is properly designed.

Lead index-linked pricing with large distributors

Tying distributor pricing to published refined lead quotations moves metal exposure to buyers who understand commodity movement, and large distributors accept it more readily than manufacturers assume. Retail channels resist because shelf pricing cannot be changed weekly, which limits the mechanism to the wholesale part of the aftermarket. Wholesale is where this genuinely works.

Alloy and grid design to reduce lead content

Grid geometry, alloy composition and plate thickness all determine how much lead a given capacity requires, and careful engineering removes mass without shortening service life. The savings are small per battery and very large across production volume, which is why the manufacturers with genuine design capability pursue it continuously rather than occasionally. Volume makes the difference.

Portfolio Architecture for Margin Defence

Margin separates by construction and by whether the manufacturer controls its own metal. Conventional flooded batteries sold into price-driven replacement channels are close to a commodity, with the outcome decided almost entirely by lead cost position. Glass mat product fitted to stop-start and hybrid vehicles is chosen because nothing cheaper survives the duty, prices at around 2.4 times conventional, and the workshop has no alternative.
The volume against premium tension resolves through the parc rather than through any manufacturer decision. Conventional flooded volume keeps plants loaded and distribution relationships alive, and it stays the larger unit segment for years because most vehicles still take it. But every stop-start and hybrid vehicle entering replacement age moves a unit from the cheap tier to the expensive one. The task is capturing that shift rather than creating it.

High-value pools sit where the product is specified rather than chosen: glass mat fitment on stop-start vehicles, original equipment supply that determines replacement chemistry later, and lithium auxiliary platforms. Each is defended by technical requirement rather than by brand. The pools are smaller in units than the flooded base and carry a disproportionate share of the industry's profit.

Volume / Commodity-Adjacent

Conventional flooded batteries sold through price-driven replacement channels where brand carries little weight. Outcome depends almost entirely on lead cost position, which means on whether the manufacturer smelts its own returns or buys refined metal.
Gross Margin: 11 to 17%

Premium / Certified

Enhanced flooded and glass mat batteries fitted to stop-start and hybrid vehicles where cheaper construction visibly fails. The 7 point range reflects how much of the price premium the manufacturer retains against how much the distribution channel takes.
Gross Margin: 19 to 26%

Sustainability / Regulatory / Next-Generation

Original equipment fitment positions, lithium auxiliary supply and integrated recovery operations capturing the metal spread. The 10 point range reflects how differently smelting spreads and fitment positions contribute across individual manufacturers.
Gross Margin: 24 to 34%
sli-battery-market-portfolio-architecture-1788412394036

High-value Sub-segments and Strategic Watch-out

Integrated Lead Recovery Operations

The most valuable position in this industry, converting a 68% metal cost into a spread that competitors cannot replicate because permitting a new secondary smelter now takes most of a decade. Nothing else here comes close on defensibility. It was built for environmental compliance and became the profit engine.
Gross Margin: 26 to 34%

Glass Mat Stop-Start Replacement

Growing at 6.6% and pricing at roughly 2.4 times conventional as the stop-start parc reaches replacement age in volume. Capture depends on workshop education and fitment data rather than on any product development at all. Workshops fitting the cheaper product generate warranty comebacks within months.
Gross Margin: 20 to 26%

Conventional Flooded Replacement

The volume core that keeps plants loaded and distribution relationships alive across every market. Necessary for scale rather than attractive on returns, and it will shrink steadily as the stop-start parc displaces older vehicles. Lead cost position decides whether any of it earns anything at all.
Gross Margin: 11 to 17%

Reconditioned And Informal Supply

Circulates widely across Latin America, Africa and parts of Asia, depressing legitimate pricing and diverting scrap away from permitted recovery. Regulators are beginning to act on the health consequences of informal smelting in several countries. Nothing legitimate competes with it on price in those markets.
Gross Margin: 6 to 12%

How Replacement Demand Actually Works

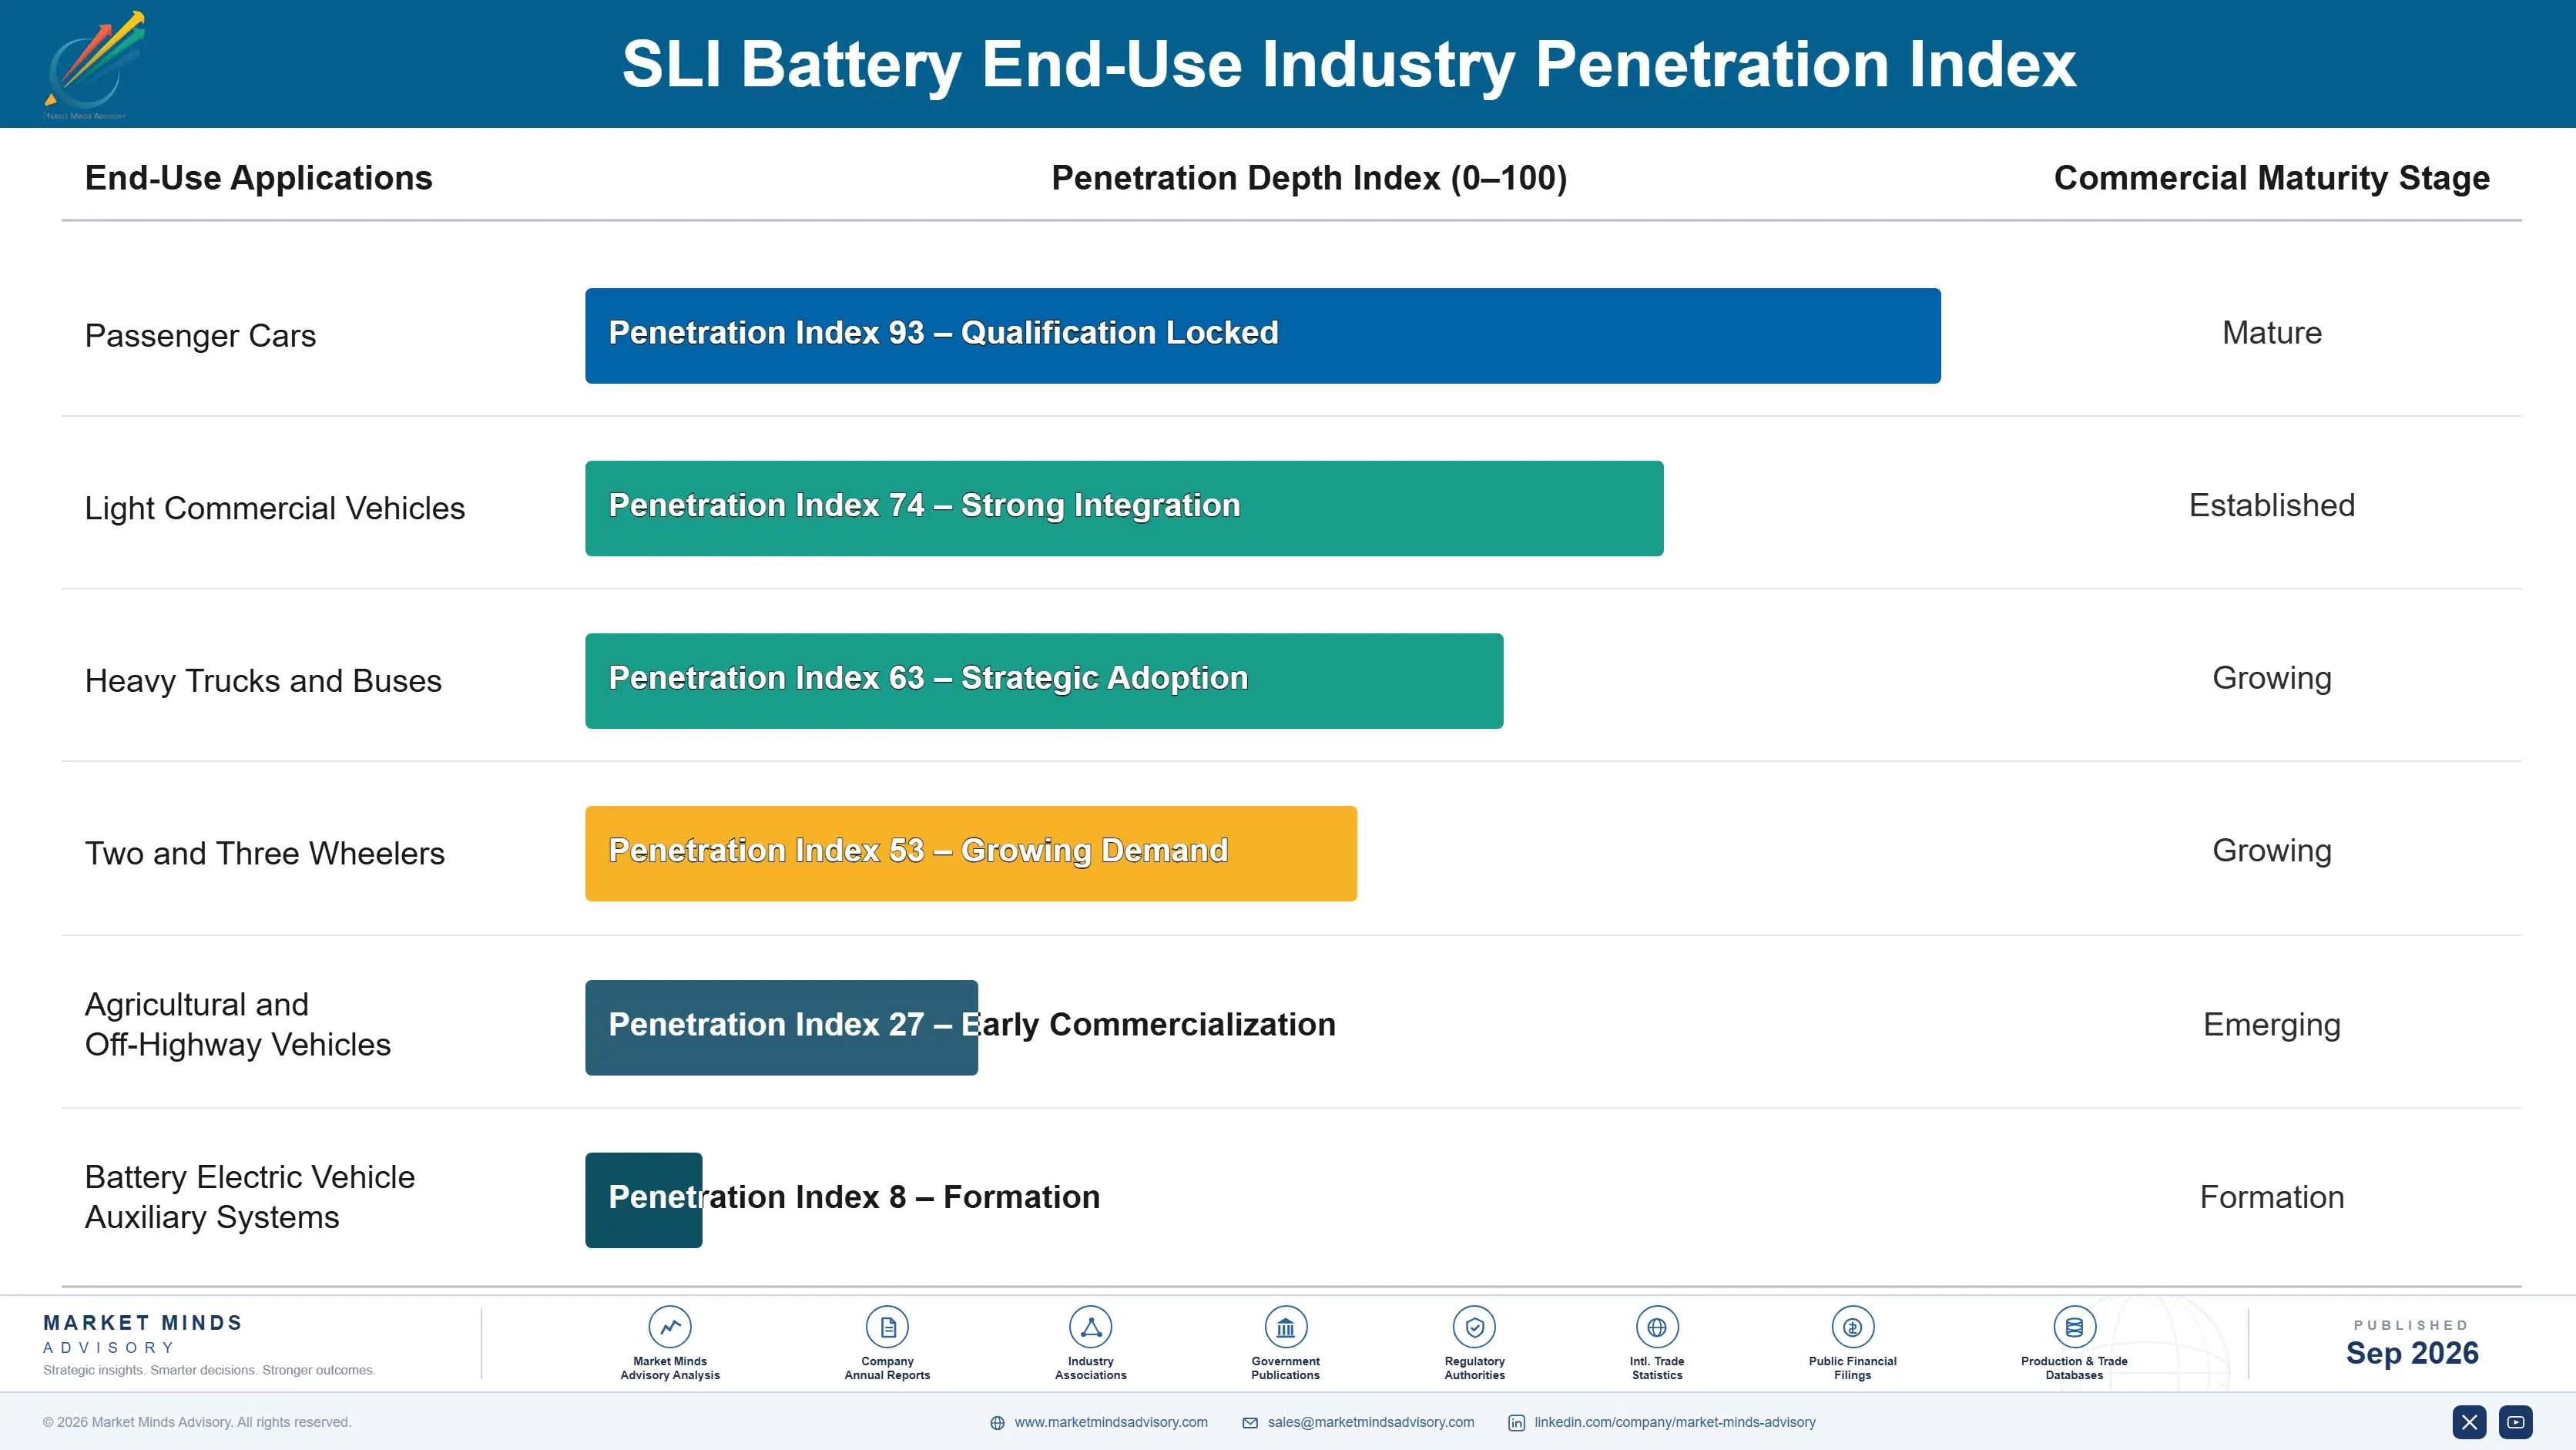
This market has the cleanest annuity in the automotive supply chain. Every battery fitted returns as replacement demand in roughly 4.1 years, with no contract and no marketing required. Around 76% of volume is replacement rather than original fitment, so parc size and age predict demand far better than vehicle production data. Original fitment matters because it sets the replacement chemistry.
Adoption depth varies sharply by channel. Franchised dealer workshops fit to manufacturer specification and never substitute downward. Independent workshops follow fitment data if they have it and the cheapest adequate option if they do not, which is where education changes outcomes. Retail and online channels sell to a driver choosing on price and physical fit, frequently without knowing the vehicle needs glass mat construction at all.

The buyer profile has shifted quietly. Battery choice once sat with a mechanic drawing on experience and a wall chart. It now depends on vehicle lookup data telling the fitter which construction a vehicle requires, because getting it wrong on a stop-start vehicle produces a comeback. Manufacturers who supply that data well shape the fitment decision without ever meeting the driver paying for it.
sli-battery-market-end-use-penetration-index-1788412394521

Where Manufacturers Should Compete

These are among the four positions where our research anticipates prominent divergence between winners and laggards over the coming forecast period. Each is grounded in the demand model, the regulatory perimeter, and the announced capacity pipeline.
01 / RECOVERY ASSET PRIORITY

Defend and extend permitted smelting capacity above all

Lead is 68% of manufactured cost and 96% of scrap returns through a closed loop, so smelting your own returns converts the dominant cost line into a spread that an assembler buying refined metal can never match. Emission permitting has closed capacity across North America and tightened it in China, and a new secondary smelter now takes most of a decade to authorise. That makes an existing permitted asset worth a great deal more today than it originally cost to build.
02 / CHANNEL FITMENT EDUCATION

Give workshops the data that forces the upgrade

Glass mat construction prices at roughly 2.4 times conventional flooded and grows at 6.6% against a market at 4.4%, but the upgrade is only captured where a fitter knows the vehicle requires it before quoting anything at all to the customer. Independent workshops without vehicle lookup data default to the cheapest adequate option and generate warranty comebacks a few months later instead. Supplying that data well shapes the fitment decision without the manufacturer ever meeting the driver who actually pays for it.
03 / AUXILIARY CHEMISTRY POSITIONING

Take lithium fitment now or lose it later

Original equipment fitment today determines which chemistry the replacement market sells in the 2030s, so a manufacturer absent from lithium twelve volt platforms is quietly surrendering an aftermarket it will certainly want later. The segment grows at 6.2% from a base small enough that the percentage understates what is actually happening across new vehicle platforms this year. It also demands recovery capability that existing lead smelters cannot provide, which is a capital question for the board rather than a product one.
04 / METAL EXPOSURE STRUCTURE

Index wholesale pricing rather than betting on lead

With fully 68% of cost sitting in a traded metal against a thin conversion margin, quoting fixed prices to distributors across a quarter is a commodity bet rather than any kind of considered commercial decision. Large distributors accept index-linked terms far more readily than manufacturers expect, because a fixed price carries a visible risk premium they end up paying for anyway in the end. Retail shelf pricing cannot move weekly, which confines the mechanism to the wholesale part of this aftermarket entirely.

Engagement Snapshot From the Field

A live engagement with an industry participant carrying material or product regulatory and market exposure ahead of a defining policy shift, showing how our research translates into a defensible multi-year portfolio strategy.
MARKET MINDS ADVISORY · CLIENT ENGAGEMENT SUMMARY
SLI Battery Producer Strategic Portfolio Review and Transition Roadmap 2026·Investment Scenario on SLI Battery Exposure Evaluation 2025-26
CLIENT PROFILE
A regional manufacturer of automotive batteries operating three assembly plants and serving aftermarket distribution across several national markets, with annual revenue reported at approximately USD 540 million (client-reported, unverified by MMA). The business purchased refined lead on the open market and held no secondary smelting capacity of its own anywhere in its operations at all.
STRATEGIC CHALLENGE
Margin had compressed across three consecutive years as lead pricing rose while aftermarket price increases proved impossible to pass through at the pace required. Competitors with recovery operations appeared unaffected by the same movement. Management wanted to know whether acquiring smelting capacity was justified or whether the answer lay entirely in pricing and product mix.
MMA APPROACH
MMA modelled the client's metal exposure against integrated competitors across a full lead price cycle, valued permitted secondary smelting capacity in the client's markets against replacement cost and permitting timelines, and analysed aftermarket mix by channel to establish how much glass mat upgrade the client was failing to capture at the point of fitment.
KEY FINDINGS
  1. Integrated competitors held a metal cost advantage equivalent to several points of margin across the cycle, which no purchasing improvement available to the client could have closed.
  2. Permitting a new secondary smelter in the client's principal market would take the better part of a decade, making acquisition of existing capacity the only realistic route to the position.
  3. Independent workshops were fitting conventional flooded batteries into stop-start vehicles in roughly a third of cases, generating warranty comebacks and forfeiting the price step entirely.
  4. The client's scrap collection through its own distributors was well below what a core charge structure would have achieved, leaving feedstock to competitors bidding for the same material.
CLIENT PROFILE
A regional manufacturer of automotive batteries operating three assembly plants and serving aftermarket distribution across several national markets, with annual revenue reported at approximately USD 540 million (client-reported, unverified by MMA). The business purchased refined lead on the open market and held no secondary smelting capacity of its own anywhere in its operations at all.
STRATEGIC CHALLENGE
Margin had compressed across three consecutive years as lead pricing rose while aftermarket price increases proved impossible to pass through at the pace required. Competitors with recovery operations appeared unaffected by the same movement. Management wanted to know whether acquiring smelting capacity was justified or whether the answer lay entirely in pricing and product mix.
MMA APPROACH
MMA modelled the client's metal exposure against integrated competitors across a full lead price cycle, valued permitted secondary smelting capacity in the client's markets against replacement cost and permitting timelines, and analysed aftermarket mix by channel to establish how much glass mat upgrade the client was failing to capture at the point of fitment.
KEY FINDINGS
  1. Integrated competitors held a metal cost advantage equivalent to several points of margin across the cycle, which no purchasing improvement available to the client could have closed.
  2. Permitting a new secondary smelter in the client's principal market would take the better part of a decade, making acquisition of existing capacity the only realistic route to the position.
  3. Independent workshops were fitting conventional flooded batteries into stop-start vehicles in roughly a third of cases, generating warranty comebacks and forfeiting the price step entirely.
  4. The client's scrap collection through its own distributors was well below what a core charge structure would have achieved, leaving feedstock to competitors bidding for the same material.
RECOMMENDED STRATEGY
Phase 1: Phase one: introduce a core charge structure across all distribution to secure scrap return volume before any smelting acquisition is attempted. Phase 2: Phase two: supply vehicle lookup and fitment data to independent workshops to capture the glass mat upgrade currently being forfeited at fitment. Phase 3: Phase three: pursue acquisition of existing permitted recovery capacity rather than attempting to build and permit new smelting from scratch.
OUTCOME
Within twelve months the client had introduced core charges across its distribution, raised scrap return volume by 47%, and reported glass mat share of aftermarket units up 8 percentage points (client-reported, unverified by MMA). Discussions on acquiring recovery capacity are continuing into the coming year.

Frequently Asked Questions

Foundational context covering the market sizes, CAGR, scope, country, region and competition that inform every finding below. This section is provided to cover basics and most often pre-purchase conversations, answered from the MMA Primary Research Dataset.

What is the current size of the SLI Battery Market?

The market was valued at USD 29.0 billion in 2025 and reaches USD 30.28 billion in 2026. Value growth comes from chemistry mix upgrade rather than from any unit expansion.

How large will the SLI Battery Market be by 2036?

MMA forecasts USD 46.57 billion by 2036, an increase of USD 16.29 billion over the 2026 base. That represents an expansion multiple of 1.54 times.

What is the CAGR for the SLI Battery Market 2026 to 2036?

The base case CAGR is 4.4%, with a bull case of 5.6% and a bear case of 3.2%. The historical rate between 2020 and 2025 was 3.2%.

Which segment is growing fastest?

Absorbent glass mat batteries grow at 6.6%, half again the market rate of 4.4%. Stop-start duty destroys conventional flooded construction, so workshops have no cheaper alternative.

Who are the major companies in the SLI Battery Market?

Clarios, GS Yuasa, East Penn Manufacturing, Camel Group and Exide Industries lead on measured unit shipments. Together they account for roughly 42% of the market.

Which country is growing fastest?

India grows fastest at 7.4%, on a vehicle parc expanding faster than anywhere else and a replacement interval shortened by heat, dust and road conditions.

Report Segmentation Architecture

The full report scope spans multiple orthogonal segmentation dimensions, with cross-tabulated demand data provided for each dimension pair. Coverage extends further to regional breakdowns, trend trajectories, and the competitive detail needed to support segment-level decision-making.

By Battery Construction

  • Conventional Flooded Lead-Acid
  • Enhanced Flooded Batteries
  • Absorbent Glass Mat
  • Valve Regulated Gel
  • Heavy Commercial Vehicle Flooded
  • Lithium Iron Phosphate Twelve Volt

By End-Use Industry

  • Passenger Cars
  • Light Commercial Vehicles
  • Heavy Trucks and Buses
  • Two and Three Wheelers
  • Agricultural and Off-Highway Vehicles
  • Battery Electric Vehicle Auxiliary Systems

By Supply Route and Distribution Channel

  • Original Equipment Fitment
  • Franchised Dealer Replacement
  • Independent Workshop Replacement
  • Retail and Warehouse Club Sales
  • Online and Direct Sales
  • Fleet and Contract Supply

By Region

  • East Asia
  • North America
  • Western Europe
  • South Asia and Pacific
  • Latin America
  • Middle East and Africa
  • Eastern Europe

Scope, Methodology, and Coverage

Every figure in this report is reproducible from documented input assumptions. The scope below maps the historical period, the forecast horizon, the segmentation dimensions, and the countries covered, alongside the underlying primary and qualitative methodology.
Historical Period
2020 to 2025
Forecast Period
2026 to 2036
Base Year
2025 (USD billions; MMA Primary Research Dataset, September 2026)
Market Definition
The SLI battery market covers starting, lighting and ignition batteries supplying twelve volt electrical systems in road vehicles, spanning conventional flooded lead-acid, enhanced flooded, absorbent glass mat, valve regulated gel, heavy commercial vehicle flooded and lithium iron phosphate auxiliary constructions, across original equipment fitment and replacement supply. Sizing is measured at manufacturer revenue. Traction batteries for electric propulsion, stationary and motive industrial batteries, chargers, battery management electronics and battery recycling services sold separately are excluded.
Quantitative Units
USD billions at manufacturer revenue, with supporting unit shipments and vehicle parc coverage by region
Segmentation Dimensions
Battery construction, end-use industry, supply route and distribution channel, region
Regions Covered
East Asia, North America, Western Europe, South Asia and Pacific, Latin America, Middle East and Africa, Eastern Europe
Countries Covered
China, Japan, South Korea, India, Indonesia, Australia, United States, Canada, Mexico, Brazil, Argentina, Germany, France, Italy, United Kingdom, Poland, Turkey, South Africa
Key Companies Profiled
Clarios, GS Yuasa, East Penn Manufacturing, Camel Group, Exide Industries, Amara Raja Energy and Mobility, Leoch International Technology, Chaowei Power, Tianneng Power, Sebang Global Battery, Hankook AtlasBX, Banner Batterien, FIAMM Energy Technology, Furukawa Battery, EnerSys, Crown Battery, Trojan Battery, Rombat, MUTLU Aku, Monbat
Quantitative Methodology
Primary survey, n=3,800 respondents, Q4 2025, six countries; demand-side model with trade association cross-validation
Qualitative Methodology
47 expert interviews, Q4 2025; applied to validate demand model assumptions, identify emerging dynamics, and assess competitive positioning
Report Format
PDF and XLSX data workbook (Word format preview document)
Publisher
Market Minds Advisory
Report Code
MMA-2026-AUT-111
Published
September 2026
Contact
sales@marketmindsadvisory.com | www.marketmindsadvisory.com

Purchase the full SLI Battery Market Report (2026 to 2036).

The full report separates unit volume from value throughout and treats this as the aftermarket business it actually is, which is the framing that explains why forecasts built from vehicle production data have been wrong for a decade. It sizes six battery constructions with individual growth rates, seven regions built from parc size, age and duty, and the chemistry mix shift that carries all the value growth. Competitive analysis covers twenty manufacturers on a consistent unit shipment basis, with smelting position and distribution depth treated as the decisive variables. Input cost modelling breaks out lead, polypropylene and separator exposure against recovery asset ownership.
Six battery constructions with individual growth rates
Unit volume separated from value throughout
Vehicle parc sized by age and duty
Smelting position mapped across all manufacturers covered
Twenty manufacturers on consistent unit shipment basis
Lead cost exposure by recovery asset ownership

Built For The People Who Decide

From boardroom strategy to bench-side execution, this report is read cover-to-cover by leaders shaping the next decade of their industry, turning demand scenarios, market dynamics and valuation benchmarks into decisions.
CXOs/ Presidents/ VPs/ Managers
M&A and Corporate Development
Strategy Teams and R&D Heads
Procurement and Product Directors
Regulatory and Compliance Leaders
Investor Relations and Equity Analysts