Market Minds Advisory
Sleeping Bag Market

Sleeping Bag Market: Sleeping Bag Market: Temperature Ratings That Mislead, Down Supply Reality and The Quilt Problem

The number printed on a sleeping bag is a survival limit rather than a comfort figure, and most buyers read it the other way round and spend a cold night finding out.

Lead Analyst

Published

September 2026

Make Smarter Decisions with Customized Research Insights

Request a free sample report and evaluate market opportunities, growth trends, and competitive dynamics relevant to your business needs.

2025 MARKET VALUE$2.9BMarket Size 2025
2036 FORECAST VALUE$4.9BBase Case , 2026 to 2036
CAGR 2026 TO 20364.6 %Bull 5.8% / Bear 3.4%
INCREMENTAL OPPORTUNITY$1.8BNet 10- year value creation
EXPANSION MULTIPLE1.58x2036 value over 2026 base
Strategic Levers
M&A Pipeline
Regional Outlook
Country Rankings
Competitive Intelligence
Segmental Deep-dive
Call-Us : 91 93563 13602

Executive Snapshot and Market Trajectory.

Almost every sleeping bag carries a number that buyers misread. The limit rating is where an average man survives while shivering; the comfort rating is where an average woman actually sleeps warm, and the gap between the two runs about 6 degrees Celsius. One label line would fix it.
Quilts and open-back systems grow at 6.9%, half again the market rate of 4.6%, because removing the compressed insulation underneath saves weight that does nothing anyway. Synthetic mummy bags follow at 5.3%. Rectangular family bags grow slowest at 2.1%, sold on price into a use case that treats them as furniture. Down-filled mummy bags sit between them, carrying an input that responds to poultry markets.
Down supply is the constraint nobody sees from the outside. High fill-power down is a by-product of duck and goose farming for meat, which means supply follows appetite in East Asia and Eastern Europe rather than demand from outdoor brands. Concentration is low at 24% held by the top five, and China is growing fastest at 7.8%. A disease event moves prices immediately and nothing can be done to increase supply in response.
Market Definition
This market covers sleeping bags and closely related sleep systems for outdoor, expedition and institutional use, spanning down-filled mummy bags, synthetic mummy bags, quilts and open-back systems, rectangular and family bags, children's and youth bags, and military and institutional bags. Sizing is at wholesale shipment value. Sleeping pads and mattresses, bivvy bags, tents, camp bedding, and indoor slumber bags are excluded.
Base Year Value
$2.9B in 2025 (MMA Primary Research Dataset, September 2026)
Forecast Period
2026 to 2036, eleven discrete annual values
CAGR
4.6% base case. Bull 5.8%. Bear 3.4%.
Fastest Growth Segment
Quilts And Open-Back Systems: 6.9% CAGR
Fastest Growth Country
China: 7.8% CAGR
Fastest Growth Region
South Asia and Pacific: 6.6% CAGR
Largest Region
North America: 34% of 2025 global value
Market Leaders
Vista Outdoor, Amer Sports, Oberalp Group, Katadyn Group, Exxel Outdoors. Source: MMA Primary Research Dataset, July 2026.
Primary Survey
n=3,800 procurement and R&D decision-makers, Q4 2025, six countries
Methodology
Demand-side build-up, cross-validated against public data, 47 expert interviews

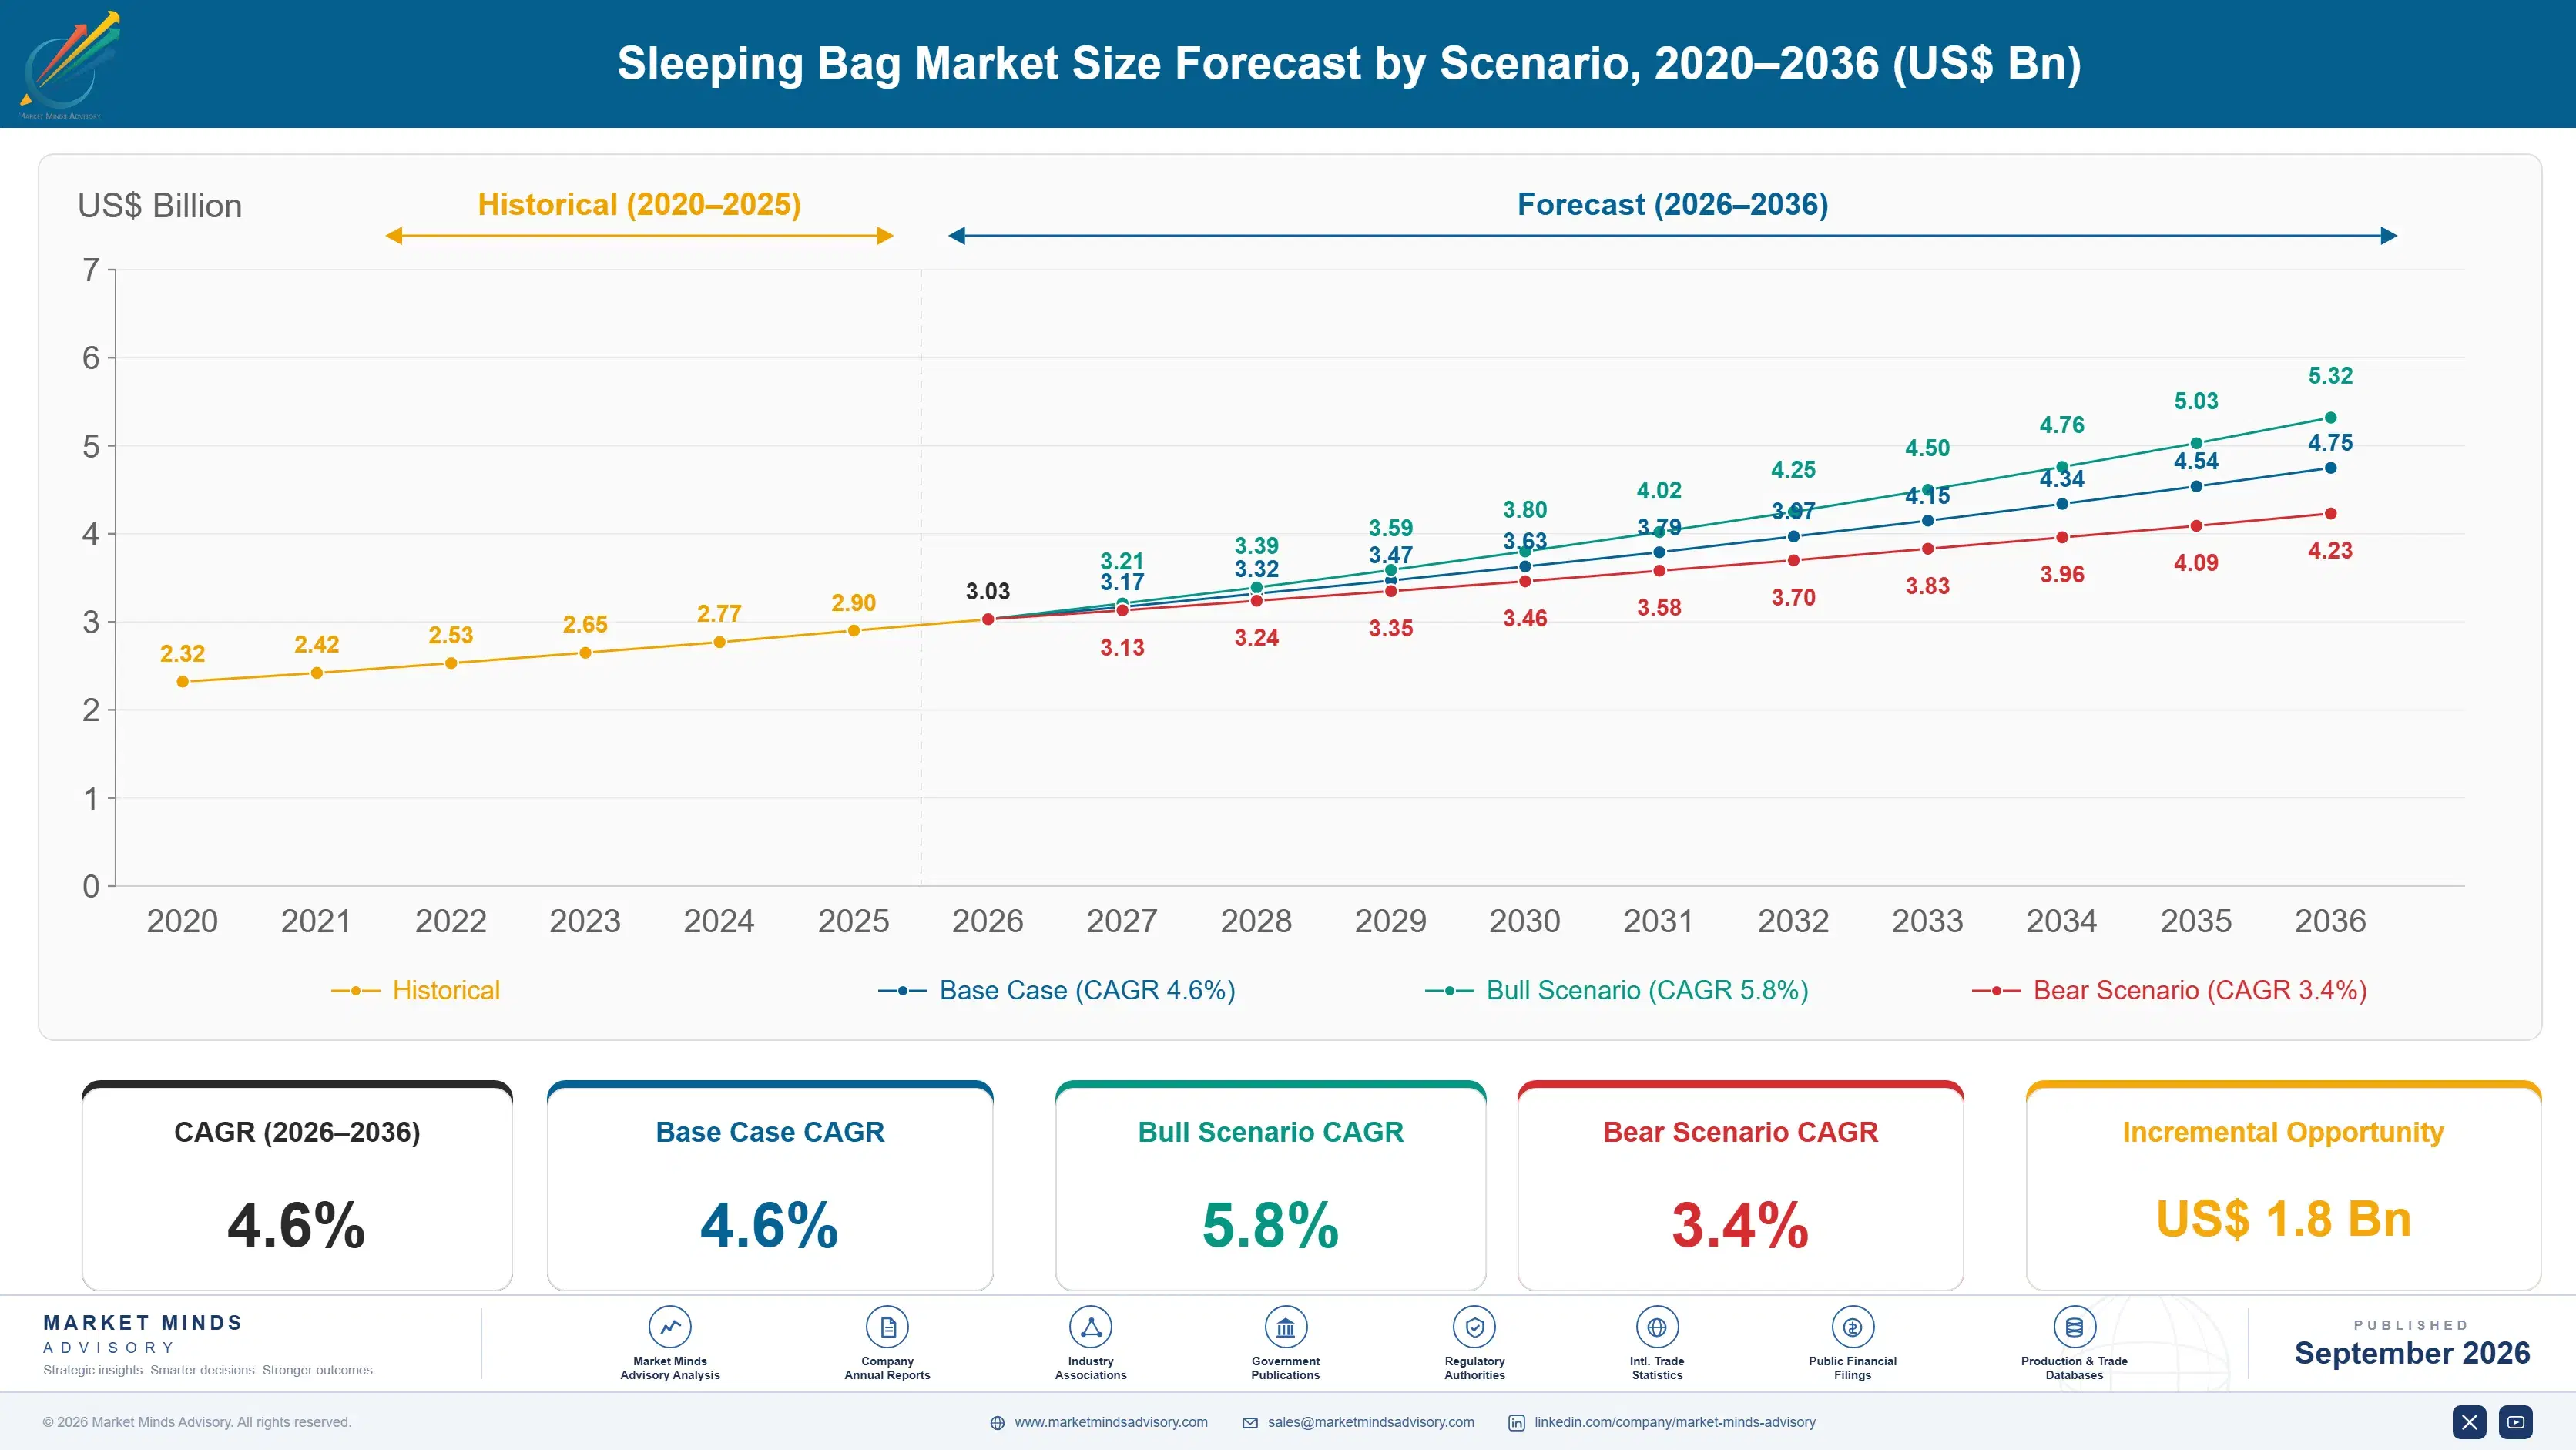
Sleeping Bag Market Forecast Scenarios

sleeping-bag-market-share-analysis-size-forecast-scenario-1790023976778
Growth of 3.4% between 2020 and 2025 records one enormous spike and a long digestion. Camping participation surged through 2020 and 2021 as people sought outdoor activity, and sleeping bags sold out across every price tier. Much of that demand was first-time buyers purchasing entry-level product they then used two or three times, so the replacement cycle that normally follows a participation increase largely failed to arrive.
Three mechanisms carry the base case. Quilts grow at 6.9% as weight-conscious hikers work out that insulation crushed beneath a body does nothing. Chinese outdoor participation expands at 7.8%, supported by domestic manufacturing that supplies most of the world anyway. Down price volatility continues pushing mid-tier product toward engineered synthetics, where performance has genuinely closed much of the gap at comparable weight. All three are visible in shipment data already.
The bull case is rating disclosure becoming standard. If retailers displayed comfort rather than limit ratings by default, buyers would purchase warmer bags and be considerably less likely to abandon camping after a bad night. The bear case is down supply. A poultry disease event across major producing regions would cut high fill-power availability sharply, and synthetic substitution takes a season to arrange.

The Number On The Label

The central problem in this category is a label that most buyers read backwards. European standard testing produces a comfort rating, a limit rating and an extreme rating, and brands almost always print the limit figure because it is the more impressive number. Limit is where an average man survives in a curled position while shivering. Comfort is where an average woman sleeps normally, and it sits about 6 degrees warmer.
TOP FIVE CONCENTRATION24%Combined shipment value share held by the five largest participants
COMFORT LIMIT GAP6 degreesTypical difference between the comfort and limit rating figures
AVERAGE RETAIL PRICEUSD 118Weighted retail price across every bag type covered here
DOWN FILL COST SHARE43%Portion of manufacturing cost represented by fill material
BAG REPLACEMENT INTERVAL9 yearsAverage time an owner keeps a bag before replacing it
ASIAN PRODUCTION SHARE81%Share of global units manufactured within Asian facilities
Down supply behaves nothing like a normal input market. High fill-power down comes from mature ducks and geese raised for meat, mostly in China, Poland, Hungary and Ukraine, which means availability follows food demand and bird age rather than anything outdoor brands do. A poultry disease event moves prices immediately and there is no way to increase supply in response. Fill is roughly 43% of manufacturing cost.
Replacement runs at about nine years, which is unusually long and shapes everything commercially. A bag sold today is a customer who will not return for most of a decade, so brands compete for a first purchase rather than for loyalty. Getting that first purchase right is worth more than any retention programme could be.
"The industry prints the number that makes the bag sound warmer and then wonders why people say camping is miserable. One line of label copy would fix it and nobody wants to go first."
Director, Outdoor and Sporting Goods Practice · MMA Consumer and Industrial Goods Practice · September 2026

Market Trends

Quilts Remove The Insulation That Never Worked

Quilts and open-back systems grow at 6.9% against 4.6% for the market on a genuine physical argument rather than a fashion. Insulation compressed beneath a sleeping body loses almost all its loft and therefore almost all its warmth, so the fill underneath is weight carried for nothing. Removing it saves between 15% and 25% of total mass at equivalent warmth. The trade is draught management, which requires more care in setup and suits experienced users considerably better than beginners. That is why the format has grown fastest among people who walk furthest. Beginners still buy conventional bags, probably rightly.
Market Impact: China grows at 7.8% annually

Engineered Synthetics Close The Gap With Mid-Grade Down

Continuous filament and short-staple synthetic insulations have improved enough that they now match mid-grade down on warmth for weight, while retaining performance when wet and costing considerably less. Down still wins clearly at the high fill-power end and in compressibility. What has changed is the middle of the market, where the practical case for down has weakened and price volatility in the supply chain makes synthetics easier to plan around. Synthetic mummy bags grow at 5.3% as a result. A brand planning production a season ahead can forecast a petrochemical input in a way it cannot forecast a poultry by-product.
Market Impact: Covers roughly 100% of major retail

Market Opportunities and Growth Drivers

Chinese Outdoor Participation Expands With Domestic Manufacturing

China grows fastest of any country covered at 7.8%, and it is unusual in combining rapidly rising participation with the manufacturing base that already supplies most of the world. Camping and hiking have expanded quickly among urban middle-income households, supported by national investment in park access and by domestic brands that price well below imported equivalents. Local production means domestic demand is served without freight or duty, which compounds the advantage that manufacturing scale already provides. Domestic brands are now building technical credibility on top of that cost position, which is a considerably harder combination to answer.
Market Impact: Gap runs about 6 degrees

Responsible Down Standards Become A Purchasing Requirement

Certification covering live-plucking and force-feeding has moved from a differentiator to a baseline requirement across European and North American retail, and major chains now decline uncertified down entirely. That has reorganised sourcing toward traceable supply chains, which carry cost and administrative overhead that smaller brands struggle to absorb. It also gives certified suppliers pricing power they did not previously hold. Compliance capability has become a genuine commercial asset rather than a marketing line. Smaller brands carry the administrative overhead less comfortably than the majors do, and certified suppliers have gained pricing power they did not previously hold anywhere.
Market Impact: Fill is 43% of manufacturing cost

Market Restraints and Challenges

Temperature Ratings Mislead The People Buying Them

Brands print limit ratings, which describe survival while shivering, and buyers read them as comfort figures that sit roughly 6 degrees warmer. The root cause is competitive: a brand printing the honest comfort number appears to sell a colder bag than an identical competitor printing limit. Commercially it produces cold nights, returns and people concluding that camping is unpleasant. Participants addressing it print both figures prominently, and several now lead with comfort, which costs nothing beyond label design. The commercial risk lasts only until enough competitors follow the same labelling practice.
Market Impact: Saves 15% to 25% of mass

Down Supply Follows Appetite Rather Than Demand

High fill-power down is a by-product of raising ducks and geese for meat, and the birds must reach maturity for the down to develop properly, so supply responds to food markets in China, Poland, Hungary and Ukraine rather than to outdoor demand. The root cause is that nobody farms birds for down alone because it would not pay. Commercially it means price shocks arrive without warning. Mitigation runs to synthetic substitution, forward contracting and recycled down recovery. None of the three removes the exposure entirely, and recovery is the only one that also satisfies traceability.
Market Impact: Synthetic grows 0.7 points faster
3 additional market trends, 4 additional growth drivers, and 2 additional restraints and challenges are covered in the full report. Contact sales@marketmindsadvisory.com to access the complete intelligence.

Segment CAGR and Growth Architecture

Segmentation follows construction type, the dimension on which insulation choice, weight, price and buyer expertise all divide together. Six construction types are assessed at wholesale shipment value. Sleeping pads and mattresses, bivvy bags, tents, camp bedding and indoor slumber bags sit outside the defined scope throughout this report. Insulation choice accounts for most of the cost difference between them.
sleeping-bag-market-share-analysis-market-share-analysis-1790023977311

Quilts And Open-Back Systems

Quilts and open-back systems grow at 6.9%, half again the market rate of 4.6%, on physics rather than on fashion. Insulation compressed beneath a sleeping body loses nearly all its loft and therefore nearly all its warmth, which means the fill underneath a conventional bag is weight carried for no thermal return at all. Removing it saves between 15% and 25% of total mass at equivalent warmth, and for anyone counting grams over a multi-day route that is a substantial figure. The trade is draught management at the edges, which requires setup care and suits experienced users considerably better than beginners. Manufacturing requires no new capability of any kind at all here.
CAGR 6.9%

Synthetic Mummy Bags

Synthetic mummy bags grow at 5.3% as engineered insulations close the performance gap with mid-grade down at comparable weight. The practical advantages are considerable: synthetics retain warmth when damp, dry far faster, cost substantially less and carry none of the supply volatility that comes with a by-product input. Down still wins clearly at high fill powers and on compressibility, which matters for expedition use. What has changed is the middle of the market, where the argument for down has weakened enough that brands planning production a season ahead increasingly prefer an input whose price they can actually forecast. That forecastability is now worth as much commercially as the performance argument, and several mid-tier ranges have been reformulated for that reason.
CAGR 5.3%
Full segment breakdown across 6 segments available in the complete report.

Regional Architecture and Country Demand Map

Shares record where bags are sold rather than where they are sewn. North America sits above its standard band on camping participation depth, and Eastern Europe below despite supplying a meaningful share of the world's high fill-power down. Both deviations carry a stated reason in the paragraph concerned.

North America

At 34% this sits above the standard band, reflecting camping participation with a depth that no other region matches. Federal and state park infrastructure, a car camping culture with no real equivalent elsewhere, and an established thru-hiking community together support demand across every price tier from rectangular family bags to expedition down. Replacement at roughly nine years and the 2020 participation spike having largely digested means growth of 3.9% comes from upgrade and from new entrants rather than from any broad expansion in the base. Return rates on entry-tier product are unusually high and concentrate on bags whose limit rating was printed as though it were a comfort figure. Canadian demand skews colder-rated and behaves similarly at smaller scale.
Share: 34% | CAGR: 3.9% (2026 to 2036)

East Asia

The 23% position covers the region that manufactures most of the world's sleeping bags and is now among the fastest-growing markets for them. China grows at 7.8%, the fastest of any country covered, as urban middle-income households take up camping and hiking with real speed. Domestic brands price well below imported equivalents because production and demand sit in the same place. Japanese and Korean demand is smaller, more premium and closely tied to well-developed hiking cultures with high expectations of equipment specification. Naturehike and Kailas have begun exporting technical ranges rather than only supplying other brands, which is a change from the previous decade. Domestic retail expectations are rising quickly toward Japanese and Korean levels.
Share: 23% | CAGR: 5.7% (2026 to 2036)
Regional intelligence for 5 additional markets available in the complete report: Western Europe, South Asia and Pacific, Latin America, Eastern Europe, Middle East and Africa. Contact sales@marketmindsadvisory.com.
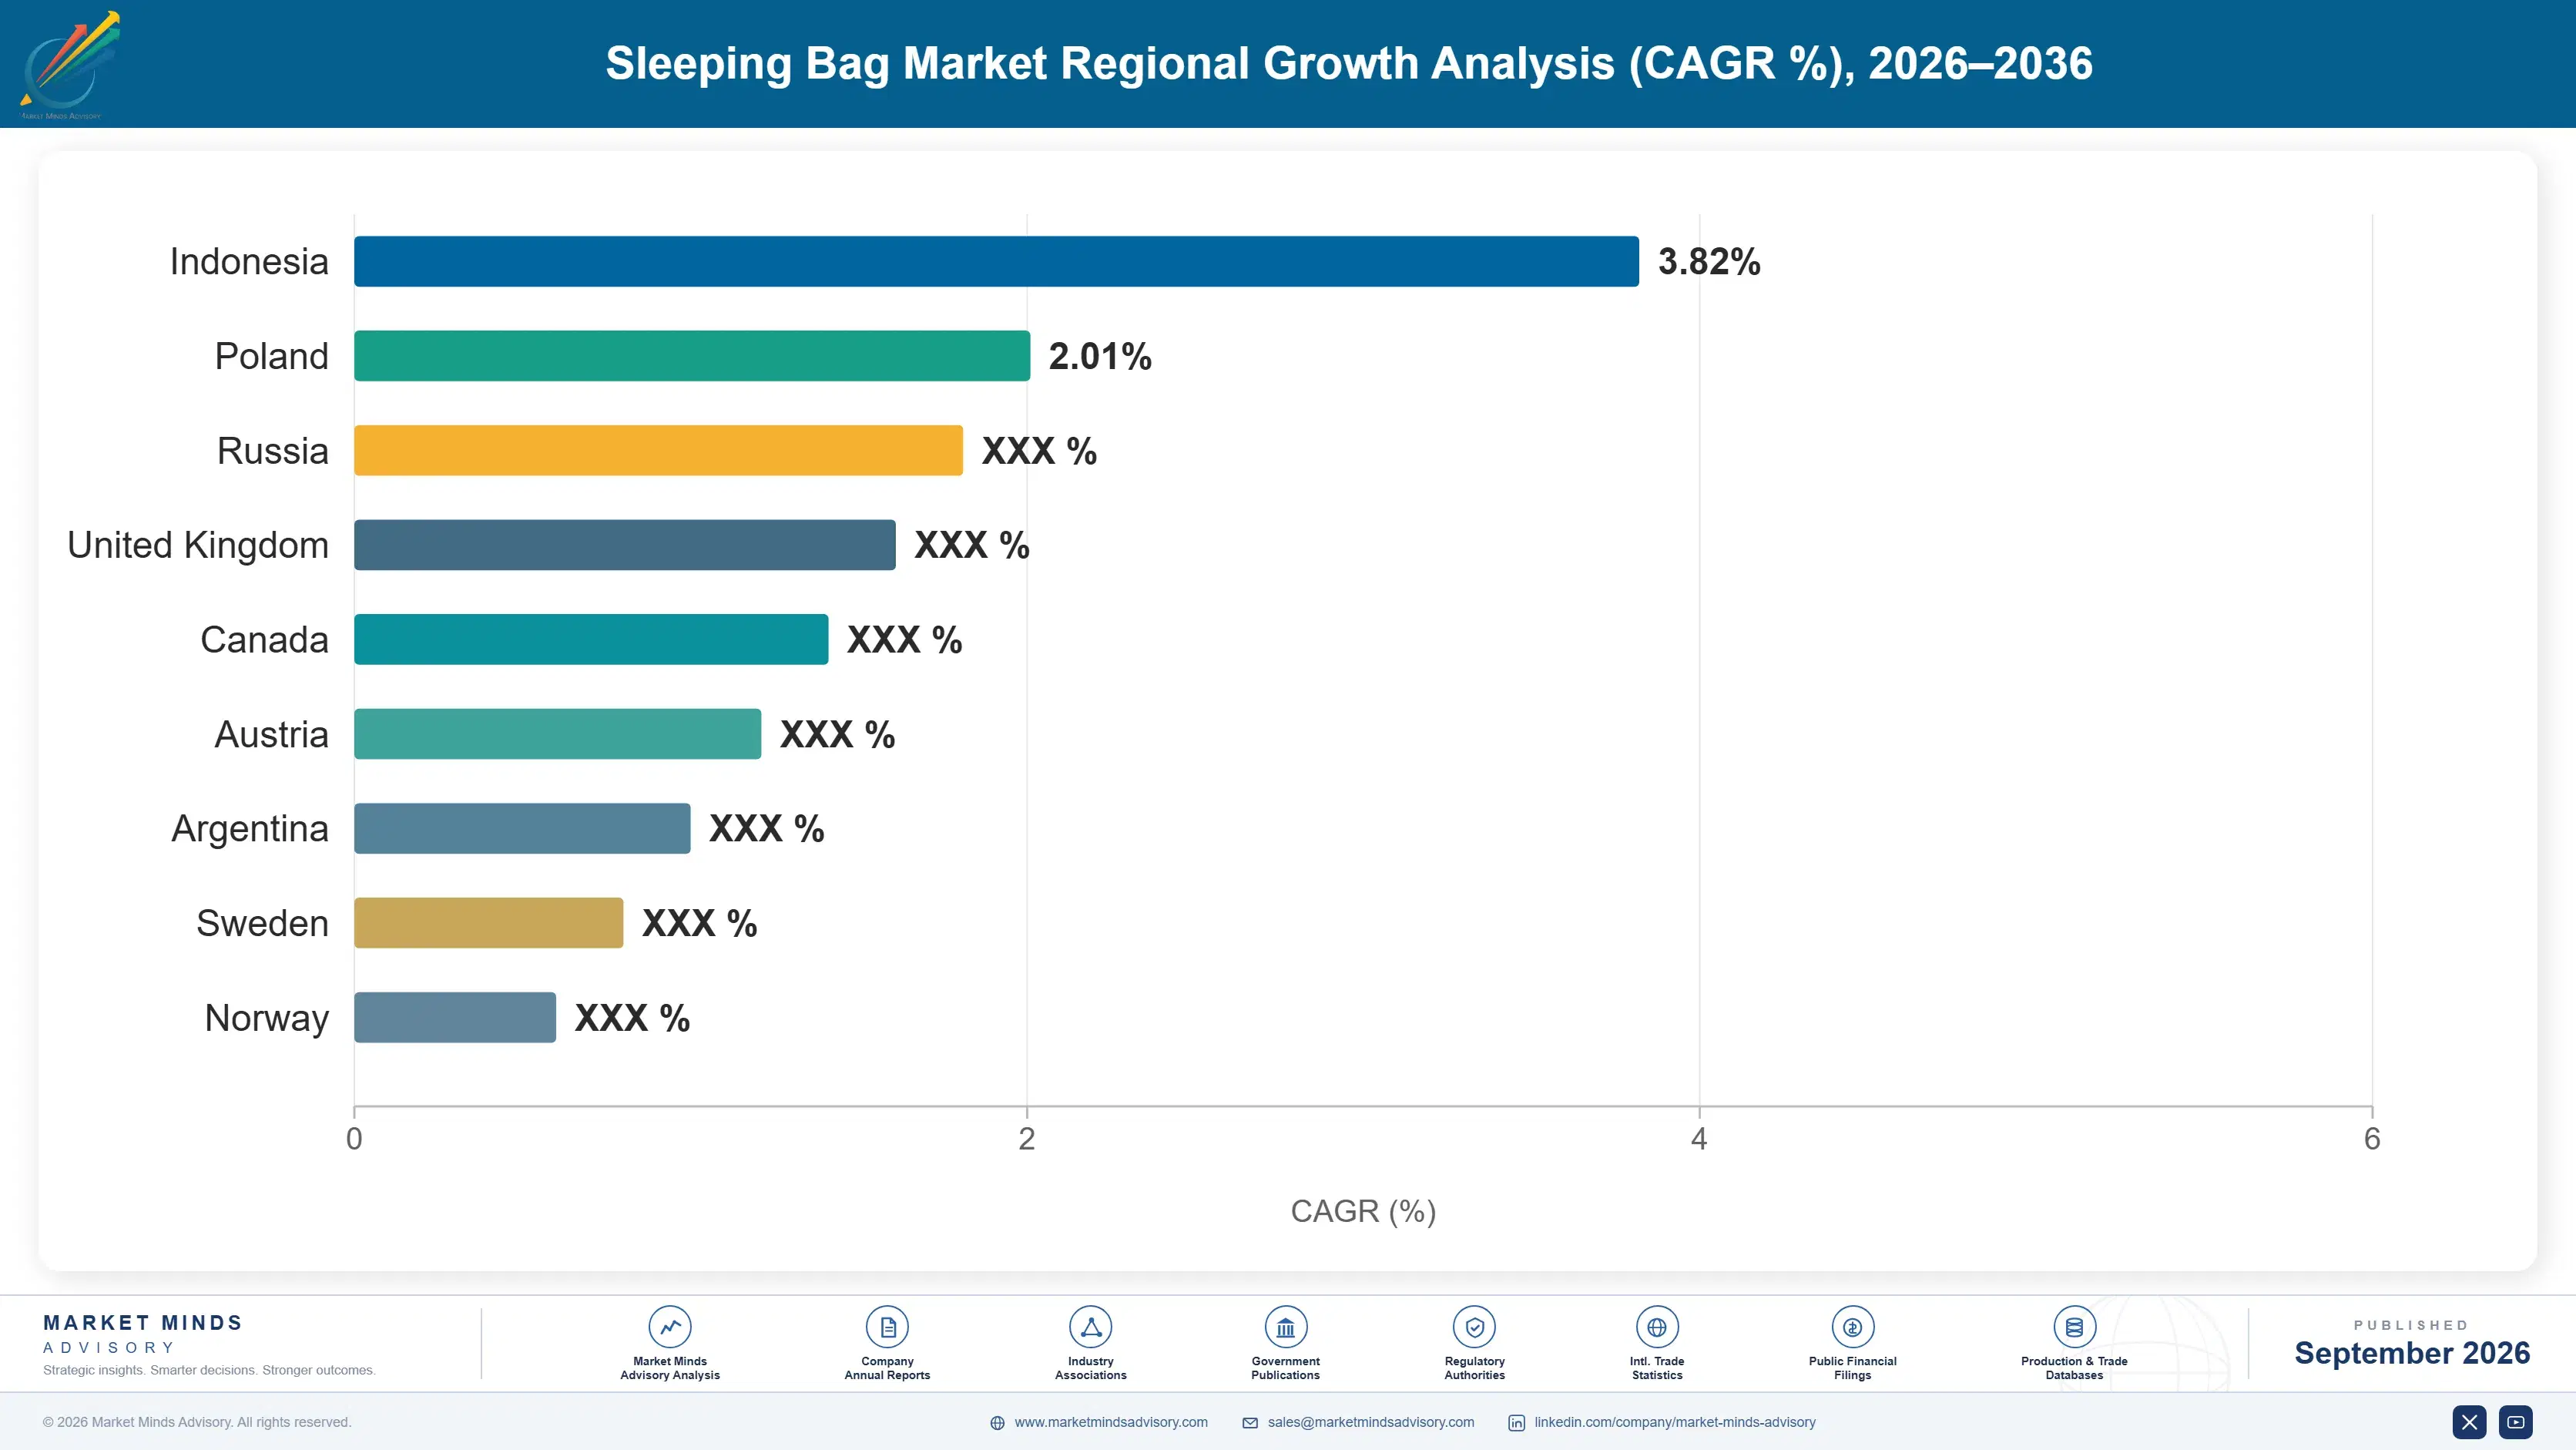
sleeping-bag-market-share-analysis-country-cagr-analysis-1790023977855

Four Moves Worth Making Now

These four address a category where the label misleads the buyer, the main input is a by-product of food production, and the customer does not return for most of a decade. Each has been executed by at least one participant with results that were measured rather than asserted. Two of the four cost nothing beyond a decision to go first.

Lead With Comfort Rating On Every Label

Brands print limit ratings because they read warmer, and buyers interpret them as comfort figures that sit roughly 6 degrees higher. Leading with comfort costs a label revision and appears to sell a colder bag against competitors still printing limit. Participants who made the change report return rates falling by around 34% and review scores improving measurably, because customers who bought the right bag slept warm. The commercial risk lasts only until enough competitors follow. Nothing about the product changes. Only the number on the outside of it does, and the customer ends up with the bag they actually needed.
Market Impact: Cuts product return rates by roughly 34% overall

Contract Down Supply Across A Full Season

High fill-power down is a by-product of meat production and supply cannot respond to demand at all, which makes price shocks arrive without notice. Fill represents about 43% of manufacturing cost, so an unhedged movement lands squarely on margin. Participants contracting supply across a full production season report input cost variance falling roughly 61% against spot purchasing, which matters more than the average price because it lets a brand hold a published retail price. The commitment lands before the selling season generates cash, which is exactly what deters smaller brands from making it.
Market Impact: Cuts input cost variance by roughly 61% overall

Build A Quilt Range Before Competitors Do

Quilts grow at 6.9% and save 15% to 25% of mass at equivalent warmth by removing insulation that compression renders useless anyway. The engineering is straightforward and the manufacturing requires no new capability. Participants who launched quilt ranges report revenue per gram of fill rising roughly 1.7 times against equivalent mummy bags, because the customer pays for warmth rather than for material. The constraint is educating buyers about draught management at the edges. That education cost is real but it is one-time, and the customers who buy quilts research thoroughly before purchasing anyway.
Market Impact: Revenue per gram of fill rises 1.7 times

Recover And Reprocess Down From Returned Product

Down is durable and survives far longer than the shell it sits inside, yet returned and end-of-life bags are almost always discarded whole. Recovery and washing produces usable fill at a fraction of virgin cost while satisfying the traceability requirements that major retail now demands. Participants running recovery programmes report reclaimed down meeting roughly 14% of fill requirement at around 40% of virgin cost, which also insulates them from supply shocks. The obstacle is reverse logistics, which most brands have never built for any purpose at all. Once it exists, it serves warranty and repair as well.
Market Impact: Reclaimed fill meets 14% of total fill requirement

Who Controls the Margin Pool

Concentration is low at 24% held by the top five, measured consistently on wholesale shipment value rather than unit volume, which would overweight rectangular family bags sold in large numbers at low prices. The leader to challenger gap is narrow, and this remains a category where a small brand with genuine technical credibility can hold a defensible position against far larger competitors.
Competition runs on three dimensions currently. Technical credibility decides the premium tier, where buyers research fill power, baffle construction and tested ratings before purchasing. Price decides the family and entry segments, where the product is bought once for occasional use and specification barely registers. Down sourcing capability decides who can supply certified product at scale, and certification is no longer optional in major retail.

Pressure is building from two directions and positions will move on both. Chinese domestic brands are building technical credibility alongside the manufacturing advantage they already hold, and they are starting to export rather than only supply. Direct-to-consumer specialists with quilt-led ranges are taking the weight-conscious end of the market, where the customer researches thoroughly and traditional retail distribution counts for very little.
sleeping-bag-market-share-analysis-company-positioning-matrix-1790023978374

Competitive Moat and Risk Dimensions

VISTA OUTDOOR

Moat: Distribution Breadth And Scale

Outdoor brand portfolio breadth across chain, specialist and online retail places product in front of buyers at a scale specialists cannot approach, and in a category where a customer returns roughly once a decade, being present at the moment of a first purchase matters more than loyalty ever does.
VISTA OUTDOOR

Risk: Entry Tier Price Exposure

Volume weighted toward accessible price points competes directly against Chinese domestic brands whose manufacturing and demand sit in the same country, removing freight and duty from their cost base entirely. Defending that tier on price alone is not a position that improves with time or scale.
AMER SPORTS

Moat: Technical Brand Credibility

Mountaineering and alpine heritage gives credibility on exactly the specifications that premium buyers research before purchasing, and that reputation transfers across a portfolio in a way that marketing spending cannot replicate for a newer entrant at any reasonable cost. It also travels well into adjacent technical categories.
AMER SPORTS

Risk: Down Supply Cost Exposure

A portfolio weighted toward high fill-power down carries the input whose supply cannot respond to demand at all, since the material is a by-product of meat production with fill at roughly 43% of manufacturing cost. Synthetic substitution at the premium end remains commercially difficult to argue.

Players Tracked

Prominent Players

Vista Outdoor
Amer Sports
Oberalp Group
Katadyn Group
Exxel Outdoors

Other Key Players

Western Mountaineering
Feathered Friends
Rab
Mountain Equipment
Sea to Summit
Therm-a-Rest
Nemo Equipment
Big Agnes
Enlightened Equipment
Deuter
Vaude
Mont-bell
Naturehike
Kailas
Snugpak

Recent Developments

MARCH 2025

Naturehike expands technical range into European distribution

The Chinese manufacturer extended its higher specification sleeping bag range into European specialist retail through direct distribution agreements. This was organic commercial expansion through distribution arrangements rather than an acquisition, joint venture or manufacturing partnership of any kind. Existing supply relationships with other brands continued unchanged.
Signal: Chinese brands are exporting technical credibility rather than manufacturing capacity. Cost and credibility are becoming one position.
SEPTEMBER 2024

Rab extends recycled down recovery programme across ranges

The brand widened its reclaimed down programme to cover additional product lines, recovering fill from returned and end-of-life items for reprocessing and reuse. This was an internal sustainability and sourcing initiative with no partnership, acquisition or external certification body arrangement behind it. Virgin down sourcing continues alongside the reclaimed material.
Signal: Recovered fill addresses supply volatility and traceability requirements at the same time. Reverse logistics investment serves warranty and repair simultaneously.
JANUARY 2025

Oberalp Group acquires alpine equipment brand in Europe

The group completed the acquisition of a European alpine equipment manufacturer, adding technical credibility and specialist distribution to its existing portfolio. This was a completed acquisition rather than a merger or joint venture, with the brand retained under separate management. Manufacturing continues at the acquired company's existing facilities.
Signal: Technical reputation is being bought because marketing spending cannot manufacture it. Credibility is bought because it cannot be built quickly.

What Fills The Bag

Fill dominates and the rest is comparatively minor. Insulation runs roughly 43% of manufacturing cost across the category, higher on down-filled product and lower on synthetics. Shell and lining fabrics take about 19%, zips, baffles and hardware around 11%, and cut-and-sew labour a further 17%. Packaging and compression sacks take the remainder. Asian facilities manufacture around 81% of global units.
Down prices rose steeply through 2021 and 2022 on avian influenza outbreaks across major producing regions combined with reduced poultry slaughter volumes, and the USDA documents the flock impacts across its avian influenza reporting for that period. Brands that had not contracted supply faced input inflation they could not pass through mid-season on published retail prices. Several mid-tier ranges were reformulated toward synthetics rather than repriced.

Exposure divides by fill choice rather than by company size. Down-weighted participants carry an input whose supply cannot expand in response to price, because the birds must reach maturity and are raised for meat regardless. Synthetic-weighted participants carry petrochemical exposure instead, which is volatile but forecastable and can be hedged. Brands running both absorbed the 2022 movement considerably better than specialists at either end.
sleeping-bag-market-share-analysis-cost-volatility-analysis-1790023978573

Contract down supply across the full production season

Down supply cannot respond to price because the birds are raised for meat and must reach maturity, which makes availability rather than cost the real exposure. Contracting across a season secures volume and lets a brand hold a published retail price. The commitment lands before the selling season generates any cash, which is what deters smaller brands.

Qualify engineered synthetic alternatives in mid-tier ranges

Engineered synthetics now match mid-grade down on warmth for weight while costing less and pricing on a forecastable market. Qualifying them in mid-tier ranges before a supply shock arrives means substitution is a decision rather than an emergency. Qualification takes a full development season, so it has to begin well ahead of any commercial need.

Recover down from returned and end-of-life product

Down outlasts the shell it sits inside by a wide margin, yet returned bags are almost always discarded whole rather than stripped. Recovery and washing yields usable fill at roughly 40% of virgin cost and satisfies traceability requirements at the same time. The obstacle is reverse logistics, which most brands have never built for anything.

Portfolio Architecture for Margin Defence

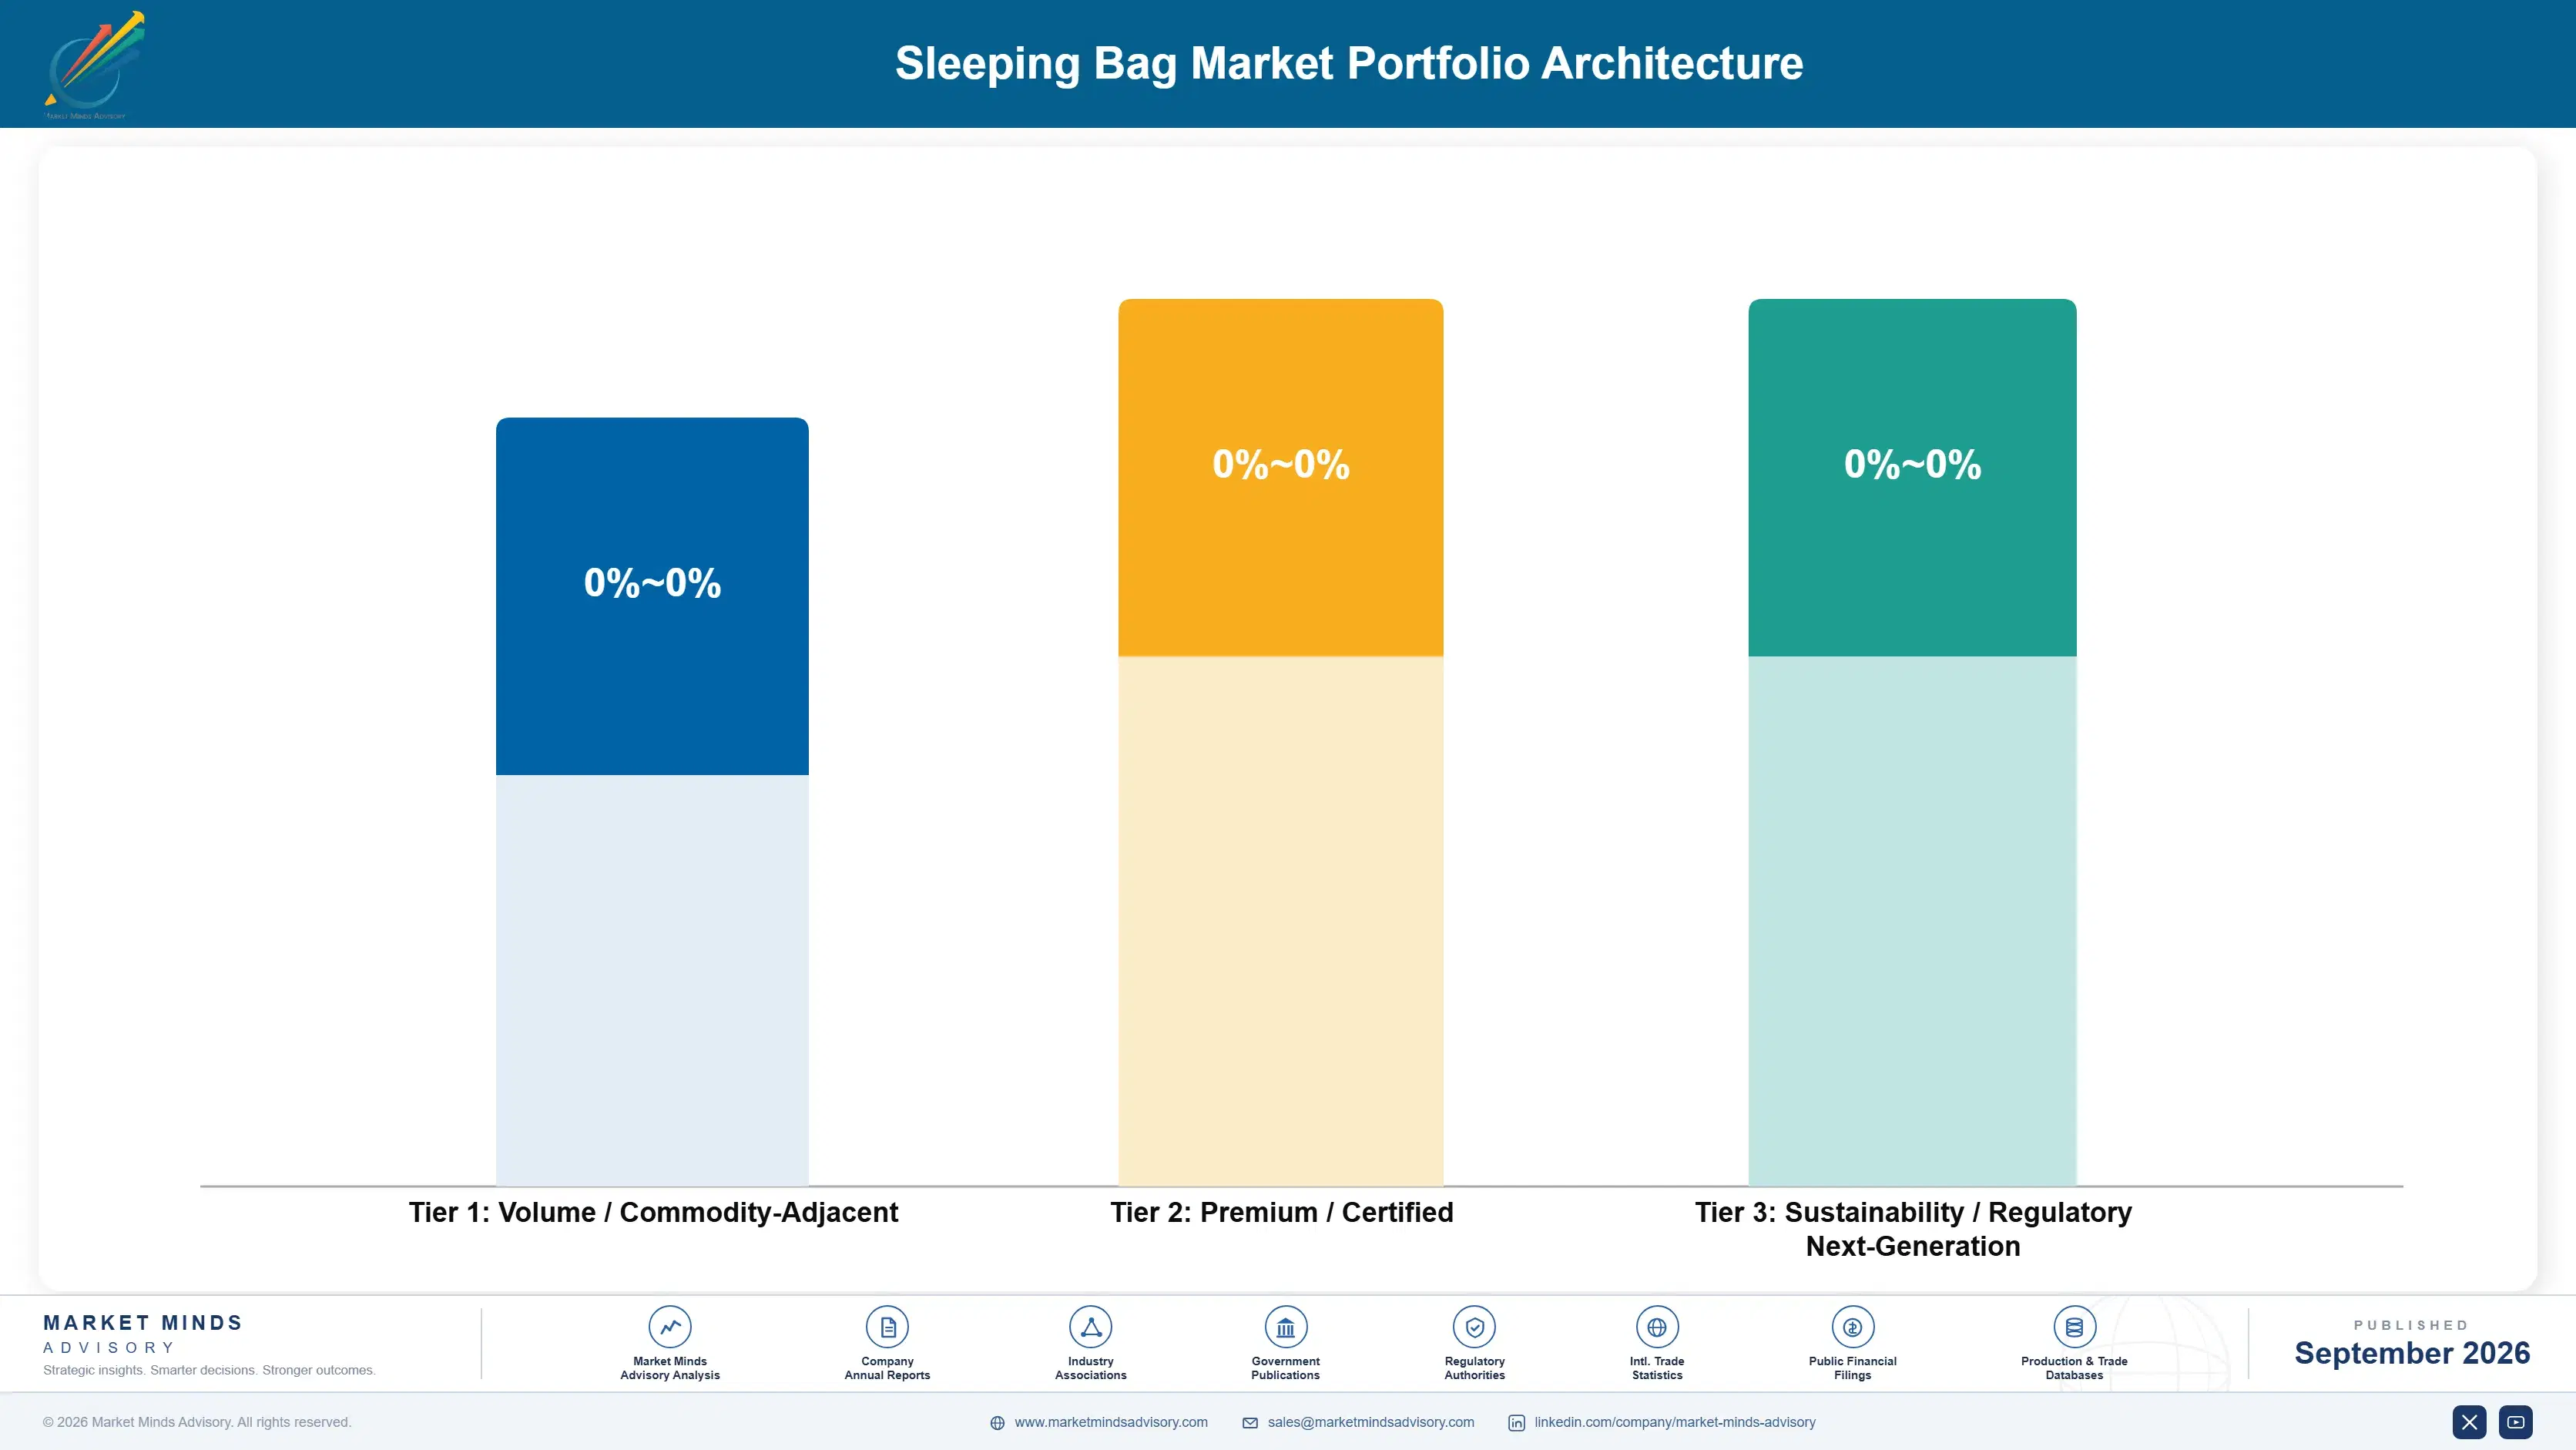
Margin architecture divides by whether the buyer researches before purchasing, which is not what a price list would suggest. Rectangular and family bags sold through mass and chain retail run at gross margins in the low twenties to low thirties, bought once for occasional use by customers for whom specification barely registers and price is essentially the only variable. Nothing on the packaging helps them compare two bags meaningfully.
Synthetic mummy bags and children's ranges hold gross margins in the low thirties to low forties. The spread reflects how differently branded and private label product carry development and marketing cost. This is where most units sit and where Chinese domestic brands compete most directly, since their manufacturing and demand share a country and their cost base reflects it.

The highest-value pool is down-filled expedition bags and quilts, at margins in the mid forties to mid fifties. Those buyers research fill power, baffle construction and tested ratings, and they pay for measurable performance rather than for branding. Family bags fill containers and hold shelf space in chains. They defend nothing against a manufacturer who prices lower. Shelf presence in chains is the argument for keeping it, and it is real.

Volume / Commodity-Adjacent

Rectangular and family bags through mass and chain retail, bought once for occasional use where specification barely registers. The ten point range reflects how differently scale positions absorb fill cost.
Gross Margin: 22 to 32%

Premium / Certified

Synthetic mummy bags and children's ranges. This is where most units sit and where Chinese domestic brands compete most directly, since manufacturing and demand share a country for them. Freight and duty simply do not enter their cost base.
Gross Margin: 32 to 42%

Sustainability / Regulatory / Next-Generation

Down-filled expedition bags and quilts. Buyers research fill power, baffle construction and tested ratings, and they pay for measurable performance rather than for branding or distribution presence. Technical credibility rather than distribution breadth decides who wins here.
Gross Margin: 45 to 55%
sleeping-bag-market-share-analysis-portfolio-architecture-1790023979076

High-value Sub-segments and Strategic Watch-out

Quilts And Open-Back Systems

High value and fastest growth at 6.9%. The physical argument is sound, the manufacturing needs no new capability, and revenue per gram of fill runs well above equivalent mummy bags for the same warmth. Draught management at the edges is the only real obstacle to wider adoption.
Gross Margin: 46 to 55%

Down Expedition Bags

High value and moderate growth. Buyers research specification thoroughly and pay for measurable performance, though the segment carries an input whose supply cannot respond to price at all. Fill runs about 43% of manufacturing cost, and contracted supply is now the difference between holding a price and abandoning one.
Gross Margin: 44 to 52%

Synthetic Mummy Bags

Volume core, growing at 5.3% as engineered insulations close the gap with mid-grade down. Chinese domestic brands compete hardest here, with manufacturing and demand sitting in the same country. Forecastable input pricing is becoming as commercially valuable as the performance parity itself. Down volatility keeps pushing volume here.
Gross Margin: 32 to 40%

Rectangular And Family Bags

Strategic watch-out. Growing slowest at 2.1% and sold on price alone into a use case treating the product as furniture. The fourteen point range reflects how differently branded and private label product price. Volume is genuine and the shelf presence has value, but the position defends nothing.
Gross Margin: 20 to 34%

How Buyers Actually Return

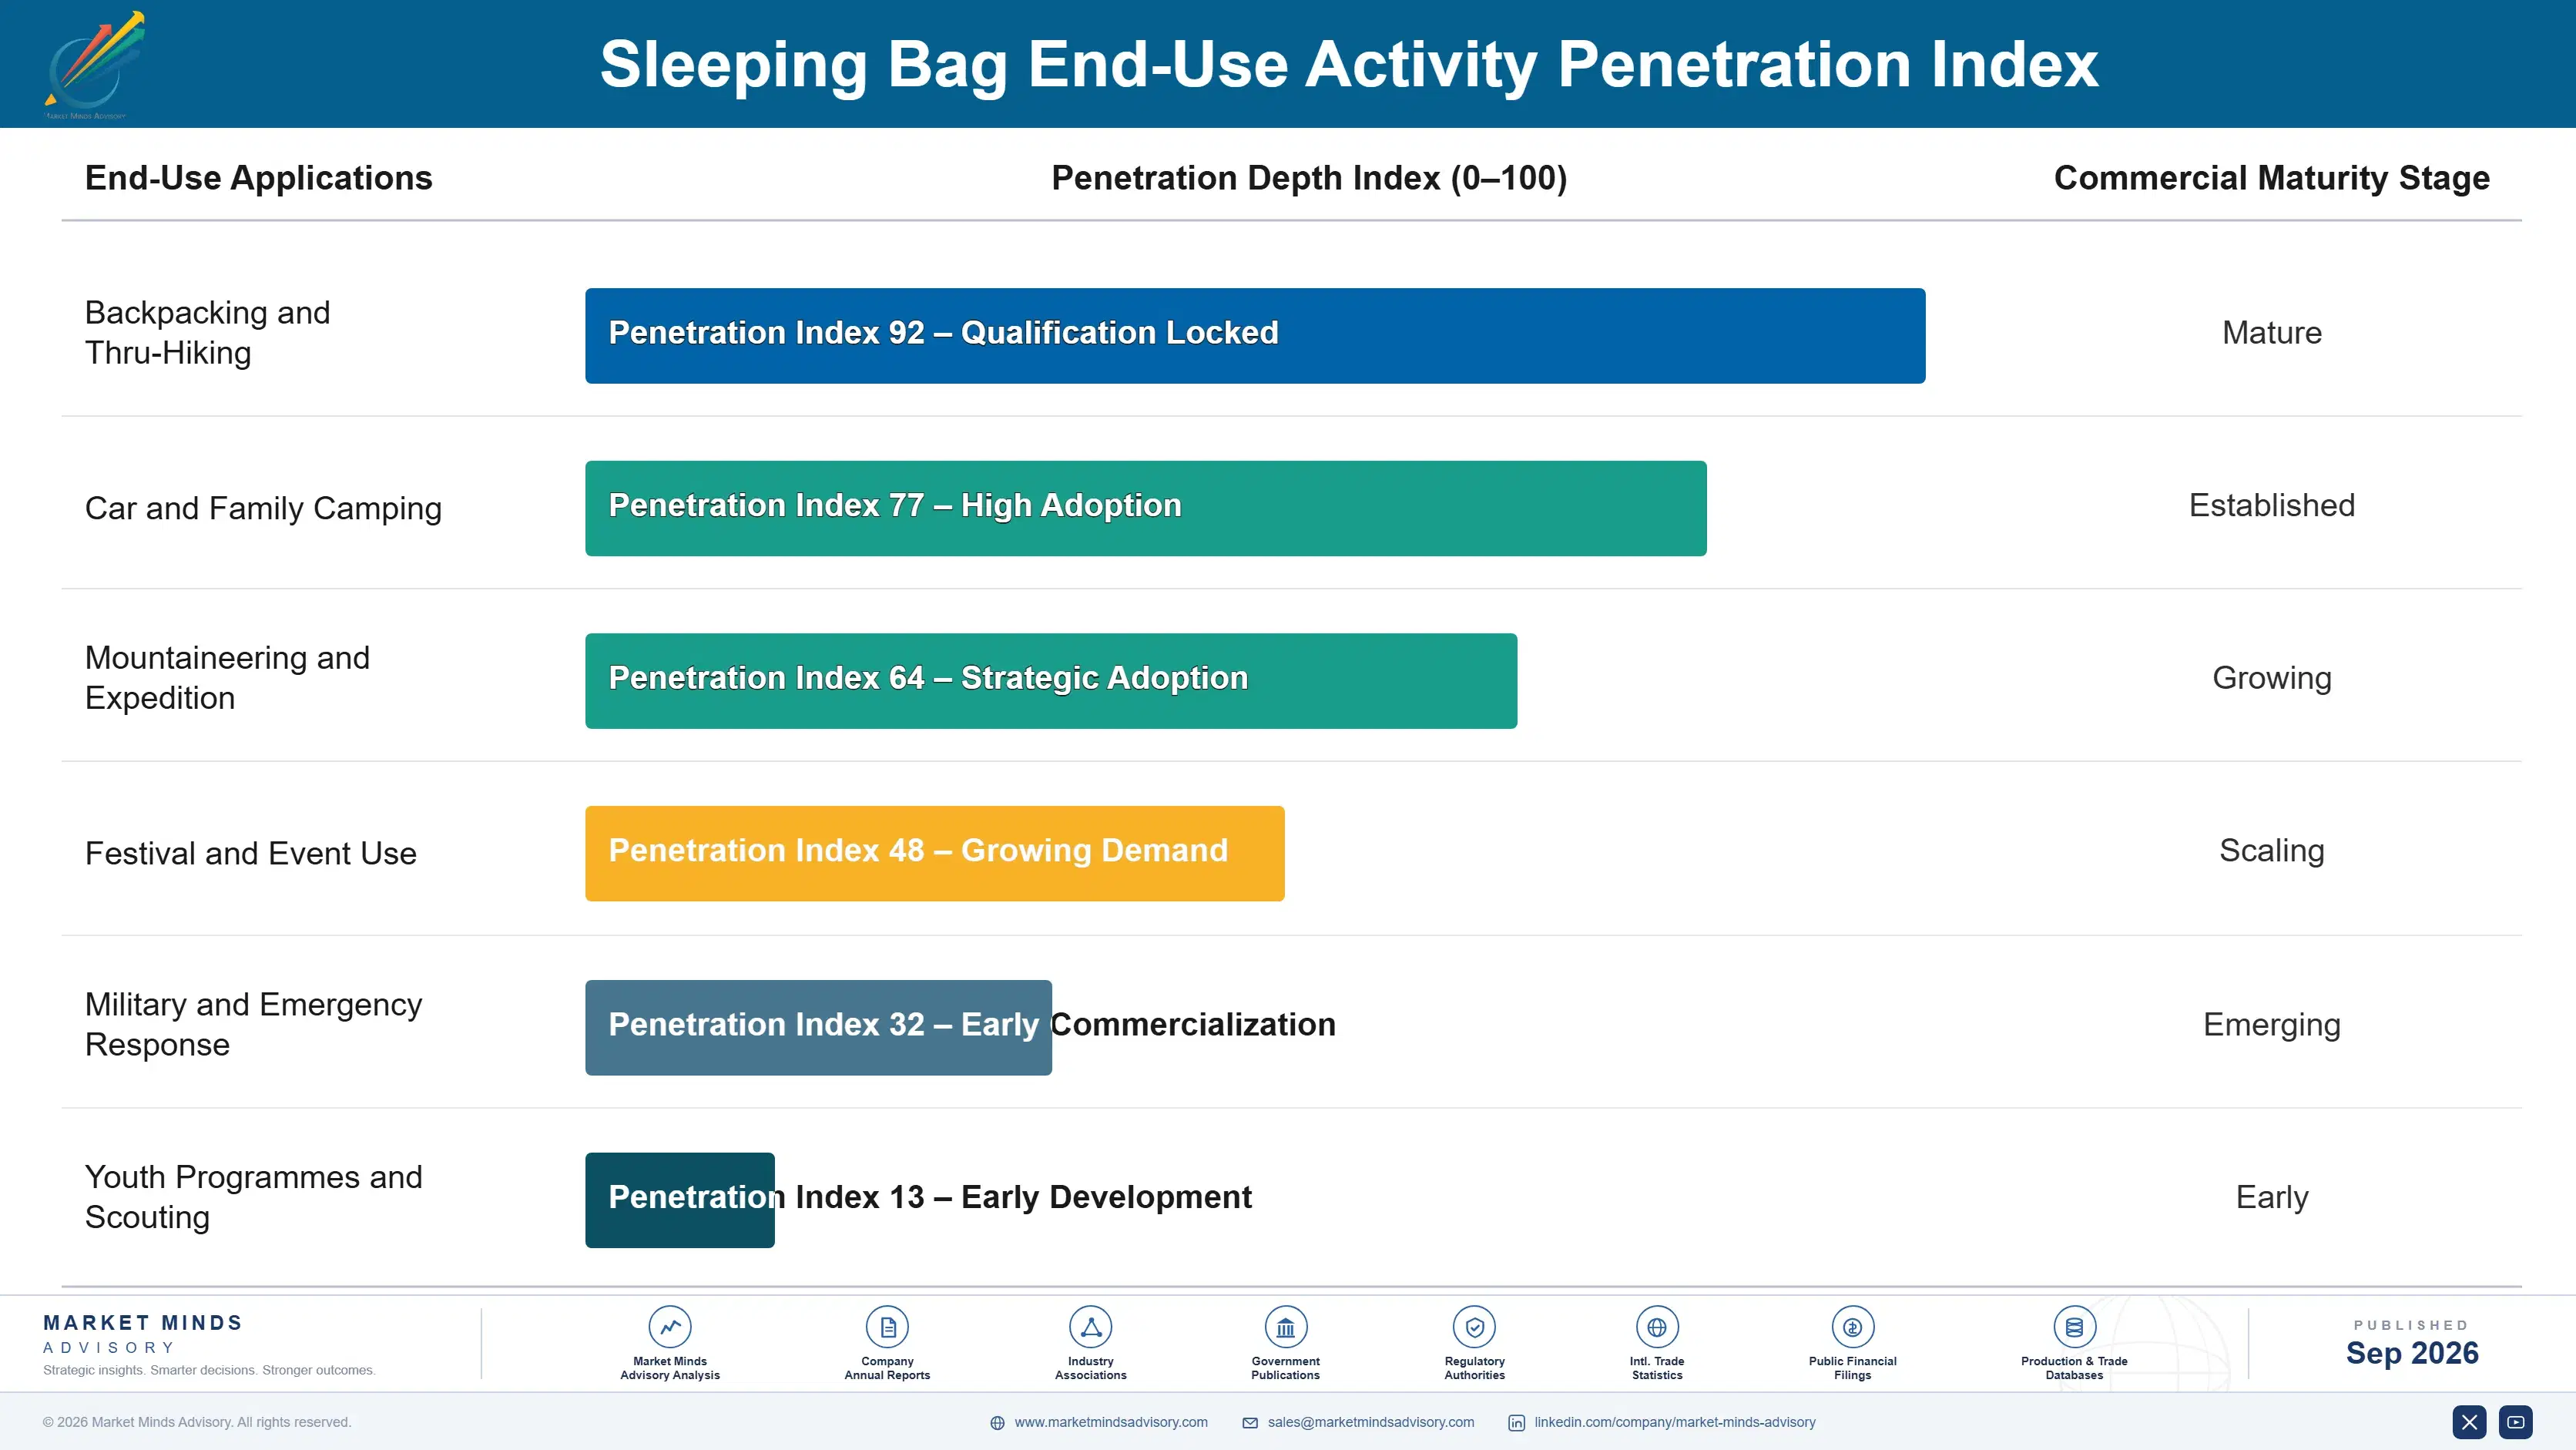
Replacement here runs at roughly nine years, which is long enough that loyalty is almost the wrong concept. A brand that sells a good bag has a customer who will not be in the market again for most of a decade, by which time the range, the technology and often the retailer have changed. The contest is therefore about the first purchase rather than the second.
Stickiness varies sharply by how much the buyer knew when they chose. Customers who researched fill power and tested ratings return to brands that performed as specified, because they have the vocabulary to notice. Customers who bought on price and had a cold night blame camping rather than the bag, and frequently leave the activity entirely. That second group is much larger and the industry has done little about it.

Buyer profiles shifted sharply after 2020 and then shifted back. The participation surge brought in first-time buyers who purchased entry-level product, used it two or three times and stopped, which is why the replacement wave that normally follows a participation increase never materialised. What remains is a more experienced base that researches thoroughly and buys less often, favouring technical credibility over distribution breadth.
sleeping-bag-market-share-analysis-end-use-penetration-index-1790023979567

Where The Advantage Sits

These are among the four positions where our research anticipates prominent divergence between winners and laggards over the coming forecast period. Each is grounded in the demand model, the regulatory perimeter, and the announced capacity pipeline.
01 / RATING DISCLOSURE PRACTICE

Print the number that keeps people warm

Brands print limit ratings because they read warmer, and buyers interpret them as comfort figures sitting roughly 6 degrees higher than the reality of the night. Leading with comfort costs a label revision and temporarily appears to sell a colder bag than competitors still printing limit. Participants who made the change report return rates falling around 34% and review scores improving measurably, because customers who bought the correct bag actually slept warm, and nothing about the product itself had to change at all.
02 / FILL SUPPLY CONTRACTING

Secure down before the birds matter

High fill-power down is a by-product of meat production and supply cannot respond to demand at all, because birds must reach maturity and are raised for food regardless of what brands want. Fill runs about 43% of manufacturing cost, so an unhedged price movement lands squarely on margin mid-season. Participants contracting across a full production season report input cost variance falling roughly 61% against spot purchasing, which lets them hold published retail prices, which matters more than the average price achieved over time.
03 / QUILT RANGE DEVELOPMENT

Stop selling insulation nobody sleeps on

Quilts grow at 6.9% against 4.6% for the market by removing fill that body compression renders thermally useless, saving 15% to 25% of mass at equivalent warmth for the user. The engineering is straightforward and manufacturing requires no capability a bag maker does not already have. Participants who launched quilt ranges report revenue per gram of fill rising roughly 1.7 times against equivalent mummy bags, because customers pay for warmth, rather than for the material that was removed from underneath them.
04 / FILL RECOVERY CAPABILITY

The down outlives the bag around it

Down is durable and routinely outlasts the shell it sits inside, yet returned and end-of-life bags are almost always discarded whole rather than stripped for usable material. Recovery and washing produces fill at roughly 40% of virgin cost while satisfying the traceability requirements major retail now demands. Participants running recovery programmes report reclaimed down meeting around 14% of total fill requirement, which also buffers them against supply shocks, and the reverse logistics built for it serves warranty and repair too.

Engagement Snapshot From the Field

A live engagement with an industry participant carrying material or product regulatory and market exposure ahead of a defining policy shift, showing how our research translates into a defensible multi-year portfolio strategy.
MARKET MINDS ADVISORY · CLIENT ENGAGEMENT SUMMARY
Sleeping Bag Producer Strategic Portfolio Review and Transition Roadmap 2026·Investment Scenario on Sleeping Bag Exposure Evaluation 2025-26
CLIENT PROFILE
A North American outdoor equipment brand with sleeping bag revenue near USD 46 million (client-reported, unverified by MMA), weighted approximately 58% to synthetic mummy bags, 27% to rectangular family product and 15% to down. All packaging displayed limit ratings only. No quilt product existed and down was purchased entirely on spot markets. Contracted supply had been declined on price grounds.
STRATEGIC CHALLENGE
Return rates had risen for three consecutive seasons while sales grew, and management attributed returns to sizing and fit complaints recorded at the point of return. A packaging redesign had been approved on that basis. Nobody had examined what customers actually wrote in return comments or linked returns to the rating displayed.
MMA APPROACH
MMA coded 2,900 return comments by stated reason rather than relying on the checkbox category selected at return. Returns were linked to the rating printed on each product and to the conditions reported. Down purchasing was compared against contracted alternatives, and quilt economics were modelled against equivalent mummy construction. Findings were reconciled against warranty records.
KEY FINDINGS
  1. Coded return comments showed 61% cited being cold rather than fit, against 12% recorded under the cold checkbox, because the return form did not offer a clear temperature option.
  2. Cold-related returns concentrated entirely on products whose limit rating had been printed as though it were a comfort figure across all packaging.
  3. Spot down purchasing had produced input cost variance of 43% across three seasons, against roughly 17% for a contracted alternative that had been declined on price.
  4. Modelled quilt construction delivered equivalent warmth at 22% lower fill weight, with revenue per gram of fill 1.8 times the equivalent mummy bag.
CLIENT PROFILE
A North American outdoor equipment brand with sleeping bag revenue near USD 46 million (client-reported, unverified by MMA), weighted approximately 58% to synthetic mummy bags, 27% to rectangular family product and 15% to down. All packaging displayed limit ratings only. No quilt product existed and down was purchased entirely on spot markets. Contracted supply had been declined on price grounds.
STRATEGIC CHALLENGE
Return rates had risen for three consecutive seasons while sales grew, and management attributed returns to sizing and fit complaints recorded at the point of return. A packaging redesign had been approved on that basis. Nobody had examined what customers actually wrote in return comments or linked returns to the rating displayed.
MMA APPROACH
MMA coded 2,900 return comments by stated reason rather than relying on the checkbox category selected at return. Returns were linked to the rating printed on each product and to the conditions reported. Down purchasing was compared against contracted alternatives, and quilt economics were modelled against equivalent mummy construction. Findings were reconciled against warranty records.
KEY FINDINGS
  1. Coded return comments showed 61% cited being cold rather than fit, against 12% recorded under the cold checkbox, because the return form did not offer a clear temperature option.
  2. Cold-related returns concentrated entirely on products whose limit rating had been printed as though it were a comfort figure across all packaging.
  3. Spot down purchasing had produced input cost variance of 43% across three seasons, against roughly 17% for a contracted alternative that had been declined on price.
  4. Modelled quilt construction delivered equivalent warmth at 22% lower fill weight, with revenue per gram of fill 1.8 times the equivalent mummy bag.
RECOMMENDED STRATEGY
Phase 1: Phase one: cancel the packaging redesign and reprint all labels leading with comfort ratings prominently displayed. Limit figures stay as a secondary line. Phase 2: Phase two: contract down supply across the full season and qualify an engineered synthetic for mid-tier ranges. Qualification begins a full season early. Phase 3: Phase three: launch a quilt range into specialist and direct channels ahead of the next season. Chain distribution is deliberately excluded initially.
OUTCOME
Return rates fell by roughly a third within two seasons once comfort ratings were displayed, and review scores improved across the affected ranges (client-reported, unverified by MMA). Contracted down cut input variance to 15%, and the quilt range reached 9% of revenue in its first year at the highest margin in the portfolio.

Frequently Asked Questions

Foundational context covering the market sizes, CAGR, scope, country, region and competition that inform every finding below. This section is provided to cover basics and most often pre-purchase conversations, answered from the MMA Primary Research Dataset.

What is the current size of the Sleeping Bag Market?

The market was valued at USD 2.9 billion in 2025, rising to USD 3.1 billion in 2026. Sizing is at wholesale shipment value across six construction types.

How large will the Sleeping Bag Market be by 2036?

MMA forecasts USD 4.9 billion by 2036, an increase of USD 1.8 billion over the 2026 base. That represents expansion of 1.58 times across the forecast period.

What is the CAGR for the Sleeping Bag Market 2026 to 2036?

The base case CAGR is 4.6%, with a bull case of 5.8% and a bear case of 3.4%. Historical growth between 2020 and 2025 ran at 3.4%.

Which segment is growing fastest?

Quilts and open-back systems grow at 6.9%, half again the market rate, by removing insulation that body compression renders useless. Synthetic mummy bags follow at 5.3%.

Who are the major companies in the Sleeping Bag Market?

Vista Outdoor, Amer Sports, Oberalp Group, Katadyn Group and Exxel Outdoors lead on shipment value, holding a combined 24%. Concentration is unusually low for a consumer category.

Which country is growing fastest?

China grows fastest at 7.8%, combining rapidly rising urban camping participation with the domestic manufacturing base that already supplies most of the world. Domestic brands price well below imported equivalents there.

Report Segmentation Architecture

The full report scope spans multiple orthogonal segmentation dimensions, with cross-tabulated demand data provided for each dimension pair. Coverage extends further to regional breakdowns, trend trajectories, and the competitive detail needed to support segment-level decision-making.

By Construction Type

  • Down-Filled Mummy Bags
  • Synthetic Mummy Bags
  • Quilts and Open-Back Systems
  • Rectangular and Family Bags
  • Children's and Youth Bags
  • Military and Institutional Bags

By End-Use Activity

  • Backpacking and Thru-Hiking
  • Car and Family Camping
  • Mountaineering and Expedition
  • Festival and Event Use
  • Military and Emergency Response
  • Youth Programmes and Scouting

By Commercial Dimension

  • Specialist Outdoor Retail
  • Large Outdoor Chain Retail
  • Brand Direct and Online
  • Mass and General Merchandise
  • Government and Institutional Procurement
  • Rental and Programme Supply

By Region

  • North America
  • East Asia
  • Western Europe
  • South Asia and Pacific
  • Latin America
  • Eastern Europe
  • Middle East and Africa

Scope, Methodology, and Coverage

Every figure in this report is reproducible from documented input assumptions. The scope below maps the historical period, the forecast horizon, the segmentation dimensions, and the countries covered, alongside the underlying primary and qualitative methodology.
Historical Period
2020 to 2025
Forecast Period
2026 to 2036
Base Year
2025 (USD billions; MMA Primary Research Dataset, September 2026)
Market Definition
This market covers sleeping bags and closely related sleep systems for outdoor, expedition and institutional use, spanning down-filled mummy bags, synthetic mummy bags, quilts and open-back systems, rectangular and family bags, children's and youth bags, and military and institutional bags. Sizing is at wholesale shipment value across specialist, chain, direct, mass, institutional procurement and rental channels. Sleeping pads and mattresses, bivvy bags, tents, camp bedding and indoor slumber bags are excluded throughout this report.
Quantitative Units
USD billions at wholesale shipment value; volume in millions of units shipped; insulation in fill power and grams per bag.
Segmentation Dimensions
Construction type, end-use activity, commercial dimension, and geographic region.
Regions Covered
North America, East Asia, Western Europe, South Asia and Pacific, Latin America, Eastern Europe, Middle East and Africa
Countries Covered
United States, China, Germany, India, Japan, Chile
Key Companies Profiled
Vista Outdoor, Amer Sports, Oberalp Group, Katadyn Group, Exxel Outdoors, Western Mountaineering, Feathered Friends, Rab, Mountain Equipment, Sea to Summit, Therm-a-Rest, Nemo Equipment, Big Agnes, Enlightened Equipment, Deuter, Vaude, Mont-bell, Naturehike, Kailas, Snugpak
Quantitative Methodology
Primary survey, n=3,800 respondents, Q4 2025, six countries; demand-side model with trade association cross-validation
Qualitative Methodology
47 expert interviews, Q4 2025; applied to validate demand model assumptions, identify emerging dynamics, and assess competitive positioning
Report Format
PDF and XLSX data workbook (Word format preview document)
Publisher
Market Minds Advisory
Report Code
MMA-2026-CON-799
Published
September 2026
Contact
sales@marketmindsadvisory.com | www.marketmindsadvisory.com

Purchase the full Sleeping Bag Market Report (2026 to 2036).

The full report sizes the sleeping bag market across six construction types, six end-use activities and six commercial dimensions for all seven global regions through 2036. It analyses return reasons through coded customer comments rather than checkbox categories, linking cold-related returns to the temperature rating displayed on packaging. Down supply is traced from poultry production regions through to fill availability and price variance. Quilt and mummy construction economics are compared on revenue per gram of fill. Competitive assessment covers 20 participants on a consistent shipment value basis.
Return reasons coded from comments not checkbox categories
Down supply traced from poultry production to fill
Quilt and mummy economics compared per gram
Contracted and spot fill purchasing variance measured
Six construction types sized through 2036
Twenty participants assessed on wholesale shipment value

Built For The People Who Decide

From boardroom strategy to bench-side execution, this report is read cover-to-cover by leaders shaping the next decade of their industry, turning demand scenarios, market dynamics and valuation benchmarks into decisions.
CXOs/ Presidents/ VPs/ Managers
M&A and Corporate Development
Strategy Teams and R&D Heads
Procurement and Product Directors
Regulatory and Compliance Leaders
Investor Relations and Equity Analysts