Market Minds Advisory
Skincare Market

Skincare Market: Shoppers Learned To Read The Ingredient List

A commercial reading of skin care, where consumers now compare named actives at stated concentrations across price points, and a century-old model built on brand promise and benefit language stopped working.

Lead Analyst

Alice Ballenger

Published

September 2026

Make Smarter Decisions with Customized Research Insights

Request a free sample report and evaluate market opportunities, growth trends, and competitive dynamics relevant to your business needs.

2025 MARKET VALUE$178.6BMarket Size 2025
2036 FORECAST VALUE$346.1BBase Case , 2026 to 2036
CAGR 2026 TO 20366.2 %Bull 7.4% / Bear 5.0%
INCREMENTAL OPPORTUNITY$156.5BNet 10- year value creation
EXPANSION MULTIPLE1.83x2036 value over 2026 base
Strategic Levers
M&A Pipeline
Regional Outlook
Country Rankings
Competitive Intelligence
Segmental Deep-dive
Call-Us : 91 93563 13602

Executive Snapshot and Market Trajectory

For a century skincare sold benefit language and a brand promise. Then shoppers started reading the ingredient list, comparing percentages, and asking why a cream costing two hundred dollars contained the same actives as one costing twelve. Marketing alone stopped being enough.
The market stands at USD 178.6 billion in 2025 and reaches USD 346.14 billion by 2036 at a 6.2% CAGR. Serums and active treatments grow fastest at 10.6%, about 1.71 times the overall rate, as consumers buy named actives at stated concentrations rather than brand narratives. East Asia holds 30% of value on Korean and Japanese routines that set global trends, while India posts the quickest national growth at 11.8%. Ingredient lists now drive that.
Fragmentation is real despite the scale of the largest groups, with the top five holding roughly 33% of skincare revenue and independent brands taking share every year through social media rather than shelf space. Two forces pull against each other. Ingredient literacy rewards formulations that can be verified, while claims regulation and ingredient scrutiny keep narrowing what any brand may actually say. Both pressures reward the same discipline.
Market Definition
The skincare market covers topical formulated products applied to skin for cleansing, hydration, protection, or treatment, spanning facial moisturisers and creams, cleansers and face wash, serums and active treatments, sun care and photoprotection, and body and hand care. Colour cosmetics, hair care, oral care, fragrance, prescription dermatological medicines, injectable and energy-based aesthetic procedures, cosmetic ingredients sold to formulators, and professional treatment services are excluded.
Base Year Value
$178.6B in 2025 (MMA Primary Research Dataset, August 2026)
Forecast Period
2026 to 2036, eleven discrete annual values
CAGR
6.2% base case. Bull 7.4%. Bear 5.0%.
Fastest Growth Segment
Serums and Active Treatments: 10.6% CAGR
Fastest Growth Country
India: 11.8% CAGR
Fastest Growth Region
South Asia and Pacific: 8.4% CAGR
Largest Region
East Asia: 30% of 2025 global value
Market Leaders
L'Oreal, Unilever, Estee Lauder Companies, Beiersdorf, Shiseido. Source: MMA Analysis based on company annual reports.
Primary Survey
n=3,800 procurement and R&D decision-makers, Q4 2025, six countries
Methodology
Demand-side build-up, cross-validated against public data, 47 expert interviews

Skincare Market Forecast Scenarios

skincare-market-size-forecast-scenario-1787332080302
Growth from 2020 to 2025 compounded near 5.1%, and channel disruption rather than demand explained the pattern. Store closures collapsed prestige skincare through 2020 while mass and online held up, and travel retail took years to recover. What genuinely changed was information: dermatologists reaching millions directly through social platforms taught a generation to read an ingredient declaration and distrust unverifiable claims.
Three mechanisms carry the base case to 6.2%. First, active ingredient purchasing, where consumers select on named molecules at stated concentrations and reward formulations that can be checked. Second, sun care expansion beyond holiday use into daily photoprotection, driven by dermatologist advocacy rather than by any seasonal pattern. Third, emerging market premiumisation, as rising incomes convert first-time buyers into routine users across South Asia, Southeast Asia, and Latin America. None depends on advertising.
The bull case at 7.4% assumes daily photoprotection adoption spreads faster and active-led purchasing continues pulling consumers up the price ladder. The bear case at 5.0% assumes claims enforcement removes the language premium brands depend on, ingredient restrictions force reformulation across sun care and preservatives, and value-tier competitors match active concentrations closely enough that premium pricing becomes genuinely difficult to defend anywhere.

When The Label Became The Marketing

Demand rests on three foundations. Routine formation provides the annuity, since a product that works becomes a repeat purchase for years and a product that disappoints is abandoned after one jar. Ingredient literacy provides the growth, because consumers who compare named actives at stated concentrations move toward serums and treatments rather than staying with moisturisers. And regulation sets the boundary, since what may be claimed has narrowed considerably.
MARKET CONCENTRATIONCR5: 33%Fragmented by independent brands despite large group scale
INGREDIENT-LED PURCHASE SHAREAbout 44%Shoppers selecting on named actives rather than brand
GROSS MARGIN RANGE62% to 82%Formulation cost against retail price across the category
DEVELOPMENT CYCLE9 to 24 monthsPeriod from creative brief to shelf for a launch
CLAIM SUBSTANTIATION COSTUSD 40 to 300 thousandTesting behind a single genuinely defensible efficacy claim
REPEAT PURCHASE RATEAbout 38%Buyers returning to the same product after one jar
Commercially this is a business with extraordinary gross margin and no cost defensibility. Formulation runs 18% to 38% of retail price, which leaves 62% to 82% for marketing, distribution, and profit, and none of that gap comes from anything a competitor cannot replicate. What defends price is claim substantiation, dermatologist endorsement, and repeat purchase near 38%, which is a brutal verdict on how many products actually work.
The next decade turns on whether claims can be substantiated. Testing a single defensible efficacy claim costs USD 40 to 300 thousand, which independent brands frequently cannot fund and large groups treat as routine. Serums at 10.6% growth are where verification matters most because the active is the product. Sun care meanwhile faces filter restrictions that force reformulation on schedules nobody controls.
"The industry spent decades teaching consumers that skincare was aspirational, and then a dermatologist with a phone taught them it was chemistry. Every brand still selling a feeling rather than a percentage is competing in a market that has moved on."
Director, Beauty and Personal Care Formulations Practice · MMA Consumer Formulat

Market Trends

Ingredient Literacy Rewrote How Skincare Gets Chosen

Dermatologists and formulation chemists reaching audiences directly through social platforms taught a generation to read an ingredient declaration, compare concentrations, and treat unverifiable benefit language as a warning sign. Roughly 44% of shoppers now select on named actives rather than on brand. That transfers pricing power toward whoever can substantiate a claim and away from whoever spent most on advertising, which inverts a century of category economics. Value-tier brands publishing concentrations have taken prestige share simply by being checkable. Publishing a concentration costs nothing at all and answers almost every objection.
Market Impact: Repeat purchase reaches 38%
Sun Care Moves From Seasonal To Daily Use

Photoprotection was a holiday purchase for decades and is becoming a daily step, driven by dermatologist advocacy on cumulative ultraviolet damage rather than by any seasonal marketing. That changes the commercial shape entirely, since daily use means repeat purchase through the year instead of one bottle each summer. Cosmetic acceptability decides adoption, because a product that leaves a white cast or a heavy finish gets abandoned regardless of its protection factor. Filter restrictions are simultaneously forcing reformulation across the segment. Texture rather than protection factor decides whether the daily habit survives.
Market Impact: Routines add 3 products each

Market Opportunities and Growth Drivers

Routine Formation Creates Genuine Repeat Purchase

A skincare product that visibly works becomes part of a daily routine and gets repurchased for years, which makes each successful launch an annuity rather than a transaction. Repeat purchase across the category sits near 38%, so most products fail that test and the ones that pass carry the whole business. Routine also expands, since a consumer who adds a serum rarely removes the moisturiser underneath it. That layering behaviour is why category value grows faster than the number of buyers does. Nothing in the category compounds like a held routine.
Market Impact: Substantiation costs up to 300 thou

Emerging Market Incomes Convert Trial Into Routine

Rising disposable income across South Asia, Southeast Asia, and Latin America moves consumers from occasional single-product use into multi-step routines, which multiplies spend per buyer rather than simply adding buyers. Local brands understand climate, skin tone, and price points considerably better than imported ranges do, and they have taken the early share accordingly. Distribution through pharmacy, modern retail, and direct online all expand simultaneously. This is the largest source of volume growth in the category and it depends on income rather than on any trend. Income rather than fashion drives all of it.
Market Impact: Reviews cover 6 named filters

Market Restraints and Challenges

Claims Enforcement Narrows What Any Brand May Say

Advertising authorities and cosmetic regulators have moved from tolerating benefit language to requiring substantiation, and a defensible efficacy claim costs USD 40 to 300 thousand in clinical and instrumental testing per claim. The root cause is that cosmetic products may not make medicinal claims, and much of the category's traditional language sat close to that line. Commercially this removes the cheapest form of differentiation. Brands mitigate through funded substantiation programmes, consumer perception testing, and shifting language toward ingredient facts that need no claim at all. The cheapest differentiation is simply gone.
Market Impact: About 44% buy on actives

Ultraviolet Filter Restrictions Force Sun Care Reformulation

Several organic ultraviolet filters face restriction or review over reef toxicity and endocrine concerns, and the mineral alternatives available deliver worse cosmetic acceptability at equivalent protection. The root cause is that the filters delivering high protection with a light finish are precisely the ones under scrutiny. Commercially this forces reformulation across a growing segment on timetables regulators set. Participants mitigate through new filter development where regulation permits it, hybrid organic and mineral systems, and formulation work aimed squarely at texture rather than protection. Regulators rather than brands now set the timetable.
Market Impact: Sun care grows at 8.4%
4 additional market trends, 3 additional growth drivers, and 2 additional restraints and challenges are covered in the full report. Contact sales@marketmindsadvisory.com to access the complete intelligence.

Segment CAGR and Growth Architecture

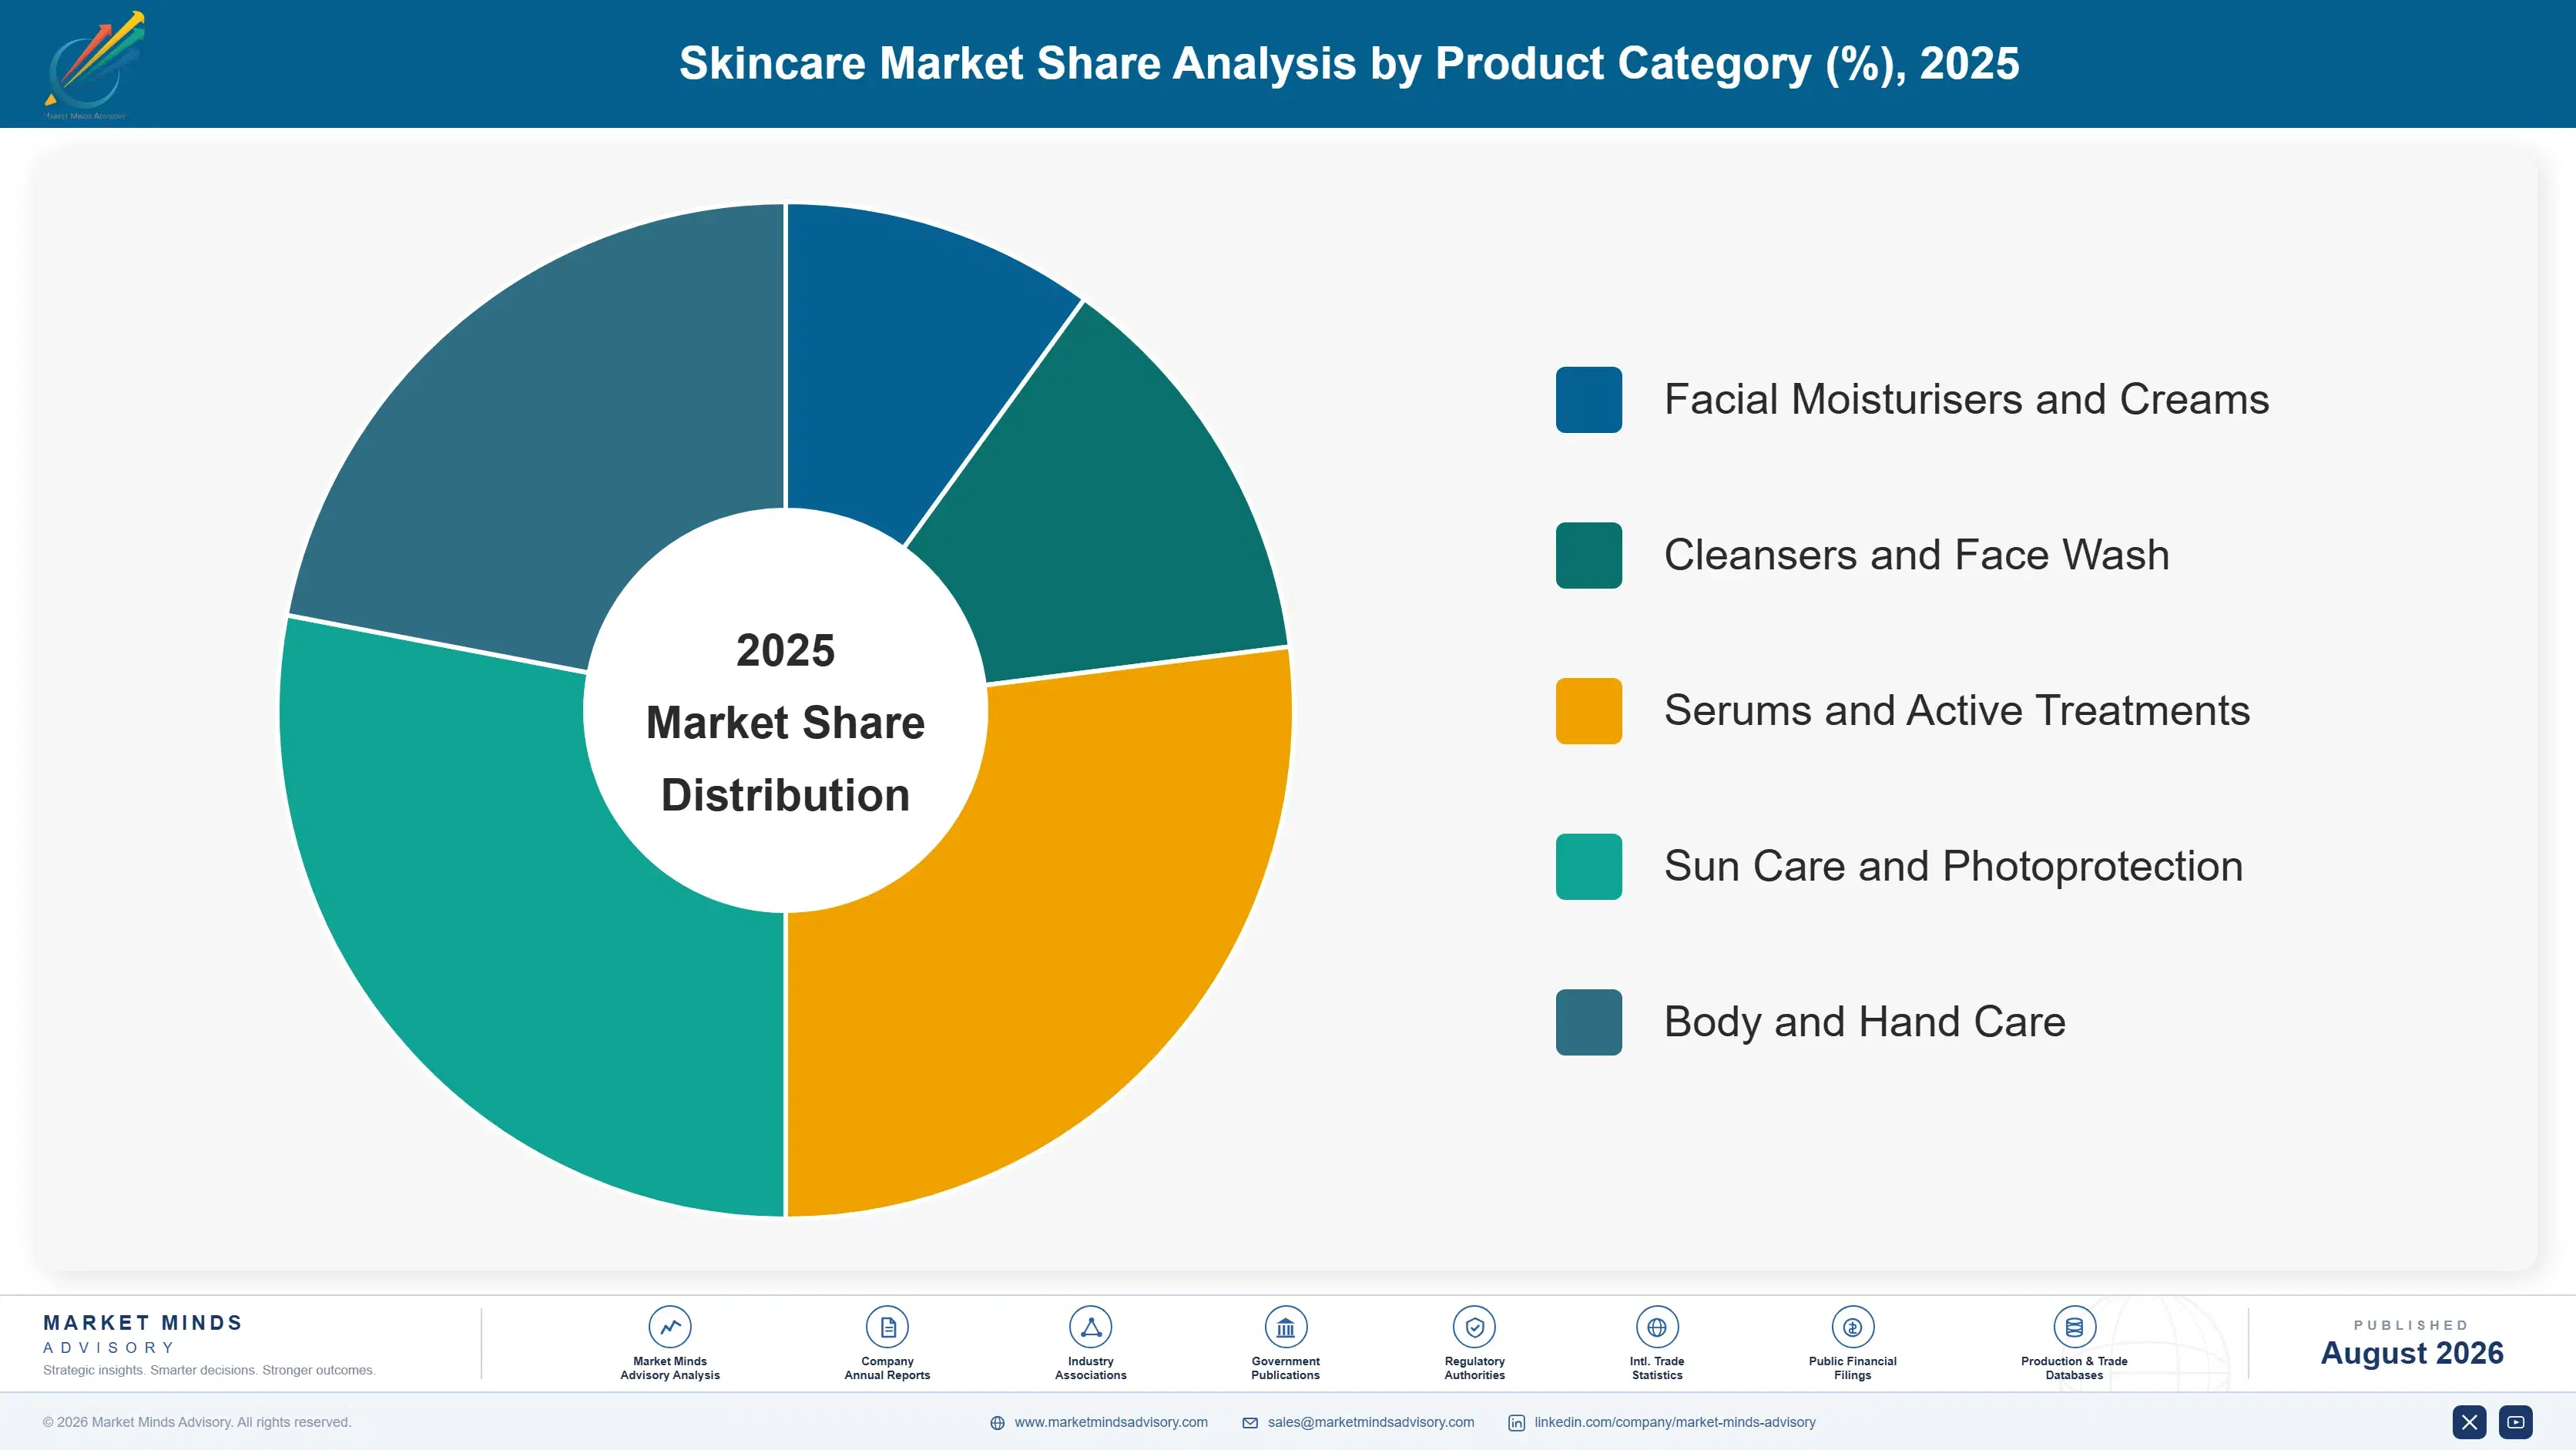
Segmentation follows product category, a single classification describing the function the formulation performs on skin. Each category carries its own formulation complexity, active content, claim exposure, and repeat purchase behaviour, so commercial economics track the product type rather than the consumer buying it. End-use channel and price tier appear separately within the framework as their own distinct dimensions.
skincare-market-market-share-analysis-1787332080857

Serums and Active Treatments

Serums and active treatments grow fastest at 10.6%, about 1.71 times the overall 6.2% rate, and ingredient literacy rather than any formulation breakthrough explains it. When a consumer buys retinol, niacinamide, vitamin C, or an exfoliating acid at a stated concentration, the active is the product and the brand is a wrapper around it, which is exactly why value-tier entrants have taken prestige share here. Claim substantiation matters most in this category because the benefit is specific enough to test. Stability and irritation management are the genuine formulation difficulties, and they separate competent products from the rest quickly. Consumers who can check a formulation will go ahead and check it every time.
CAGR 10.6%

Sun Care and Photoprotection

Sun care and photoprotection grow at 8.4%, the second-fastest category, as daily use replaces seasonal purchase under sustained dermatologist advocacy on cumulative damage. Daily application converts one bottle a summer into repeat purchase through the year, which changes the commercial shape of the segment completely. Cosmetic acceptability decides adoption rather than protection factor, since a product leaving a white cast or heavy finish is abandoned whatever the label says. Organic filter restrictions over reef and endocrine concerns are forcing reformulation across the segment on regulatory rather than commercial timetables. Repeat purchase through the whole year rather than one bottle each summer is the real commercial prize in this segment now.
CAGR 8.4%
Full segment breakdown across 5 segments available in the complete report.

Regional Architecture and Country Demand Map

Routine complexity and income together set this distribution rather than population alone. East Asia leads on multi-step routines that set global trends, while South Asia and Pacific grows quickest as rising incomes convert occasional buyers into daily routine users. Checkability rather than advertising now decides share.

North America

North America holds 25% of value, and ingredient literacy has moved further here than anywhere outside Korea. Dermatologists with very large social audiences reshaped how the category is chosen, which handed share to value-tier brands publishing concentrations and cost prestige brands the language premium they had relied on for decades. Advertising enforcement on efficacy claims is genuinely active and several brands have been required to withdraw language. Retail runs through mass, pharmacy, specialist beauty, and direct online in roughly equal measure. Growth of 5.6% reflects active-led premiumisation against a mature buyer base that is not expanding. The language premium that prestige brands relied on for decades has now largely gone here.
Share: 25% | CAGR: 5.6% (2026 to 2036)

Western Europe

Regulation shapes this market more than consumer trend does. Western Europe holds 22% of value, with cosmetic regulation requiring safety assessment, ingredient restriction lists that grow at each review, and claims substantiation rules that are enforced rather than assumed. Pharmacy dermocosmetic brands hold a position here that barely exists elsewhere, since a pharmacist recommendation carries genuine authority. Sun care filter restrictions bite hardest in this region. Growth of 4.8% is the slowest of the seven regions, reflecting a mature category where volume is flat and value grows only through mix. Substantiation is assumed rather than optional here, which advantages the groups able to fund it properly and squeezes everybody else.
Share: 22% | CAGR: 4.8% (2026 to 2036)
Regional intelligence for 5 additional markets available in the complete report: East Asia, South Asia and Pacific, Latin America, Middle East and Africa, Eastern Europe. Contact sales@marketmindsadvisory.com.
skincare-market-country-cagr-analysis-1787332081389

Where Skincare Margin Is Actually Defended

Gross margin of 62% to 82% with no cost defensibility means price is protected by evidence and habit rather than by anything a competitor cannot copy. The four moves below reach those: funded claim substantiation, repeat purchase engineering, professional recommendation, and reformulating ahead of restriction rather than after it. None of the four is a media buy.

Fund Claim Substantiation Before Enforcement Arrives

A defensible efficacy claim costs USD 40 to 300 thousand in clinical and instrumental testing, which independent brands frequently cannot afford and large groups treat as routine expenditure. Advertising authorities have moved from tolerating benefit language to requiring evidence, and roughly 44% of shoppers now check the ingredient list themselves anyway. Substantiated claims survive both audiences at once. Brands still relying on unsupported language are carrying a regulatory exposure and losing informed consumers simultaneously, which is a genuinely expensive combination. Evidence happens to satisfy both of those audiences with a single spend.
Market Impact: Claims cost up to 300 thousand doll

Engineer The Second Purchase, Not The First

Repeat purchase across skincare sits near 38%, which means most products are bought once and abandoned, and the whole category's economics rest on the minority that get repurchased for years. Sensory experience, visible results inside a realistic window, and irritation management all decide that outcome far more than the launch campaign does. Formulation and consumer testing budget spent on second-purchase behaviour outperforms the same money spent on acquisition. Almost every brand allocates the opposite way and then wonders why the launch faded. The second jar is where the business actually is.
Market Impact: Category repeat purchase sits at ro

Earn The Dermatologist And Pharmacist Recommendation

Consumers who learned to read ingredient lists learned it from clinicians, and a dermatologist or pharmacist recommendation now carries authority no advertising budget can purchase. That authority is earned through published evidence, tolerability data, and a formulation somebody with training would actually endorse. European pharmacy dermocosmetic brands built entire businesses on precisely this and it transfers to other markets. Brands that treat clinicians as an influencer channel rather than a technical audience get found out very quickly indeed. Roughly 44% of shoppers now arrive having already checked the formulation for themselves.
Market Impact: Roughly 44% of shoppers now check a

Reformulate Sun Care Ahead Of Filter Restriction

Several organic ultraviolet filters face restriction over reef toxicity and endocrine concerns, and the mineral alternatives deliver worse cosmetic acceptability at equivalent protection, which is what actually decides whether a daily sunscreen gets used. Reformulating before a restriction date arrives means holding a compliant product with acceptable texture when competitors are still testing. Sun care grows at 8.4% and daily use is the reason. Arriving after the deadline means a compliant product nobody enjoys applying every morning. Protection factor is not what keeps a bottle in somebody's bathroom every single morning.
Market Impact: Restriction reviews now cover 6 nam

Who Controls the Margin Pool

Fragmentation is real despite scale at the top: the five largest groups hold roughly 33% of skincare revenue, and independent brands keep taking share through social media rather than shelf negotiation. The gap between leaders and challengers is claim substantiation capacity and distribution reach rather than formulation skill, which contract manufacturers supply to anybody. All participants here are assessed on one basis, revenue from finished topical skincare products, excluding colour cosmeti
Competition runs along four lines. First, substantiation capacity, since evidence is what survives both regulators and informed consumers. Second, professional endorsement from dermatologists and pharmacists, which no advertising budget replaces. Third, channel breadth across pharmacy, specialist retail, and direct online. Fourth, formulation stability in active categories, where irritation and degradation separate competent products from the rest.

Pressure is building from two directions. Value-tier brands publishing concentrations have taken prestige share simply by being checkable, which removes the language premium the category was built on. Meanwhile Chinese and Korean domestic brands are winning their own markets on local understanding. Rankings should favour groups with substantiation capacity and professional credibility over those defending prestige positioning on brand equity alone.
skincare-market-company-positioning-matrix-1787332081995

Competitive Moat and Risk Dimensions

L'OREAL

Moat: Research scale and portfolio range

L'Oreal funds research and claim substantiation at a scale independent brands cannot approach, which matters precisely when evidence rather than language decides purchase. Its portfolio spans mass, pharmacy dermocosmetic, and prestige tiers, so a consumer trading up or down usually stays inside the group. Distribution reach across every channel and region gives new launches an immediate audience competitors must buy.
L'OREAL

Risk: Prestige exposure and share loss

A substantial share of profit sits in prestige positioning that ingredient literacy has directly undermined, since a checkable formulation removes the premium narrative supported. Independent brands keep taking share in the fastest-growing active categories through channels that require no shelf negotiation. Chinese and Korean domestic brands are also winning their home markets, which are the largest growth pools available.
BEIERSDORF

Moat: Dermocosmetic authority and pharmacy channel

Beiersdorf holds genuine pharmacy dermocosmetic authority through brands that clinicians recommend rather than merely stock, which is the credibility ingredient literacy has made valuable. Its tolerability and evidence documentation supports claims that survive both enforcement and informed scrutiny. Deep European pharmacy relationships are extremely difficult for a new entrant to replicate at any spend level.
BEIERSDORF

Risk: European weighting and mass exposure

Revenue concentrates in European markets where category volume is flat and growth comes only through mix, which caps the achievable rate. A large mass-tier business faces value competitors matching active concentrations at lower price with published formulations. Sun care filter restrictions also land hardest on a portfolio with substantial photoprotection exposure across exactly those European markets.

Players Tracked

Prominent Players

L'Oreal
Unilever
Estee Lauder Companies
Beiersdorf
Shiseido

Other Key Players

Kenvue
Procter and Gamble
Kao Corporation
LVMH Beauty
Amorepacific
LG Household and Health Care
Coty
Puig
Galderma
Pierre Fabre
Natura and Co
Yatsen Holding
Proya Cosmetics
Rohto Pharmaceutical
Honasa Consumer

Recent Developments

FEBRUARY 2025

Advertising authorities tighten cosmetic efficacy claim enforcement

Advertising and consumer protection bodies across several markets required withdrawal or amendment of skincare efficacy claims that lacked substantiation, including anti-ageing and repair language used for decades. These were enforcement actions rather than commercial transactions, and they raised the cost of the category's cheapest historical form of differentiation.
Signal: Language that survived for decades simply
AUGUST 2024

Ultraviolet filter restrictions advance across further jurisdictions

Additional jurisdictions restricted or opened review of organic ultraviolet filters over reef toxicity and endocrine concerns, obliging reformulation toward mineral or hybrid systems with poorer cosmetic acceptability. These were regulatory decisions rather than corporate events, and they set reformulation timetables no brand controls. Texture became the commercial variable.
Signal: Compliant sun care that nobody enjoys appl
APRIL 2024

Value-tier active brands take prestige share on published formulations

Brands publishing full concentrations of retinoids, acids, and niacinamide continued taking share from prestige positioning across active treatment categories, particularly among consumers recruited through clinician-led social content. These were competitive share shifts rather than transactions, and they demonstrated that checkability now outranks narrative. Prestige positioning lost ground steadily.
Signal: Publishing a concentration is far cheaper

Actives, Emollients, Packaging, Testing

Formulation is a surprisingly small part of what a consumer pays. Active ingredients run 14% to 30% of formulation cost, with peptides and specialist actives at the top and commodity humectants at the bottom. Emollients, emulsifiers, and preservatives add 20% to 30%. Primary packaging including airless pumps and glass contributes 22% to 34%, and claim testing a further 8% to 16% of a launch budget.
Specialist active pricing rose sharply through 2022 on energy and precursor costs, and packaging moved with resin and glass energy at the same moment, so both halves tightened together. Beiersdorf and Shiseido both disclosed input cost pressure across those reporting periods, and IEA analysis recorded European industrial gas at several times prior-year levels, which hit glass and airless pump production directly. Neither recovered quickly at all.

Exposure separates by tier and packaging choice rather than by scale. A prestige product carries packaging cost approaching a third of formulation and packaging combined, which is where perceived value sits and cost risk concentrates. A value-tier product with a simple bottle carries active cost as the dominant element instead. Geography compounds it, since European glass and pump manufacture carries energy costs Asian suppliers avoid.
skincare-market-cost-volatility-analysis-1787332082232

Qualify second sources for every specialist active

Peptides, specialist botanicals, and encapsulated actives frequently come from single suppliers with long qualification cycles and no ready alternative. A single-sourced hero active is an unmanaged risk rather than a purchasing decision, particularly where the concentration is published and cannot quietly change. Qualifying an alternative costs stability and efficacy testing once and protects the product line permanently afterwards.

Design packaging for cost before design for perception

Primary packaging runs 22% to 34% of formulation and pack cost, and in prestige tiers it exceeds the formulation entirely, which is a difficult conversation. Airless pumps, heavy glass, and secondary cartons all carry real cost and energy exposure. Simplification frequently improves margin and sustainability position at once, and consumers reading ingredient lists notice packaging less than they used to.

Build a reusable substantiation library across the portfolio

Claim testing costs USD 40 to 300 thousand per claim and much is repeated needlessly across launches using the same actives. A structured evidence library covering each active, concentration band, and claim type lets subsequent launches reference existing work rather than commissioning it again. The discipline is organisational rather than scientific, which is why so few brands maintain one.

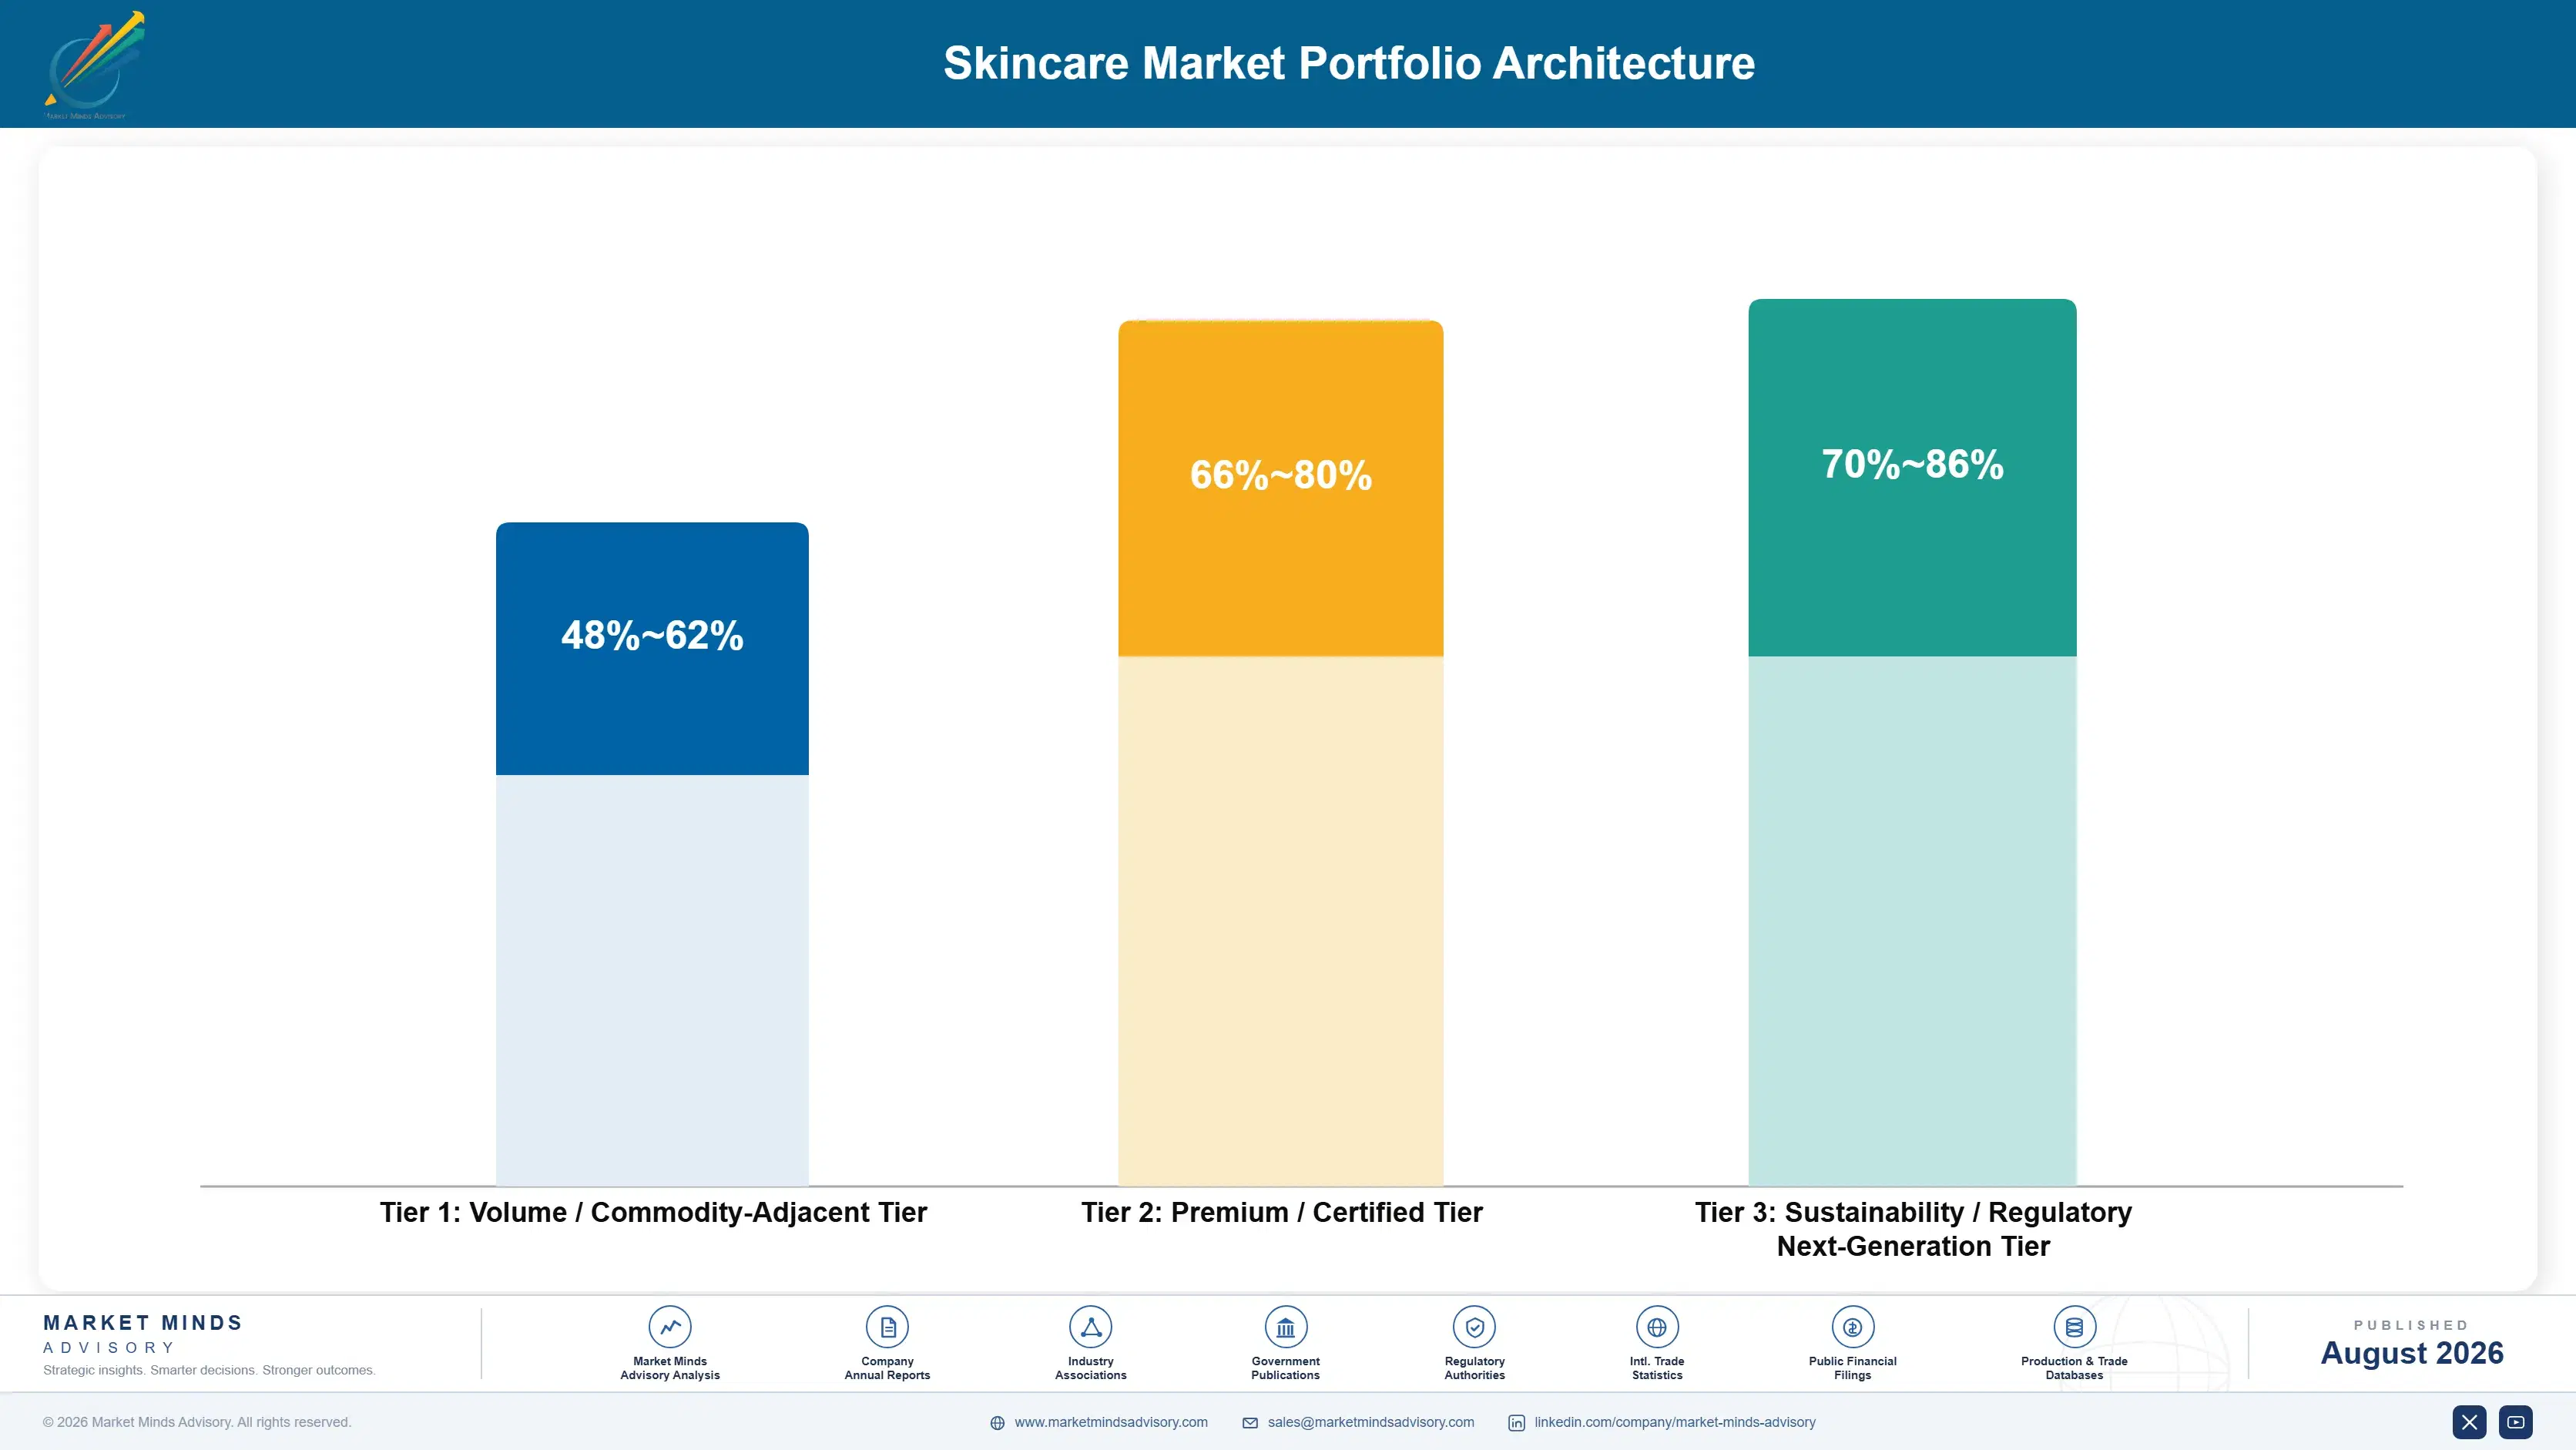
Portfolio Architecture for Margin Defence

The portfolio splits into three tiers with different economics. Mass cleansers and body care form the volume tier, where formulation is undifferentiated, private label competes directly, and shelf price decides everything. Dermocosmetic and clinically positioned ranges earn considerably more because professional endorsement and tolerability evidence narrow the field. Active serums and daily photoprotection price against substantiation and cosmetic acceptability rather than a competing jar.
The tension runs between volume categories that hold distribution and active categories that earn the return. Mass cleansers and body care secure shelf space, cover distribution cost, and recruit consumers who later trade up within the portfolio. Yet they compete against private label on price with no formulation defence at all. Groups handling this well accept thin mass margin while directing substantiation budget toward actives and photoprotection.

High-value pools concentrate where evidence or capability limits competition: active serums with substantiated claims and published concentrations, dermocosmetic ranges carrying clinician endorsement, daily sunscreens with genuinely acceptable texture under restricted filters, and formulations competitors cannot match on stability. All four escape the shelf price comparison. Mass body lotion sits at the other end, where private label matches the formulation and the retailer sets the price.

Volume / Commodity-Adjacent Tier

Mass cleansers, body lotions, and basic moisturisers competing directly against private label on shelf price. The range is wide because packaging choice and manufacturing scale separate producers considerably at identical retail positioning.
Gross Margin: 48-62%

Premium / Certified Tier

Dermocosmetic ranges, prestige moisturisers, and clinically positioned treatments carrying tolerability evidence and professional endorsement. The range is wide because substantiation depth varies enormously and packaging cost differs sharply between tiers.
Gross Margin: 66-80%

Sustainability / Regulatory / Next-Generation Tier

Substantiated active serums, reformulated daily photoprotection, and refill or concentrate formats. The range is wide because claim evidence supports strong pricing while reformulated sun care still carries unrecovered development cost.
Gross Margin: 70-86%
skincare-market-portfolio-architecture-1787332082766

High-value Sub-segments and Strategic Watch-out

Serums and Active Treatments

High value and high growth at 10.6%, the fastest category, because a named active at a stated concentration is checkable and consumers now check. Value-tier entrants publishing formulations have taken prestige share, and stability plus irritation management separate competent products quickly. Checkability now outranks narrative entirely.
Gross Margin: 70-86%

Sun Care and Photoprotection

High value with strong growth at 8.4% as daily use replaces seasonal purchase under dermatologist advocacy. Cosmetic acceptability rather than protection factor decides adoption, and filter restrictions are forcing reformulation on regulatory rather than commercial timetables. Daily use rather than seasonal is the whole commercial change.
Gross Margin: 62-78%

Facial Moisturisers and Creams

The volume core by a wide margin, growing at 5.4% and squeezed between private label below and active serums above. It remains the anchor of most routines and the entry point for most consumers, though the language premium it relied on has largely gone. Private label sits directly underneath.
Gross Margin: 58-78%

Body Care and Hand Care

The strategic watch-out, growing at 4.6% with private label matching formulations closely and retailers holding the pricing power outright. Volume is enormous and defensibility is minimal, which makes it a distribution asset rather than a margin one. Nobody defends price in this category on formulation alone.
Gross Margin: 48-62%

How Skincare Routines Actually Hold

Demand commits at the second purchase and repeats for years afterwards. A product producing a visible result inside a realistic window without irritating becomes a routine fixture, while one that disappoints is abandoned after a single jar, which is why repeat purchase near 38% decides everything. Routines also layer rather than substitute. The genuine competitive moments are a first trial, a formulation change consumers notice, and any claim withdrawal.
Stickiness varies by result visibility and tolerance. Active serums stick hardest when they work, since a consumer who sees a change attributes it to a specific molecule and stays. Dermocosmetic ranges stick through clinician endorsement and tolerability on sensitive skin. Daily sunscreens stick through texture rather than protection. Mass body care sticks least, moving on promotion because private label matches the formulation and nobody notices.

Buyer profiles have moved from consumers responding to advertising toward shoppers reading ingredient declarations, comparing concentrations, and taking recommendations from clinicians on social platforms. Retail buyers and regulators have both become more demanding at the same time. That change rewards brands bringing substantiated claims, published formulations, and tolerability data, and penalises those still buying reach to support language that will not survive being checked.
skincare-market-end-use-penetration-index-1787332083287

Our Call On Skincare

These are among the four positions where our research anticipates prominent divergence between winners and laggards over the coming forecast period. Each is grounded in the demand model, the regulatory perimeter, and the announced capacity pipeline.
01 / CLAIM SUBSTANTIATION INVESTMENT

Evidence is now the only defensible differentiation

A defensible efficacy claim costs USD 40 to 300 thousand in clinical and instrumental testing, and advertising authorities have moved from tolerating benefit language to demanding proof of it. Roughly 44% of shoppers now check the ingredient list themselves regardless of what the advertising says, so substantiated claims satisfy the regulator and the informed consumer at the same time. Brands still relying on unsupported language carry a regulatory exposure while losing their best customers, which is a genuinely expensive combination to run.
02 / SECOND PURCHASE ENGINEERING

Most products are bought once and then abandoned

Repeat purchase across skincare sits near 38%, which means the category's entire economics rest on the minority of products that get repurchased for years rather than simply tried once. Sensory experience, a visible result inside a realistic window, and irritation management all decide that outcome far more than any launch campaign does. Formulation and consumer testing budget spent on second-purchase behaviour outperforms the same money spent on acquisition, and almost every brand in the category allocates it the other way round.
03 / CLINICIAN CREDIBILITY BUILDING

Consumers learned this from dermatologists, not brands

The ingredient literacy that reshaped this whole category came from clinicians reaching audiences directly, which means a dermatologist or pharmacist recommendation now carries an authority that no advertising budget can simply purchase. That authority is earned through published evidence, tolerability data, and formulations that a trained professional would genuinely endorse. European pharmacy dermocosmetic brands built entire businesses on exactly this, and brands treating clinicians as an influencer channel rather than as a technical audience get found out very quickly indeed.
04 / FILTER REFORMULATION TIMING

Compliant sunscreen nobody enjoys applying fails anyway

Several organic ultraviolet filters now face restriction over reef toxicity and endocrine concerns, and the mineral alternatives currently available deliver worse cosmetic acceptability at equivalent protection factor. Since daily use is what makes photoprotection work at all, texture rather than protection factor decides whether a sunscreen survives in any routine. Reformulating ahead of restriction dates means holding an acceptable product while competitors are still testing, and arriving afterwards means holding a compliant bottle that simply sits unused in a cupboard.

Engagement Snapshot From the Field

A live engagement with an industry participant carrying material or product regulatory and market exposure ahead of a defining policy shift, showing how our research translates into a defensible multi-year portfolio strategy.
MARKET MINDS ADVISORY · CLIENT ENGAGEMENT SUMMARY
Skincare Producer Strategic Portfolio Review and Transition Roadmap 2026·Investment Scenario on Skincare Exposure Evaluation 2025-26
CLIENT PROFILE
A prestige skincare brand with roughly USD 620 million in annual revenue engaged MMA after an advertising authority required withdrawal of anti-ageing language used across its hero range for eleven years. The client reported repeat purchase of about 29% on that range, no substantiation file for the withdrawn claims, and share loss to value-tier active brands (client-reported, unverified by MMA).
STRATEGIC CHALLENGE
The withdrawn language had carried the range's positioning and its price point, and no substantiation existed to reinstate it. Marketing wanted equivalent language found, regulatory wanted the claim set rebuilt from evidence, and finance questioned whether the price could hold either way. The board needed to know what the range could credibly claim before the next season's campaign was committed.
MMA APPROACH
MMA assessed what each formulation could actually support with testing rather than asking what language might be permissible, which reversed the internal sequence. We benchmarked the client's active concentrations against value-tier competitors publishing theirs, since that comparison was already being made by consumers. We then modelled repeat purchase against sensory and result data rather than against advertising spend.
KEY FINDINGS
  1. Active concentrations in the hero range sat below three value-tier competitors selling at roughly a fifth of the price, which explained the share loss better than any claims issue (client-reported, unverified by MMA).
  2. Repeat purchase on the hero range was 29% against 51% on a smaller serum line, and the difference tracked visible result rather than price or packaging.
  3. Two of the withdrawn claims could be substantiated with instrumental testing costing considerably less than one season of campaign spend, which nobody had commissioned.
  4. Consumer research found the packaging premium was recognised but no longer accepted as evidence of efficacy, which nobody internally had tested before this work.
CLIENT PROFILE
A prestige skincare brand with roughly USD 620 million in annual revenue engaged MMA after an advertising authority required withdrawal of anti-ageing language used across its hero range for eleven years. The client reported repeat purchase of about 29% on that range, no substantiation file for the withdrawn claims, and share loss to value-tier active brands (client-reported, unverified by MMA).
STRATEGIC CHALLENGE
The withdrawn language had carried the range's positioning and its price point, and no substantiation existed to reinstate it. Marketing wanted equivalent language found, regulatory wanted the claim set rebuilt from evidence, and finance questioned whether the price could hold either way. The board needed to know what the range could credibly claim before the next season's campaign was committed.
MMA APPROACH
MMA assessed what each formulation could actually support with testing rather than asking what language might be permissible, which reversed the internal sequence. We benchmarked the client's active concentrations against value-tier competitors publishing theirs, since that comparison was already being made by consumers. We then modelled repeat purchase against sensory and result data rather than against advertising spend.
KEY FINDINGS
  1. Active concentrations in the hero range sat below three value-tier competitors selling at roughly a fifth of the price, which explained the share loss better than any claims issue (client-reported, unverified by MMA).
  2. Repeat purchase on the hero range was 29% against 51% on a smaller serum line, and the difference tracked visible result rather than price or packaging.
  3. Two of the withdrawn claims could be substantiated with instrumental testing costing considerably less than one season of campaign spend, which nobody had commissioned.
  4. Consumer research found the packaging premium was recognised but no longer accepted as evidence of efficacy, which nobody internally had tested before this work.
RECOMMENDED STRATEGY
Phase 1: Phase 1 (0 to 6 months): Reformulate the hero range to concentrations that can be published rather than defending the existing formulation. Phase 2: Phase 2 (6 to 16 months): Substantiate the two provable claims through instrumental testing and abandon the remainder entirely from the range. Phase 3: Phase 3 (16 to 28 months): Shift campaign budget toward the serum line where repeat purchase already demonstrates the product works.
OUTCOME
The client reformulated and published concentrations, which stabilised share against value-tier competitors within a year and allowed the two substantiated claims back into use. Repeat purchase on the reformulated hero range rose toward the serum line level, and campaign spend reallocated to the better-performing product improved return measurably (client-reported, unverified by MMA).

Frequently Asked Questions

Foundational context covering the market sizes, CAGR, scope, country, region and competition that inform every finding below. This section is provided to cover basics and most often pre-purchase conversations, answered from the MMA Primary Research Dataset.

What is the current size of the Skincare Market?

The global skincare market is valued at USD 178.6 billion in 2025, covering facial moisturisers, cleansers, serums and active treatments, sun care, and body care. Colour cosmetics, hair care, and prescription dermatology are excluded.

How large will the Skincare Market be by 2036?

The market is forecast to reach USD 346.14 billion by 2036 in the base case, about 1.83 times the 2026 level. That represents incremental value of roughly USD 156.47 billion across the decade.

What is the CAGR for the Skincare Market 2026 to 2036?

The market grows at a 6.2% CAGR in the base case, with bull and bear scenarios at 7.4% and 5.0%. The spread turns mainly on claims enforcement and daily photoprotection adoption.

Which segment is growing fastest?

Serums and active treatments grow fastest at 10.6%, about 1.71 times the overall rate, as consumers buy named actives at stated concentrations. Sun care and photoprotection follow at 8.4%.

Who are the major companies in the Skincare Market?

Leading groups include L'Oreal, Unilever, Estee Lauder Companies, Beiersdorf, and Shiseido. Fragmentation persists despite that scale, with the top five holding roughly 33% of skincare revenue.

Which country is growing fastest?

India grows fastest at an 11.8% CAGR, as rising incomes convert occasional buyers into multi-step routine users. China and Indonesia follow on domestic brand strength and income growth.

Report Segmentation Architecture

The full report scope spans multiple orthogonal segmentation dimensions, with cross-tabulated demand data provided for each dimension pair. Coverage extends further to regional breakdowns, trend trajectories, and the competitive detail needed to support segment-level decision-making.

By Product Category

  • Facial Moisturisers and Creams
  • Cleansers and Face Wash
  • Serums and Active Treatments
  • Sun Care and Photoprotection
  • Body and Hand Care

By End-Use Industry

  • Mass Retail and Grocery
  • Pharmacy and Drugstore
  • Specialist Beauty Retail
  • Direct To Consumer and Online
  • Professional and Spa Channel

By Price Tier

  • Value and Entry Tier
  • Masstige Tier
  • Premium and Prestige Tier
  • Dermocosmetic and Clinical Tier

By Region

  • North America
  • Western Europe
  • East Asia
  • South Asia and Pacific
  • Latin America
  • Middle East and Africa
  • Eastern Europe

Scope, Methodology, and Coverage

Every figure in this report is reproducible from documented input assumptions. The scope below maps the historical period, the forecast horizon, the segmentation dimensions, and the countries covered, alongside the underlying primary and qualitative methodology.
Historical Period
2020 to 2025
Forecast Period
2026 to 2036
Base Year
2025 (USD billions; MMA Primary Research Dataset, August 2026)
Market Definition
The skincare market comprises the manufacture and sale of topical formulated products applied to human skin for cleansing, hydration, protection, or treatment, valued at manufacturer selling prices to retailers, pharmacies, distributors, and direct consumers. It spans facial moisturisers and creams, cleansers and face wash, serums and active treatments including retinoids, acids, peptides and vitamin derivatives, sun care and daily photoprotection, and body and hand care, together with the claim substantiation, safety assessment, and packaging supplied with them. Colour cosmetics and make-up, hair care and styling, oral care, fragrance and deodorants, prescription dermatological medicines and medical devices, injectable and energy-based aesthetic procedures, cosmetic raw materials and actives sold to formulators rather than consumers, and professional treatment, clinic and spa services are excluded.
Quantitative Units
USD billions (current prices); volume in billion units and litres where applicable
Segmentation Dimensions
By Product Category; By End-Use Industry; By Price Tier; By Region
Regions Covered
North America, Western Europe, East Asia, South Asia and Pacific, Latin America, Middle East and Africa, Eastern Europe
Countries Covered
China, USA, Japan, South Korea, Germany, France, UK, Italy, Spain, Netherlands, Poland, India, Brazil, Mexico, Indonesia, Vietnam, Thailand, Philippines, Australia, Canada, Argentina, Colombia, Chile, UAE, Saudi Arabia, Turkey, South Africa, Nigeria, Egypt, Sweden, and additional markets relevant to this sector
Key Companies Profiled
L'Oreal, Unilever, Estee Lauder Companies, Beiersdorf, Shiseido, Kenvue, Procter and Gamble, Kao Corporation, LVMH Beauty, Amorepacific, LG Household and Health Care, Coty, Puig, Galderma, Pierre Fabre, Natura and Co, Yatsen Holding, Proya Cosmetics, Rohto Pharmaceutical, Honasa Consumer
Quantitative Methodology
Primary survey, n=3,800 respondents, Q4 2025, six countries; demand-side model with trade association cross-validation
Qualitative Methodology
47 expert interviews, Q4 2025; applied to validate demand model assumptions, identify emerging dynamics, and assess competitive positioning
Report Format
PDF and XLSX data workbook (Word format preview document)
Publisher
Market Minds Advisory
Report Code
MMA-2026-CHM-386
Published
August 2026
Contact
sales@marketmindsadvisory.com | www.marketmindsadvisory.com

Purchase the full Skincare Market Report (2026 to 2036).

The full MMA Skincare report sizes the market across five product categories, five retail channels, four price tiers, and seven regions through 2036. It profiles 20 groups on a consistent basis of finished skincare product revenue, scoring each on claim substantiation capacity, professional endorsement position, channel breadth, and active formulation stability. Scenario models quantify how claims enforcement, ultraviolet filter restriction, and ingredient-led purchasing move both volume and achievable margin by category. The report also includes repeat purchase benchmarking by category and price tier, active concentration comparison across tiers, claim substantiation cost analysis, and filter restriction exposure mapping across sun care portfolios.
Five-category and four-tier market sizing to 2036
Twenty-group benchmark on finished skincare product revenue
Repeat purchase benchmarking by product category and price tier
Active concentration comparison across value and prestige tiers
Claim substantiation cost analysis by claim type and category
Ultraviolet filter restriction exposure mapping across sun care portfolios

Built For The People Who Decide

From boardroom strategy to bench-side execution, this report is read cover-to-cover by leaders shaping the next decade of their industry, turning demand scenarios, market dynamics and valuation benchmarks into decisions.
CXOs/ Presidents/ VPs/ Managers
M&A and Corporate Development
Strategy Teams and R&D Heads
Procurement and Product Directors
Regulatory and Compliance Leaders
Investor Relations and Equity Analysts