Market Minds Advisory
Single Phase Home Standby Gensets Market

Single Phase Home Standby Gensets Market: Single Phase Home Standby Gensets Market. Grid Reliability Concerns Drive Residential Backup Power Demand

Extreme weather events and aging grid infrastructure are pushing homeowners toward automatic standby power, forcing manufacturers to balance rising unit demand against tightening emissions rules and increasingly competitive financing programs offered through dealer networks.

Lead Analyst

Published

September 2026

Make Smarter Decisions with Customized Research Insights

Request a free sample report and evaluate market opportunities, growth trends, and competitive dynamics relevant to your business needs.

2025 MARKET VALUE$3.6BMarket Size 2025
2036 FORECAST VALUE$7.9BBase Case , 2026 to 2036
CAGR 2026 TO 20367.4 %Bull 8.6% / Bear 6.2%
INCREMENTAL OPPORTUNITY$4.0BNet 10- year value creation
EXPANSION MULTIPLE2.04x2036 value over 2026 base
Strategic Levers
M&A Pipeline
Regional Outlook
Country Rankings
Competitive Intelligence
Segmental Deep-dive
Call-Us : 91 93563 13602

Executive Snapshot and Market Trajectory.

Homeowners are treating automatic standby power as a baseline home feature rather than a luxury add-on, as extreme weather events and aging grid infrastructure push outage frequency to levels that make backup power a genuine safety concern for many families across the country.
Commercial momentum concentrates around Wi-Fi enabled smart monitoring units and dealer-financed installation packages, since homeowners increasingly value remote diagnostics and predictable monthly payments alongside raw generating capacity. North America accounts for the largest share of unit sales, reflecting the region's storm-prone geography and comparatively high household disposable income. Utilities in several states now offer rebate programmes that further lower the effective cost of ownership for qualifying households.
Competition splits between large full-line generator manufacturers selling through dealer networks and specialist installers bundling financing, permitting, and maintenance into a single homeowner contract. Rising extreme weather frequency and growing dealer financing availability are increasingly shaping which brands homeowners default to when researching backup power options online. Component suppliers report a steady pipeline of transfer switch orders as utility-grade automatic switching becomes the expected standard nationwide. Insurers increasingly factor standby power into home resilience discounts.
Market Definition
This market covers automatic standby generators rated for single phase residential electrical service, including the generator, automatic transfer switch, and enclosure sold as an installed system. It excludes portable generators without automatic transfer capability and three phase commercial or industrial standby systems.
Base Year Value
$3.6B in 2025 (MMA Primary Research Dataset, September 2026)
Forecast Period
2026 to 2036, eleven discrete annual values
CAGR
7.4% base case. Bull 8.6%. Bear 6.2%.
Fastest Growth Segment
Wi-Fi Enabled Smart Monitoring Gensets: 11.5% CAGR
Fastest Growth Country
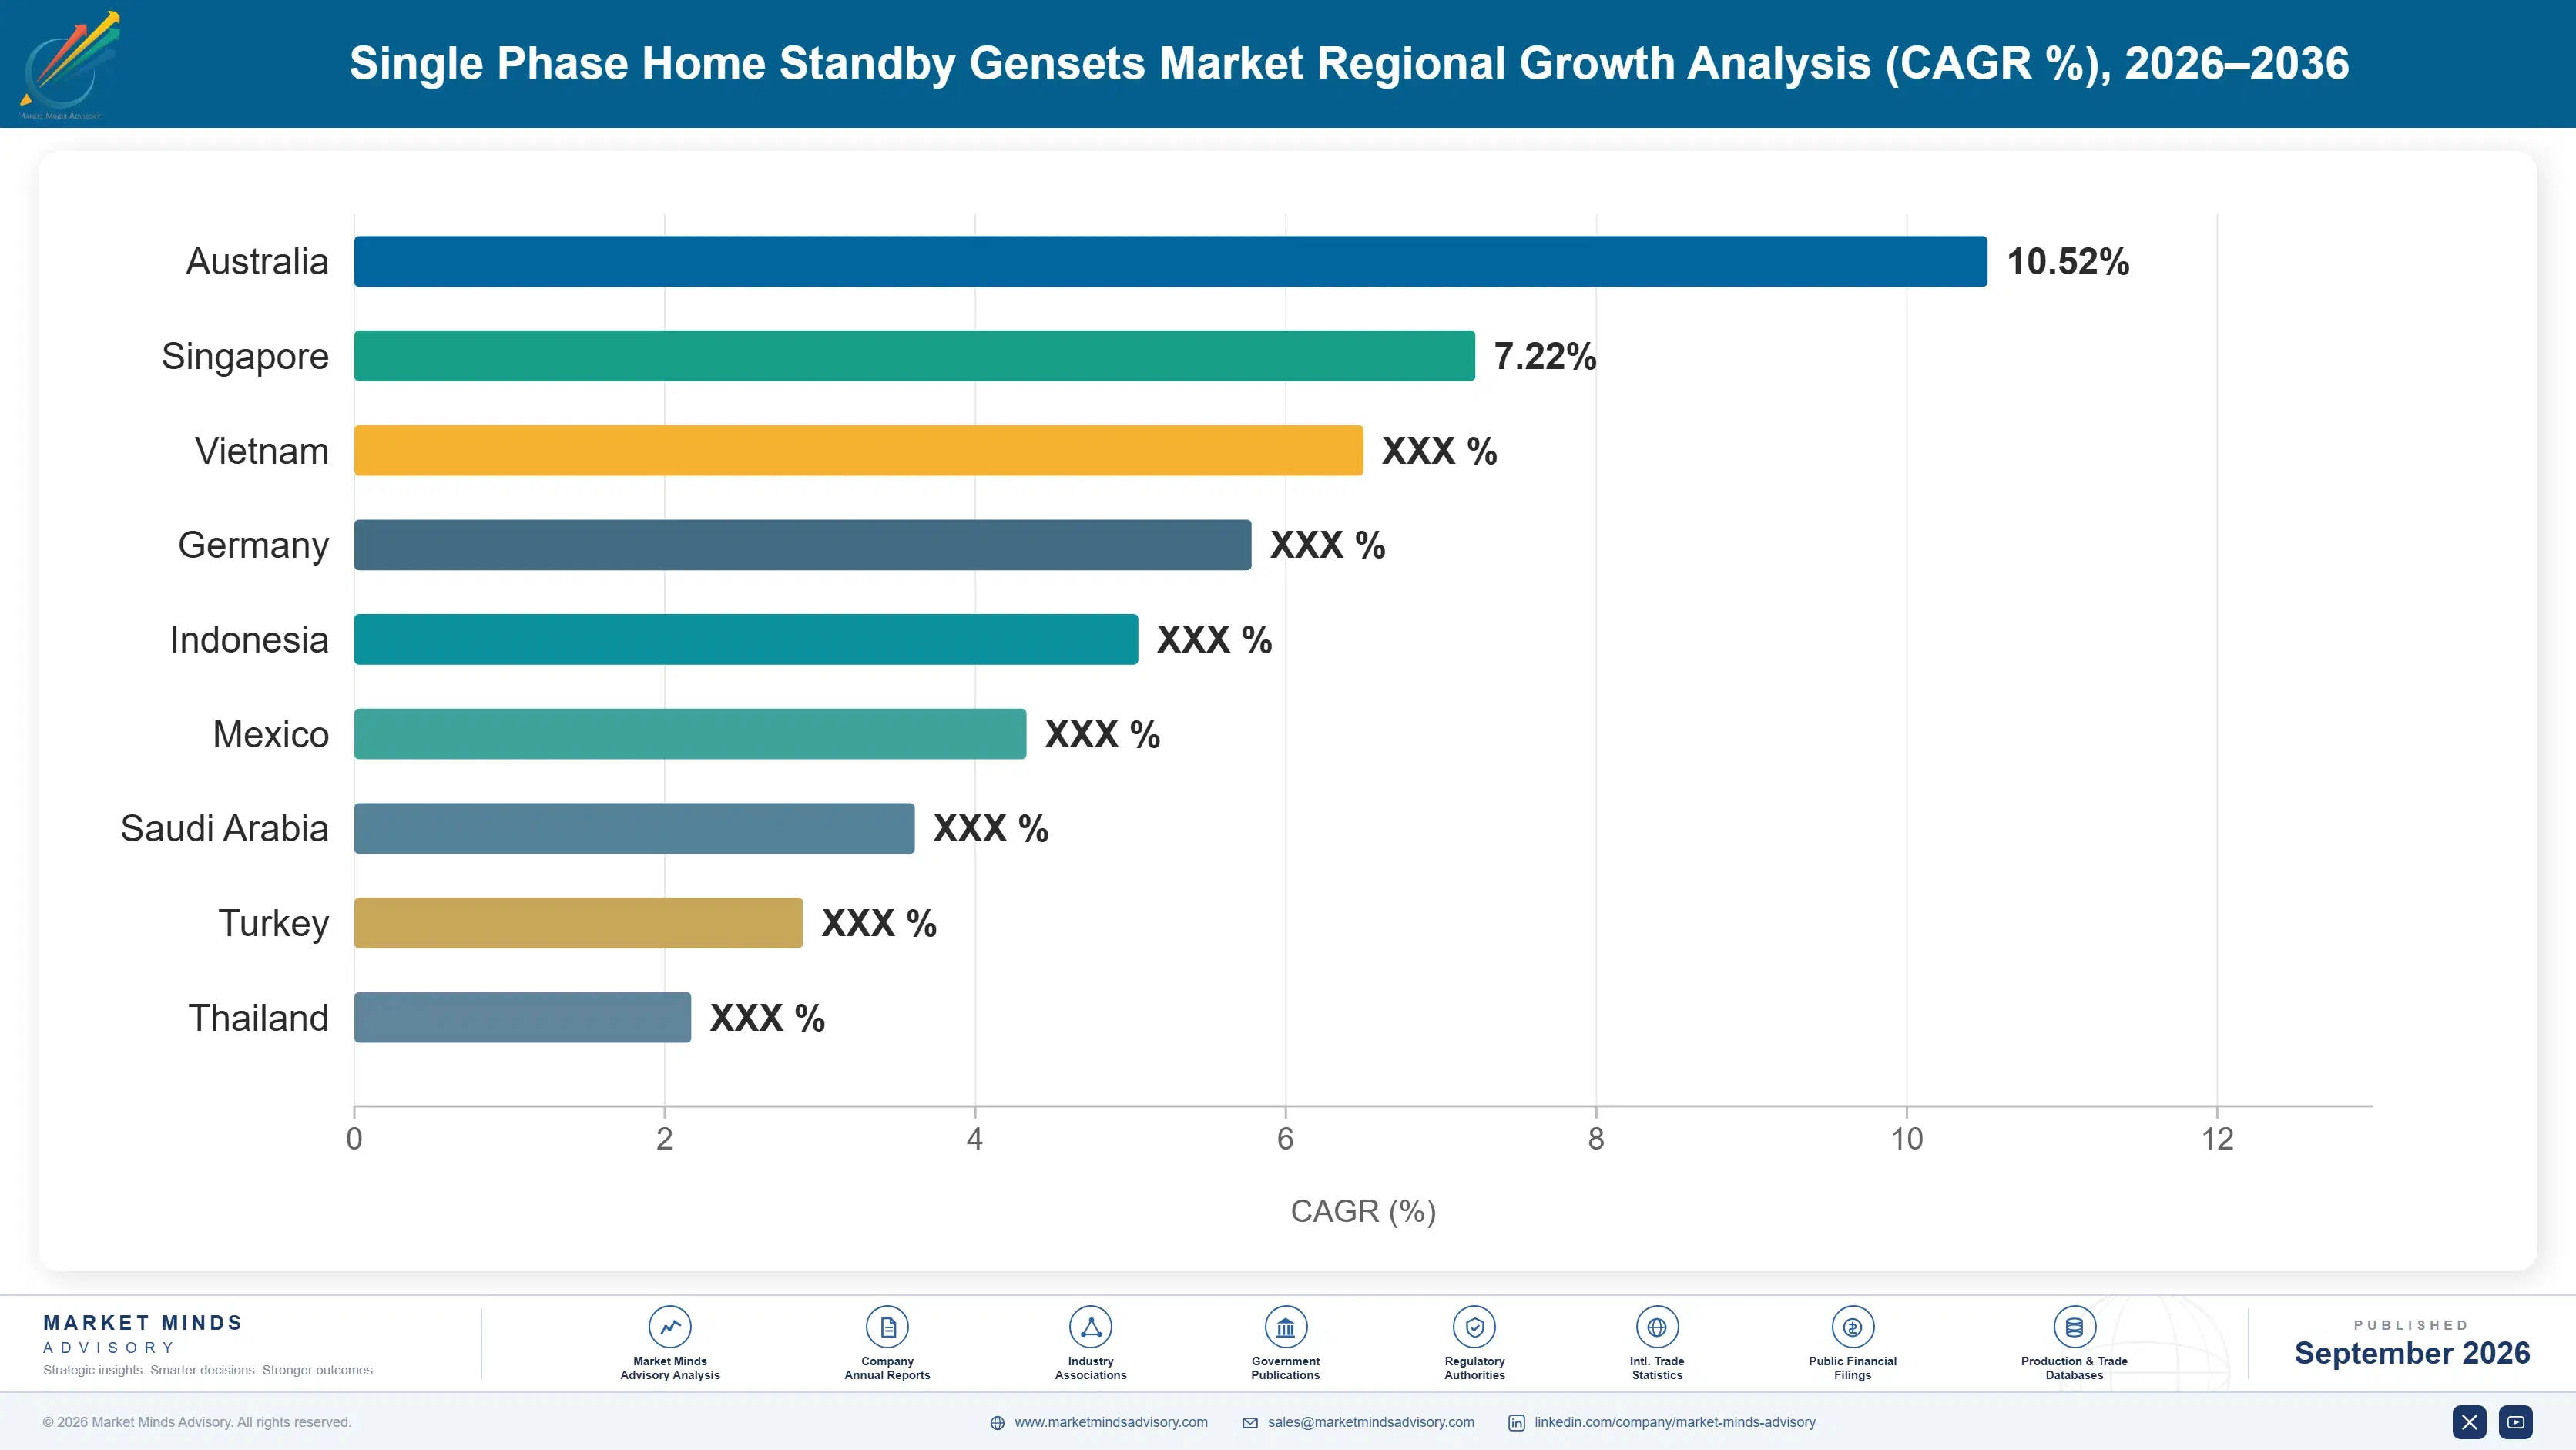
Australia: 9.6% CAGR
Fastest Growth Region
South Asia and Pacific: 9.4% CAGR
Largest Region
North America: 31% of 2025 global value
Market Leaders
Generac Power Systems, Kohler Co, Cummins Inc, Briggs and Stratton, Champion Power Equipment. Source: MMA Analysis based on company annual reports.
Primary Survey
n=3,800 procurement and R&D decision-makers, Q4 2025, six countries
Methodology
Demand-side build-up, cross-validated against public data, 47 expert interviews

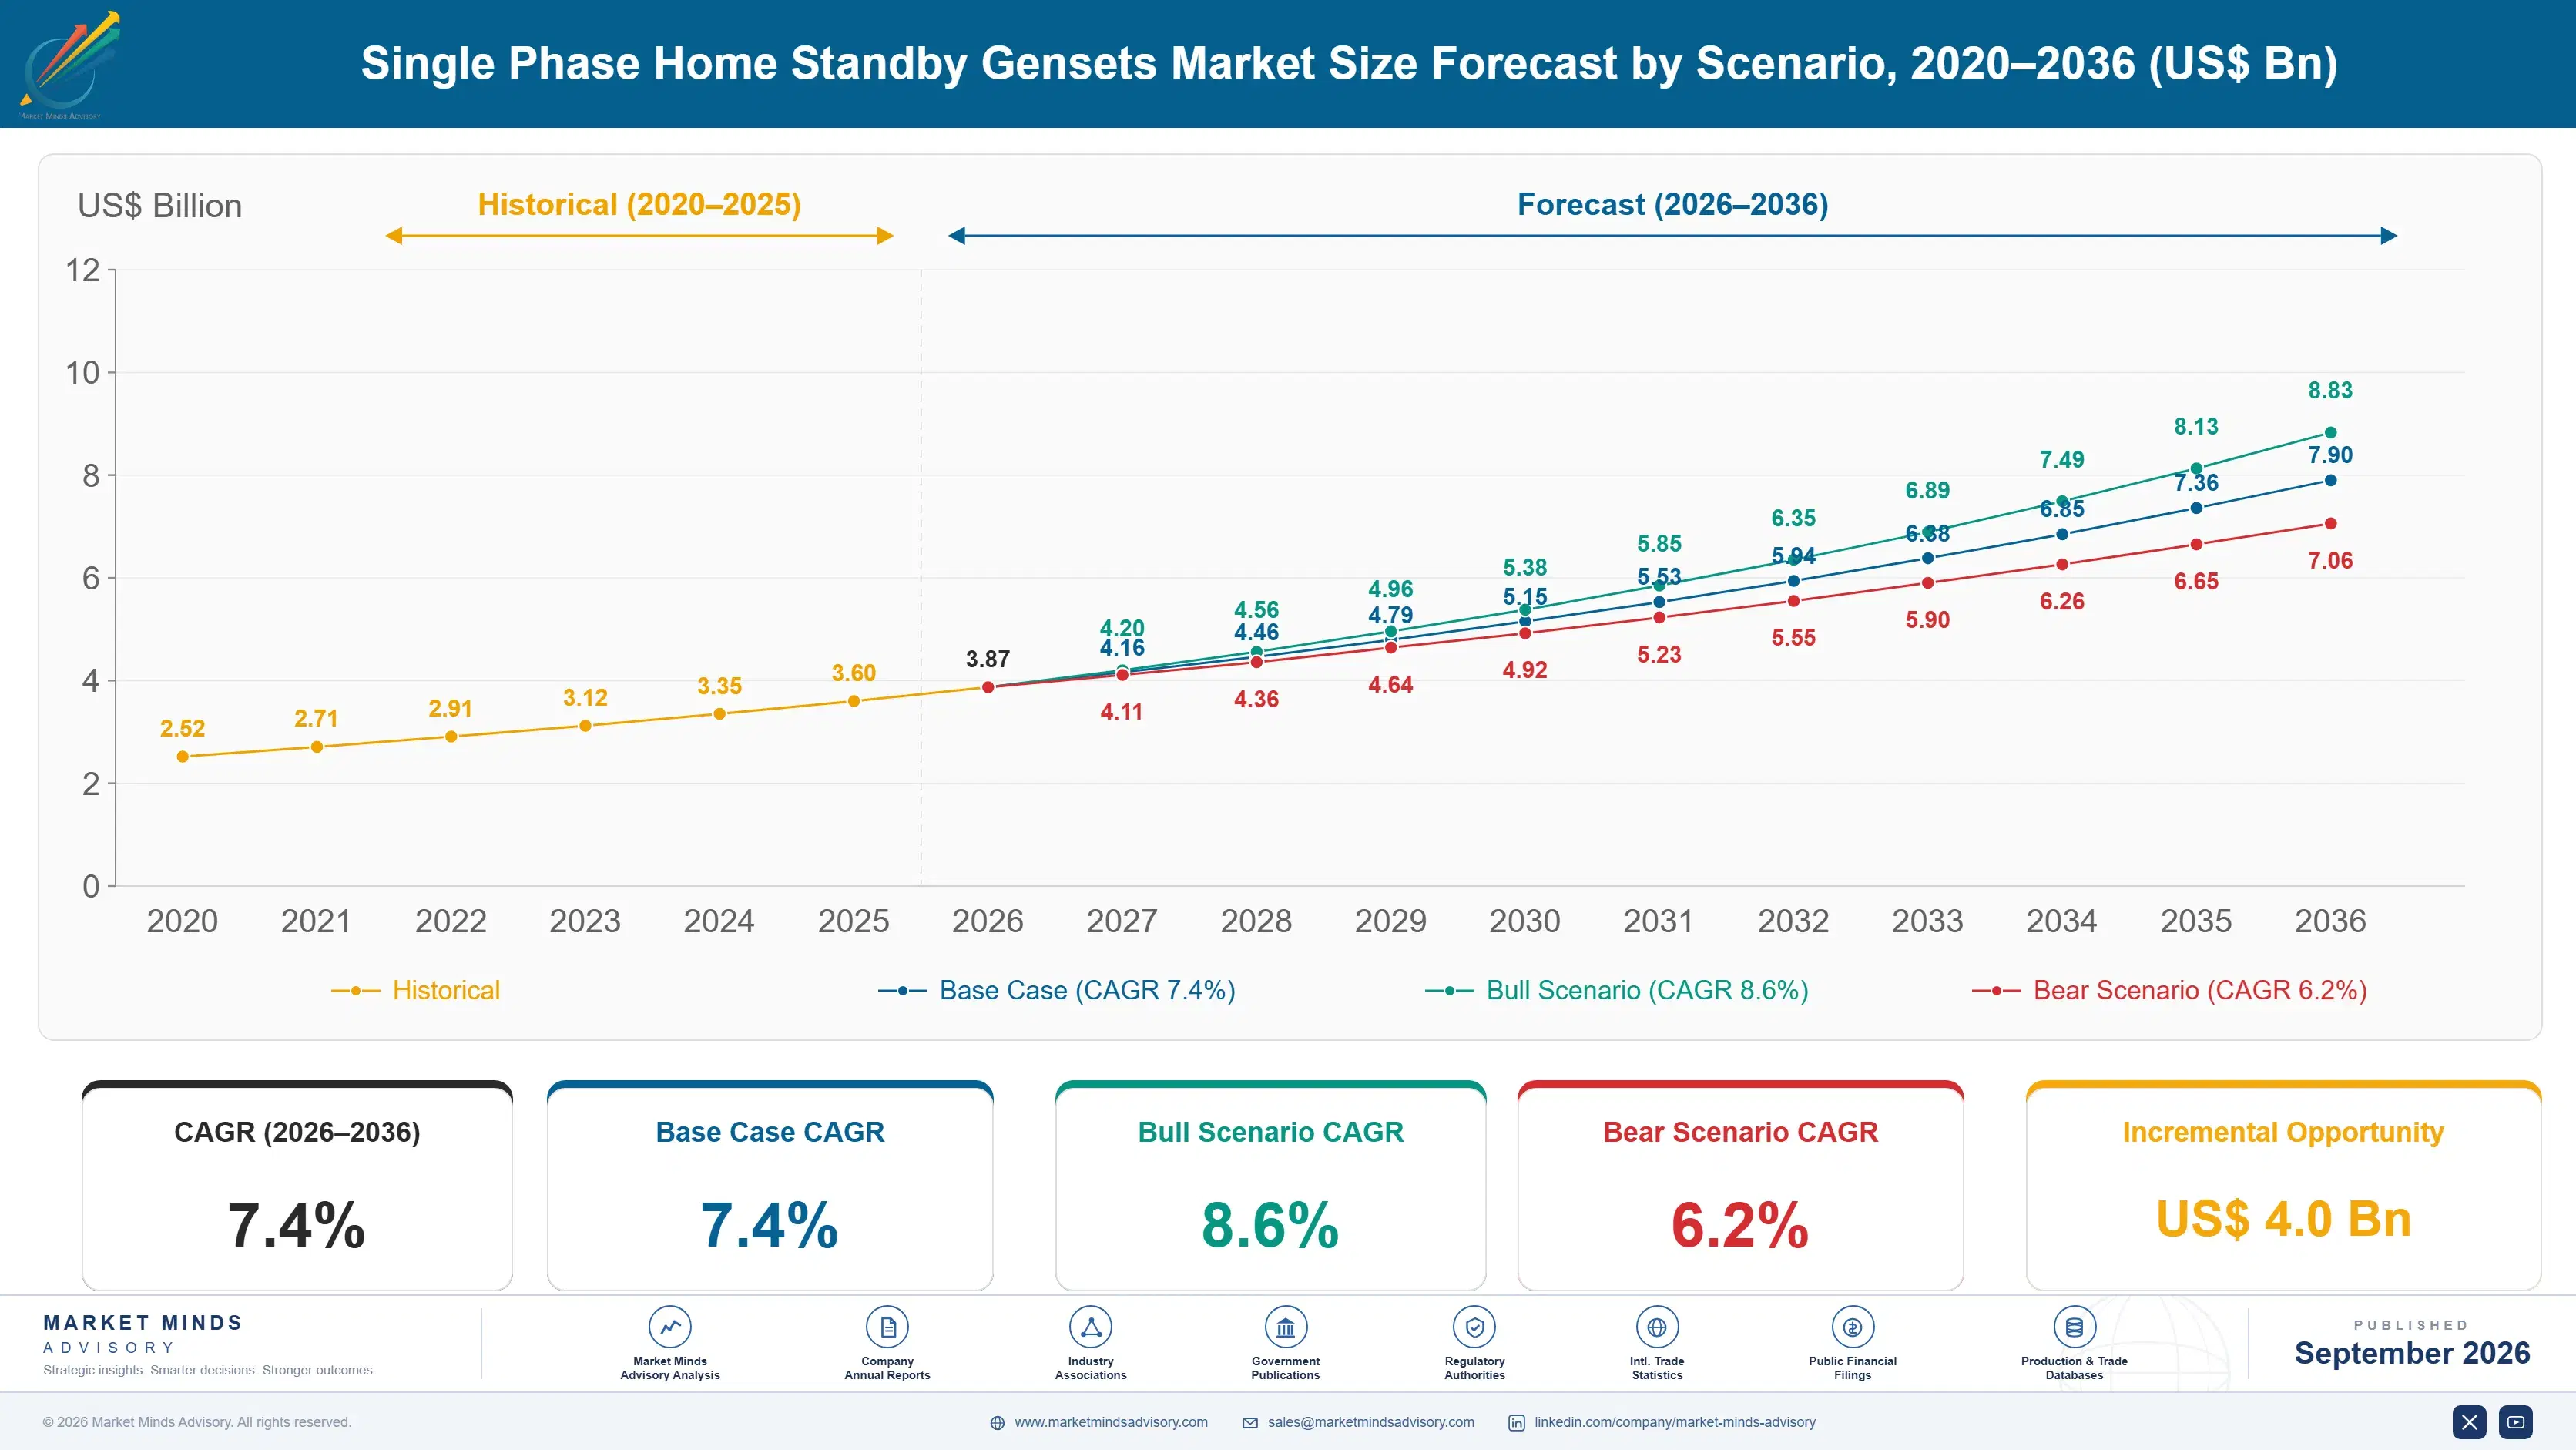
Single Phase Home Standby Gensets Market Forecast Scenarios

single-phase-home-standby-gensets-market-size-forecast-scenario-1788412335534
Between 2020 and 2025, standby genset demand grew steadily as extreme weather events and prolonged utility outages pushed more households toward automatic backup power across major storm-affected regions of the country. Historical growth ran close to 6.7 percent annually over that period, with dealer financing programmes expanding access considerably across middle-income households nationwide and internationally.
The base case assumes continued mid-single-digit to high-single-digit growth, supported by three commercial mechanisms working together: homeowners increasingly treating backup power as standard home resilience infrastructure rather than a discretionary purchase, dealer networks expanding financing options that lower the effective monthly cost of ownership, and utility rebate programmes in several states pulling new households into the category faster than organic demand alone would support across most major regions currently tracked closely.
A bull scenario assumes faster grid reliability deterioration and broader utility rebate rollout across additional states, pushing growth toward the top of the forecast range through the full ten-year window. The bear risk centers on installation capacity: if qualified electricians remain in short supply, some homeowners could face lengthy installation backlogs that delay purchase decisions and dampen near-term unit volume growth considerably nationwide.

Where Grid Anxiety Meets Financing Innovation

Converging forces are reshaping this category: worsening grid reliability, rising dealer financing availability, and growing homeowner interest in remote diagnostics are pushing standby power purchases from a discretionary luxury into a genuine household resilience decision. Insurance and municipal resilience programmes increasingly reference backup power availability when assessing overall home preparedness levels. Climate resilience attention has made backup power a standing home construction priority in several markets.
MARKET CONCENTRATIONCR5 58%top five manufacturers hold well over half of share
AVERAGE UNIT ASP$3,000-$8,500 installedvaries with output capacity and enclosure material selected
LEADING MANUFACTURING COUNTRY SHAREUSA 62% of global productionreflecting the country's concentrated dealer and distribution network
DEALER FINANCING PENETRATION44% of new unit salesrising steadily as monthly payment plans broaden buyer eligibility
SMART MONITORING ADOPTION RATE29% of new unit shipmentsreflecting growing homeowner interest in remote diagnostics and alerts
AVERAGE UNIT SERVICE LIFE20-25 years typical lifespanreinforcing steady replacement demand across long ownership cycles overall
Commercial character in this market splits between large full-line manufacturers selling through established dealer networks and specialist installers bundling financing, permitting, and maintenance into a single homeowner contract. Dealer network density and financing flexibility increasingly determine which brands homeowners default to when researching options. Manufacturers without established dealer coverage increasingly struggle to win installations against incumbents with proven multi-decade distribution relationships. That distribution advantage compounds with proven installation quality reputations built over decades.
Extreme weather frequency, dealer financing innovation, and rising smart monitoring adoption will shape vendor strategy and product design over the next decade. Manufacturers that delay smart monitoring investment risk losing share to better-positioned rivals with proven connected product lines. That lock-in dynamic favors early movers who invested in remote diagnostics ahead of the broader industry shift now underway across most regions.
"Everyone assumes standby generators are a simple mechanical product, but the manufacturers actually winning market share are the ones who solved dealer financing and installation logistics years before demand surged."
Director, Energy and Power Equipment Practice · MMA Energy Practice · September 2026

Market Trends

Extreme Weather Frequency Drives Backup Power Adoption

Prolonged utility outages following hurricanes, winter storms, and heat-driven grid strain have pushed standby genset adoption well beyond traditional storm-belt states into regions previously considered low-risk for extended power loss. Texas alone saw installation requests climb sharply following its 2021 winter grid failure, and that pattern has repeated in California, the Gulf Coast, and parts of the Midwest during subsequent extreme weather events. Utilities in several states now report multi-day outage events several times more often than a decade earlier. Manufacturers are expanding dealer networks into these newly awakened markets faster than at any point in the category's history.
Market Impact: 5-plus outage hours per household yearly
Dealer Financing Programs Expand Buyer Eligibility Broadly

Manufacturers and dealer networks have rolled out monthly payment financing programmes that lower the effective purchase barrier considerably, letting middle-income households afford units that previously required a large upfront cash outlay. Financing now covers 44 percent of new unit sales, up meaningfully from a decade earlier when most purchases were cash transactions. This shift mirrors the financing-driven expansion seen in residential solar and HVAC categories. Several major banks have partnered directly with manufacturers to speed up approval, cutting decision time from weeks to same-day turnaround. Dealers report financed customers convert at meaningfully higher rates than cash-only prospects during sales consultations.
Market Impact: over 30% cite outage risk

Market Opportunities and Growth Drivers

Aging Grid Infrastructure Increases Utility Outage Frequency

Utility transmission and distribution infrastructure across much of North America is decades past its designed service life, and deferred maintenance combined with rising electricity demand from data centers and electric vehicle charging is straining capacity during peak periods. The average American household now experiences more than five hours of outage annually, up meaningfully from a decade earlier according to utility regulatory filings. This deterioration is pulling forward standby genset purchases among homeowners who previously viewed backup power as unnecessary given historically reliable grid service. Utility rate cases increasingly cite infrastructure investment shortfalls as a driver.
Market Impact: compliance delays up to 12 months

Remote Work Trends Raise Home Power Reliability Stakes

The shift toward permanent remote and hybrid work arrangements has raised the commercial cost of home power outages considerably, since knowledge workers now depend on reliable connectivity and computing power during business hours rather than commuting to an office with independent backup infrastructure. Surveys of remote workers show a meaningful share citing outage risk as a factor in their standby genset purchase decision, a consideration that barely existed before 2020. Employers increasingly expect remote staff to maintain uptime comparable to office-based colleagues, adding pressure that did not exist in prior decades.
Market Impact: installation backlogs stretch 3-6 months

Market Restraints and Challenges

Emissions Regulation Tightens Around Combustion Engine Units

Several states have introduced tightening emissions standards for portable and standby combustion engines, following the same regulatory path that has already reshaped small off-road engine categories over the past decade. The root cause is growing air quality concern in dense suburban areas where standby gensets increasingly run during extended grid outages. Manufacturers face rising compliance testing costs and, in some cases, redesign timelines that delay new product launches by a year or more. Several manufacturers are exploring dual-fuel and cleaner-burning natural gas variants as a mitigation pathway to stay ahead of anticipated regulatory tightening.
Market Impact: installation requests up 3x nationwide

Installation Labor Shortage Constrains Near-Term Unit Volume

A persistent shortage of licensed electricians qualified to install automatic transfer switches has left many dealers with installation backlogs stretching several months during peak storm season, frustrating homeowners who purchased units expecting prompt setup and immediate protection. The root cause traces to an aging electrical trades workforce combined with insufficient apprenticeship pipeline investment over the past two decades of declining trade school enrollment. Dealers report losing sales to competitors with shorter queues, and several manufacturers now fund electrician training programmes and cross-train HVAC technicians to expand the qualified labor pool available.
Market Impact: 44% of sales now financed
4 additional market trends, 3 additional growth drivers, and 3 additional restraints and challenges are covered in the full report. Contact sales@marketmindsadvisory.com to access the complete intelligence.

Segment CAGR and Growth Architecture

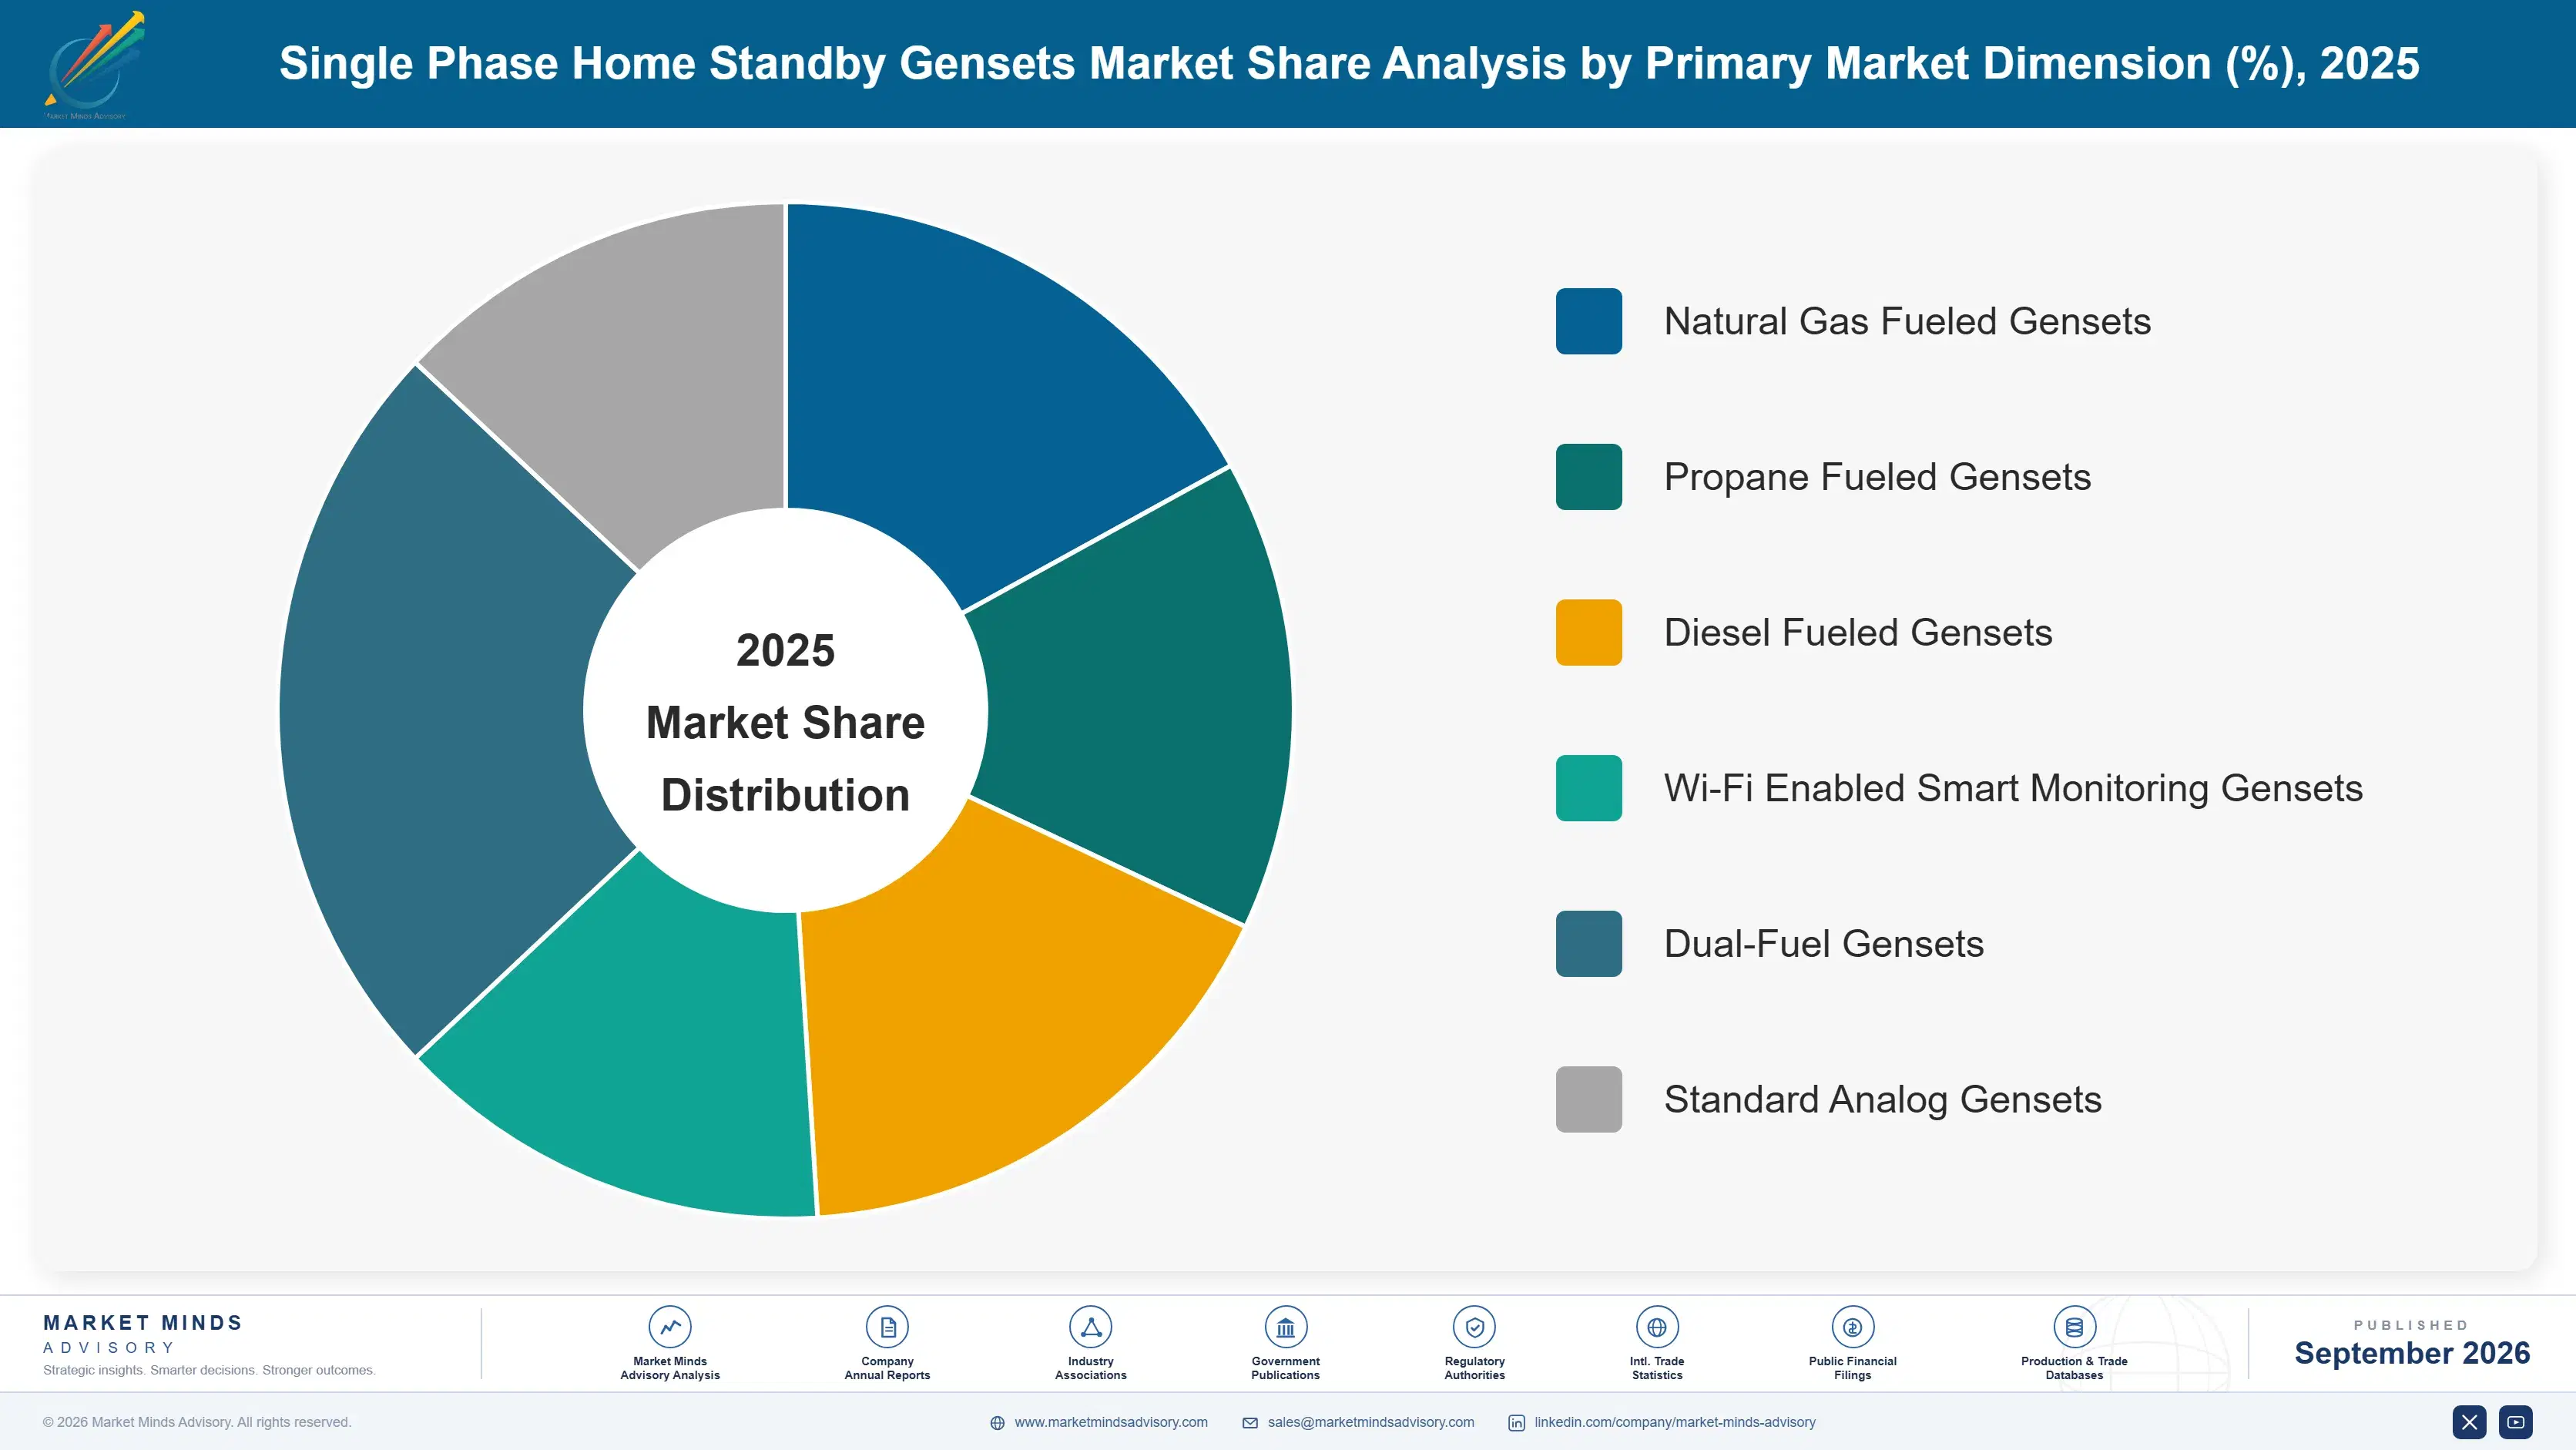
Segmentation follows fuel type and control technology, since manufacturers design, certify, and price standby gensets around distinct engine platforms rather than by installation channel, and each fuel type carries a genuinely different cost, maintenance, and reliability profile overall. This dimension also lines up cleanly with how utility interconnection rules are actually structured across most jurisdictions.
single-phase-home-standby-gensets-market-market-share-analysis-1788412336116

Wi-Fi Enabled Smart Monitoring Gensets

Wi-Fi enabled smart monitoring gensets are growing fastest because homeowners increasingly expect remote diagnostics and mobile alerts as a standard feature rather than a premium add-on, mirroring expectations set by smart thermostats and home security systems. Dealers report these units convert at meaningfully higher rates during sales consultations, since remote monitoring directly addresses the anxiety of not knowing whether a unit will actually start during an active outage. Manufacturers with established app platforms and cellular connectivity partnerships are capturing disproportionate new order volume as this feature becomes table stakes, while smaller manufacturers lacking connectivity infrastructure increasingly struggle to compete on feature parity alone. That connectivity gap is widening as smart-home integration becomes an expected purchase criterion across most price tiers.
CAGR 11.5%

Natural Gas Fueled Gensets

Natural gas fueled units are the second-fastest segment because homeowners increasingly prefer the uninterrupted fuel supply that piped natural gas offers over propane tanks requiring periodic refilling and delivery scheduling. Utility gas connections also eliminate the fuel storage footprint that some homeowners association rules restrict or discourage entirely in denser suburban developments. Manufacturers are expanding natural gas model lineups across more output capacity tiers to meet this shifting preference, and dealers increasingly recommend gas connection as the default configuration for new installations in areas with reliable utility gas infrastructure already in place. This shift is reshaping unit economics toward higher-capacity natural gas models, and manufacturers securing strong utility partnerships early are positioned to capture outsized share of this expanding segment.
CAGR 10.3%
Full segment breakdown across 6 segments available in the complete report.

Regional Architecture and Country Demand Map

North America leads global demand by a wide margin, driven by frequent extreme weather outages, aging grid infrastructure, and dealer financing availability, while East Asia's dense residential construction activity and rising middle-class disposable income push meaningful adoption across newly built housing developments and retrofit projects.

North America

Hurricane-prone Gulf Coast states, wildfire-affected California, and winter-storm-vulnerable Texas anchor demand across this region, where repeated multi-day outage events have made standby power a mainstream homeowner purchase rather than a niche preparedness product. Dealer financing programmes have expanded reach considerably into middle-income suburban markets previously priced out of the category entirely. Utility rebate programmes in several states further lower effective ownership cost for qualifying households. Canada contributes meaningful volume as well, particularly in ice-storm-prone provinces where extended winter outages carry genuine safety risk. This region's combination of storm exposure, high household income, and mature dealer networks gives it a durable competitive lead that other regions cannot easily replicate. Canadian dealer networks are expanding rapidly to keep pace.
Share: 31% | CAGR: 8.4% (2026 to 2036)

Western Europe

Grid reliability in this region remains comparatively strong, which keeps overall standby genset penetration well below North American levels despite growing homeowner interest following occasional continental outages. Germany and the United Kingdom show the highest adoption among Western European markets, driven by rising awareness following isolated but widely publicized grid stress events during extreme cold snaps. France and the Netherlands lag further behind, reflecting their historically reliable national grid operators and lower storm exposure. Regulatory approval for residential combustion engine installation varies meaningfully by country, adding friction that slows adoption pace relative to North America. Manufacturers view this region as a longer-term growth opportunity rather than a near-term volume driver.
Share: 20% | CAGR: 5.9% (2026 to 2036)
Regional intelligence for 5 additional markets available in the complete report: East Asia, South Asia and Pacific, Latin America, Middle East and Africa, Eastern Europe. Contact sales@marketmindsadvisory.com.
single-phase-home-standby-gensets-market-country-cagr-analysis-1788412336640

Where Manufacturers Should Deploy Capital

Manufacturers face a widening set of commercial choices as extreme weather, dealer financing innovation, and smart monitoring adoption reshape which capabilities actually capture margin across the category and its wider distribution channels overall. The four levers below represent the clearest paths to expanding revenue meaningfully beyond simple unit shipment growth alone this coming decade.

Dealer Financing Program Expansion Across Territories

Manufacturers can capture incremental revenue by expanding proprietary financing programmes directly rather than leaving payment plans entirely to third-party lenders, capturing interest margin that would otherwise flow to outside banks. Dealers report financed customers convert at meaningfully higher rates and purchase larger-capacity units than cash-only buyers, since monthly payments make premium features feel more affordable. Manufacturers with proprietary financing arms report incremental margin running 8 to 14 percent above unit sale price alone, since financing revenue accrues over the full loan term rather than at the point of sale. That margin compounds across a growing installed base of financed customers.
Market Impact: 8-14% of added margin captured via financing programs

Remote Monitoring Subscription Service Tier Introduction

Manufacturers embedding cellular connectivity into new units can layer recurring subscription revenue on top of the initial hardware sale, charging homeowners a modest monthly fee for premium remote diagnostics, proactive maintenance alerts, and extended warranty coverage bundled together. This shifts revenue from a single transaction into a recurring relationship that compounds over the unit's twenty-year-plus service life. Early adopters of subscription monitoring report recurring revenue reaching 5 to 9 percent of original unit price annually, a meaningful addition across a large installed base. This path needs reliable cellular infrastructure and dedicated customer support staffing to sustain subscription retention rates.
Market Impact: 5-9% of original unit price recurring each year

Extended Warranty and Maintenance Contract Bundling

Bundling extended warranty coverage and scheduled maintenance visits into the initial purchase contract lets manufacturers capture margin that would otherwise flow entirely to independent service technicians performing ad hoc repairs. Homeowners increasingly value predictable annual costs over unpredictable repair bills, particularly for a product they hope to never need in an emergency. Dealers offering bundled maintenance contracts report attachment rates climbing steadily, with bundled contracts adding 10 to 18 percent to total contract value compared to hardware-only sales. This approach also strengthens dealer relationships by creating an ongoing service touchpoint beyond the initial installation visit.
Market Impact: 10-18% of added contract value per unit sale

Utility Rebate Partnership Program Development Strategy

Manufacturers that establish direct partnerships with utilities offering resilience rebate programmes can position their products as the preferred qualifying option, capturing share from competitors without comparable utility relationships in rebate-eligible territories. These partnerships also generate co-marketing exposure through utility customer communications that would otherwise cost considerably more to replicate through independent advertising. Early movers in utility partnership development report rebate-driven sales representing 12 to 20 percent of unit volume in participating states, a meaningful and growing channel. Manufacturers pursuing this path need dedicated utility relations staff and efficient rebate paperwork processing capability.
Market Impact: 12-20% of unit volume from rebate channels annually

Who Controls the Margin Pool

The top five manufacturers hold roughly 58 percent of global unit shipment volume, a concentration built on decades of dealer network development and brand trust that smaller entrants cannot easily replicate. The gap between the category leader and mid-tier challengers is widening as financing and smart monitoring capability increasingly separate winners from laggards. Several mid-tier manufacturers have pursued acquisitions of connectivity technology firms to compete more effectively.
Current competitive activity centers on three fronts: expanding dealer financing programme availability to widen the addressable buyer base, embedding cellular connectivity into standard unit designs, and building direct utility rebate partnerships that steer eligible homeowners toward preferred brands. Large manufacturers increasingly compete with regional specialists on dealer network density rather than raw product specification alone. This convergence has become the dominant competitive pattern across nearly every major metro market.

Emerging pressure comes from lower-cost Asian manufacturers scaling combustion engine production at competitive price points and connected-home technology startups entering the monitoring layer directly. Rankings could shift meaningfully if a lower-cost entrant successfully replicates premium smart monitoring features at price points established manufacturers cannot profitably match, which several are actively attempting. Several are already gaining traction in price-sensitive regional markets.
single-phase-home-standby-gensets-market-company-positioning-matrix-1788412337162

Competitive Moat and Risk Dimensions

GENERAC POWER SYSTEMS

Moat: Dealer Network Scale Advantage

Generac's extensive certified dealer network, built over decades, gives it installation coverage and brand recognition that smaller manufacturers cannot easily replicate in the near term. This dealer density lets Generac win installations even where competitors offer comparable hardware. Few competitors can match this combined distribution footprint and dealer training infrastructure built over many years.
GENERAC POWER SYSTEMS

Risk: Brand Concentration Reputation Risk

Generac's dominant brand position means any high-profile product recall or reliability issue carries outsized reputational consequences for the category as a whole, since the brand has become synonymous with the product for many consumers. Competitors have used isolated incidents to court switching customers, and Generac must maintain exceptionally consistent quality across its full product range.
KOHLER CO

Moat: Premium Reliability Brand Positioning

Kohler's long-established reputation for premium engine reliability, built across generations of engine manufacturing experience, gives it credibility with homeowners willing to pay more for perceived durability. This premium positioning lets Kohler command pricing above category averages in higher-income suburban markets where brand reputation matters considerably. Competitors without comparable premium heritage struggle to win specification in these higher-margin accounts.
KOHLER CO

Risk: Premium Pricing Competitiveness Risk

Kohler's premium positioning and higher price points leave it vulnerable to value-focused competition from manufacturers offering comparable core functionality at meaningfully lower cost. Price-sensitive middle-income buyers increasingly favor lower-cost alternatives with adequate rather than premium reliability, and Kohler has had to defend share carefully in these more commoditized segments.

Players Tracked

Prominent Players

Generac Power Systems
Kohler Co
Cummins Inc
Briggs and Stratton
Champion Power Equipment

Other Key Players

Honda Motor Co Ltd
Yamaha Motor Co Ltd
Caterpillar Inc
Eaton Corporation
DuroMax Power Equipment
Winco Inc
Firman Power Equipment
Westinghouse Outdoor Power Equipment
A-iPower Corp
Pramac SPA
Himoinsa SL
SDMO Industries
Mitsubishi Heavy Industries Ltd
Aggreko PLC
Atlas Copco AB

Recent Developments

APRIL 2025

Generac Launches Cellular-Connected Smart Monitoring Genset Line

Generac launched a next-generation genset line featuring built-in cellular connectivity and mobile app diagnostics, eliminating the need for homeowner Wi-Fi setup that had frustrated some customers during installation. Analysts view this as a meaningful differentiator ahead of the next major storm season. The line targets both retrofit and new-construction segments.
Signal: Signals accelerating smart monitoring investment among large manufacturers nationwide. Rivals are expected to follow this move quickly.
NOVEMBER 2024

Kohler Signs Utility Rebate Partnership Agreement In Texas

Kohler signed a partnership agreement with a major Texas utility to become a preferred qualifying brand under the utility's residential resilience rebate programme, granting Kohler dealers priority marketing placement in utility customer communications. The agreement covers several million eligible residential customers across the utility's service territory.
Signal: Signals growing manufacturer interest in utility rebate partnerships as a customer acquisition channel. Expect competitors to pursue similar deals.
JULY 2024

Briggs and Stratton Expands Natural Gas Model Production Capacity

Briggs and Stratton expanded natural gas model production capacity at a primary manufacturing facility to meet rising homeowner preference for uninterrupted fuel supply over propane tank refilling logistics. The expansion is expected to complete within twelve months, easing recent supply constraints. The move strengthens supply resilience across regional distribution channels.
Signal: Signals growing manufacturer investment in natural gas capacity ahead of shifting fuel preference trends. Expect peers to follow suit.

Engine Steel and Copper Cost Exposure

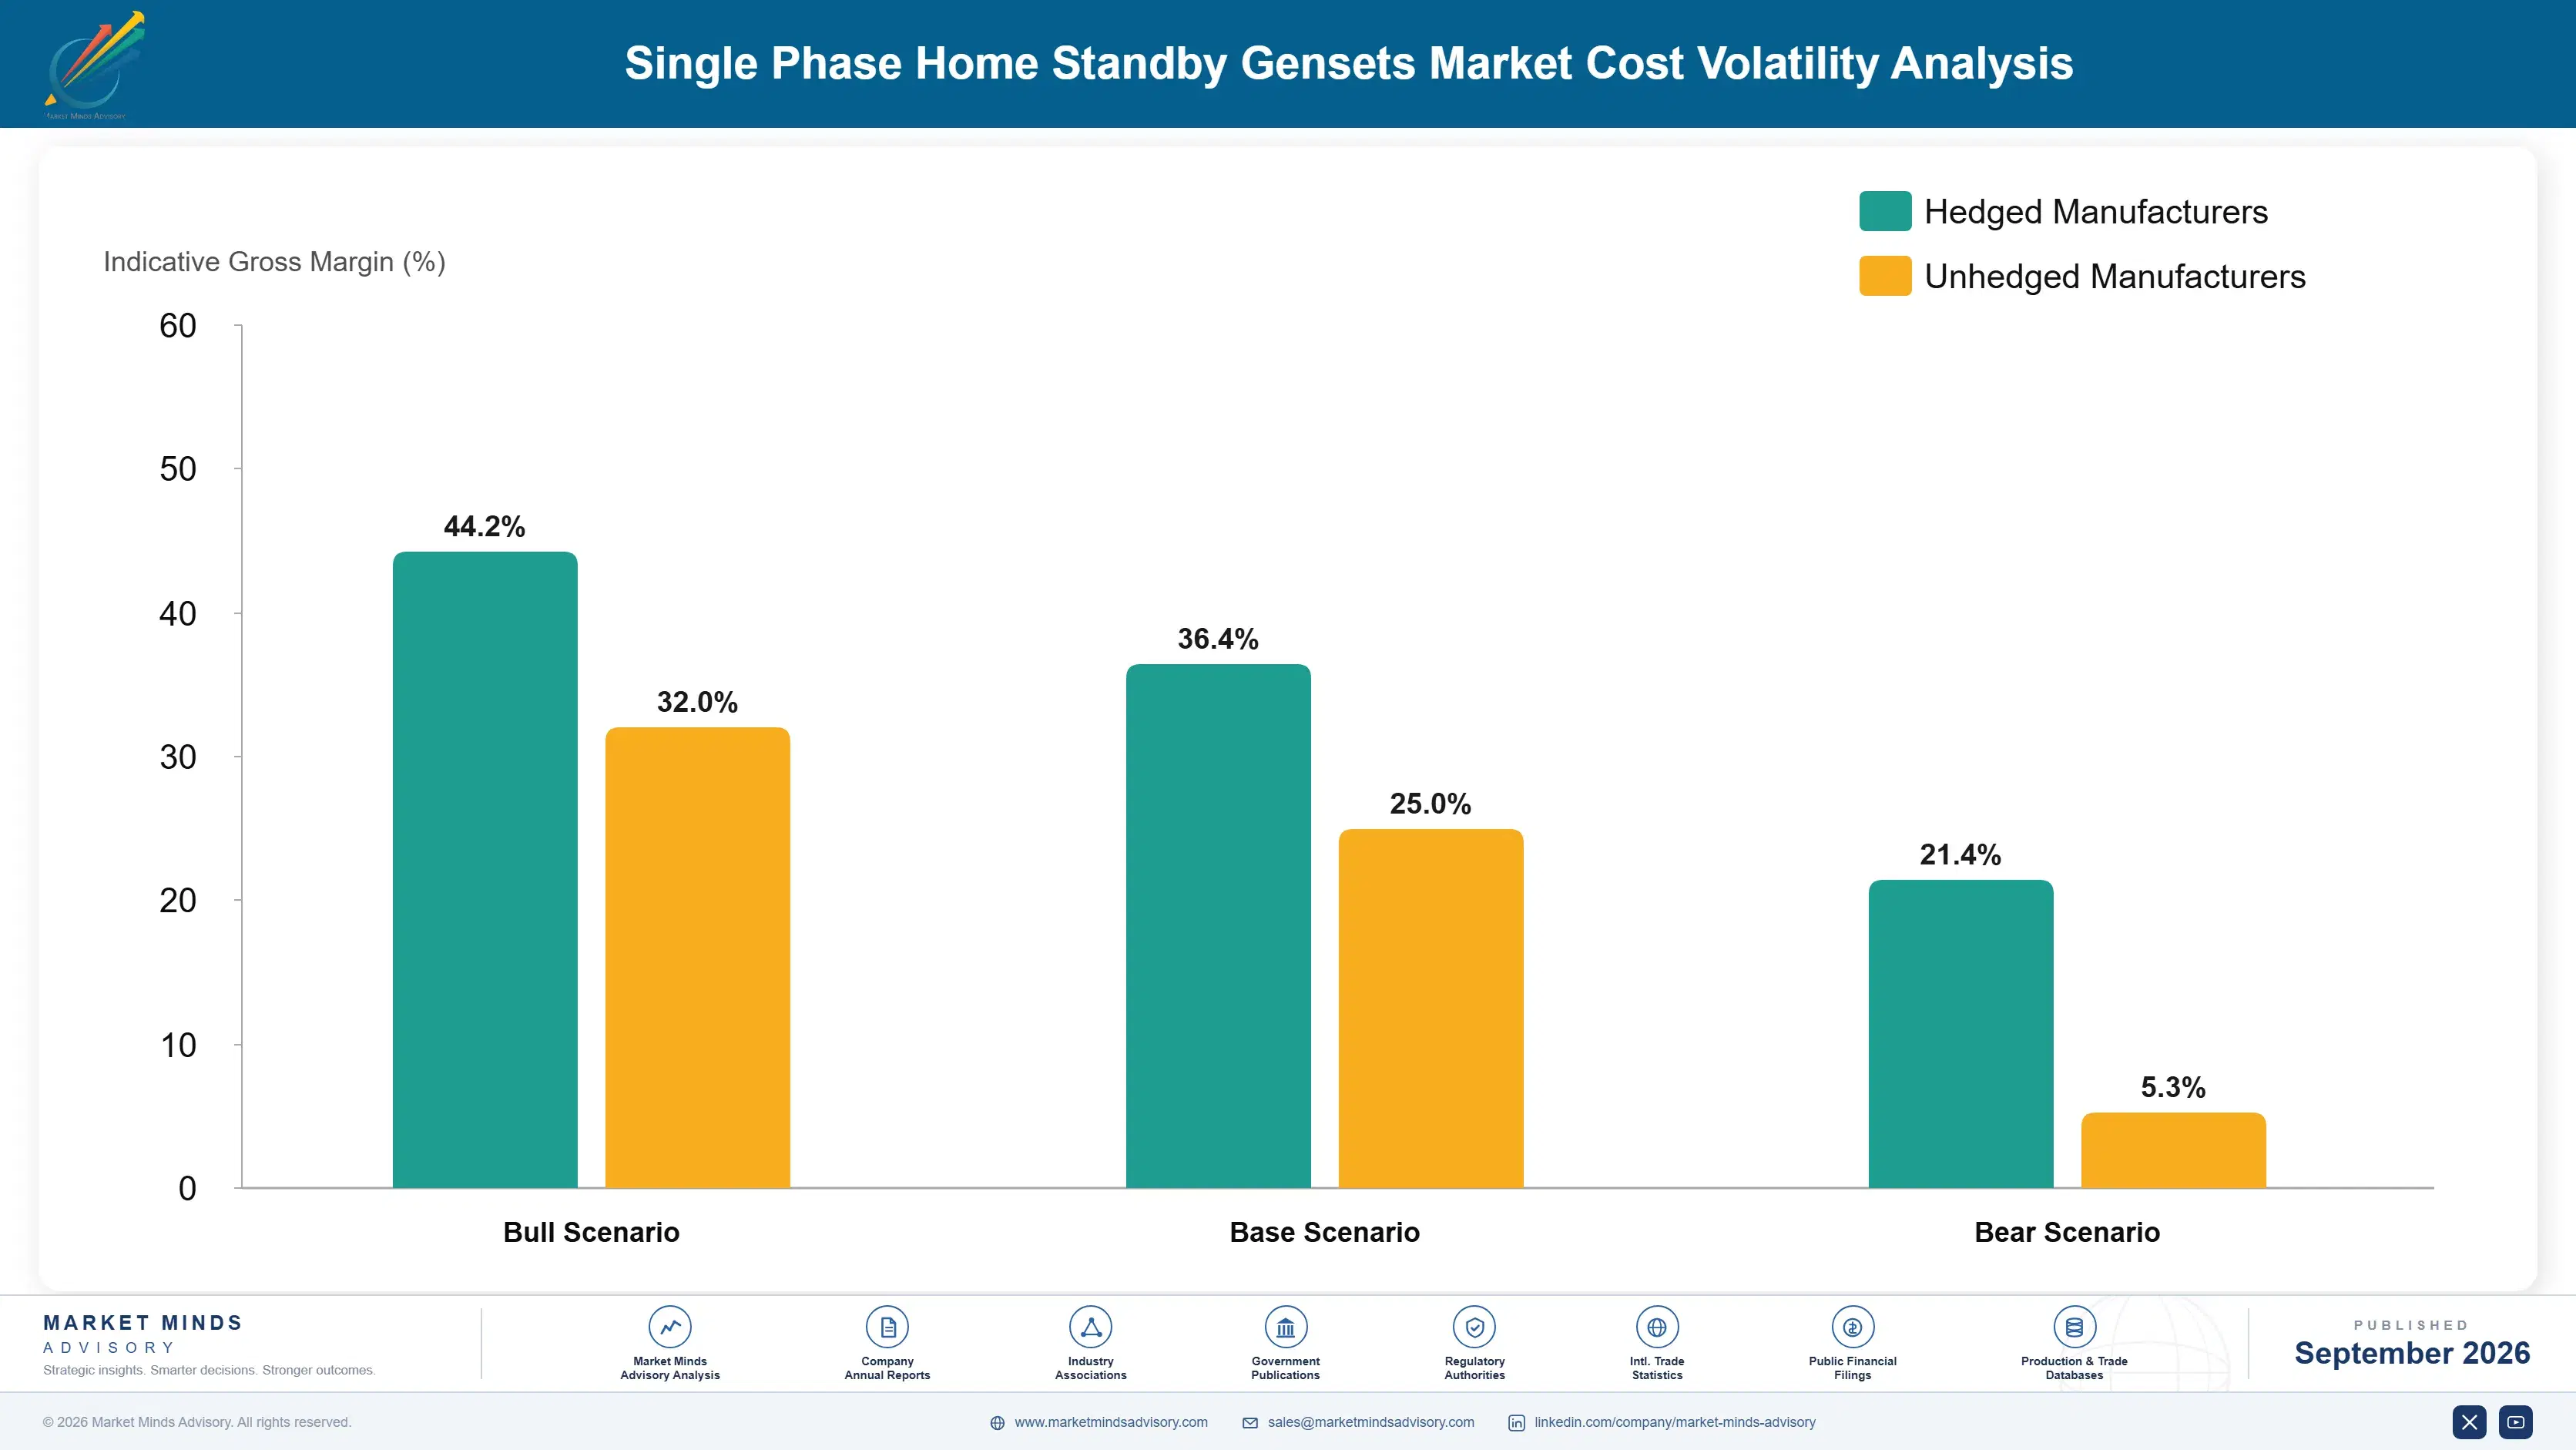
Cast iron engine blocks, copper alternator windings, and steel enclosure materials account for roughly 48 percent of unit manufacturing cost, sourced primarily from Chile, China, and domestic North American steel mills, with control electronics adding a further meaningful cost share for smart monitoring models. This concentration in a small number of mining and manufacturing regions leaves manufacturers genuinely exposed to trade policy and shipping disruption.
The 2021 to 2022 global copper price spike, documented extensively in the EIA's commodity market reporting, pushed manufacturing costs sharply higher within months, compressing manufacturer margins considerably as copper input costs rose faster than dealer contract pricing could adjust in response. Manufacturers that had pre-negotiated long-term copper supply contracts weathered the spike considerably better than those relying on spot market purchasing during the tightest months of the disruption cycle.

Cost exposure varies meaningfully by player type: large diversified manufacturers with hedging programmes and diversified sourcing absorb copper and steel price volatility more easily, while smaller regional manufacturers dependent on single-region suppliers face more direct and immediate exposure to input cost spikes without an offsetting sourcing cushion. This divergence shapes which manufacturers sustain competitive pricing without eroding margin below acceptable levels.
single-phase-home-standby-gensets-market-cost-volatility-analysis-1788412337357

Multi-Region Copper and Steel Sourcing Diversification

Manufacturers are qualifying copper and steel suppliers across multiple mining and manufacturing regions rather than depending on a single source, reducing exposure to any single country's trade policy or capacity disruption. This diversification adds modest qualification cost upfront but reduces production delay risk during future price spike cycles considerably. Adoption is spreading quickly as trade policy uncertainty grows.

Long-Term Material Supply Agreements

Larger manufacturers are locking in multi-year copper and steel pricing agreements ahead of anticipated market tightness, smoothing cost exposure across production cycles in ways smaller competitors without comparable purchasing scale generally cannot replicate. This approach proved decisive during the last major price spike cycle for prepared manufacturers. Few smaller competitors currently match this negotiating scale with upstream material suppliers.

Component Standardization Across Product Tiers

Manufacturers are standardizing engine and enclosure component designs across multiple output capacity tiers, allowing bulk component purchasing that reduces per-unit cost while preserving the ability to differentiate on connectivity and monitoring features at the finished product level. Adoption is spreading quickly across the manufacturer landscape overall. This substitutes increasingly for pure volume-based negotiation as a cost mitigation lever.

Portfolio Architecture for Margin Defence

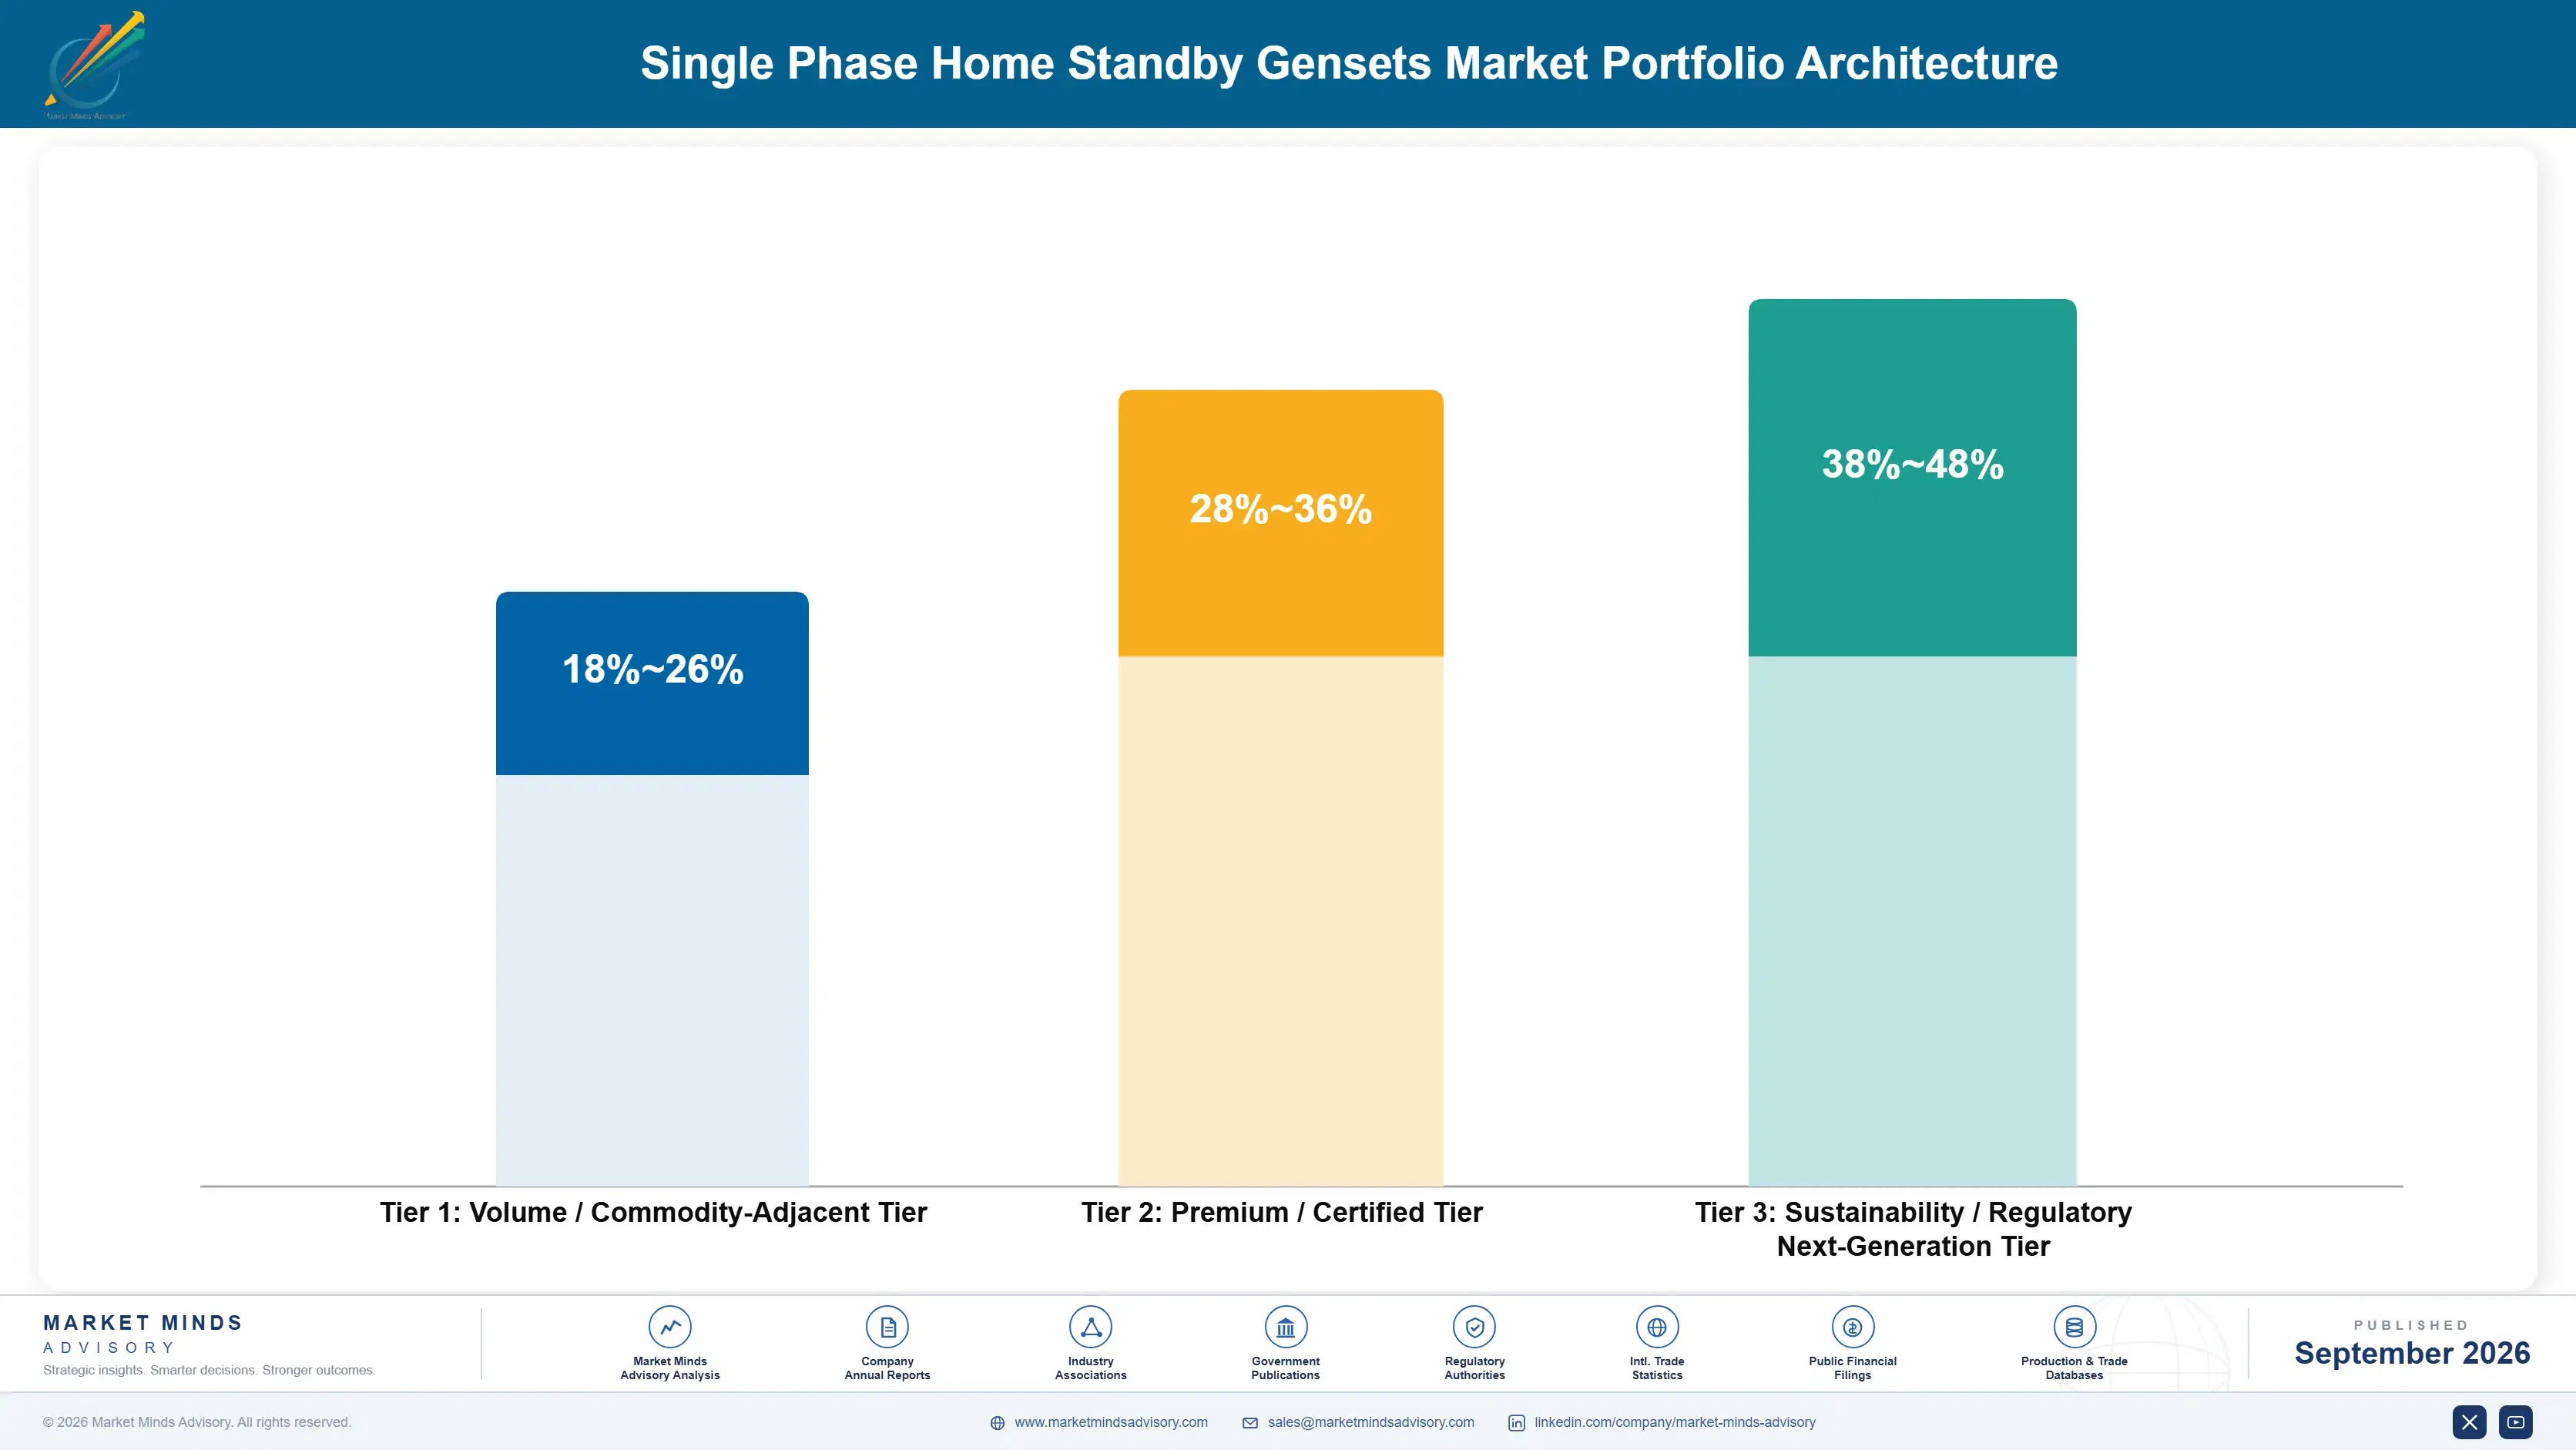
Unit production splits into three commercial tiers with distinct margin economics. Volume commodity air-cooled units sell through mass retail and basic dealer channels, sustaining moderate margins that reward manufacturing scale and price competitiveness rather than any single technical differentiator among competing manufacturers. Distribution reach and brand trust matter more than any single feature claim at this level of the market.
Premium certified smart-monitoring and natural gas units, backed by demonstrated reliability and dealer installation quality, command meaningfully wider margins by trading on connectivity and fuel convenience value rather than pure unit volume. Manufacturers serving this tier increasingly compete on app experience and installation support rather than price alone, favoring established players. These manufacturers increasingly view financing and monitoring capability as their primary defense against commodity price competition.

Sustainability and next-generation formats, including dual-fuel and cleaner-burning units addressing tightening state emissions rules, remain a smaller share of total unit volume today but carry the widest margins of the three tiers, since technical scarcity and compliance development capability still constrain competition meaningfully. High-value pools concentrate squarely within this tier and the premium tier immediately below it. That tension between volume and premium credibility defines competitive positioning across the category broadly.

Volume / Commodity-Adjacent Tier

Standard air-cooled units sold through mass retail and basic dealer channels, competing primarily on manufacturing scale and price rather than differentiated connectivity technology. Scale wins here consistently across most price-sensitive buyers.
Gross Margin: 18-26%

Premium / Certified Tier

Smart-monitoring and natural gas units with demonstrated reliability and installation quality, commanding wider margins on connectivity and fuel convenience value. Dealer trust matters most here. Installation quality also matters greatly.
Gross Margin: 28-36%

Sustainability / Regulatory / Next-Generation Tier

Dual-fuel and cleaner-burning units addressing emerging state emissions rules, where limited compliance development capability and engine scarcity sustain the widest margins across the category despite modest volume today overall currently.
Gross Margin: 38-48%
single-phase-home-standby-gensets-market-portfolio-architecture-1788412337860

High-value Sub-segments and Strategic Watch-out

High-value high-growth segment

Wi-Fi enabled smart monitoring units paired with natural gas fuel sit at the intersection of premium margin and the fastest unit volume growth, as homeowners standardize around connected platforms rather than legacy analog designs across new construction and retrofit installation projects. This is the clearest growth vector ahead.
Gross Margin: 34-42%

High-value moderate-growth segment

Extended warranty and maintenance service contracts carry strong recurring margins tied to homeowner confidence in unit reliability, though adoption grows more gradually as buyers weigh service cost against the low probability of ever needing the product during ownership. Manufacturers treat this as a durable, if slower-building, opportunity worth pursuing.
Gross Margin: 24-32%

Volume core segment

Standard air-cooled units remain the largest unit volume base across established residential markets globally, sustaining steady if unremarkable margins as the category matures and price competition among established manufacturers intensifies nationwide. Scale and dealer reach determine who wins share here overall. Adoption keeps rising steadily.
Gross Margin: 18-22%

Strategic watch-out segment

Lower-cost Asian manufacturers scaling combustion engine capability rapidly threaten to disintermediate established Western vendors over the coming decade, particularly where price-sensitive homeowners favor lower-cost alternatives over premium certified products with established warranties. Western vendors are responding through deeper dealer and financing partnerships nationwide. This shift bears close monitoring ahead.
Gross Margin: n/a

Ownership Behaves Like an Annuity

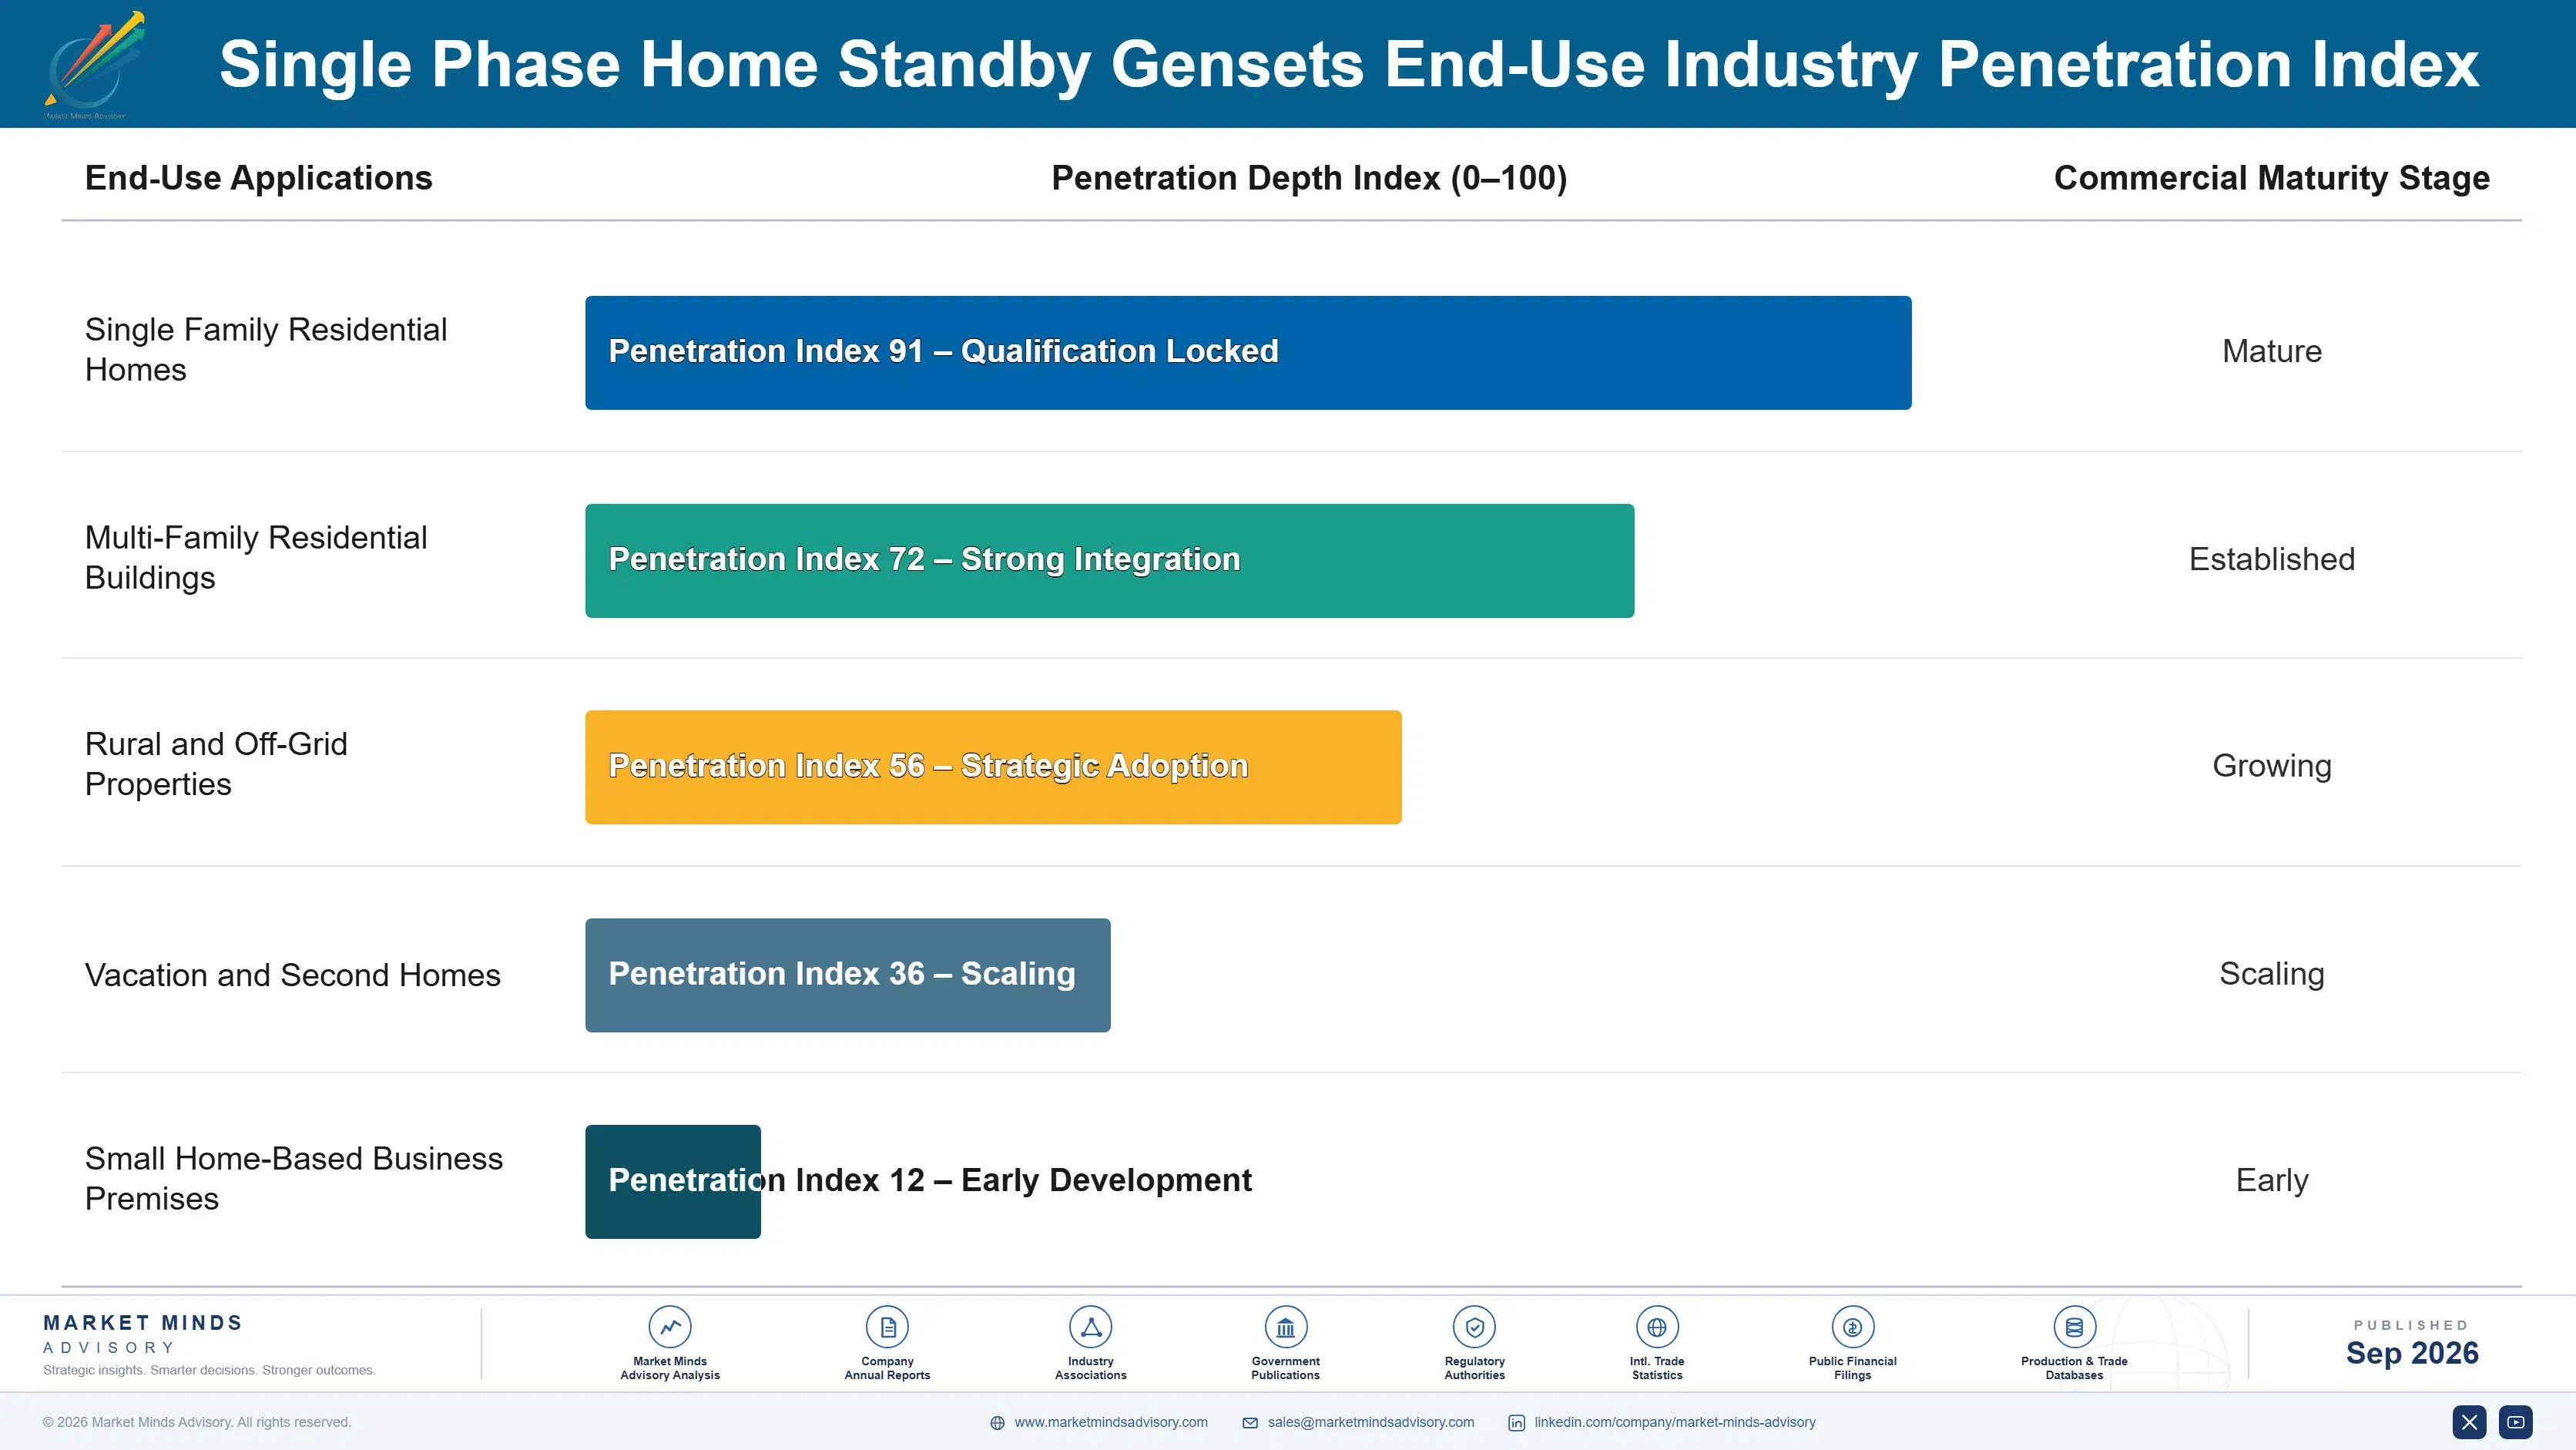
Standby gensets generate revenue well beyond the initial unit sale, since homeowners standardize maintenance schedules and service relationships around whichever dealer originally installed the unit. That locked relationship turns a single sale into a multi-year annuity across the unit's twenty-plus year service life, given the specialized technician training required for warranty-approved maintenance. Switching service providers mid-ownership carries real friction, keeping incumbent dealers entrenched.
Adoption depth varies sharply by end-use vertical. Storm-belt homeowners in hurricane and winter-storm-prone states treat backup power as essential infrastructure and pay for premium service contracts without hesitation, while homeowners in milder climates treat purchases as a more opportunistic, price-driven decision made once. Remote workers dependent on reliable connectivity sit between the two, adopting smart monitoring where uptime genuinely matters for income continuity.

Buyer profiles are shifting generationally as well. A younger cohort of homeowners, raised on smart-home apps and subscription services rather than manual mechanical maintenance, increasingly favors connected monitoring and financed ownership over outright cash purchase, even where older buyers still default to whatever dealer a neighbor originally recommended. This generational split is gradually reshaping which manufacturers win new household specification decisions going forward.
single-phase-home-standby-gensets-market-end-use-penetration-index-1788412338348

Where Manufacturers Should Focus

These are among the four positions where our research anticipates prominent divergence between winners and laggards over the coming forecast period. Each is grounded in the demand model, the regulatory perimeter, and the announced capacity pipeline.
01 / FINANCING PROGRAM INVESTMENT PRIORITY

Build proprietary financing capability before third-party lenders capture the margin

Financing programmes already command the widest margins in the category, and that gap is widening as homeowners increasingly treat monthly payments as essential to making the purchase feel affordable rather than a discretionary convenience layered on top. Manufacturers without proprietary financing capability risk losing that margin entirely to third-party lenders within the next several years, since financed customers already represent a growing share of total unit sales. Building that capability now, ahead of full market consolidation, converts a technical investment into a lasting margin advantage.
02 / SMART MONITORING DEVELOPMENT STRATEGY

Invest in connectivity capability before homeowner expectations fully shift

Smart monitoring capability increasingly determines purchase decisions in the residential segment, more so than raw output capacity alone in most competitive sales consultations across the entire category and its adjacent applications today. Manufacturers that demonstrate superior app reliability in field deployments capture premium pricing that price-focused competitors cannot match, since homeowners increasingly value peace-of-mind monitoring over marginal price differences alone when comparing options. This advantage compounds as smart-home integration continues expanding across the broader category and its many installed applications nationwide today.
03 / DEALER NETWORK EXPANSION STRATEGY

Expand dealer coverage before competitors lock in installation territories

Dealer network density increasingly determines long-term market share more than the initial product specification itself, since homeowners value installation proximity and reputation over marginal price differences between otherwise comparable competing units nationwide. Manufacturers that build this dealer capability now secure a durable distribution relationship that compounds across each territory's entire multi-decade demand cycle, well beyond the original market entry decision itself. Competitors without comparable dealer infrastructure increasingly find themselves locked out of new territory expansion entirely going forward across the industry.
04 / EMISSIONS COMPLIANCE POSITIONING STRATEGY

Build cleaner-burning engine expertise before regulation mandates it outright

State regulators increasingly require documented emissions compliance for new standby genset registration approval, a trend that will intensify as air quality regulation expands across additional states and jurisdictions nationwide and internationally in coming years. Manufacturers that establish cleaner-burning engine capability now avoid future exclusion from this fast-growing regulated segment that increasingly requires documented compliance performance before any product launch. This positioning advantage compounds as smaller competitors scramble to build comparable capability later, under considerably greater time pressure and cost than early movers face today.

Engagement Snapshot From the Field

A live engagement with an industry participant carrying material or product regulatory and market exposure ahead of a defining policy shift, showing how our research translates into a defensible multi-year portfolio strategy.
MARKET MINDS ADVISORY · CLIENT ENGAGEMENT SUMMARY
Single Phase Home Standby Gensets Producer Strategic Portfolio Review and Transition Roadmap 2026·Investment Scenario on Single Phase Home Standby Gensets Exposure Evaluation 2025-26
CLIENT PROFILE
The client operates a regional dealer network installing residential standby gensets across several storm-prone states, with annual unit sales in the low thousands and revenue in the tens of millions of dollars (client-reported, unverified by MMA). The dealer had historically relied entirely on third-party lenders for customer financing without a proprietary payment programme of its own.
STRATEGIC CHALLENGE
Rising customer acquisition costs and shrinking margin on third-party financed sales forced the dealer to reconsider its financing strategy entirely and quickly. Management needed to decide whether to launch a proprietary financing programme, continue relying on third-party lenders, or pursue a hybrid approach offering both options depending on customer credit profile and preference.
MMA APPROACH
MMA conducted structured interviews with the dealer's sales and finance leadership alongside a benchmarking exercise against four peer regional dealers' financing structures and lender relationships across comparable storm-prone markets. The engagement combined primary qualitative interviews with MMA's proprietary standby genset market dataset to assess financing margin capture, approval rates, and total customer acquisition cost under each option.
KEY FINDINGS
  1. Proprietary financing captured an estimated 11 percent additional margin per unit sold compared to third-party lender arrangements the dealer previously used exclusively company-wide.
  2. Peer dealers offering proprietary financing reported measurably higher close rates than those relying solely on third-party lender referral programmes every single month.
  3. Full proprietary financing conversion would have required capital reserve investment the engagement estimated at several months beyond the dealer's available cash position.
  4. Dealers that launched hybrid financing offering both options first captured most of the margin benefit at a fraction of full conversion risk.
CLIENT PROFILE
The client operates a regional dealer network installing residential standby gensets across several storm-prone states, with annual unit sales in the low thousands and revenue in the tens of millions of dollars (client-reported, unverified by MMA). The dealer had historically relied entirely on third-party lenders for customer financing without a proprietary payment programme of its own.
STRATEGIC CHALLENGE
Rising customer acquisition costs and shrinking margin on third-party financed sales forced the dealer to reconsider its financing strategy entirely and quickly. Management needed to decide whether to launch a proprietary financing programme, continue relying on third-party lenders, or pursue a hybrid approach offering both options depending on customer credit profile and preference.
MMA APPROACH
MMA conducted structured interviews with the dealer's sales and finance leadership alongside a benchmarking exercise against four peer regional dealers' financing structures and lender relationships across comparable storm-prone markets. The engagement combined primary qualitative interviews with MMA's proprietary standby genset market dataset to assess financing margin capture, approval rates, and total customer acquisition cost under each option.
KEY FINDINGS
  1. Proprietary financing captured an estimated 11 percent additional margin per unit sold compared to third-party lender arrangements the dealer previously used exclusively company-wide.
  2. Peer dealers offering proprietary financing reported measurably higher close rates than those relying solely on third-party lender referral programmes every single month.
  3. Full proprietary financing conversion would have required capital reserve investment the engagement estimated at several months beyond the dealer's available cash position.
  4. Dealers that launched hybrid financing offering both options first captured most of the margin benefit at a fraction of full conversion risk.
RECOMMENDED STRATEGY
Phase 1: Phase 1 (Months 1-3): Launch proprietary financing for the highest-credit-tier customer segment first, identified through detailed historical loan approval and default rate trend data. Phase 2: Phase 2 (Months 4-9): Evaluate portfolio performance carefully and expand proprietary financing eligibility to additional credit tiers based on demonstrated default rates and cost. Phase 3: Phase 3 (Months 10-18): Negotiate a comprehensive capital reserve facility supporting full proprietary financing conversion over the following full fiscal year and beyond overall.
OUTCOME
Within eighteen months of implementation, the dealer reported an increase in overall sales margin tied to financing capture of approximately 9 percent (client-reported, unverified by MMA). The phased approach also demonstrated sufficient default rate control to justify expanded capital reserve allocation, and the dealer has since committed to a fully proprietary financing model across its entire customer base.

Frequently Asked Questions

Foundational context covering the market sizes, CAGR, scope, country, region and competition that inform every finding below. This section is provided to cover basics and most often pre-purchase conversations, answered from the MMA Primary Research Dataset.

What is the current size of the Single Phase Home Standby Gensets Market?

The Single Phase Home Standby Gensets Market reached an estimated 3.6 billion dollars in 2025. Growth is driven by rising extreme weather frequency and expanding dealer financing across major storm-affected regions.

How large will the Single Phase Home Standby Gensets Market be by 2036?

MMA projects the market will reach approximately 7.9 billion dollars by 2036 under the base case scenario. This represents more than double the 2026 opening value over the ten year forecast window.

What is the CAGR for the Single Phase Home Standby Gensets Market 2026 to 2036?

The base case compound annual growth rate is 7.4 percent across the forecast period. Bull and bear scenarios range from 8.6 percent to 6.2 percent depending on grid reliability trends.

Which segment is growing fastest?

Wi-Fi Enabled Smart Monitoring Gensets is the fastest growing segment, expanding at 11.5 percent annually. That is roughly 1.55 times the overall market growth rate through 2036.

Who are the major companies in the Single Phase Home Standby Gensets Market?

Leading participants include Generac Power Systems, Kohler Co, Cummins Inc, Briggs and Stratton, and Champion Power Equipment. Together these five companies hold a combined production share estimated near 58 percent.

Which country is growing fastest?

Australia is the fastest growing country market, supported by rising bushfire-related grid stress and summer heatwave outages. Demand is further reinforced by growing homeowner insurance incentives for documented backup power.

Report Segmentation Architecture

The full report scope spans multiple orthogonal segmentation dimensions, with cross-tabulated demand data provided for each dimension pair. Coverage extends further to regional breakdowns, trend trajectories, and the competitive detail needed to support segment-level decision-making.

By Primary Market Dimension

  • Natural Gas Fueled Gensets
  • Propane Fueled Gensets
  • Diesel Fueled Gensets
  • Wi-Fi Enabled Smart Monitoring Gensets
  • Dual-Fuel Gensets
  • Standard Analog Gensets

By End-Use Industry

  • Single Family Residential Homes
  • Multi-Family Residential Buildings
  • Rural and Off-Grid Properties
  • Vacation and Second Homes
  • Small Home-Based Business Premises

By Commercial Dimension

  • Direct Retail Purchase
  • Dealer Financed Purchase
  • Utility Rebate Program Purchase
  • New Construction Builder Installation

By Region

  • North America
  • Western Europe
  • East Asia
  • South Asia and Pacific
  • Latin America
  • Middle East and Africa
  • Eastern Europe

Scope, Methodology, and Coverage

Every figure in this report is reproducible from documented input assumptions. The scope below maps the historical period, the forecast horizon, the segmentation dimensions, and the countries covered, alongside the underlying primary and qualitative methodology.
Historical Period
2020 to 2025
Forecast Period
2026 to 2036
Base Year
2025 (USD billions; MMA Primary Research Dataset, September 2026)
Market Definition
This market covers automatic standby generators rated for single phase residential electrical service, including the generator, automatic transfer switch, and enclosure sold as an installed system. It excludes portable generators without automatic transfer capability and three phase commercial or industrial standby systems.
Quantitative Units
USD billions (current prices); unit shipment volume where noted
Segmentation Dimensions
By Primary Market Dimension; By End-Use Industry; By Commercial Dimension; By Region
Regions Covered
North America, Western Europe, East Asia, South Asia and Pacific, Latin America, Middle East and Africa, Eastern Europe
Countries Covered
USA, China, Germany, France, UK, Japan, South Korea, India, Australia, Canada, Brazil, Mexico, Indonesia, Vietnam, Thailand, Malaysia, UAE, Saudi Arabia, South Africa, Nigeria, Turkey, Poland, Netherlands, Italy, Spain, Sweden, Switzerland, Argentina, Colombia, Singapore, and additional markets relevant to this sector
Key Companies Profiled
Generac Power Systems, Kohler Co, Cummins Inc, Briggs and Stratton, Champion Power Equipment, Honda Motor Co Ltd, Yamaha Motor Co Ltd, Caterpillar Inc, Eaton Corporation, DuroMax Power Equipment, Winco Inc, Firman Power Equipment, Westinghouse Outdoor Power Equipment, A-iPower Corp, Pramac SPA, Himoinsa SL, SDMO Industries, Mitsubishi Heavy Industries Ltd, Aggreko PLC, Atlas Copco AB
Quantitative Methodology
Primary survey, n=3,800 respondents, Q4 2025, six countries; demand-side model with trade association cross-validation
Qualitative Methodology
47 expert interviews, Q4 2025; applied to validate demand model assumptions, identify emerging dynamics, and assess competitive positioning
Report Format
PDF and XLSX data workbook (Word format preview document)
Publisher
Market Minds Advisory
Report Code
MMA-2026-ENE-155
Published
September 2026
Contact
sales@marketmindsadvisory.com | www.marketmindsadvisory.com

Purchase the full Single Phase Home Standby Gensets Market Report (2026 to 2036).

This report provides comprehensive analysis of the Single Phase Home Standby Gensets Market, covering size, forecasts, segmentation, and regional dynamics through 2036. It examines competitive positioning among leading manufacturers, input cost exposure across the copper and steel supply chain, and portfolio economics across volume, premium, and sustainability tiers. The analysis draws on primary survey data covering 3,800 respondents and 47 expert interviews conducted in the fourth quarter of 2025. Buyers receive a complete strategic view suitable for investment planning, procurement strategy, and competitive benchmarking decisions.
Full ten-year market and segment forecasts through 2036
Regional analysis across all seven MMA-tracked geographies
Competitive benchmarking of top five and fifteen additional players
Copper and steel input cost exposure analysis
Revenue lever framework tied to quantified commercial impact
Anonymised dealer network case study with recommended strategy phasing

Built For The People Who Decide

From boardroom strategy to bench-side execution, this report is read cover-to-cover by leaders shaping the next decade of their industry, turning demand scenarios, market dynamics and valuation benchmarks into decisions.
CXOs/ Presidents/ VPs/ Managers
M&A and Corporate Development
Strategy Teams and R&D Heads
Procurement and Product Directors
Regulatory and Compliance Leaders
Investor Relations and Equity Analysts