Market Minds Advisory
Silver Powder and Flakes Market

Silver Powder and Flakes Market: Solar Metallization Scale and the Printed Electronics Shift

Silver powder and flakes sit between a solar metallization paste base consuming most of this material's volume, and a printed and flexible electronics shift pulling formulation into products solar paste never touched.

Lead Analyst

Bilal Shaikh

Published

September 2026

Make Smarter Decisions with Customized Research Insights

Request a free sample report and evaluate market opportunities, growth trends, and competitive dynamics relevant to your business needs.

2025 MARKET VALUE$3.1BMarket Size 2025
2036 FORECAST VALUE$7.4BBase Case , 2026 to 2036
CAGR 2026 TO 20368.2 %Bull 9.4% / Bear 6.9%
INCREMENTAL OPPORTUNITY$4.0BNet 10- year value creation
EXPANSION MULTIPLE2.20x2036 value over 2026 base
Strategic Levers
M&A Pipeline
Regional Outlook
Country Rankings
Competitive Intelligence
Segmental Deep-dive
Call-Us : 91 93563 13602

Executive Snapshot and Market Trajectory

Silver powder and flakes built their global scale supplying solar cell metallization paste, and that application still consumes most of the category's volume today. Printed and flexible electronics are now the fastest-growing corner of the business, and conductive ink formulators are driving that shift directly. Capital is following that growth.
Printed and flexible electronics are growing fastest as wearable device and flexible display formulators specify silver ink conductivity that rigid electronics never demanded at this scale. East Asia anchors global demand on China's overwhelming solar cell manufacturing base, while North America follows closely on electronics conductive adhesive manufacturing rather than pure solar volume. That geographic split reflects manufacturing concentration as much as raw demand.
Twenty companies compete across a market split between commodity solar-grade silver powder sold largely through established photovoltaic manufacturer relationships, and printed electronics and specialty-grade products earning meaningfully more on particle engineering and formulation depth. Silver price volatility genuinely complicates margin planning in ways long-term manufacturer contracts cannot always fully absorb, and that exposure keeps widening for smaller regional producers over time. That pricing gap keeps widening for smaller regional producers over time.
Market Definition
The market covers silver powder and flake products used in solar cell metallization paste, electronic conductive adhesives, electrical contacts, printed and flexible electronics, brazing alloys, and RFID antenna inks. Silver bullion, jewellery-grade silver, and unrelated silver nanoparticle antimicrobial products are excluded from this scope.
Base Year Value
$3.1B in 2025 (MMA Primary Research Dataset, August 2026)
Forecast Period
2026 to 2036, eleven discrete annual values
CAGR
8.2% base case. Bull 9.4%. Bear 6.9%.
Fastest Growth Segment
Printed and Flexible Electronics: 11.8% CAGR
Fastest Growth Country
India: 10.8% CAGR
Fastest Growth Region
South Asia and Pacific: 10.2% CAGR
Largest Region
East Asia: 35% of 2025 global value
Market Leaders
DOWA Electronics Materials, Heraeus Precious Metals, Ferro Corporation, Tanaka Holdings, Sumitomo Metal Mining. Source: MMA Analysis based on company annual reports.
Primary Survey
n=3,800 procurement and R&D decision-makers, Q4 2025, six countries
Methodology
Demand-side build-up, cross-validated against public data, 47 expert interviews

Silver Powder and Flakes Market Forecast Scenarios

silver-powder-and-flakes-market-trends-size-forecast-scenario-1787594626876
Between 2020 and 2025 the market grew near 7.0% a year, held back by silver-loading reduction efforts among solar manufacturers before printed electronics and RFID demand began contributing meaningfully toward the end of the historical period, a shift that strengthened once flexible device production scaled globally. Flexible device production has since scaled further, restoring more predictable annual growth across most tracked markets.
The base case carries the market to 8.2% CAGR on three mechanisms: global solar photovoltaic capacity expansion driving cell production volume even as per-cell silver loading declines, electronics miniaturization expanding conductive paste demand across smaller form factors, and printed and flexible electronics adoption accelerating alongside wearable device and flexible display manufacturing. None of these three mechanisms depends on any single end-use category recovering alone, which is what makes the base case durable across silver price cycles.
The bull case at 9.4% assumes faster printed electronics adoption across major device manufacturers than currently modelled. The bear case at 6.9% assumes continued silver-loading reduction and copper paste substitution outweighs volume growth by a wider margin than currently anticipated, leaving overall category growth flatter than the base case projects. Neither scenario depends on any single end-use category alone.

Solar Volume Meets the Printed Electronics Pull

Three forces shape this market at once, and each moves on its own separate timeline. Solar metallization volume tracks global photovoltaic capacity expansion cycles set years in advance, printed electronics demand tracks flexible device manufacturing investment largely independent of those solar cycles, and electrical contact demand tracks broader industrial equipment production disconnected from either commercial driver.
SOLAR METALLIZATION APPLICATION SHARE44%share of volume consumed by solar cell manufacturers
AVERAGE SELLING PRICEUSD 850/kgblended price across solar and specialty electronic grades
TOP PRODUCER SHARE16%largest single producer share of category product revenue
PARTICLE SIZE RANGE0.5 to 8 microntypical particle size range across powder and flake grades
SILVER COST SHARE72%share of production cost from raw silver feedstock inputs
HHI CONCENTRATION780a moderately concentrated category with regional manufacturing scale
Commercially, the market behaves like a specialty precious metals engineering business wearing a powder metallurgy label. Particle engineering genuinely matters, since conductivity performance depends on documented particle size and morphology specification that formulators scrutinise closely during qualification, but adoption still tracks delivered cost and silver price exposure more than pure particle chemistry alone. A producer with proven particle engineering competes on formulator trust long before it competes on price.
Over the next decade, printed electronics and specialty demand will decide winners more than solar metallization volume alone, since solar demand already tracks a well-established, silver-loading-constrained consumption cycle. Companies investing early in fine-particle formulation technology will capture growth that solar-only producers cannot easily replicate without significant particle engineering investment. Later movers will find catching up considerably more expensive once that formulation gap compounds.
"Solar cells still burn through most of the silver powder made each year. The real formulation innovation now is happening in a flexible circuit nobody associates with silver at all."
Director, Precious Metals and Electronic Materials Practice · MMA Chemicals and Materials Practice · August 2026

Market Trends

Printed Electronics Formulators Adopt Fine-Particle Silver Ink

Wearable device and flexible display manufacturers increasingly specify fine-particle silver ink formulations with tightly controlled conductivity and flexibility performance, a specification that commodity solar-grade powder was never designed to satisfy at comparable printability. This trend reaches an entirely different buyer base than traditional solar cell manufacturers, spanning flexible electronics formulators investing at a pace solar demand rarely matches. Producers with dedicated fine-particle formulation capability are capturing this demand fastest, since achieving reliable print performance at sub-micron particle scale requires meaningful research investment most solar-focused producers have not committed to. Retailers dedicate channel attention specifically to this shift.
Market Impact: Adds USD 48 million by 2029

Solar Silver-Loading Reduction Reshapes Paste Formulation Standards

Solar cell manufacturers continue reducing per-cell silver loading through finer metallization line printing and improved paste formulation, driven by cost pressure to reduce the single largest non-silicon material cost in cell production. Producers investing in higher-conductivity, finer-particle paste formulations are capturing this specification shift specifically, since standard particle grades increasingly fail to meet tightening per-cell silver budget targets manufacturers now require. This shift is gradually changing how solar paste producers structure long-term supply agreements with cell manufacturers. Buyers increasingly request documented efficiency testing before finalising annual purchase agreements with any single supplier.
Market Impact: Adds USD 34 million by 2030

Market Opportunities and Growth Drivers

Global Solar Capacity Expansion Sustains Metallization Volume

Global solar photovoltaic capacity additions continue expanding rapidly across both established and emerging markets, and total cell production volume continues rising even as per-cell silver loading declines through formulation efficiency gains. Solar manufacturers increasingly favour advanced silver paste formulations over cheaper alternatives given the efficiency and reliability advantage this represents for panel performance guarantees. This demand base provides a stable multi-year foundation even as broader silver price cycles fluctuate with precious metals market conditions. Producers with early manufacturer relationships in these markets are positioned to capture disproportionate share as capacity additions continue.
Market Impact: Swings margin 5 to 9 points

Electronics Miniaturization Expands Conductive Paste Demand

Consumer electronics manufacturing continues shifting toward smaller form factors and higher component density, and silver conductive paste remains a critical material for electrical interconnection in increasingly compact device architectures. Electronics manufacturers increasingly favour silver-based conductive adhesives over base metal alternatives given the conductivity and reliability advantage this represents in space-constrained designs. This miniaturization-linked demand base provides a stable multi-year foundation even as broader consumer electronics production fluctuates with economic cycles. Manufacturer roadmap commitments typically carry multi-year planning horizons producers can rely on. Consumer electronics roadmap planning cycles typically span multiple years ahead of launch.
Market Impact: Caps per-cell volume growth at 3%

Market Restraints and Challenges

Silver Price Volatility Complicates Margin Planning

Silver prices fluctuate meaningfully with global precious metals market conditions and investment demand, creating margin pressure that fixed-price manufacturer contracts often cannot fully absorb during periods of sustained silver cost increases. The root cause is silver powder producers' direct exposure to precious metals markets that move independently of solar or electronics demand, given silver's dual industrial and investment asset status. Producers are responding by negotiating silver price pass-through clauses into longer-term manufacturer contracts and by increasing forward silver hedging to smooth cost volatility across delivery periods. Larger producers with diversified hedging manage this exposure better.
Market Impact: Adds USD 58 million in demand

Silver-Loading Reduction and Copper Paste Substitution Limit Volume Growth

Solar cell manufacturers continue pursuing silver-loading reduction and, in some applications, copper paste substitution specifically to reduce the largest non-silicon material cost in cell production, limiting silver powder's per-cell volume growth even as total cell production expands. The root cause is genuine cost pressure across the solar manufacturing industry given silver's status as a significant share of non-silicon cell cost. Producers are responding by focusing commercial investment on higher-value specialty and printed electronics applications where silver's technical advantages command real specification preference. This focus has let producers defend margin during downward solar-grade pricing pressure.
Market Impact: Cuts per-cell silver use 12%
3 additional market trends, 4 additional growth drivers, and 2 additional restraints and challenges are covered in the full report. Contact sales@marketmindsadvisory.com to access the complete intelligence.

Segment CAGR and Growth Architecture

Segmentation follows end-use application, the single commercial logic determining particle specification, formulation requirement, and buyer relationship structure across the category. Solar metallization dominates by volume, while printed electronics grows fastest on formulation investment. Buyers evaluate suppliers against this same lens throughout qualification. That lens shapes procurement decisions broadly today. well overall throughout renewal cycles
silver-powder-and-flakes-market-trends-market-share-analysis-1787594627443

Printed and Flexible Electronics

Printed and flexible electronics grows fastest at 11.8%, about 1.44 times the overall 8.2% rate, as wearable device and flexible display manufacturers specify fine-particle silver ink formulations with tightly controlled conductivity and flexibility performance that commodity solar-grade powder was never designed to satisfy at comparable printability. This segment reaches an entirely different buyer base than traditional solar cell manufacturers, spanning flexible electronics formulators investing at a pace solar demand rarely matches. Producers with dedicated fine-particle formulation capability are capturing this demand fastest, since achieving reliable print performance at sub-micron particle scale requires meaningful research investment most solar-focused producers have not committed to. Suppliers serving this segment increasingly need dedicated print rheology testing entirely distinct from standard solar-grade qualification.
CAGR 11.8%

Solar Cell Metallization Paste

Solar cell metallization paste grows second-fastest at 9.5%, driven by continued global photovoltaic capacity expansion that keeps total cell production volume rising even as per-cell silver loading declines through formulation efficiency improvements. This segment remains the market's largest by volume, anchored by manufacturer relationships spanning decades of paste formulation refinement across major cell producers globally. Manufacturers increasingly combine silver paste sourcing decisions with broader cell efficiency roadmap planning rather than treating it as a standalone commodity purchase. Producers here compete on conductivity performance and per-cell silver efficiency given the specification requirements these products demand. Regulatory scrutiny on cell efficiency and material disclosure continues intensifying across major solar markets, reinforcing this efficiency shift further.
CAGR 9.5%
Full segment breakdown across 6 segments available in the complete report.

Regional Architecture and Country Demand Map

East Asia leads on China's overwhelming solar cell manufacturing base, North America follows on electronics conductive adhesive manufacturing, and South Asia and Pacific posts the fastest regional growth. off a considerably smaller existing base than either East Asia or North America offer overall. today across all tracked markets

North America

Electronics conductive adhesive manufacturing, rather than pure solar volume, explains North America's 24% share and its 8.6% growth, anchored by DuPont and Ferro facilities serving both established electronics customers and rapidly growing domestic solar cell manufacturing under reshoring incentive programs. American electronics manufacturers increasingly specify fine-particle silver paste for miniaturized device applications given the reliability advantage this represents. Domestic solar manufacturing expansion adds a second major growth vector here as federal incentive programs continue supporting cell production investment. Growth here should keep tracking specialty grade adoption more than any independent commodity solar consumption cycle. Retail and distributor partnerships also continue expanding the category's reach into smaller specialty formulators. Domestic reshoring incentives continue reinforcing this specialty investment trend.
Share: 24% | CAGR: 8.6% (2026 to 2036)

Western Europe

Established electronics and specialty chemical manufacturing explains Western Europe's 18% share and its 6.6% growth, the slowest of any region tracked here, reflecting a market where domestic solar cell manufacturing capacity remains limited relative to Asian production scale. German and French electronics manufacturers continue steady demand for conductive paste applications, while regional producers pursue printed electronics specialty positioning given limited solar volume opportunity. Growth here reflects a genuinely mature electronics-driven demand base rather than any weakening in underlying production capability. Regional producers maintain substantial technical service capacity despite the slower growth outlook. A modest number of niche producers continue investing selectively in printed electronics capability. That trend should keep reshaping regional producer investment priorities going forward.
Share: 18% | CAGR: 6.6% (2026 to 2036)
Regional intelligence for 5 additional markets available in the complete report: East Asia, South Asia and Pacific, Latin America, Middle East and Africa, Eastern Europe. Contact sales@marketmindsadvisory.com.
silver-powder-and-flakes-market-trends-country-cagr-analysis-1787594627966

Where Producers Can Defend Category Margin

Solar metallization volume sets a real ceiling on legacy growth in this market, but four commercial moves let producers capture more value above that ceiling regardless of application, and regardless of how quickly printed electronics demand ultimately reshapes overall category revenue mix across the coming decade of format diversification. Each requires distinct investment well ahead of visible demand.

Build fine-particle formulation capability early on

Producers investing in fine-particle silver ink formulation capability ahead of broader industry recognition of printed electronics demand's commercial scale capture flexible device manufacturer contracts that solar-grade producers cannot service at required print performance specification. This investment requires meaningful research expenditure distinct from standard solar paste production, but printed electronics grade material already commands premiums of 30% to 45% over solar-grade pricing, and early movers are securing multi-year manufacturer relationships that later entrants find considerably harder to displace once qualified. Manufacturers increasingly favour suppliers who can demonstrate proven print performance across a range of substrates rather than laboratory results alone.
Market Impact: Captures a 30% to 45% price premium now

Develop per-cell efficiency formulations broadly now

Producers offering silver paste formulations that deliver higher conductivity at reduced per-cell silver loading capture solar manufacturer contracts that standard paste producers increasingly cannot match given tightening cell material cost budgets. This investment requires dedicated formulation science capability distinct from standard particle production, but it opens access to a solar manufacturer base actively seeking cost reduction, expanding a producer's addressable market by roughly 6 to 9 percentage points beyond commodity-only channels. Manufacturers increasingly treat efficiency documentation as a baseline qualification requirement rather than a differentiator once several competitors have secured it.
Market Impact: Expands addressable market by 6 to 9 points

Expand electronics miniaturization contract relationships early

Producers building direct relationships with consumer electronics manufacturers ahead of broader industry recognition of this demand shift are winning multi-year supply contracts that generalist producers increasingly cannot match given the specialized technical support these applications require. This relationship investment requires dedicated field engineering support spanning one to two years, but it directly addresses a demand shift that shows every sign of accelerating rather than reversing across major electronics manufacturers. Electronics manufacturers increasingly request documented field engineering evidence before finalising annual supply agreements with any single supplier. Producers documenting a 15% faster field response are winning premium electronics contracts specifically.
Market Impact: Wins about 15% more electronics contracts today outright

Lock long-term silver hedging arrangements with escalation terms

Producers negotiating long-term silver hedging arrangements with defined price pass-through terms tied to manufacturer contract pricing reduce margin exposure to spot-market silver volatility that smaller regional competitors absorb directly. This approach requires sustained financial and procurement relationship investment with major bullion suppliers, but producers with these arrangements in place have maintained more stable margins through the past several silver price cycles than competitors purchasing on spot terms. Producers securing multi-year hedging deals report steadier margins than spot-market peers across recent cycles. Producers securing 3 to 5 year fixed hedging deals report steadier quarterly margins than spot-market peers.
Market Impact: Stabilises margin within 4 to 7 points now

Who Controls the Margin Pool

Concentration is moderate at a CR5 of 52%, measured consistently across all participants on silver powder and flake product revenue. DOWA Electronics Materials and Heraeus Precious Metals lead on solar paste formulation scale and global manufacturing footprint respectively, and the gap to Ferro Corporation and other established challengers reflects decades of manufacturer relationship and particle engineering investment rather than any single production advantage a challenger cannot eventually close given sufficient capital commitment.
Competitive activity today runs along three lines: fine-particle formulation capability investment targeting printed electronics demand, higher-conductivity per-cell efficiency formulation targeting solar manufacturer cost pressure, and electronics miniaturization relationship development targeting consumer device manufacturers. Smaller regional producers lacking formulation breadth increasingly pursue distribution partnerships with established majors rather than building independent manufacturer relationships from scratch given the capital and time required.

Pressure is building from Chinese producers expanding solar paste export capacity specifically to challenge established Japanese and Western incumbents on delivered cost, while printed electronics demand reshapes where established majors direct new formulation investment. Any producer still relying purely on commodity solar-grade volume without printed electronics or specialty-grade diversification faces a widening growth disadvantage that manufacturing scale alone cannot offset indefinitely.
silver-powder-and-flakes-market-trends-company-positioning-matrix-1787594628489

Competitive Moat and Risk Dimensions

DOWA ELECTRONICS MATERIALS

Moat: Deep solar paste formulation scale

DOWA Electronics Materials holds established solar paste formulation technology and manufacturer relationships built over decades of certified supply into demanding cell production quality programs. Its integrated particle engineering capability also gives it cost stability that competitors purchasing powder on spot terms cannot match. That integration also lets it offer more consistent delivery schedules than competitors purchasing silver on spot terms.
DOWA ELECTRONICS MATERIALS

Risk: Concentrated solar-grade exposure

DOWA Electronics Materials' revenue remains more concentrated in solar-grade paste applications than some diversified specialty competitors, exposing it more directly to silver-loading reduction pressure than producers with deeper printed electronics positioning. A prolonged acceleration in silver-loading reduction would weigh more heavily on DOWA than on more diversified competitors.
HERAEUS PRECIOUS METALS

Moat: Global manufacturing footprint scale

Heraeus Precious Metals operates silver powder production and technical service networks across more regions than most competitors, giving it manufacturer relationships and supply reliability smaller specialty producers cannot replicate quickly. Its diversified application portfolio also reduces exposure to any single segment's demand cycle. That reach also lets it negotiate favourable terms with major electronics and solar manufacturer partners globally.
HERAEUS PRECIOUS METALS

Risk: Complex portfolio dilutes segment focus

Heraeus Precious Metals' breadth across dozens of precious metals product categories beyond silver powder means this specific category receives less dedicated management attention than at smaller, category-focused competitors. Competitors with sharper category focus can move faster on emerging printed electronics opportunities. This gap could widen further if printed electronics adoption accelerates faster than Heraeus's diversification pace.

Players Tracked

Prominent Players

DOWA Electronics Materials
Heraeus Precious Metals
Ferro Corporation
Tanaka Holdings
Sumitomo Metal Mining

Other Key Players

Ames Goldsmith Corporation
Metalor Technologies
American Elements
Umicore
BASF SE
Fukuda Metal Foil and Powder
Toyo Aluminium
Kuprion
DuPont de Nemours
Nippon Chemical Industrial
Shoei Chemical
Vishay Techno Components
Daejoo Electronic Materials
Hitachi Chemical
Jiangsu Boyu New Materials

Recent Developments

FEBRUARY 2025

DOWA expands solar paste-grade silver powder capacity

DOWA Electronics Materials completed a capacity expansion at a solar paste-grade production facility, adding fine-particle production lines ahead of rising efficiency-focused demand. The project was an organic expansion funded internally, targeting solar cell manufacturer customers specifically. Regulators completed a standard review before the expansion reached full production.
Signal: Established producers keep investing in fine-particle capacity rather than defending commodity volume alone. That confidence signals rising efficiency-focused demand overall.
OCTOBER 2024

Heraeus signs major solar cell manufacturer supply agreement

Heraeus Precious Metals signed a multi-year supply agreement with a major solar cell manufacturer covering high-efficiency silver paste volume across several production facilities. The arrangement was a commercial supply contract, including technical support commitments. Analysts view the deal as confirmation of accelerating efficiency-focused solar investment.
Signal: Solar cell manufacturers increasingly value integrated technical support alongside supply. Long-term technical partnerships matter more than spot pricing here.
JUNE 2025

Ferro Corporation acquires printed electronics ink formulation company

Ferro Corporation acquired a smaller printed electronics ink formulation company outright, a genuine acquisition rather than a joint venture or minority stake, adding fine-particle formulation capability to its electronic materials portfolio. The purchase strengthens Ferro's fine-particle capability considerably across its broader materials portfolio. Terms were undisclosed.
Signal: Major electronic materials companies buy formulation technology rather than building it internally. Build versus buy favours buying proven technology.

Raw Silver Feedstock Cost

Raw silver feedstock runs 72% of cost of goods sold across silver powder producers, sourced either through direct bullion purchase relationships or refined from mining byproduct streams under annual or spot contracts. Particle processing, formulation, and quality testing add a further 14% to 20%, with packaging and logistics making up much of the remainder given the product's high value density.
The 2023 to 2024 silver price surge showed how directly that exposure translates into margin. Global silver prices climbed sharply across that period as investment demand and industrial consumption both increased simultaneously amid broader precious metals market strength, and industry trade data recorded silver spot pricing reaching multi-year highs across multiple consecutive quarters. Producers without long-term hedging arrangements absorbed a disproportionate share of that increase given the speed of the underlying price movement.

Exposure separates producers cleanly by hedging structure and financial scale. Larger incumbents with established hedging programs and price pass-through clauses tied to manufacturer contract pricing absorbed that shock more effectively than smaller regional producers purchasing silver on spot terms. That gap has hardened into a durable disadvantage for smaller producers without the financial scale to negotiate favourable hedging arrangements.
silver-powder-and-flakes-market-trends-cost-volatility-analysis-1787594628685

Negotiate silver price pass-through clauses

Producers securing silver price pass-through clauses tied to manufacturer contract terms remove much of the margin volatility that follows any single silver price disruption. This approach has become increasingly standard among larger silver powder producers with the financial scale to negotiate favourable pass-through arrangements with major customers. Producers without this structure absorb more volatility.

Establish forward silver hedging programs

Producers establishing forward silver hedging programs through bullion market relationships reduce exposure to spot-market price spikes affecting delivered cost. This hedging requires additional financial management capability but has proven valuable during recent silver price volatility affecting broader precious metals markets simultaneously. This approach also reduces reliance on any single bullion supplier's pricing schedule or logistics network.

Shift product mix toward higher-margin specialty grades

Producers with greater printed electronics and specialty-grade revenue share are less exposed to silver price volatility relative to revenue, since premium specialty-grade pricing carries more room to absorb silver cost increases than thin-margin solar-grade sales. This mix shift provides a genuine cushion during periods of sustained precious metals price pressure. Investors reward this mix discipline with favourable multiples.

Portfolio Architecture for Margin Defence

The portfolio splits into three tiers with real margin separation tied to particle engineering depth and formulation complexity rather than raw silver cost alone. Standard solar-grade powder competes largely on delivered cost against benchmark pricing, while printed electronics and specialty-grade products earn meaningfully more on particle engineering and formulation science that commodity-grade producers cannot easily replicate. Buyers increasingly specify tier explicitly during manufacturer qualification rather than treating silver powder as one undifferentiated precious metal product.
The tension between solar volume and specialty premium runs through every producer's capacity allocation decision each year. Solar-grade volume still represents the largest share of the market by tonnage despite silver-loading-constrained per-cell growth, yet margin and growth increasingly concentrate in printed electronics and specialty grades that require formulation investment most solar-only producers have not built. That formulation gap, more than any difference in underlying silver chemistry, is what separates the tiers most sharply today.

High-value pools concentrate specifically where technical requirements limit substitutable supply: printed electronics formulations commanding the strictest print performance premiums, and specialty grades rewarding producers who invested in fine-particle engineering years ahead of any specific manufacturer partnership.

Volume / Commodity-Adjacent Tier

Standard solar-grade silver powder sold largely on delivered cost against benchmark pricing across major established photovoltaic manufacturer relationships built over many years. Producers here compete almost entirely on delivered cost and reliability of supply rather than technical differentiation.
Gross Margin: 8-14%

Premium / Certified Tier

High-conductivity, per-cell efficiency formulations commanding real premiums for particle engineering depth and proven manufacturer performance history. Buyers in this tier require documented performance history before committing to any long-term manufacturer contract.
Gross Margin: 14-22%

Sustainability / Regulatory / Next-Generation Tier

Printed electronics and fine-particle formulations meeting emerging print performance and flexibility requirements that mass-market solar production was never designed to satisfy. Buyers here increasingly demand full print performance validation before finalising any supply relationship.
Gross Margin: 24-34%
silver-powder-and-flakes-market-trends-portfolio-architecture-1787594629180

High-value Sub-segments and Strategic Watch-out

Printed and Flexible Electronics

High value and the fastest-growing segment at 11.8% CAGR, anchored by flexible device manufacturers reaching an entirely different buyer base than traditional solar customers. Premiums of 30% to 45% reflect genuine fine-particle engineering cost rather than brand positioning alone. Manufacturer relationships stay sticky once qualified.
Gross Margin: 24-32%

Solar Cell Metallization Paste

High value with strong second-fastest growth at 9.5%, driven by rising global cell production volume even as per-cell silver loading declines. Supply remains constrained by formulation efficiency expertise that generic powder producers lack, sustaining real pricing power. Buyers rarely switch suppliers once a formulation is validated and proven reliable.
Gross Margin: 14-22%

Standard Solar-Grade Powder

The volume core of the market despite silver-loading-constrained growth, competing on delivered cost against benchmark pricing with thin margins and intense producer rivalry. Growth tracks a well-documented photovoltaic manufacturing cycle with limited differentiation. Producers here increasingly diversify into higher-margin grades to offset this segment's constrained growth.
Gross Margin: 8-14%

Solar-Only Legacy Producers

The strategic watch-out. Producers dependent purely on solar-grade volume without printed electronics or specialty-grade investment face a widening exposure to per-cell silver reduction pressure and competitive substitution risk over the coming decade of format diversification. These producers face a widening competitive gap against diversified rivals over the next several years.
Gross Margin: 4-10%

Manufacturer Contracts and Qualification Cycles

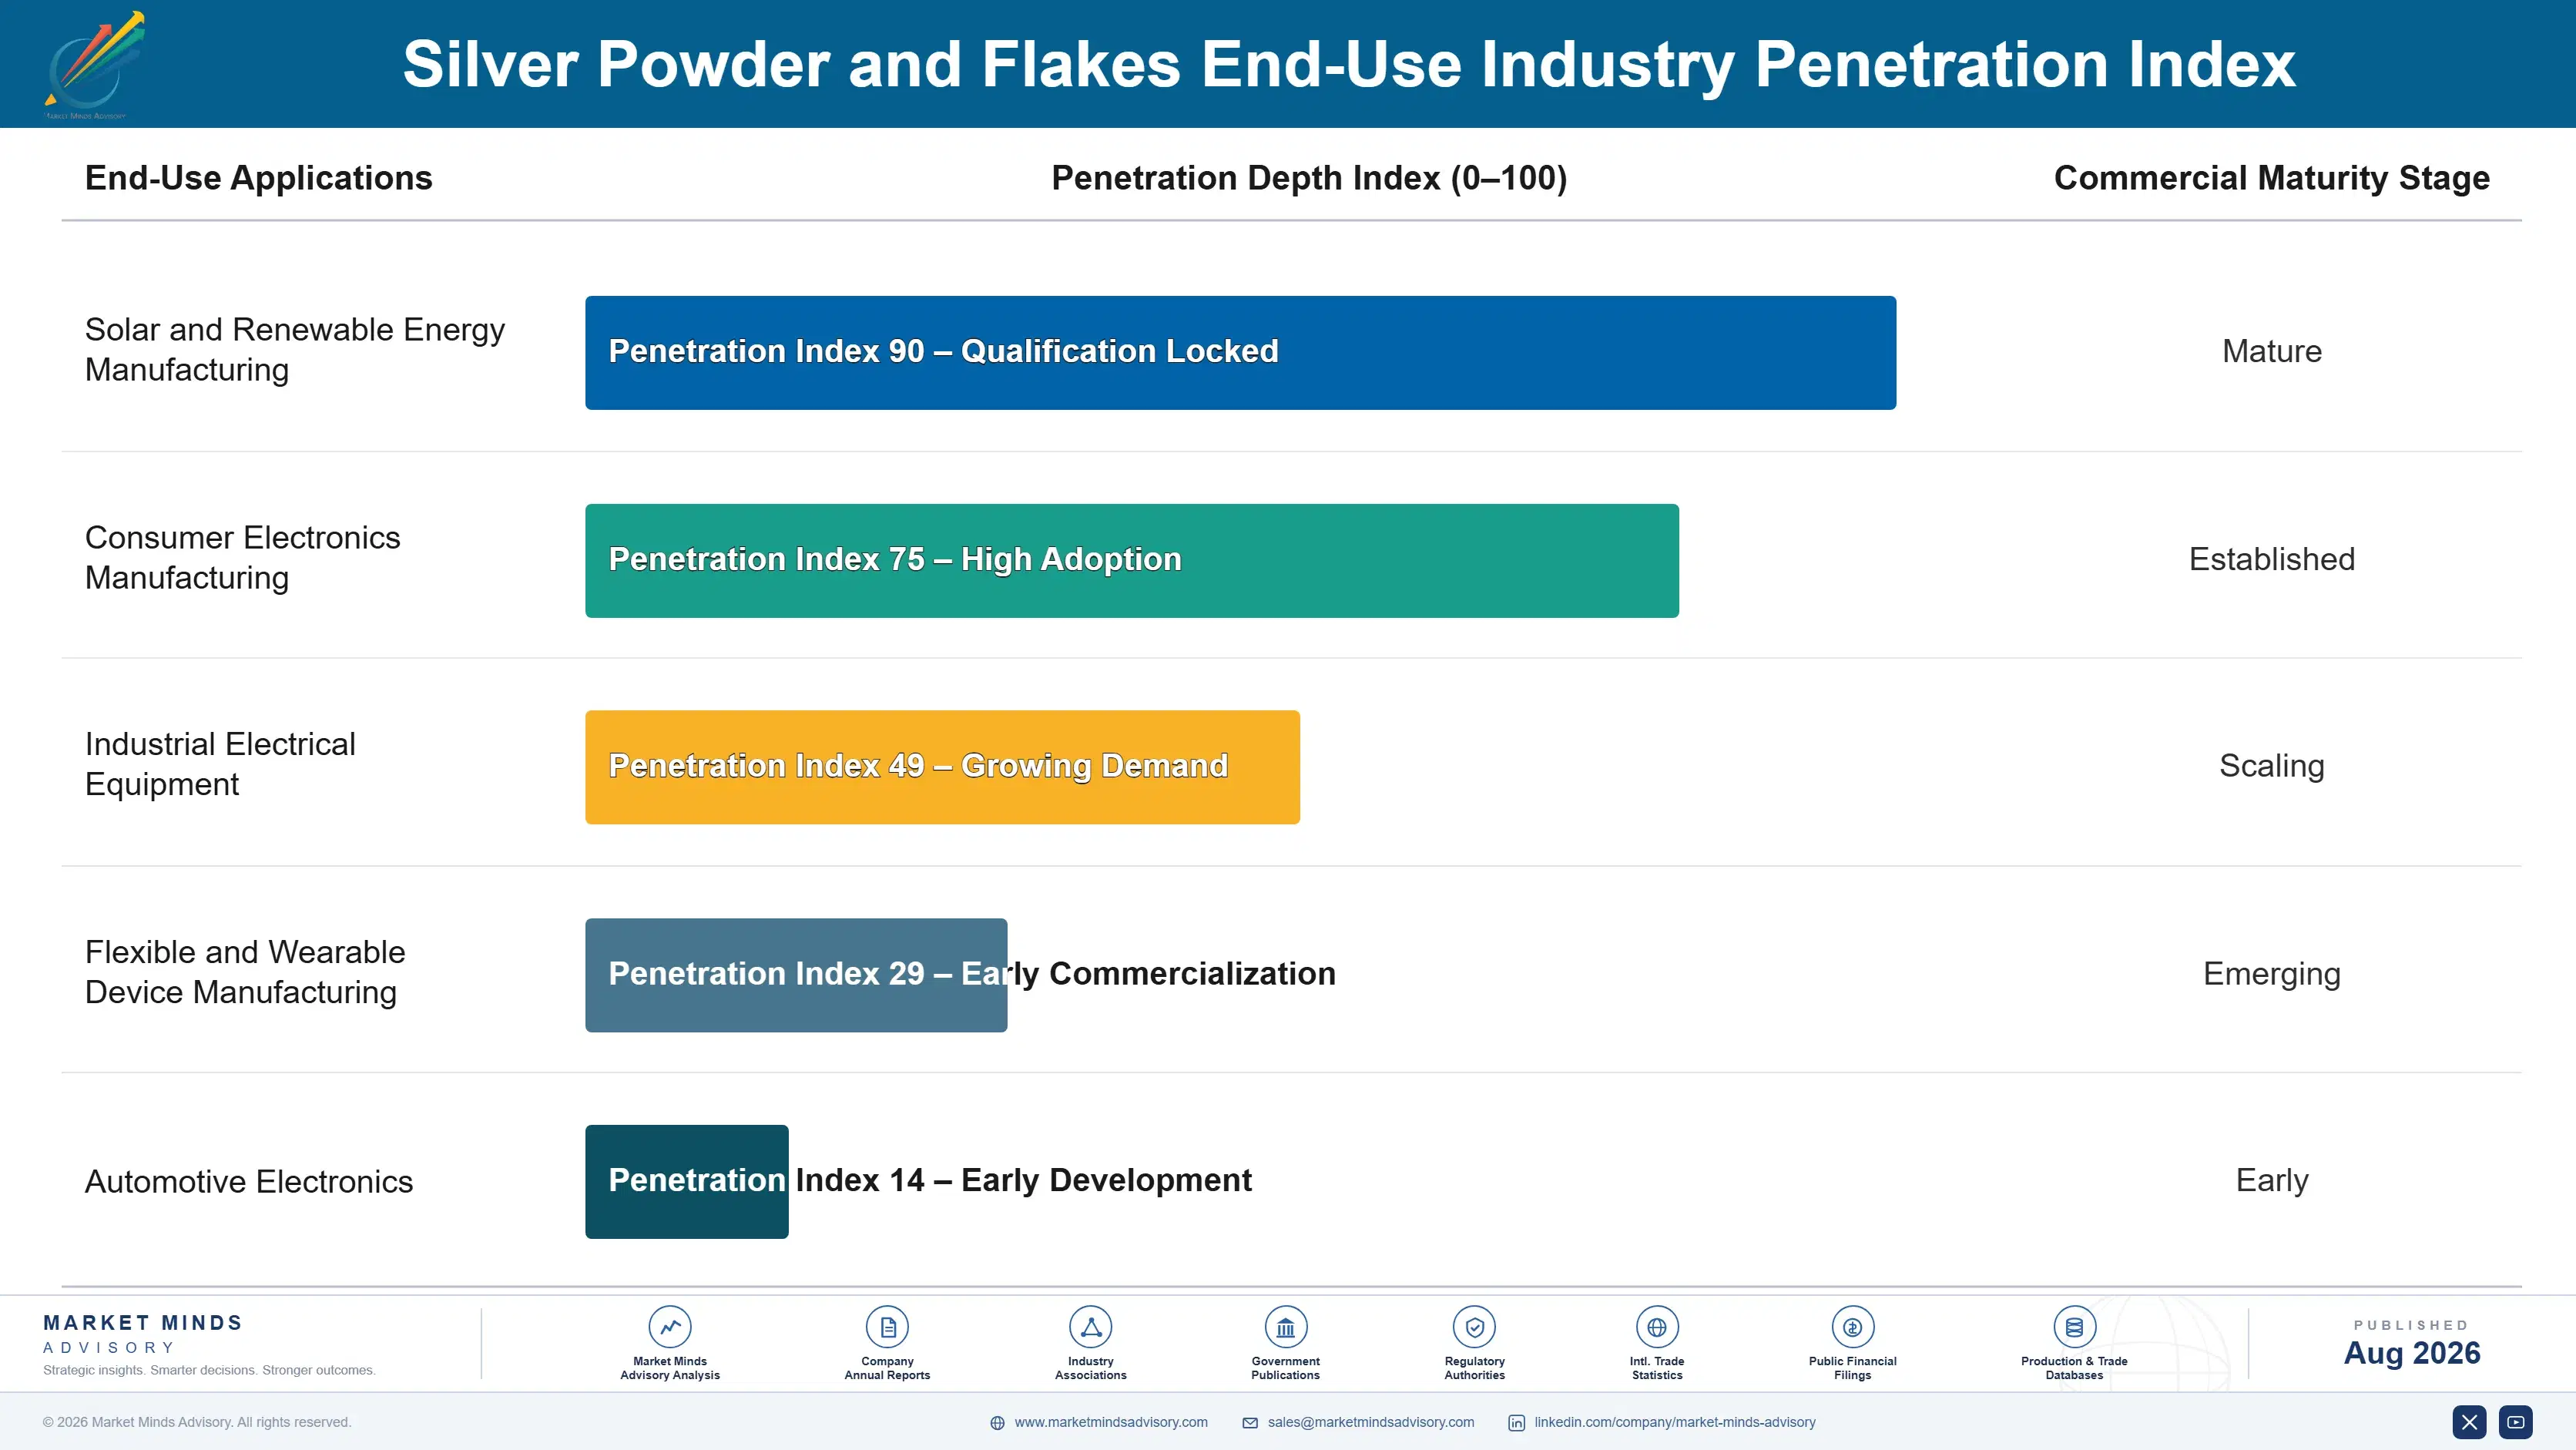
Demand here runs on multi-year solar cell and electronics manufacturer procurement contracts rather than transactional sales for the majority of branded volume, since photovoltaic and electronics manufacturing projects need consistent, certified paste and ink performance locked in well before any production line qualifies a new supplier. Contract renewal typically follows manufacturing qualification cycles spanning several years rather than the annual transactional purchasing common in commodity precious metals sales.
Adoption depth varies sharply by application. Printed electronics and specialty-grade buyers show the strongest supplier loyalty given formulation validation cost and the operational risk of switching mid-production given performance requirements, while solar-grade buyers switch relatively freely based on price and delivery lead time given the category's mature, standardised procurement processes. Electrical contact buyers sit between the two, valuing documentation consistency over transactional pricing given reliability considerations.

Buyer profiles have shifted generationally as silver powder procurement moved from purely cost-driven commodity purchasing toward formulation-driven, technically demanding qualification programs spanning multiple application categories simultaneously. Younger procurement teams increasingly evaluate print performance and supply reliability rather than upfront silver price alone, a shift that favours producers investing in particle engineering and formulation depth over those competing purely on traditional commodity volume.
silver-powder-and-flakes-market-trends-end-use-penetration-index-1787594629666

Where Particle Engineering Decides Outcomes

These are among the four positions where our research anticipates prominent divergence between winners and laggards over the coming forecast period. Each is grounded in the demand model, the regulatory perimeter, and the announced capacity pipeline.
01 / PRINTED ELECTRONICS INVESTMENT

Early fine-particle capability will keep capturing the fastest-growing segment

Producers investing in fine-particle silver ink formulation capability are capturing flexible device manufacturer contracts that solar-grade producers cannot service at required print performance specification, and that gap will not close quickly given the research investment involved, since formulators rarely switch suppliers once an ink is validated against a specific product line. Expect continued investment concentrating among producers who committed to this capability years ahead of the segment's current growth, leaving later entrants a steeper formulation curve to climb. Later entrants face a considerably steeper qualification curve to catch up.
02 / SOLAR VOLUME DIVERSIFICATION

Diversified producers will outperform solar-only legacy competitors

Solar metallization volume growth faces a well-documented, silver-loading-constrained ceiling even as total cell production expands, and producers dependent purely on solar-grade production face a steadily compressing per-unit margin position regardless of how well they execute operationally. Companies that diversified into printed electronics and specialty grades early have already begun offsetting slower per-cell silver volume with faster-growing, higher-margin revenue streams. Expect continued consolidation toward diversified producers as solar-only competitors face an increasingly difficult margin position that should keep widening over the coming several years.
03 / EFFICIENCY FORMULATION EXPANSION

Early efficiency investment will outcompete standard regional incumbents

Solar manufacturer per-cell silver budget pressure will keep tightening across additional major markets, and producers who invested in higher-conductivity, silver-efficient formulations ahead of that tightening are already winning contracts citing proven cost reduction performance specifically, since efficient formulation capability remains scarce relative to growing manufacturer demand. That scarcity sustains real advantage for early movers who invested ahead of the requirement. Broader investment should eventually compress this advantage as more producers complete comparable formulation, with buyers increasingly treating efficiency documentation as a baseline requirement rather than a differentiator.
04 / ELECTRONICS RELATIONSHIP BUILDING

Early engagement will build durable manufacturer advantage

Electronics miniaturization continues expanding conductive paste demand, and producers who invested in direct electronics manufacturer relationships now are building supply positions that later entrants must wait years to replicate given typical qualification timelines. This opportunity depends on genuine field engineering investment rather than simple product supply. Expect continued investment concentrating among relationship leaders as electronics demand advances,, with later movers finding contract wins harder to secure and market entry considerably more costly once manufacturers commit to established suppliers, a trend already visibly underway.

Engagement Snapshot From the Field

A live engagement with an industry participant carrying material or product regulatory and market exposure ahead of a defining policy shift, showing how our research translates into a defensible multi-year portfolio strategy.
MARKET MINDS ADVISORY · CLIENT ENGAGEMENT SUMMARY
Silver Powder and Flakes Producer Strategic Portfolio Review and Transition Roadmap 2026·Investment Scenario on Silver Powder and Flakes Exposure Evaluation 2025-26
CLIENT PROFILE
A solar cell manufacturer operating production facilities across East Asia approached MMA while planning a silver paste efficiency improvement program targeting per-cell material cost reduction. The client reported annual cell production revenue near USD 410 million, with limited prior experience benchmarking paste supplier formulation efficiency at scale (client-reported, unverified by MMA). The manufacturer had never previously benchmarked supplier formulation efficiency at this production scale.
STRATEGIC CHALLENGE
Management wanted to reduce per-cell silver consumption to improve margin without compromising cell efficiency ratings, but lacked internal expertise comparing paste supplier formulation performance across silver-loading reduction targets. The engineering team worried that switching to a lower-silver formulation too quickly without adequate validation testing could reduce cell efficiency below customer specification.
MMA APPROACH
MMA benchmarked available silver paste suppliers against the client's specific efficiency and silver-loading reduction targets, then modelled the qualification testing timeline needed for a credible formulation transition. We also assessed each candidate supplier's silver hedging structure to identify the most cost-stable long-term partner. Findings were delivered ahead of the client's quarterly production planning review.
KEY FINDINGS
  1. The client's initial supplier shortlist included several paste formulations whose documented efficiency at reduced silver loading fell short of specification on closer review (client-reported, unverified by MMA).
  2. A qualified supplier with proven silver-efficient formulation experience could compress the client's qualification timeline meaningfully compared with developing a new supplier relationship from scratch.
  3. Hedging structure assessment revealed one leading candidate had considerably more stable silver cost exposure than the client's incumbent supplier. This gap materially influenced the client's final supplier selection decision.
  4. A phased qualification approach reduced production risk considerably compared with the single-batch validation originally proposed. This phased approach also allowed engineering to refine testing protocols before full-scale transition.
CLIENT PROFILE
A solar cell manufacturer operating production facilities across East Asia approached MMA while planning a silver paste efficiency improvement program targeting per-cell material cost reduction. The client reported annual cell production revenue near USD 410 million, with limited prior experience benchmarking paste supplier formulation efficiency at scale (client-reported, unverified by MMA). The manufacturer had never previously benchmarked supplier formulation efficiency at this production scale.
STRATEGIC CHALLENGE
Management wanted to reduce per-cell silver consumption to improve margin without compromising cell efficiency ratings, but lacked internal expertise comparing paste supplier formulation performance across silver-loading reduction targets. The engineering team worried that switching to a lower-silver formulation too quickly without adequate validation testing could reduce cell efficiency below customer specification.
MMA APPROACH
MMA benchmarked available silver paste suppliers against the client's specific efficiency and silver-loading reduction targets, then modelled the qualification testing timeline needed for a credible formulation transition. We also assessed each candidate supplier's silver hedging structure to identify the most cost-stable long-term partner. Findings were delivered ahead of the client's quarterly production planning review.
KEY FINDINGS
  1. The client's initial supplier shortlist included several paste formulations whose documented efficiency at reduced silver loading fell short of specification on closer review (client-reported, unverified by MMA).
  2. A qualified supplier with proven silver-efficient formulation experience could compress the client's qualification timeline meaningfully compared with developing a new supplier relationship from scratch.
  3. Hedging structure assessment revealed one leading candidate had considerably more stable silver cost exposure than the client's incumbent supplier. This gap materially influenced the client's final supplier selection decision.
  4. A phased qualification approach reduced production risk considerably compared with the single-batch validation originally proposed. This phased approach also allowed engineering to refine testing protocols before full-scale transition.
RECOMMENDED STRATEGY
Phase 1: Phase 1 (0 to 4 months): Complete efficiency performance testing and hedging structure review for the top three candidate suppliers. Phase 2: Phase 2 (4 to 9 months): Qualify the selected supplier through staged production trial batches at reduced silver loading. Production teams monitored efficiency performance closely throughout each trial run. Phase 3: Phase 3 (9 to 16 months): Transition full production volume once trial performance validates the efficiency target. Documentation was compiled continuously to support ongoing quality assurance reviews.
OUTCOME
The client completed its silver paste transition within the planned timeline following the phased approach, avoiding the efficiency shortfall risk a faster rollout would likely have introduced. The qualified supplier also secured a reported 14% reduction in per-cell silver cost through the efficiency formulation transition (client-reported, unverified by MMA).

Frequently Asked Questions

Foundational context covering the market sizes, CAGR, scope, country, region and competition that inform every finding below. This section is provided to cover basics and most often pre-purchase conversations, answered from the MMA Primary Research Dataset.

What is the current size of the Silver Powder and Flakes Market?

The silver powder and flakes market reached USD 3.1 billion in 2025. This figure covers solar metallization, electronics, contacts, printed electronics, and RFID applications globally.

How large will the Silver Powder and Flakes Market be by 2036?

The market is projected to reach USD 7.37 billion by 2036 under the base case scenario, representing a 2.2 times expansion over the 2026 starting value.

What is the CAGR for the Silver Powder and Flakes Market 2026 to 2036?

The base case CAGR is 8.2%, with a bull case of 9.4% and a bear case of 6.9%. Printed electronics adoption and silver-loading reduction drive most of the variance.

Which segment is growing fastest?

Printed and flexible electronics grows fastest at 11.8% CAGR, about 1.44 times the overall market rate. Flexible device formulators reaching new buyer segments drive this growth directly.

Who are the major companies in the Silver Powder and Flakes Market?

Leading companies include DOWA Electronics Materials, Heraeus Precious Metals, Ferro Corporation, Tanaka Holdings, and Sumitomo Metal Mining, holding roughly 52% combined market share. These five compete on formulation scale and manufacturer relationship depth across multiple applications.

Which country is growing fastest?

India posts the fastest national growth at 10.8% CAGR, driven by expanding domestic solar cell manufacturing capacity. Growing renewable energy investment anchors most of this growth.

Report Segmentation Architecture

The full report scope spans multiple orthogonal segmentation dimensions, with cross-tabulated demand data provided for each dimension pair. Coverage extends further to regional breakdowns, trend trajectories, and the competitive detail needed to support segment-level decision-making.

By Application

  • Solar Cell Metallization Paste
  • Electronic Conductive Adhesives and Pastes
  • Electrical Contacts and Switches
  • Printed and Flexible Electronics
  • Brazing and Soldering Alloys
  • RFID and Antenna Inks

By End-Use Industry

  • Solar and Renewable Energy Manufacturing
  • Consumer Electronics Manufacturing
  • Industrial Electrical Equipment
  • Flexible and Wearable Device Manufacturing
  • Automotive Electronics

By Commercial Dimension

  • Direct Producer Supply
  • Distributor and Trader Channel
  • Long-Term Manufacturer Contracts
  • Spot Market Sales

By Region

  • North America
  • Western Europe
  • East Asia
  • South Asia and Pacific
  • Latin America
  • Middle East and Africa
  • Eastern Europe

Scope, Methodology, and Coverage

Every figure in this report is reproducible from documented input assumptions. The scope below maps the historical period, the forecast horizon, the segmentation dimensions, and the countries covered, alongside the underlying primary and qualitative methodology.
Historical Period
2020 to 2025
Forecast Period
2026 to 2036
Base Year
2025 (USD billions; MMA Primary Research Dataset, August 2026)
Market Definition
This market comprises silver powder and flake products used in solar cell metallization paste, electronic conductive adhesives, electrical contacts, printed and flexible electronics, brazing alloys, and RFID antenna inks. Silver bullion, jewellery-grade silver, and unrelated silver nanoparticle antimicrobial products are excluded from this scope.
Quantitative Units
USD billions (current prices); metric tonnes of silver powder and flake volume where applicable
Segmentation Dimensions
By Application; By End-Use Industry; By Commercial Dimension; By Region
Regions Covered
North America, Western Europe, East Asia, South Asia and Pacific, Latin America, Middle East and Africa, Eastern Europe
Countries Covered
USA, China, Germany, France, UK, Japan, South Korea, India, Australia, Canada, Brazil, Mexico, Indonesia, Vietnam, Thailand, Malaysia, UAE, Saudi Arabia, South Africa, Nigeria, Turkey, Poland, Netherlands, Italy, Spain, Sweden, Switzerland, Argentina, Colombia, Singapore, and additional markets relevant to this sector
Key Companies Profiled
DOWA Electronics Materials, Heraeus Precious Metals, Ferro Corporation, Tanaka Holdings, Sumitomo Metal Mining, Ames Goldsmith Corporation, Metalor Technologies, American Elements, Umicore, BASF SE, Fukuda Metal Foil and Powder, Toyo Aluminium, Kuprion, DuPont de Nemours, Nippon Chemical Industrial, Shoei Chemical, Vishay Techno Components, Daejoo Electronic Materials, Hitachi Chemical, Jiangsu Boyu New Materials
Quantitative Methodology
Primary survey, n=3,800 respondents, Q4 2025, six countries; demand-side model with trade association cross-validation
Qualitative Methodology
47 expert interviews, Q4 2025; applied to validate demand model assumptions, identify emerging dynamics, and assess competitive positioning
Report Format
PDF and XLSX data workbook (Word format preview document)
Publisher
Market Minds Advisory
Report Code
MMA-2026-CHM-217
Published
August 2026
Contact
sales@marketmindsadvisory.com | www.marketmindsadvisory.com

Purchase the full Silver Powder and Flakes Market Report (2026 to 2036).

The full MMA Silver Powder and Flakes report sizes the market across six application segments, five end-use industries, four commercial channels, and seven regions through 2036. It profiles twenty companies on a consistent basis of silver powder and flake product revenue, scoring each on fine-particle formulation depth, per-cell efficiency capability, and electronics relationship breadth. Scenario models quantify how printed electronics adoption, silver-loading reduction, and solar capacity expansion move both demand and realised pricing. The report also includes delivered-cost modelling by silver feedstock exposure, a solar-only exposure screen, and printed electronics segment economics built for procurement, strategy, and investment teams.
Six-segment application demand breakdown detail view
Silver feedstock delivered-cost bridge modelling review
Solar-only exposure screening framework detail overview
Producer particle engineering benchmarking review detail
Printed electronics segment economics deep detail
Regional manufacturing concentration mapping detail review

Built For The People Who Decide

From boardroom strategy to bench-side execution, this report is read cover-to-cover by leaders shaping the next decade of their industry, turning demand scenarios, market dynamics and valuation benchmarks into decisions.
CXOs/ Presidents/ VPs/ Managers
M&A and Corporate Development
Strategy Teams and R&D Heads
Procurement and Product Directors
Regulatory and Compliance Leaders
Investor Relations and Equity Analysts