

Market Minds Advisory
Shoe Insoles Market

Shoe Insoles Market: Shoe Insoles Market. Gait Data Turns Cushioning Claims Into a Clinical Purchase Filter

Podiatry-conscious buyers increasingly demand documented pressure distribution data before paying premium prices for a shoe insole, leaving manufacturers of unverified cushioning foam struggling to compete once clinical validation sets the real purchase filter.

Lead Analyst

Published

September 2026

Make Smarter Decisions with Customized Research Insights

Request a free sample report and evaluate market opportunities, growth trends, and competitive dynamics relevant to your business needs.

2025 MARKET VALUE$6.8BMarket Size 2025
2036 FORECAST VALUE$13.5BBase Case , 2026 to 2036
CAGR 2026 TO 20366.4 %Bull 7.6% / Bear 5.2%
INCREMENTAL OPPORTUNITY$6.2BNet 10- year value creation
EXPANSION MULTIPLE1.86x2036 value over 2026 base
Strategic Levers
M&A Pipeline
Regional Outlook
Country Rankings
Competitive Intelligence
Segmental Deep-dive
Call-Us : 91 93563 13602

Executive Snapshot and Market Trajectory.

Podiatry-conscious buyers increasingly demand documented pressure distribution data before paying premium prices for a shoe insole, leaving manufacturers of unverified cushioning foam struggling to compete as clinical validation becomes a genuine purchase filter across most specialty retail channels today. That gap is real and widening.
Comfort and cushioning insoles remain the largest category by revenue, but smart sensor-embedded insoles and custom 3D-printed insoles are both growing faster as tech-forward buyers and gait-specific patients pull demand toward distinct formats. North America commands the specialty retail and distribution base in the category, anchored by orthopedic health awareness, while South Asia and Pacific is expanding as India's athletic footwear culture pushes pressure certification into mainstream adoption.
Competition concentrates among a mix of established orthotic and footwear accessory manufacturers competing on price and distribution reach, and newer clinically focused brands competing on documented pressure distribution, gait correction accuracy, and smart sensor features that command higher retail pricing. Pressure distribution certification, gait correction credentials, and specialty retailer partnership depth are reshaping which manufacturers can convert one-time trial purchases into durable repeat-brand relationships across the coming decade of sustained clinical validation growth worldwide.
Market Definition
The shoe insoles market covers comfort and cushioning insoles, orthopedic and corrective insoles, athletic performance insoles, heated and thermal insoles, custom 3D-printed insoles, and smart sensor-embedded insoles sold for footwear comfort and correction use. It excludes standalone orthotic braces, custom-molded prosthetic devices, and shoe-integrated midsole cushioning built into the footwear at manufacture.
Base Year Value
$6.8B in 2025 (MMA Primary Research Dataset, August 2026)
Forecast Period
2026 to 2036, eleven discrete annual values
CAGR
6.4% base case. Bull 7.6%. Bear 5.2%.
Fastest Growth Segment
Smart Sensor-Embedded Insoles: 12.5% CAGR
Fastest Growth Country
India: 9.8% CAGR
Fastest Growth Region
South Asia and Pacific: 8.4% CAGR
Largest Region
North America: 30% of 2025 global value
Market Leaders
Scholl's Wellness Company, Superfeet Worldwide LLC, Implus LLC, Currex GmbH, Stable Step LLC. Source: MMA Analysis based on company annual reports.
Primary Survey
n=3,800 procurement and R&D decision-makers, Q4 2025, six countries
Methodology
Demand-side build-up, cross-validated against public data, 47 expert interviews

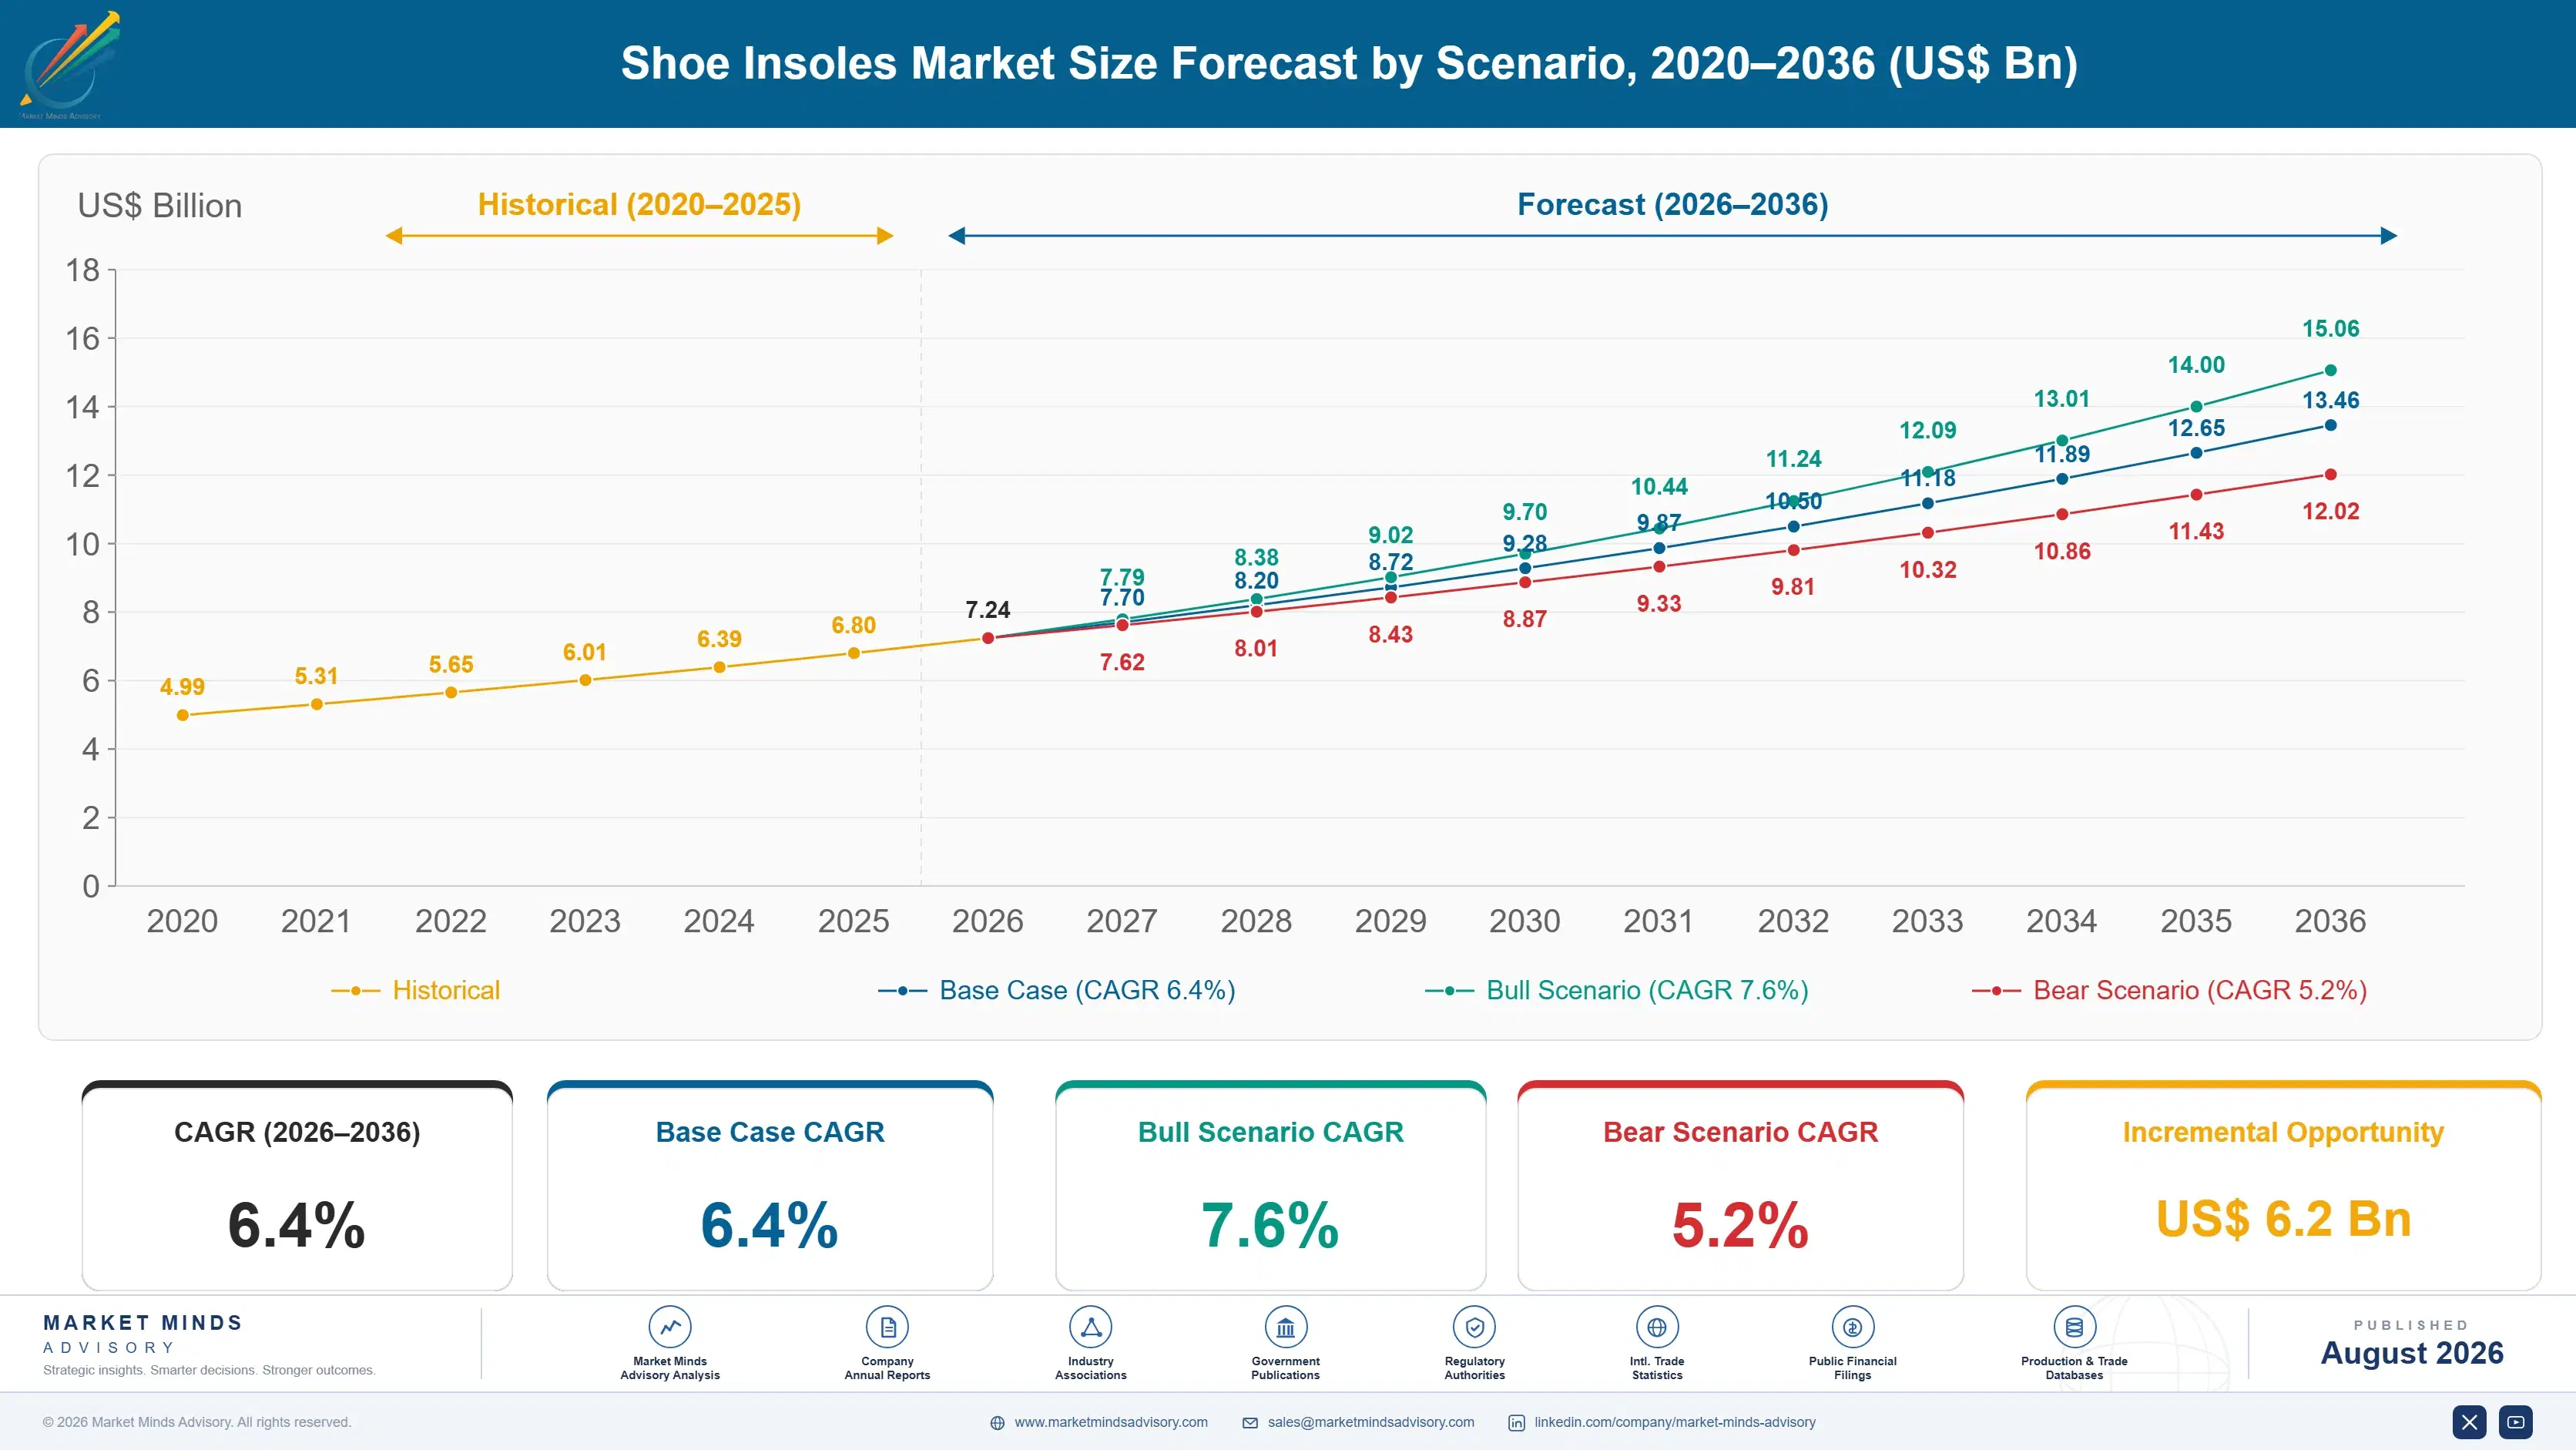
Shoe Insoles Market Forecast Scenarios

shoe-insoles-market-size-forecast-scenario-1788175830177
Between 2020 and 2025 the market grew near a 5.6% annual pace as pandemic-era home fitness spending and steady orthopedic health awareness widened the addressable buyer base gradually, before documented pressure distribution certification and sensor integration innovation accelerated category transformation sharply from 2023 onward as several manufacturers launched verified gait correction programmes for the first time.
The base case carries the market to a 6.4% CAGR on three commercial mechanisms: smart sensor-embedded insole demand scaling as tech-forward buyers chase documented gait tracking performance, custom 3D-printed insole demand growing as gait-specific patients favour precisely fitted correction, and comfort insole replacement demand holding steady as households continue trusting the established format across mature and emerging markets alike. Retailers report strongest sell-through on insoles that pair documented pressure claims with visible sensor connectivity features today broadly.
The bull case at 7.6% assumes documented pressure distribution certification adoption spreads faster than currently modelled across both premium and mass specialty retail channels simultaneously. The bear case at 5.2% assumes component cost inflation continues constraining premium conversion longer than expected, holding category growth closer to conventional comfort insole replacement volume alone. Most manufacturers expect the outcome to track closer overall.

Pressure Certification Redraws a Commodity Category

Three forces converge on this category at once. Budget-conscious buyers need affordable comfort insoles that meet basic cushioning needs without premium features, podiatry-conscious buyers need documented pressure distribution and gait correction that satisfy genuine orthopedic requirements, and specialty retailers need consistent batch quality that holds calibration across thousands of units without drifting from a fixed density specification.
TOP PRODUCER SHAREChina, 36%Share of global output manufactured in Chinese facilities today
AVERAGE UNIT PRICEUSD 18 per pairBlended average retail price across all shoe insole categories
FOAM GEL COST SHARE28% of COGSCushioning foam and gel component share of cost
COMFORT SEGMENT SHARE42% of volumeTotal unit volume sold into comfort and cushioning insole applications
PRODUCT CERTIFICATION CYCLE3 to 8 monthsTypical time required to certify a new pressure distribution claim
MARKET CONCENTRATIONCR5: 30%Combined share held by the five largest shoe insole manufacturers
Commercially, the category increasingly rewards manufacturers who can pair documented pressure distribution with genuine clinical retailer relationships rather than relying on brand recognition alone. Manufacturers that can demonstrate both clinical validation and consistent gait correction command premium retail shelf space that unverified competitors cannot access, so podiatry clinics and specialty footwear retailers increasingly default to established manufacturers over the cheapest unverified insole available. That preference has hardened as several budget insoles failed extended pressure distribution testing during recent clinical advocacy reviews.
Over the next decade, pressure distribution certification, gait correction credentials, and specialty retailer partnership depth will decide which manufacturers convert one-time trial purchases into durable repeat-brand relationships. Manufacturers without genuine clinical verification capability risk losing premium retail placement entirely as podiatric scrutiny continues tightening across every major consuming region worldwide.
"An insole used to just be foam cut to shape. Now a podiatrist wants a pressure map proving the arch support actually redistributes load correctly."
Director, Footwear Accessories and Orthotic Devices Practice · MMA Footwear Insoles and Orthotic Inserts Practice · August 2026

Market Trends

Documented Pressure Distribution Becomes a Retail Gatekeeper

Manufacturers increasingly commission independent pressure distribution certification for flagship insole lines as podiatry clinics demand documented, verifiable load-mapping data beyond simple marketing claims. Superfeet and Currex have both pursued dedicated certification programmes specifically to serve this demand, since pressure verification now requires laboratory partnerships that unverified manufacturers cannot provide without dedicated testing investment. This shift is pulling buyer interest away from unverified foam toward certified insoles that command substantially higher price points across most specialty retail channels today. That certification gap keeps widening as more retailers formalize pressure requirements into standard evaluation criteria broadly today.
Market Impact: Adds 10% to orthopedic insole demand

Sensor Integration Differentiates Premium Clinical Insoles

Tech-forward buyers increasingly favor smart sensor-embedded insoles that pair documented gait tracking with real-time pressure monitoring. Superfeet and Aetrex have both expanded sensor-embedded product lines specifically to serve this demand, since connectivity engineering increasingly differentiates premium positioning from commodity foam alternatives sold at lower price points. This shift is pulling manufacturer investment toward sensor formats that carry meaningfully higher margin protection than conventional comfort insole sale typically provides across most specialty retail channels. Retailers increasingly position these sensor-embedded insoles prominently within premium clinical display sections nationwide, since gait tracking increasingly matters broadly across most stores today.
Market Impact: Adds 8% to Indian insole demand

Market Opportunities and Growth Drivers

Orthopedic Health Awareness Expands Insole Demand

Sustained growth in orthopedic health awareness and preventive foot care continues driving demand for corrective insoles that match the cushioning standards podiatry-conscious buyers now expect from every footwear category. Multiple specialty retailers have published curated orthopedic buying guides specifically built around documented pressure distribution, giving manufacturers with proven certification data a direct competitive advantage in securing retail placement. That awareness-driven demand has proven durable across multiple product cycles rather than a passing trend. Manufacturers with documented pressure certification are best positioned to capture this recurring awareness-driven demand wave, since podiatry-conscious buyers research before purchasing insole.
Market Impact: Polymer swings move margin 7 points

India's Athletic Footwear Culture Sustains Premium Growth

India's rapidly expanding athletic footwear culture, combined with growing middle-class purchasing power, sustains substantial category growth as domestic and international manufacturers compete for market share in an already receptive consumer base. Domestic retailers have established dedicated insole sections specifically to serve this demand, since Indian consumer expectations increasingly set the pace for premium formulation positioning across the wider region. That culture-driven growth has proven durable across multiple product cycles rather than a temporary surge. Regional retailers increasingly specify documented pressure credentials before approving flagship promotion campaigns nationwide across most major cities broadly each season too.
Market Impact: Testing delays launch by 4 months

Market Restraints and Challenges

Foam and Gel Component Volatility Compresses Margin

Cushioning foam and gel component costs have swung sharply in recent years as global polymer and specialty foam demand moved independent of any change in downstream insole demand, since these inputs serve much larger general polymer and specialty foam industries whose demand dwarfs the shoe insole category specifically. The root cause is broad polymer commodity market volatility rather than any category-specific supply issue, meaning manufacturers absorb the same component price swings affecting the entire polymer industry. Manufacturers are mitigating this through longer-term polymer contracts and increased design flexibility across generations.
Market Impact: Certified insole demand grows 11% yearly

Certification Testing Delays Constrain New Product Launch

Independent pressure distribution certification timelines well above typical product development cycles continue constraining new product launch speed across three to eight months longer than manufacturers would otherwise prefer, limiting how quickly verified insoles can actually reach clinical retail shelves regardless of manufacturer production capacity. The root cause is genuine laboratory testing thoroughness rather than any manufacturer-side scheduling failure, since pressure mapping verification requires laboratory capacity that remains fundamentally constrained relative to certification demand. Manufacturers are mitigating this by pursuing shared testing consortiums and by expanding retailer financing partnership programmes. Scale increasingly determines resilience broadly overall.
Market Impact: Sensor insole demand grows 10% yearly
4 additional market trends, 3 additional growth drivers, and 3 additional restraints and challenges are covered in the full report. Contact sales@marketmindsadvisory.com to access the complete intelligence.

Segment CAGR and Growth Architecture

Segmentation follows insole function type, a single classification logic, since comfort, orthopedic, athletic, heated, custom 3D-printed, and smart sensor-embedded formats each require distinct manufacturing disciplines rather than differing by price tier or distribution channel across the value chain. This single dimension keeps upstream engineering technology distinct from downstream commercial channel considerations entirely across every category consistently today.
shoe-insoles-market-market-share-analysis-1788175830714

Smart Sensor-Embedded Insoles

Smart sensor-embedded insoles grow fastest at 12.5%, about 1.95 times the overall 6.4% rate, as tech-forward buyers increasingly demand documented, real-time gait tracking that mechanical insoles cannot provide. This segment demands sensor engineering and connectivity expertise that conventional foam manufacturers cannot simply add without dedicated development investment. Superfeet and Aetrex lead qualified sensor-embedded supply, competing on documented tracking accuracy and monitoring consistency performance rather than price alone. Growth concentrates around premium clinical and athletic applications, where connectivity increasingly justifies retail pricing well above conventional comfort insole units sold at lower price points nationwide. Buyers researching this segment typically compare documented tracking accuracy claims across multiple brands before finalizing a purchase decision, since claims vary considerably.
CAGR 12.5%

Custom 3D-Printed Insoles

Custom 3D-printed insoles grow at 10.5%, the second-fastest segment, as gait-specific patients increasingly demand precisely fitted correction that traditional mass-produced insoles cannot provide. Currex and Aetrex lead qualified custom supply, competing on documented fit accuracy and correction consistency performance rather than raw unit price alone. Unlike mass-produced insoles, this segment sells substantially into clinical and podiatry-referred applications rather than casual retail purchases, so fit certification and pressure mapping accuracy matter as much as durability itself to a buyer's purchase decision. Manufacturers increasingly publish independent fit accuracy test results to support premium positioning, since buyers comparing custom insoles weigh documented correction performance heavily than headline price figures across most clinical and podiatry-referred retail channels today already.
CAGR 10.5%
Full segment breakdown across 6 segments available in the complete report.

Regional Architecture and Country Demand Map

North America leads on specialty retail and clinical distribution depth anchored by a sustained orthopedic health awareness boom, while South Asia and Pacific posts the fastest growth as India's athletic footwear culture pushes documented pressure certification into mainstream adoption. East Asia holds a solid regional share too.

North America

United States specialty footwear and podiatry retail infrastructure, reinforced by a sustained orthopedic health awareness boom that shows no sign of slowing, gives North America 30% of global value, the largest regional share in the category by a clear margin over every other region. Superfeet and Implus's domestic distribution operations supply both clinical and mass-market customers through established specialty retail chains. United States retailers increasingly specify documented pressure distribution before approving flagship product promotion campaigns nationwide. Growth of 5.6% tracks orthopedic health demand more directly than any broader footwear replacement trend on its own, reflecting the region's role as the category's largest consumption market. Canadian retailers increasingly mirror these same certification standards annually too broadly.
Share: 30% | CAGR: 5.6% (2026 to 2036)

Western Europe

Germany and the United Kingdom's established podiatry and orthotic retail culture, combined with strong specialty retail infrastructure, give Western Europe 22% of global value despite a domestic manufacturing base smaller than East Asia's. Bauerfeind's substantial European operations hold deep retail relationships across the region navigating both traditional clinical and newer athletic specialty markets. German and British retailers increasingly specify documented pressure certification before approving flagship promotion placement. Growth of 4.9%, the slowest major region, reflects an already mature orthotic market rather than any underlying demand weakness. French and Scandinavian buyers increasingly favor manufacturers offering documented pressure certification alongside multi-year quality guarantees, since established podiatry culture across the region rewards reliability over price consistently overall broadly.
Share: 22% | CAGR: 4.9% (2026 to 2036)
Regional intelligence for 5 additional markets available in the complete report: East Asia, South Asia and Pacific, Latin America, Middle East and Africa, Eastern Europe. Contact sales@marketmindsadvisory.com.
shoe-insoles-market-country-cagr-analysis-1788175831226

Where Pressure Certification Creates Retail Margin

Margin in this category increasingly sits in documented pressure distribution and specialty retailer relationships rather than in raw manufacturing scale alone. Manufacturers converting that capability into premium clinical retail contracts are pulling well ahead of competitors still selling unverified foam into a price-sensitive replacement channel that keeps shrinking. That gap keeps widening across nearly every retail channel.

Build Documented Pressure Distribution Certification Programmes

Manufacturers that build documented pressure distribution certification ahead of confirmed buyer skepticism can access premium clinical retail placement that unproven competitors cannot obtain regardless of the price they offer. Superfeet's certification programme illustrates how testing investment made years before consumer trust concerns intensified converts directly into preferred-retailer status once buyers expect documented pressure mapping from a premium insole. That investment typically takes 3 to 8 months but opens the broadest possible premium clinical customer base available industry-wide. Manufacturers that delay this certification investment typically find themselves excluded from flagship promotion campaigns across most retail channels.
Market Impact: Certification lifts average blended pricing by roughly 22%

Develop Sensor Integration and Gait Tracking Systems

Manufacturers that develop documented sensor integration ahead of confirmed consumer demand capture premium contracts that competitors without electrical engineering expertise cannot fulfil once buyers require guaranteed tracking reliability across a device's usable life. Aetrex's integration programme shows how engineering investment made before consumer scrutiny intensified converts directly into preferred-brand status once buyers need proven monitoring performance. That investment typically takes 5 to 11 months but lifts blended margin by roughly 15% once fully achieved. Competitors relying solely on mechanical reputation increasingly struggle to match that same electrical engineering credibility within a comparable timeline overall broadly.
Market Impact: Integration systems lift blended margin by roughly 15%

Diversify Foam and Gel Component Sourcing

Manufacturers that diversify cushioning foam and gel component sourcing across multiple qualified suppliers capture cost stability that single-source competitors cannot match when any one supplier's price spikes unexpectedly during a period of constrained global polymer demand. That diversification typically adds 3% to 8% to procurement cost but secures the delivery reliability that specialty retail launch contracts increasingly require as a standing condition of the relationship itself. Manufacturers relying on a single foam supplier discovered this exposure during the 2022 to 2023 price spike, when component costs surged beyond anything most procurement teams had modelled previously.
Market Impact: Diversified sourcing adds roughly 3% to 8% cost

Establish Clinical Retailer Financing Partnership Programmes

Manufacturers that establish documented clinical retailer financing partnership programmes ahead of confirmed mainstream price sensitivity capture retail promotion slots that competitors without financing relationships cannot access once retailers specify preferred brand partners from the earliest launch planning stages. This approach typically adds 3% to 7% to trade marketing cost relative to standard retail distribution, but lets manufacturers secure promotion years before a competing brand can intervene. Retailers increasingly favor manufacturers who can guarantee financing terms upfront, since promotional calendars are typically locked months ahead and a late financing offer rarely secures meaningful shelf placement afterward.
Market Impact: Financing partnerships add roughly 3% to 7% cost

Who Controls the Margin Pool

Concentration sits at a low CR5 of 30%, reflecting a category where documented pressure distribution and specialty retailer relationships, not raw manufacturing scale alone, separate a small group of established manufacturers from a long tail of smaller entrants still building certification track record. Superfeet leads on documented pressure breadth and clinical retailer relationship depth, and the gap to mid-tier challengers is measured in engineering and testing investment rather than in production capacity alone.
All participants are assessed on unit shipment volume across specialty and mass retail channels, a consistent basis given how widely pressure certification and sensor depth vary by manufacturer across the category. Current competitive activity concentrates on three fronts: pressure distribution certification development, sensor integration engineering, and foam sourcing diversification. That pattern spans every major manufacturer competing in the category.

Emerging pressure comes from Chinese foam specialists scaling certification performance faster than legacy manufacturers expected, backed by rapidly expanding domestic supply chains and export ambition. Rankings are likely to shift toward manufacturers combining pressure distribution credibility with sensor integration depth, since neither brand heritage nor manufacturing scale alone decides premium clinical retail placement anymore in this category.
shoe-insoles-market-company-positioning-matrix-1788175831747

Competitive Moat and Risk Dimensions

SUPERFEET WORLDWIDE LLC

Moat: Deepest clinical retailer relationships

Superfeet's established podiatry and clinical retail partnership network and documented pressure certification history give it flagship placement access that newer entrants cannot replicate without years of certification track record. That reach lets it serve multiple clinical and mass retail channels simultaneously with proven certification documentation across a very large product portfolio.
SUPERFEET WORLDWIDE LLC

Risk: Sensor Integration Development Lag

Superfeet's foam-first manufacturing heritage leaves it comparatively less advanced in sensor integration development than newer entrants purpose-built around gait tracking from the outset, risking premium segment erosion as sensor technology becomes a genuine purchase driver. Closing that gap requires sustained software investment historically deprioritized by foam-first organizations broadly across every major market.
AETREX WORLDWIDE INC.

Moat: Strong sensor engineering depth

Aetrex's established sensor engineering capability and documented gait tracking performance give it premium contract access that foam-first competitors must contest through lengthy electrical engineering processes that discerning clinical retailers increasingly require. That engineering depth also feeds performance data back into next-generation product development ahead of competitors relying on simpler conventional designs.
AETREX WORLDWIDE INC.

Risk: Limited Mass Retail Distribution

Aetrex's clinical-first distribution heritage leaves it more exposed to mass retail relationship gaps than legacy manufacturers serving budget-conscious channels across multiple decades already. Building comparable mass retail trust typically takes years of consistent distribution performance, since legacy manufacturers already hold long-standing relationships that clinical-first entrants cannot quickly replicate easily overall across every channel.

Players Tracked

Prominent Players

Scholl's Wellness Company
Superfeet Worldwide LLC
Implus LLC
Currex GmbH
Stable Step LLC

Other Key Players

Aetrex Worldwide Inc.
Vionic Group LLC
New Balance Athletics Inc.
FootBalance System Ltd.
Protalus LLC
SOLE Technology Inc.
Birkenstock GmbH & Co KG
ECCO Sko A/S
Bauerfeind AG
Foot Science International Ltd.
Tread Labs Inc.
Pedag GmbH
Enertor Ltd.
Telebrands Corp.
Spenco Medical Corporation

Recent Developments

JANUARY 2025

Superfeet Expands Pressure Testing Laboratory Capacity

Superfeet completed an organic capacity expansion at its independent pressure distribution testing laboratory to meet growing demand from multiple insole product lines. The expansion was an organic capacity build, not an acquisition or joint venture, adding dedicated testing volume ahead of anticipated demand across two new facilities.
Signal: An organic expansion, not a transaction, shows manufacturers investing well ahead of confirmed demand growth. across the industry.
MAY 2025

Implus Signs Clinical Retailer Financing Agreement

Implus signed a multi-year clinical retailer financing agreement with a national podiatry retail chain to provide financed insoles across an expanded promotion programme. The arrangement was a supply agreement, not an acquisition or joint venture, securing guaranteed volume directly ahead of the retailer's promotion schedule.
Signal: A supply agreement, not a merger, shows retailer demand now drives multi-year sourcing decisions ahead of schedule.
SEPTEMBER 2025

Currex Acquires Minority Stake in Sensor Startup

Currex acquired a minority equity stake in a biomechanical sensor startup developing novel gait tracking technology for insole applications. The transaction was an equity investment rather than a full acquisition or merger, giving Currex early technology access without full development risk ahead of competitor moves.
Signal: A minority stake, not a full acquisition, shows manufacturers hedging sensor technology bets rather carefully. across the sector.

Foam and Gel Component Exposure

Cushioning foam and gel components account for roughly 28% of unit cost, sourced from established polymer suppliers across China, Germany, and the United States, with fabric covering and adhesive materials adding a further 12% to 20% depending on product category and connectivity depth required for the specific insole model involved. Packaging material choice also affects both unit weight and shipping cost too.
Cushioning foam prices climbed sharply through 2022 and 2023 as global polymer and specialty foam demand rebounded against constrained production capacity across major producing regions. The International Energy Agency has documented petrochemical supply concentration as a persistent polymer industry concern given the limited number of qualified foam producers, and manufacturers without long-term polymer contracts absorbed the cost spike directly into margin during the worst months of that period.

Exposure varies considerably by manufacturer scale and component sourcing diversity across the industry. Larger integrated manufacturers like Superfeet hedge polymer exposure through long-term supply partnerships, while smaller regional producers buying components on constrained markets absorb price swings immediately into unit cost with no buffer available. That gap leaves smaller producers disadvantaged during volatile periods across every price tier.
shoe-insoles-market-cost-volatility-analysis-1788175831944

Secure long-term foam supply contracts

Locking cushioning foam and gel volume through long-term supplier contracts protects production schedules from constrained supply during periods of peak polymer demand across the industry. This trades some pricing flexibility for delivery certainty that specialty retail contracts increasingly require as a standing condition of doing business. Buyers increasingly expect this certainty before finalizing any contract today already.

Invest in flexible formulation architecture design

Manufacturers shipping sufficient volume can justify investing in flexible formulation architecture that accommodates multiple polymer generations, capturing supply flexibility currently unavailable to single-source competitors while gaining direct control over cost timing over the medium to long term horizon ahead. This approach also reduces disruption risk tied to depending on a single foam supplier across product lines.

Diversify component sourcing across producing regions

Qualifying component suppliers across multiple regions simultaneously reduces exposure to any single region's trade policy disruption or manufacturing capacity constraint event. Manufacturers with diversified sourcing recovered from the 2022 to 2023 spike measurably faster than single-source buyers did, protecting margin through the worst of that volatility. That resilience advantage compounds further with each subsequent price cycle faced.

Portfolio Architecture for Margin Defence

The portfolio splits into three tiers with clear margin separation tied to certification depth and product category served. Commodity-grade unverified foam insoles for basic residential applications compete on price and earn thin margins, certified pressure units earn considerably more, and premium sensor-embedded systems carry the highest margin given their engineering integration barriers and clinical retailer relationship depth protecting that position from new entrants.
The tension between volume and premium reflects category directly: clinical retailers and premium buyers investing in certified platforms reward documented pressure performance and sensor quality over price, pulling manufacturers toward sustained certification investment year after year, while much of the commodity foam segment still buys on price alone with distribution reach mattering more than pressure depth. Manufacturers running multiple product lines must manage genuinely distinct engineering, distribution, and brand organisations without letting either investment starve the other of resources.

High-value margin pools concentrate in premium sensor-embedded and custom 3D-printed contracts, where documented pressure performance and sensor engineering both reward proven manufacturer capability directly and consistently. The volume core of commodity foam insole sale remains necessary for manufacturing scale but contributes comparatively little to blended margin across the portfolio as a whole.

Volume / Commodity-Adjacent Tier

Commodity-grade unverified foam insoles sold into basic residential applications, competing primarily on price with limited certification investment behind them. Margins stay thin because distribution reach, not pressure depth, decides most outcomes here.
Gross Margin: 10-18%

Premium / Certified Tier

Certified pressure units sold under documented distribution performance into mainstream clinical retail contracts across multiple buyer segments worldwide. Manufacturers earn meaningfully better margin here once buyers trust documented pressure claims fully.
Gross Margin: 20-30%

Sustainability / Regulatory / Next-Generation Tier

Premium sensor-embedded systems engineered specifically for the most demanding tracking and pressure requirements available in the category today. This tier commands strongest margin protection since sensor and certification barriers keep competitors from replicating it quickly.
Gross Margin: 26-38%
shoe-insoles-market-portfolio-architecture-1788175832442

High-value Sub-segments and Strategic Watch-out

Smart Sensor-Embedded Insoles

High value and the fastest-growing category at 12.5% CAGR, carrying both a connectivity premium and genuine sensor engineering barriers to entry that protect early movers from new entrants over time in most premium clinical markets. Buyers increasingly treat documented pressure certification as a baseline purchase requirement today.
Gross Margin: 26-38%

Custom 3D-Printed Insoles

High value with strong growth, sustained by gait-specific patients specifying documented fit accuracy across multiple use cases. Margin varies with the precision engineering depth a manufacturer holds today across the category. Manufacturers that invest early in tracking engineering typically capture premium contracts well before competitors act decisively.
Gross Margin: 20-30%

Comfort and Cushioning Insoles

The volume core, competing on price and comfort across most mainstream residential applications worldwide. Margin stays thin because manufacturing scale, not certification depth, dominates decisions in this segment across most markets. Large manufacturers protect this position through purchasing scale that smaller regional competitors cannot easily match today.
Gross Margin: 10-18%

Heated and Thermal Insoles

The strategic watch-out, where buyer willingness to pay a documentation premium remains largely unproven across niche seasonal applications today. Margin range is wide because pricing power varies sharply by individual customer relationship. Manufacturers should monitor this segment closely before committing development budget toward unproven documentation premium demand.
Gross Margin: 12-22%

Retailer Trust and Pressure Lock-In

Demand behaves like an annuity once a manufacturer wins clinical retailer flagship placement status: retailers rarely switch preferred insole partners mid-season, since replacing a promoted line means repeating months of certification review against an already proven product. That repeat-purchase pattern gives incumbent qualified manufacturers a durable revenue base that newer competitors cannot easily displace once retailer placement status is established across a product generation's commercial life.
Adoption depth varies sharply by buyer category. Podiatry-referred patients have converted deepest, since documented pressure and gait correction requirements make qualified sourcing close to mandatory for responsible orthopedic treatment planning. Casual comfort buyers adopt more selectively, weighing insole cost against foot discomfort frequency on a purchase-by-purchase basis, while budget-conscious buyers remain the shallowest adopters, often defaulting to whatever foam insole is available that budget cycle.

Buyer profiles are shifting generationally. Younger tech-forward athletes increasingly default to documented sensor-certified manufacturers without evaluating basic alternatives as heavily, treating gait tracking as a baseline requirement rather than an optional consideration. That default is spreading faster among first-time athletic buyers than among established podiatry patients, who weigh proven reliability track record most heavily at the point of purchase decision.
shoe-insoles-market-end-use-penetration-index-1788175832929

Pressure Certification Beats Legacy Brand Scale

These are among the four positions where our research anticipates prominent divergence between winners and laggards over the coming forecast period. Each is grounded in the demand model, the regulatory perimeter, and the announced capacity pipeline.
01 / PRESSURE CERTIFICATION STRATEGY

Manufacturers without pressure data will lose retail placement by 2029

Clinical retailers increasingly default to manufacturers holding documented pressure distribution certification, since unverified manufacturers cannot supply the load-mapping evidence that retail buying teams now require before approving flagship promotion. Superfeet's certification programme shows how addressable retail access follows directly from testing investment completed years earlier rather than from any late reliability claim. That certification gap will only widen as more retailers formalize pressure requirements into standard vendor evaluation criteria, rewarding manufacturers who invested early before requirements tightened broadly across every region this coming decade too.
02 / SENSOR INTEGRATION TIMING

Early connectivity investment will decide long-term premium contract share

Premium buyers increasingly require documented sensor integration before approving any flagship insole purchase decision. Manufacturers without that capability cannot bid on premium retail contracts regardless of the price they offer during negotiation. Aetrex's integration engineering shows how design investment completed years before scrutiny intensified converts directly into preferred-brand status, a trend already visible across multiple regional retail partnerships now formalizing tracking requirements into standard evaluation criteria, making it increasingly difficult for smaller manufacturers lacking comparable engineering teams to compete on equal footing at all today.
03 / FOAM DIVERSIFICATION APPROACH

Diversified sourcing will separate resilient manufacturers from exposed rivals

Cushioning foam volatility is exposing manufacturers with concentrated single-supplier sourcing to recurring margin disruption that vertically integrated competitors largely avoid through in-house production control. Manufacturers who invest in sourcing diversification now will capture premium contracts that increasingly demand documented cost stability from every bidder under consideration. That resilience gap will only widen as polymer price volatility continues across the broader plastics sector worldwide, a mistake few manufacturers can afford to repeat, especially those competing in premium clinical-driven markets nationwide across every major consuming region broadly.
04 / RETAILER FINANCING INNOVATION

Financing programmes will determine which manufacturers win promotion slots

Clinical retailers increasingly favour manufacturers offering documented financing and trade-in partnership programmes over standard retail distribution, since promotion slot access increasingly decides which insole brands stay ahead of competitor products during the earliest launch planning stages. Manufacturers without this financing approach cannot match promotion access regardless of any product quality advantage they might otherwise offer, a gap already reshaping how clinical retail contracts are being awarded across the industry today. That trend will keep accelerating as more retailers formalize financing requirements into vendor selection processes.

Engagement Snapshot From the Field

A live engagement with an industry participant carrying material or product regulatory and market exposure ahead of a defining policy shift, showing how our research translates into a defensible multi-year portfolio strategy.
MARKET MINDS ADVISORY · CLIENT ENGAGEMENT SUMMARY
Shoe Insoles Producer Strategic Portfolio Review and Transition Roadmap 2026·Investment Scenario on Shoe Insoles Exposure Evaluation 2025-26
CLIENT PROFILE
A national podiatry retail chain approached MMA while evaluating shoe insole manufacturer partnerships ahead of a flagship clinical promotion campaign across its orthotic category. The client reported annual insole category revenue surpassing USD 22 million and a promotion budget of USD 1.2 million tied to an eight-month launch timeline (client-reported, unverified by MMA). The client flagged uncertainty around pressure certification terms as a concern.
STRATEGIC CHALLENGE
Management wanted to launch the promotion ahead of a competing retailer's expected campaign but had not benchmarked pressure distribution certification and sensor integration quality across available manufacturers, nor evaluated whether any single manufacturer could realistically supply the full category assortment within the planned window. Marketing wanted proven pressure claims; finance wanted cost certainty.
MMA APPROACH
MMA benchmarked pressure distribution certification, sensor integration quality, and supply capacity across the three manufacturers the client was evaluating for its promotion campaign. We modelled supply timelines against the launch deadline and quantified realistic phasing scenarios using comparable national retail chain benchmarks. We also interviewed the client's retail staff to confirm realistic training timelines against actual store staffing levels.
KEY FINDINGS
  1. Only one of three evaluated manufacturers offered documented independent pressure certification sufficient to satisfy the client's marketing claims review (client-reported, unverified by MMA).
  2. Phasing the promotion across two product tiers added roughly 5% to total campaign cost while meaningfully reducing supply risk across the category assortment.
  3. The fastest realistic single-manufacturer supply timeline ran nine months, longer than the client's eight-month deadline allowed under the originally proposed launch scope.
  4. Manufacturers with existing retailer financing infrastructure cleared the client's approval process measurably faster than manufacturers lacking comparable programmes, reducing internal review time.
CLIENT PROFILE
A national podiatry retail chain approached MMA while evaluating shoe insole manufacturer partnerships ahead of a flagship clinical promotion campaign across its orthotic category. The client reported annual insole category revenue surpassing USD 22 million and a promotion budget of USD 1.2 million tied to an eight-month launch timeline (client-reported, unverified by MMA). The client flagged uncertainty around pressure certification terms as a concern.
STRATEGIC CHALLENGE
Management wanted to launch the promotion ahead of a competing retailer's expected campaign but had not benchmarked pressure distribution certification and sensor integration quality across available manufacturers, nor evaluated whether any single manufacturer could realistically supply the full category assortment within the planned window. Marketing wanted proven pressure claims; finance wanted cost certainty.
MMA APPROACH
MMA benchmarked pressure distribution certification, sensor integration quality, and supply capacity across the three manufacturers the client was evaluating for its promotion campaign. We modelled supply timelines against the launch deadline and quantified realistic phasing scenarios using comparable national retail chain benchmarks. We also interviewed the client's retail staff to confirm realistic training timelines against actual store staffing levels.
KEY FINDINGS
  1. Only one of three evaluated manufacturers offered documented independent pressure certification sufficient to satisfy the client's marketing claims review (client-reported, unverified by MMA).
  2. Phasing the promotion across two product tiers added roughly 5% to total campaign cost while meaningfully reducing supply risk across the category assortment.
  3. The fastest realistic single-manufacturer supply timeline ran nine months, longer than the client's eight-month deadline allowed under the originally proposed launch scope.
  4. Manufacturers with existing retailer financing infrastructure cleared the client's approval process measurably faster than manufacturers lacking comparable programmes, reducing internal review time.
RECOMMENDED STRATEGY
Phase 1: Phase 1 (0 to 3 months): Launch the premium tier promotion using the certification-verified manufacturer across flagship locations starting soon. Phase 2: Phase 2 (3 to 6 months): Extend the promotion to the mid-tier assortment using the proven single-manufacturer approach even more broadly. Phase 3: Phase 3 (6 to 8 months): Reassess manufacturer performance annually against certification and supply benchmarks achieved each following quarter thereafter.
OUTCOME
The client proceeded with the phased single-manufacturer promotion, launching ahead of the competing retailer's campaign and completing rollout within its eight-month target window. The client reported avoiding an estimated two-month launch delay it had modelled under a multi-manufacturer scenario (client-reported, unverified by MMA). The retailer has since renewed the partnership for next season.

Frequently Asked Questions

Foundational context covering the market sizes, CAGR, scope, country, region and competition that inform every finding below. This section is provided to cover basics and most often pre-purchase conversations, answered from the MMA Primary Research Dataset.

What is the current size of the Shoe Insoles Market?

The Shoe Insoles Market stood at USD 6.8 billion in 2025, based on MMA Primary Research Dataset estimates. Pressure certification and sensor integration are the primary near-term growth drivers.

How large will the Shoe Insoles Market be by 2036?

MMA projects the market reaching USD 13.46 billion by 2036 under the base case scenario. That represents a 1.86 times expansion over the 2026 base value.

What is the CAGR for the Shoe Insoles Market 2026 to 2036?

The base case CAGR is 6.4% annually. The bull case reaches 7.6% and the bear case falls to 5.2%, depending on certification adoption and polymer price trends.

Which segment is growing fastest?

Smart sensor-embedded insoles grow fastest at 12.5% CAGR, about 1.95 times the overall market rate. Documented gait tracking demand drives that sustained pace, especially across clinical and athletic channels.

Who are the major companies in the Shoe Insoles Market?

Scholl's Wellness Company, Superfeet, Implus, Currex, and Stable Step lead the category today. Combined, the top five hold a CR5 of 30% across a moderately fragmented field.

Which country is growing fastest?

India grows fastest at 9.8% CAGR, driven by its rapidly expanding athletic footwear culture. Growing middle-class purchasing power is reinforcing that pace further each year.

Report Segmentation Architecture

The full report scope spans multiple orthogonal segmentation dimensions, with cross-tabulated demand data provided for each dimension pair. Coverage extends further to regional breakdowns, trend trajectories, and the competitive detail needed to support segment-level decision-making.

By Insole Function Type

  • Comfort and Cushioning Insoles
  • Orthopedic and Corrective Insoles
  • Athletic Performance Insoles
  • Heated and Thermal Insoles
  • Custom 3D-Printed Insoles
  • Smart Sensor-Embedded Insoles

By End-Use Industry

  • Residential Personal Use
  • Clinical and Podiatry Prescription
  • Athletic and Sports Performance
  • Occupational and Workplace Safety

By Commercial Dimension

  • Specialty and Clinical Retail Sale
  • Direct-to-Consumer Online Sale
  • Mass Retail and Pharmacy Sale
  • Distributor and Regional Agent Sales

By Region

  • North America
  • Western Europe
  • East Asia
  • South Asia and Pacific
  • Latin America
  • Middle East and Africa
  • Eastern Europe

Scope, Methodology, and Coverage

Every figure in this report is reproducible from documented input assumptions. The scope below maps the historical period, the forecast horizon, the segmentation dimensions, and the countries covered, alongside the underlying primary and qualitative methodology.
Historical Period
2020 to 2025
Forecast Period
2026 to 2036
Base Year
2025 (USD billions; MMA Primary Research Dataset, August 2026)
Market Definition
The shoe insoles market comprises comfort and cushioning insoles, orthopedic and corrective insoles, athletic performance insoles, heated and thermal insoles, custom 3D-printed insoles, and smart sensor-embedded insoles sold for footwear comfort and correction use. Standalone orthotic braces, custom-molded prosthetic devices, and shoe-integrated midsole cushioning built into the footwear at manufacture are excluded.
Quantitative Units
USD billions (current prices); unit shipment volume where applicable
Segmentation Dimensions
By Insole Function Type; By End-Use Industry; By Commercial Dimension; By Region
Regions Covered
North America, Western Europe, East Asia, South Asia and Pacific, Latin America, Middle East and Africa, Eastern Europe
Countries Covered
USA, Canada, Germany, France, UK, Italy, Spain, China, Japan, South Korea, India, Australia, Brazil, Mexico, Argentina, UAE, Saudi Arabia, South Africa, Turkey, Poland, Czech Republic, Romania, Netherlands, Sweden, and additional markets relevant to this sector
Key Companies Profiled
Scholl's Wellness Company, Superfeet Worldwide LLC, Implus LLC, Currex GmbH, Stable Step LLC, Aetrex Worldwide Inc., Vionic Group LLC, New Balance Athletics Inc., FootBalance System Ltd., Protalus LLC, SOLE Technology Inc., Birkenstock GmbH & Co KG, ECCO Sko A/S, Bauerfeind AG, Foot Science International Ltd., Tread Labs Inc., Pedag GmbH, Enertor Ltd., Telebrands Corp., Spenco Medical Corporation
Quantitative Methodology
Primary survey, n=3,800 respondents, Q4 2025, six countries; demand-side model with trade association cross-validation
Qualitative Methodology
47 expert interviews, Q4 2025; applied to validate demand model assumptions, identify emerging dynamics, and assess competitive positioning
Report Format
PDF and XLSX data workbook (Word format preview document)
Publisher
Market Minds Advisory
Report Code
MMA-2026-MED-104
Published
August 2026
Contact
sales@marketmindsadvisory.com | www.marketmindsadvisory.com

Purchase the full Shoe Insoles Market Report (2026 to 2036).

The full MMA Shoe Insoles report sizes the market across six insole function types, four end-use industries, four commercial dimensions, and seven regions through 2036. It profiles twenty manufacturers on a consistent unit shipment volume basis, scoring each on pressure distribution capability, sensor integration depth, and foam sourcing diversification. Scenario models quantify how certification adoption, orthopedic health culture growth, and polymer price cycles shift both volume and realised price across product tiers. The report also includes delivered-cost modelling by product category, a polymer exposure screen, and clinical retail contract analysis built for manufacturer strategy, retail partnership, and investment teams.
Six-category segmentation with cross-tabulated regional demand
Twenty-company competitive benchmarking on shipment volume
Pressure distribution capability tracking by manufacturer
Sensor integration and gait tracking adoption analysis
Foam and gel price scenario modelling through 2036
Country-level orthopedic health and retail policy tracking

Built For The People Who Decide

From boardroom strategy to bench-side execution, this report is read cover-to-cover by leaders shaping the next decade of their industry, turning demand scenarios, market dynamics and valuation benchmarks into decisions.
CXOs/ Presidents/ VPs/ Managers
M&A and Corporate Development
Strategy Teams and R&D Heads
Procurement and Product Directors
Regulatory and Compliance Leaders
Investor Relations and Equity Analysts