Market Minds Advisory
Shipping Containers Market

Shipping Containers Market: One Country Builds Them All: Fleet Ageing, Leasing Economics, and the Decarbonisation Bill

A commercial reading of shipping container manufacturing, where a single country builds almost the entire world supply, leasing companies absorb the cycle, and reefer demand quietly outgrows the dry boxes everyone counts.

Lead Analyst

Bilal Shaikh

Published

September 2026

Make Smarter Decisions with Customized Research Insights

Request a free sample report and evaluate market opportunities, growth trends, and competitive dynamics relevant to your business needs.

2025 MARKET VALUE$11.4BMarket Size 2025
2036 FORECAST VALUE$19.1BBase Case , 2026 to 2036
CAGR 2026 TO 20364.8 %Bull 6.0% / Bear 3.6%
INCREMENTAL OPPORTUNITY$7.2BNet 10- year value creation
EXPANSION MULTIPLE1.60x2036 value over 2026 base
Strategic Levers
M&A Pipeline
Regional Outlook
Country Rankings
Competitive Intelligence
Segmental Deep-dive
Call-Us : 91 93563 13602

Executive Snapshot and Market Trajectory

Almost every shipping container in the world is built in one country, by a handful of companies, from steel priced on a single national market. That concentration is the defining commercial fact here, and it explains why container prices swing far harder than the trade volumes they supposedly track.
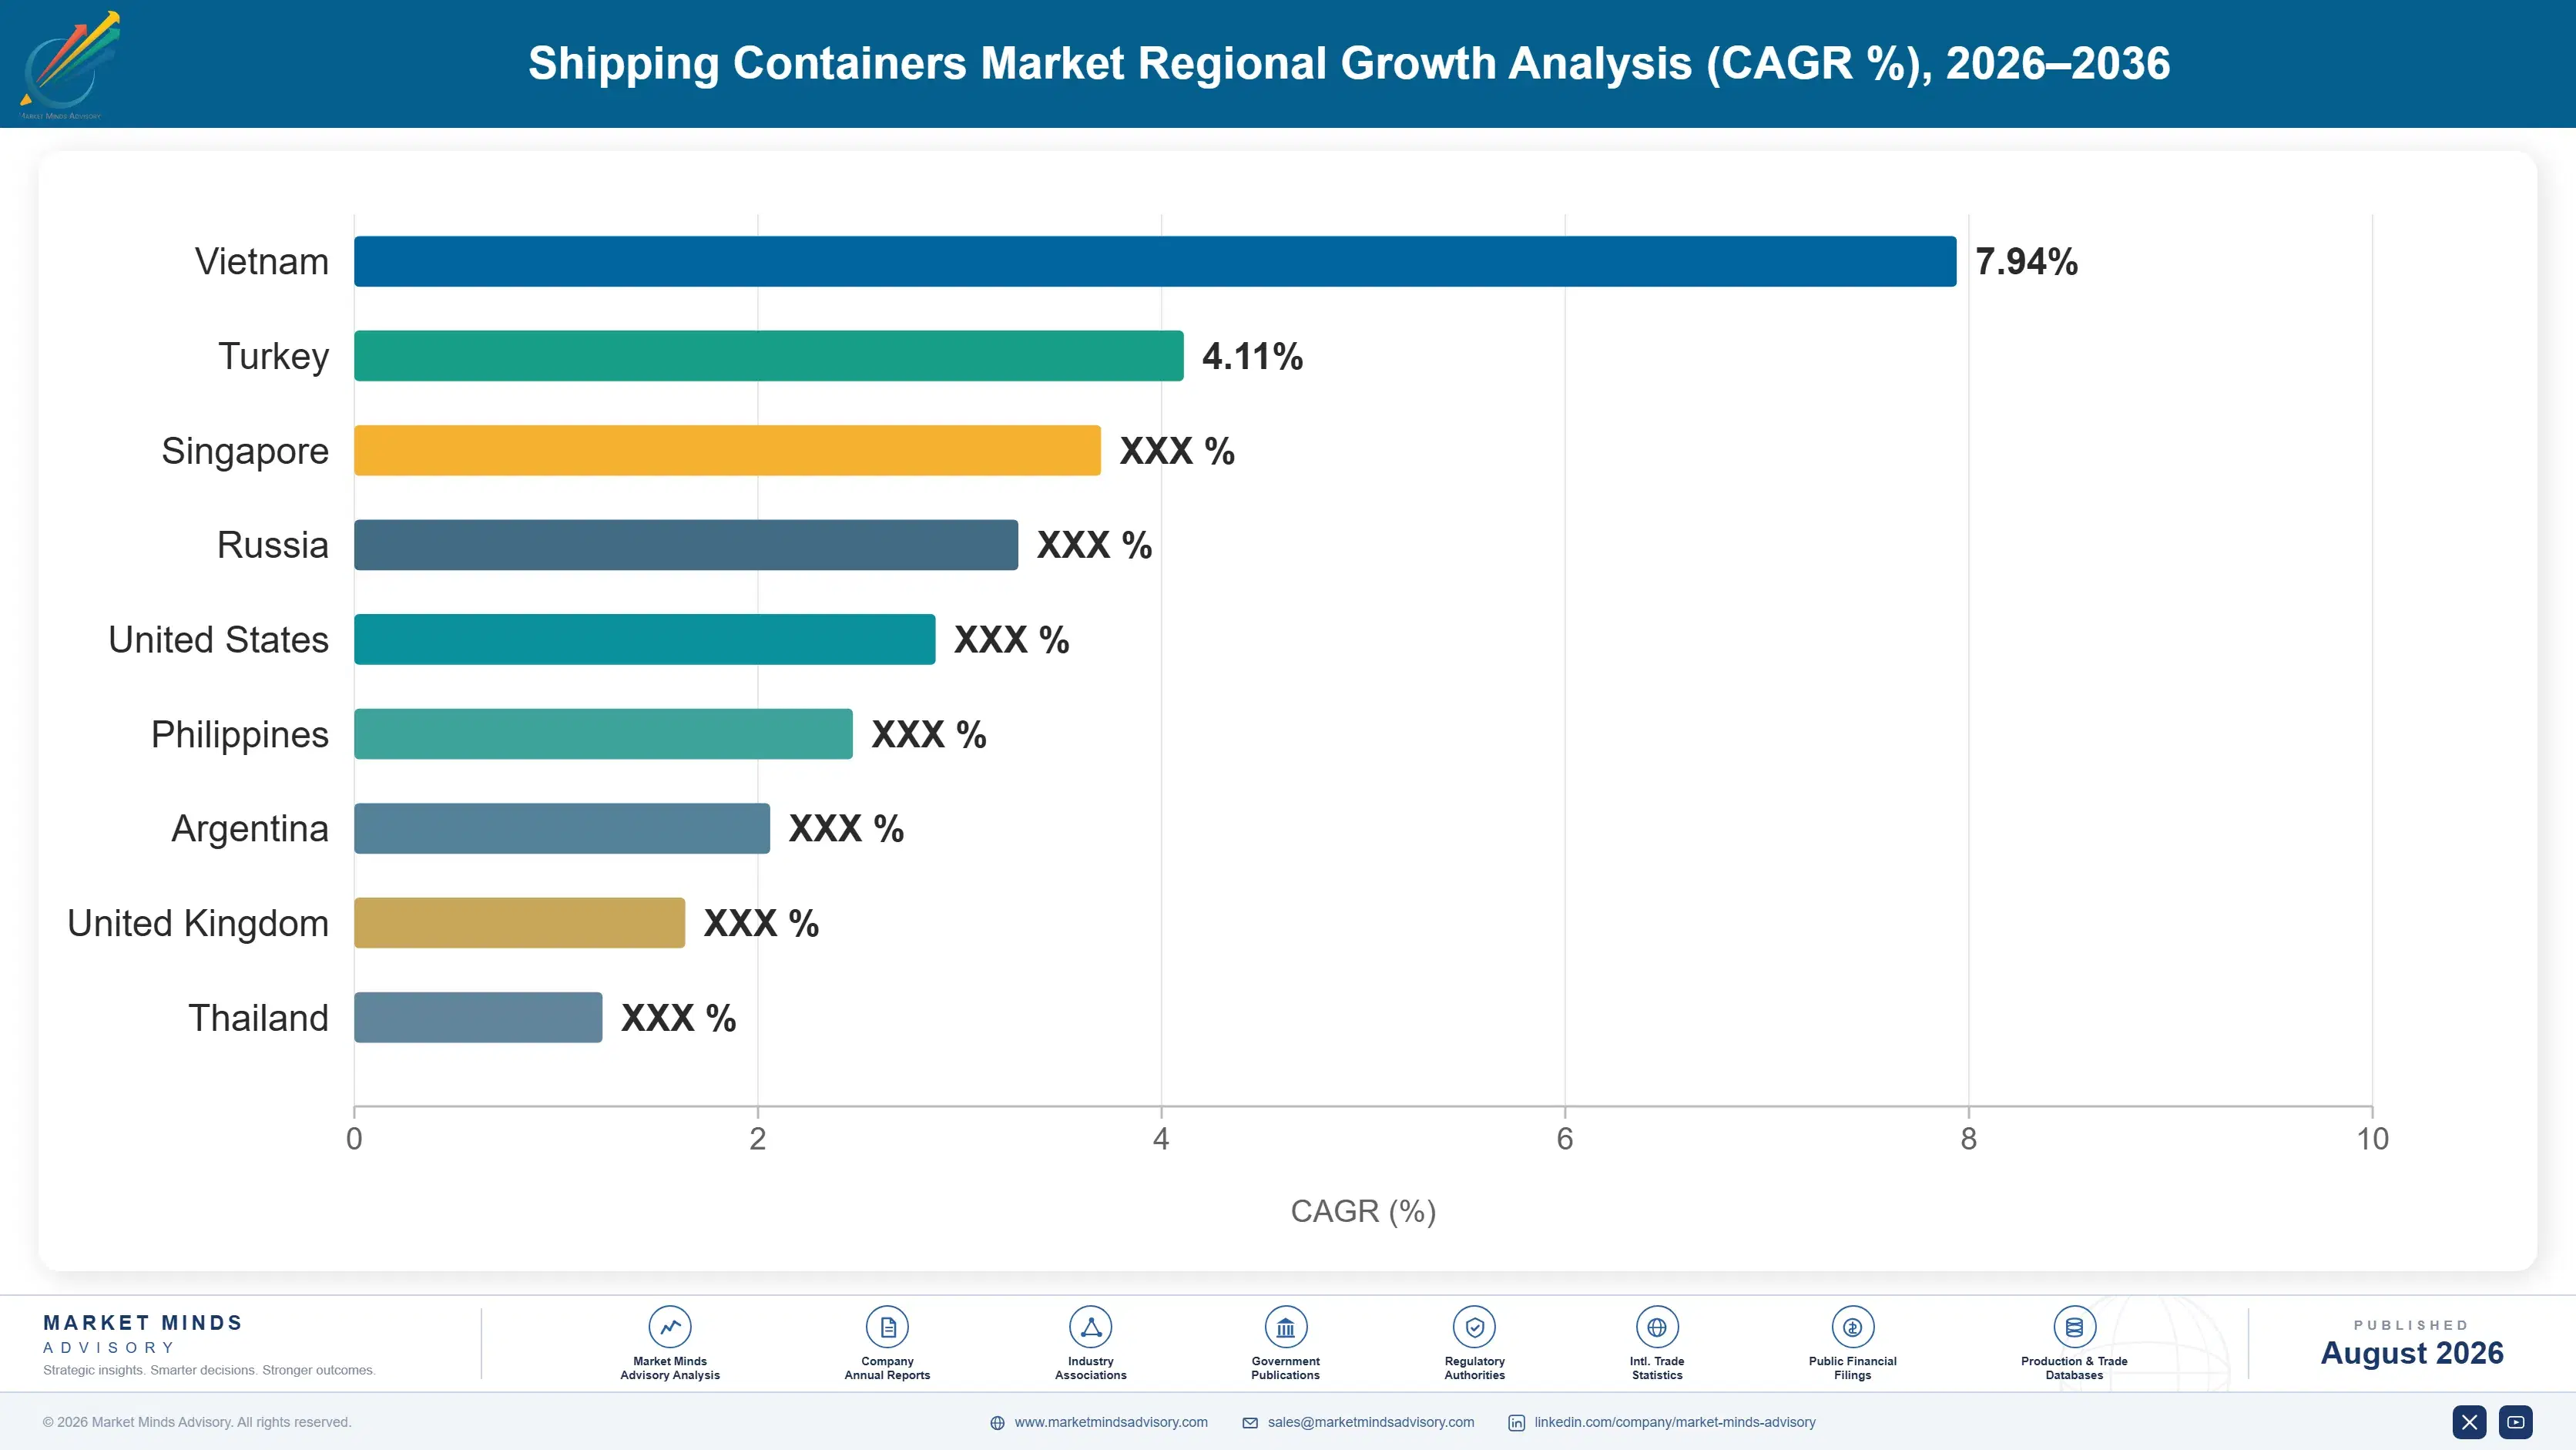
The market stands at USD 11.4 billion in 2025 and reaches USD 19.09 billion by 2036 at a 4.8% CAGR. Refrigerated containers grow fastest at 7.2%, about 1.50 times the overall rate, as perishable trade expands and reefer capacity tightens. East Asia holds 61% of value because production sits there, while Vietnam posts the quickest national growth at 9.4% as manufacturing capacity diversifies out of China.
Concentration is extreme by any industrial standard, with the top five holding roughly 78% of production and nearly all of it sitting in one country. Two forces are now reshaping demand in ways headline trade numbers conceal. The fleet built during the 2021 ordering surge is ageing toward replacement as a single concentrated cohort, and decarbonisation rules are starting to reach the box itself rather than only the ships carrying it.
Market Definition
The shipping containers market covers the manufacture and first sale of intermodal freight containers built to ISO standards for carriage by sea, rail, and road, spanning standard dry containers, refrigerated containers, tank containers, specialised and open-top containers, and folding or collapsible units. Container leasing and financing services, terminal handling equipment, chassis and trailers, domestic-only containers outside ISO dimensions, and container ships themselves are excluded.
Base Year Value
$11.4B in 2025 (MMA Primary Research Dataset, August 2026)
Forecast Period
2026 to 2036, eleven discrete annual values
CAGR
4.8% base case. Bull 6.0%. Bear 3.6%.
Fastest Growth Segment
Refrigerated Containers: 7.2% CAGR
Fastest Growth Country
Vietnam: 9.4% CAGR
Fastest Growth Region
South Asia and Pacific: 6.8% CAGR
Largest Region
East Asia: 61% of 2025 global value
Market Leaders
CIMC, Dong Fang International Containers, CXIC Group, Maersk Container Industry, Singamas Container Holdings. Source: MMA Analysis based on company annual reports.
Primary Survey
n=3,800 procurement and R&D decision-makers, Q4 2025, six countries
Methodology
Demand-side build-up, cross-validated against public data, 47 expert interviews

Shipping Containers Market Forecast Scenarios

shipping-containers-market-size-forecast-scenario-1787324219424
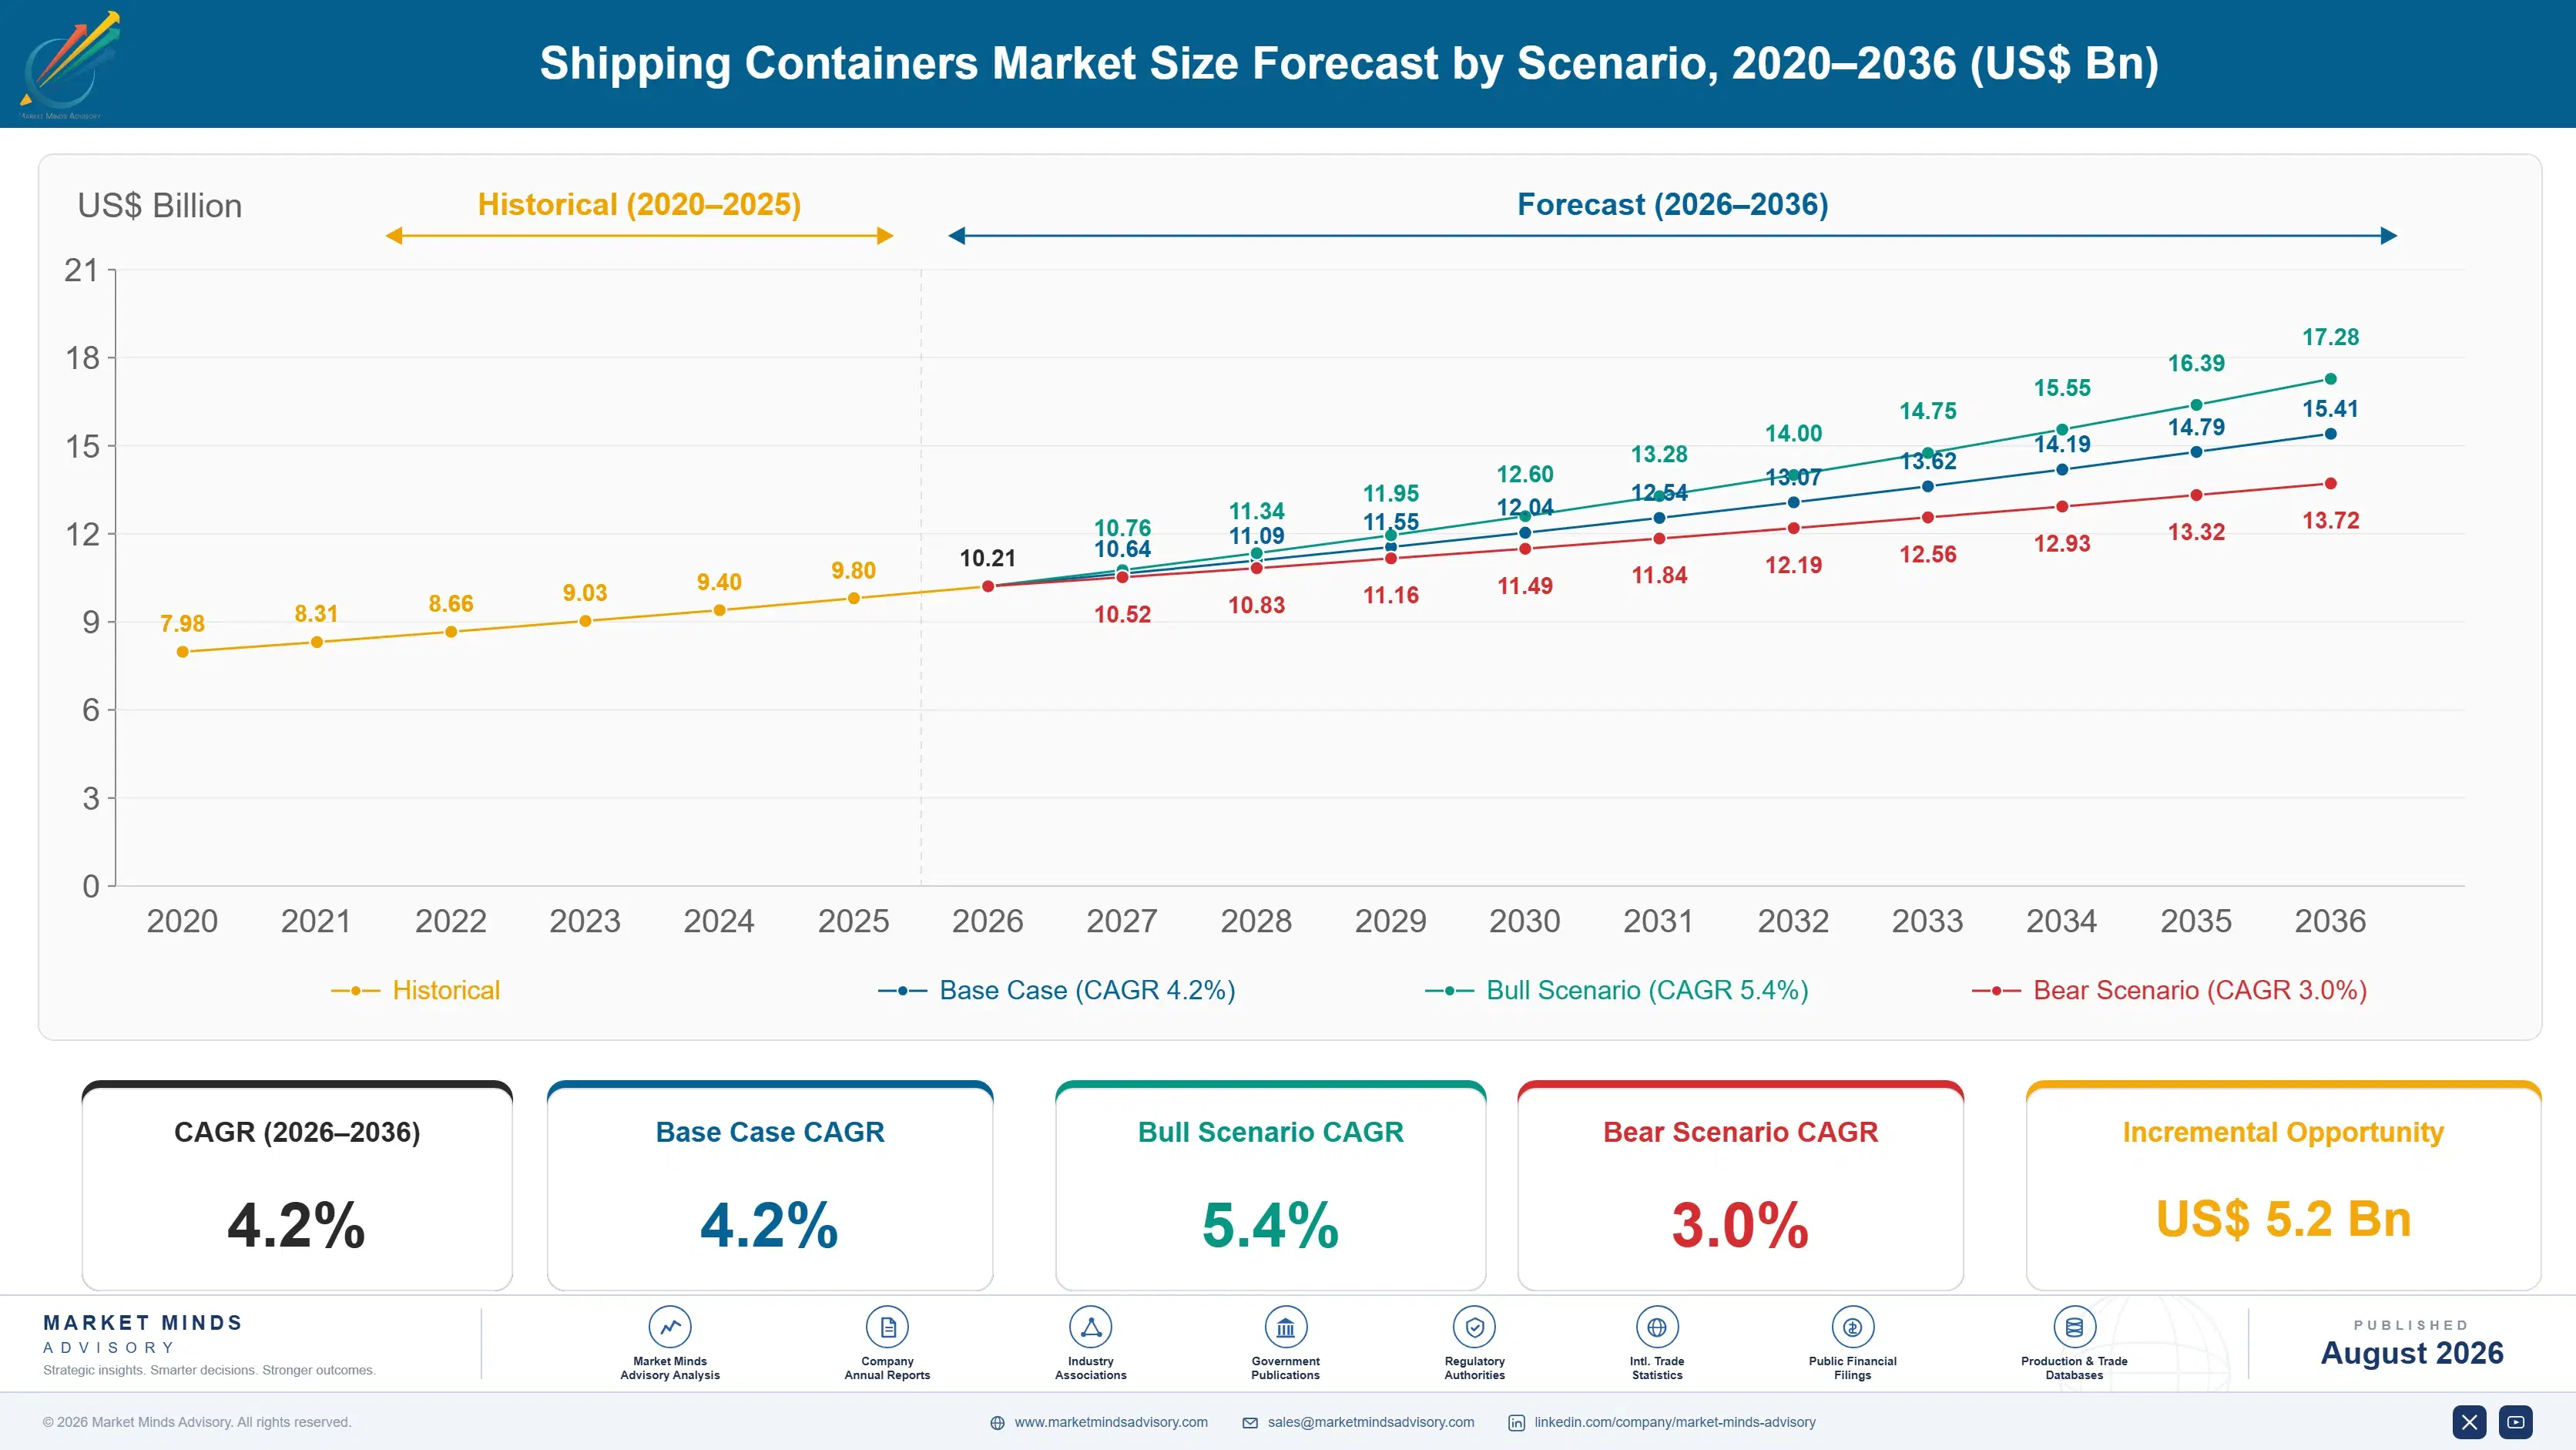
Growth from 2020 to 2025 compounded near 3.4%, disrupted sharply by a pandemic-era ordering surge in 2021 that briefly tripled production rates across most major Chinese factories before collapsing into a severe order glut through 2023 as freight rates normalised and carriers absorbed excess container inventory across most major global trade lanes during that period.
Three mechanisms carry the base case to 4.2%. First, global container fleet aging, since the average box runs twelve to fifteen years before retirement and replacement demand tracks that ageing curve independent of trade growth. Second, cold chain trade expansion, as pharmaceutical and perishable food logistics require refrigerated capacity general dry freight cannot serve at all. Third, leasing company fleet growth, which has steadily shifted new-build ordering away from asset-light carriers toward capital-focused lessors specifically.
The bull case at 5.4% assumes global trade volume accelerates and cold chain expansion broadens faster than current logistics infrastructure investment plans suggest. The bear case at 3.0% assumes another ordering glut similar to 2021 depresses replacement demand for several years afterward, and steel price spikes push manufacturers to defer capacity expansion during the resulting margin squeeze.

Why One Country's Steel Price Sets Global Container Cost

Three forces set demand. Replacement dominates, since the world fleet ages steadily and containers built in any surge year retire together as a cohort. Trade volume growth adds the second layer, expanding slowly but reliably in line with global goods output. And equipment repositioning imbalances add a third, because trade flows are directional and empty boxes accumulate where imports exceed exports, forcing lines to buy new capacity in deficit regions.
MARKET CONCENTRATIONCR5: 78%Among the most concentrated manufacturing bases in any industry
CONTAINER SERVICE LIFE12 to 15 yearsWorking life in marine service before sale or scrapping
STEEL SHARE OF COSTAbout 55%Corten steel as a portion of finished container manufacturing cost
LEASED FLEET SHAREAbout 50%Portion of the world fleet owned by leasing companies
GLOBAL FLEET SIZEAbout 55 million TEUTotal intermodal boxes in service across all operators worldwide
REEFER SHARE OF FLEETAbout 7%Refrigerated units as a share of total containers in service
The commercial character is extraordinarily cyclical and concentrated. Container prices can double or halve within eighteen months, driven by steel input costs, shipping line ordering sentiment, and manufacturing capacity that sits almost entirely in one country. Leasing companies absorb much of that volatility for the lines, buying counter-cyclically when prices fall and holding equipment on long-term lease. Roughly half the world fleet sits on lessor balance sheets.
The next decade turns on two things. Whether the 2021 ordering cohort retires as a concentrated wave, which would compress several years of replacement demand into a short window. And whether decarbonisation regulation reaches container manufacturing itself, since the steel and refrigerant embedded in each box have so far attracted far less scrutiny than the ships that carry them.
"People model this as derived demand from trade growth. It is not. It is a replacement business with a lumpy age profile, run through one country's steel market, and the trade number is almost a rounding error next to what the fleet's birthday distribution does to it."
Director, Maritime and Intermodal Equipment Practice · MMA Industrial Equipment

Market Trends

Manufacturing Capacity Slowly Diversifies Out Of China

Chinese factories have produced the overwhelming majority of world container output for two decades, and buyers have become genuinely uncomfortable with that concentration. Vietnam is the clearest beneficiary, with new capacity commissioned specifically to serve lines and lessors seeking any alternative source, and India has attracted government-backed investment aimed at supplying its own trade rather than export markets. The commercial reality remains that Chinese cost and scale are difficult to match on economics alone, so diversification proceeds slowly, from a small base, and at a price premium buyers now accept for supply security.
Market Impact: Cohort retires from 2033 onward
Refrigerated Demand Outgrows The Dry Box Fleet

Refrigerated containers represent only about 7% of the world fleet but consistently grow faster than dry equipment, because perishable food, seafood, pharmaceutical, and temperature-controlled chemical trade all expand faster than general cargo does. Reefer units also cost several times a dry box, so the value share exceeds the unit share considerably and the category matters far more commercially than fleet counts suggest. Controlled atmosphere technology has extended the range of goods that travel by sea rather than air, converting freight between modes. Refrigerant regulation complicates this, forcing redesign on a fixed timetable.
Market Impact: Sea freight costs 10% of air

Market Opportunities and Growth Drivers

The 2021 Ordering Surge Creates A Replacement Cohort

Container production reached record levels through 2021 as pandemic port congestion trapped equipment across the network and shipping lines ordered aggressively to cover the shortfall. Those boxes entered service within an unusually narrow window, and marine containers typically work twelve to fifteen years before being sold into static storage or scrapped outright. That means a concentrated retirement wave arrives in the back half of this decade, front-loading replacement demand into a compressed period rather than spreading it evenly as a normally distributed fleet would. Every major owner faces the same profile simultaneously.
Market Impact: Prices tripled then fell 50%

Perishable And Pharmaceutical Trade Shifts From Air To Sea

Controlled atmosphere and improved reefer technology have extended the transit time that perishable goods tolerate, moving cargo that once flew onto ships at a fraction of the freight cost and carbon intensity. Fruit, seafood, floriculture, and increasingly temperature-controlled pharmaceuticals all follow this path as validation standards mature and shippers gain confidence in the equipment. The commercial significance is that each converted shipment requires a reefer container rather than an aircraft hold, and reefer units cost several times a dry box while carrying considerably better manufacturer margin than any standard equipment does.
Market Impact: Average haul length fell 5%

Market Restraints and Challenges

Container Prices Swing Violently With Steel And Sentiment

New container prices roughly tripled through 2021 and then fell by more than half, a swing far larger than any movement in underlying trade volume over the same period. The root cause is that manufacturing capacity is concentrated and relatively inflexible while ordering is sentiment-driven, so lines and lessors order in unison when equipment is short and stop together when it is not. Corten steel pricing amplifies the effect further at every turn. Leasing companies partially absorb this by buying counter-cyclically, but manufacturers face utilisation that can halve within a single year.
Market Impact: China builds over 95% of output

Trade Fragmentation Reduces Long-Haul Container Demand

Tariffs, nearshoring, and supply chain regionalisation all shorten the average distance freight travels, and container demand depends on both volume and voyage length, because a box on a long route stays unavailable for longer. The root cause here is policy rather than economics, which makes it unusually difficult to forecast or hedge against. The commercial impact is that trade volume can hold perfectly steady while container requirements fall, since shorter routes turn equipment considerably faster. Manufacturers respond by weighting output toward reefer and specialised units where the demand driver differs.
Market Impact: Reefers are 7% of fleet units
3 additional market trends, 4 additional growth drivers, and 2 additional restraints and challenges are covered in the full report. Contact sales@marketmindsadvisory.com to access the complete intelligence.

Segment CAGR and Growth Architecture

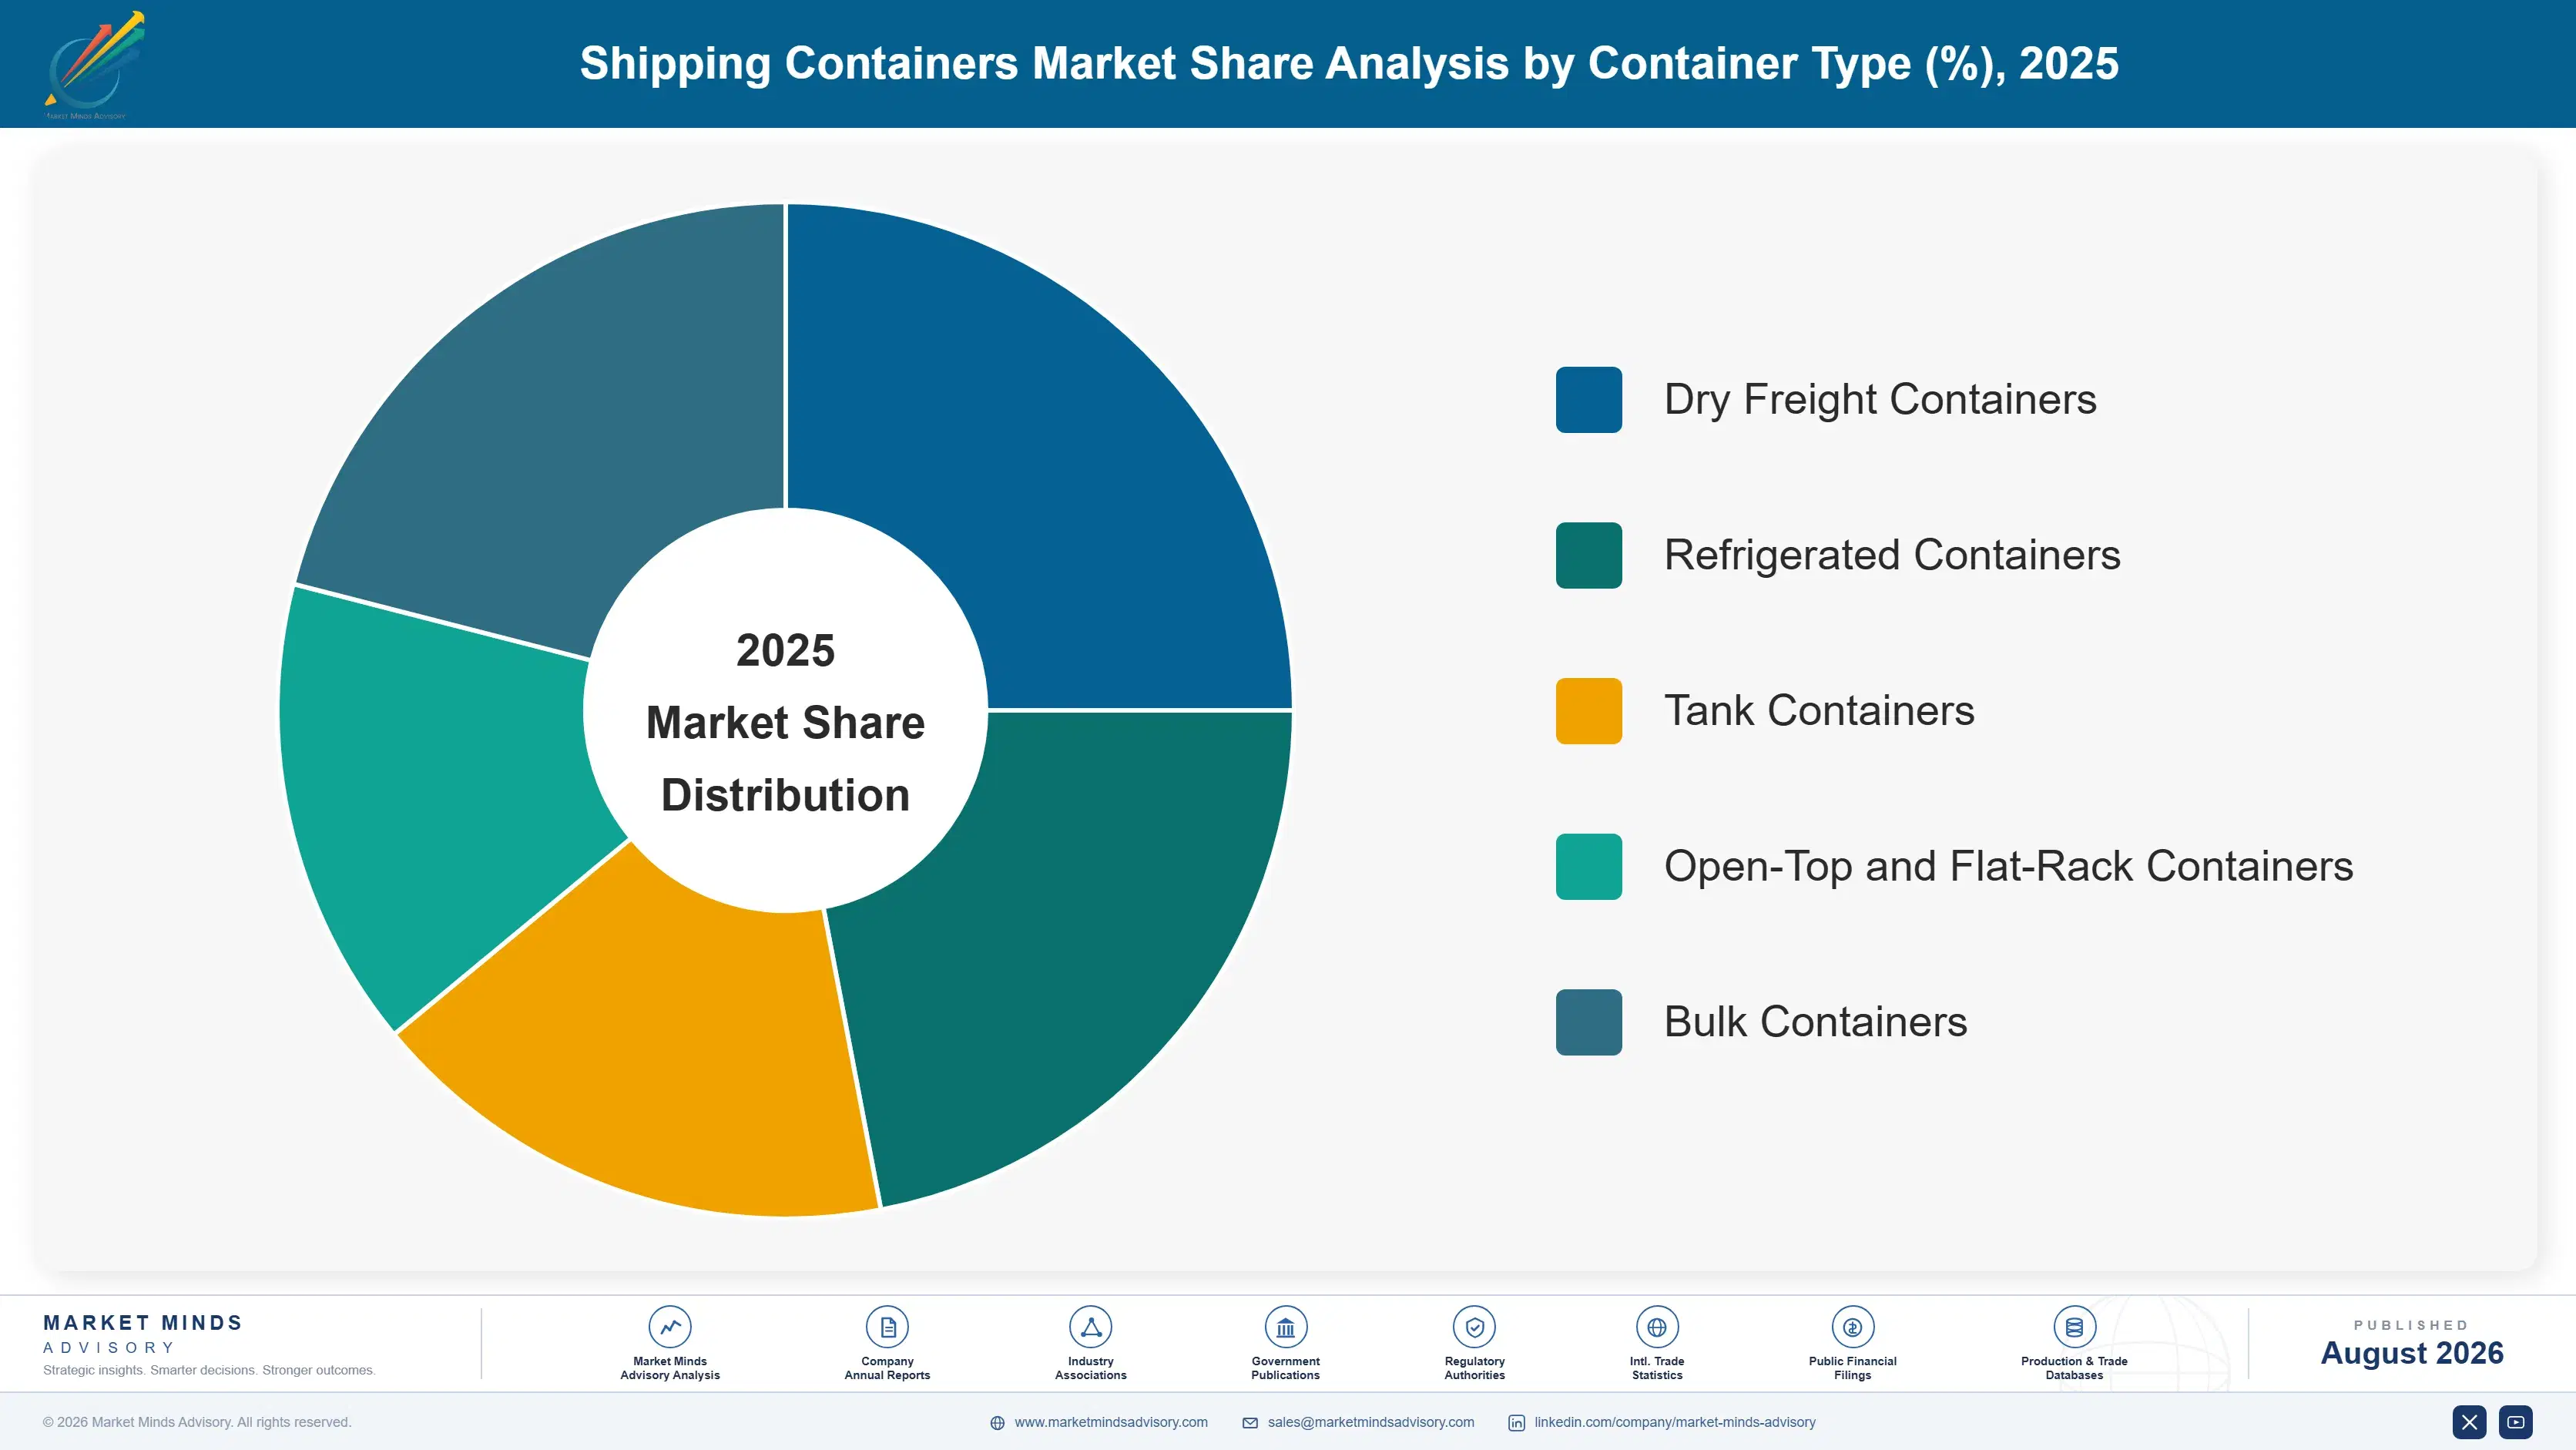
Segmentation follows container type, a single equipment logic describing what the box is built to carry. Each type carries its own manufacturing complexity, price point, replacement cycle, and demand driver, so commercial position tracks the equipment rather than the trade lane it serves. End-use cargo category and ownership model each appear separately within the framework as distinct dimensions.
shipping-containers-market-market-share-analysis-1787324219968

Refrigerated Containers

Refrigerated containers grow fastest at 7.2%, about 1.50 times the overall 4.8% rate, despite representing only around 7% of fleet units in service. The value share runs well above the unit share because a reefer costs several times a dry box, carrying an integrated refrigeration machine, insulation panels, and control electronics. Growth comes from perishable food, seafood, floriculture, and pharmaceutical trade expanding faster than general cargo, and from controlled atmosphere technology converting shipments that previously travelled by air. Maersk Container Industry historically led the category before restructuring, with Chinese manufacturers and refrigeration specialists including Carrier and Thermo King supplying machinery. Refrigerant phase-down schedules impose redesign on a fixed regulatory timetable.
CAGR 7.2%

Tank Containers

Tank containers grow at 6.4%, the second-fastest type, carrying bulk liquids, chemicals, food-grade products, and gases in ISO frames that allow intermodal handling alongside standard boxes. The category is technically demanding, requiring pressure vessel certification, dedicated cleaning station networks, and cargo-specific linings, which keeps the qualified manufacturer field far narrower than for dry containers anywhere. Chemical trade growth and the substitution of tank containers for drummed shipments both drive demand, since tanks reduce handling, contamination risk, and packaging waste simultaneously. Units are also far longer-lived than dry boxes, with twenty years or more in service common, which makes replacement demand a much smaller share of total ordering than it is anywhere else in this market.
CAGR 6.4%
Full segment breakdown across 5 segments available in the complete report.

Regional Architecture and Country Demand Map

Manufacturing rather than consumption sets this distribution, and manufacturing is concentrated to a degree seen in almost no other industry. East Asia dominates because Chinese factories build nearly all world output, while every other region records the modest production capacity it retains rather than the boxes it uses.

North America

Almost no container manufacturing survives in North America, which is why the region records just 8% of value against the 22 to 32% band, despite being among the world's largest users of the equipment itself. What production remains serves specialised, tank, and domestic intermodal units where transport cost or certification requirements make imported equipment impractical to source. American demand is overwhelmingly met by Chinese-built boxes arriving loaded with cargo. The region's commercial weight sits in leasing rather than manufacturing, with Triton, Textainer, and SeaCube all headquartered here and owning substantial global fleets. Growth of 4.4% reflects specialised production and modest reshoring interest rather than any genuine return of volume dry container manufacturing.
Share: 8% | CAGR: 4.4% (2026 to 2036)

Western Europe

Volume container manufacturing left Western Europe decades ago, leaving 9% of value against the 18 to 26% band, concentrated almost entirely in high-specification niches. Tank containers are the exception that matters commercially, with European manufacturers retaining genuine positions on the strength of pressure vessel engineering, chemical industry proximity, and certification expertise that transfers poorly to lower-cost locations. Maersk Container Industry's Danish reefer operations were in scale before restructuring removed them entirely. The region's influence now runs through standards, refrigerant regulation, and the leasing and shipping companies headquartered here rather than through production. Growth of 3.2% is the slowest of the seven, reflecting a base that keeps narrowing toward specialised equipment only.
Share: 9% | CAGR: 3.2% (2026 to 2036)
Regional intelligence for 5 additional markets available in the complete report: East Asia, South Asia and Pacific, Latin America, Middle East and Africa, Eastern Europe. Contact sales@marketmindsadvisory.com.
shipping-containers-market-country-cagr-analysis-1787324220525

Where Container Makers Actually Defend Margin

Competing on dry box price against Chinese scale is a contest almost nobody wins, and the manufacturers who survive elsewhere have stopped trying to. The four moves below shift earnings toward positions that volume production cannot occupy: refrigerated and tank equipment, counter-cyclical order timing, secondary life value, and the certification barriers that keep competition narrow.

Weight Production Toward Reefer And Tank Equipment

A standard dry container is a commodity built to identical specification by several factories, and price is essentially the only variable. A reefer carries an integrated refrigeration machine and costs several times as much, while a tank container requires pressure vessel certification that narrows the qualified field considerably. Manufacturers weighting output toward these categories earn materially better margin per unit and face fewer credible competitors. Reefer and tank units together represent under 10% of fleet by count but a far larger share of manufacturing value, which is precisely where the commercial opportunity sits.
Market Impact: Reefers cost 4 to 6 times dry boxes

Time Order Books Against The Steel Cycle

Corten steel is roughly 55% of container manufacturing cost, and container prices swing far more violently than steel does, because ordering sentiment amplifies every input move. Manufacturers who contract steel forward during price troughs and hold order book capacity for the recovery capture a spread that pure spot operators surrender entirely. Leasing companies already run this playbook deliberately on the equipment side, buying counter-cyclically whenever container prices collapse below replacement cost. Manufacturers who instead chase volume at any price during downturns destroy exactly the margin that the subsequent upturn was supposed to restore.
Market Impact: Steel is 55% of total manufacturing

Capture Value In The Secondary And Conversion Market

A marine container leaves service after twelve to fifteen years but remains sound, and the secondary market for static storage, conversion into buildings, and one-way trade absorbs enormous volume every single year. Manufacturers who build residual value into design, and who participate in refurbishment and conversion rather than ceding it entirely to traders, capture a second margin from equipment they have already sold once. Boxes retiring from marine service typically retain 15% to 25% of original value, and that recovery materially improves the total cost equation for the original buyer.
Market Impact: Retired boxes retain 15% to 25% of

Build Certification Barriers Competitors Cannot Cross Quickly

Tank containers require pressure vessel approval, food-grade certification, and cargo-specific lining qualification, each taking time and testing that no new entrant can compress simply by spending more money. The same applies to reefer units carrying pharmaceutical validation for temperature-controlled and life-science cargo. Manufacturers should deliberately pursue the certifications that narrow the competitive field rather than the volume categories where anyone with a press and a welding line can compete on equal terms. Certification typically takes 12 to 24 months per category, which is precisely why it protects a position once established.
Market Impact: Certification takes 12 to 24 months

Who Controls the Margin Pool

Concentration is extreme by any industrial standard: the top five hold roughly 78% of production, and nearly all of it sits in one country. The gap between the leader and everyone else is a gap in scale rather than capability, since dry container manufacturing is not technically difficult. All participants here are assessed on one basis, revenue from intermodal container manufacturing, excluding leasing, financing, and terminal handling equipment.
Competition runs along three lines. First, manufacturing scale and steel purchasing, which decide dry container cost and therefore essentially the entire volume market. Second, certification depth in tank and refrigerated equipment, where pressure vessel and pharmaceutical qualification narrow the credible field considerably. Third, relationships with leasing companies, since lessors own roughly half the world fleet and place orders in blocks that fill factory capacity for months.

Pressure is building from two directions. Buyers are actively seeking non-Chinese supply on security grounds, funding Vietnamese and Indian capacity at premiums they would not otherwise accept. Meanwhile the reefer category has restructured, with Maersk Container Industry's manufacturing operations wound down and Chinese producers taking that volume. Rankings should favour manufacturers holding certification depth in specialised equipment over those competing on dry box volume alone.
shipping-containers-market-company-positioning-matrix-1787324221043

Competitive Moat and Risk Dimensions

CIMC

Moat: Unmatched manufacturing scale worldwide

China International Marine Containers operates the largest container manufacturing footprint anywhere, spanning dry, refrigerated, tank, and specialised equipment at a scale no competitor approaches. That scale delivers steel purchasing power and utilisation flexibility which set the cost floor for the entire industry. Its relationships with major leasing companies secure block orders filling capacity for months.
CIMC

Risk: Single-country concentration and cyclicality

Production concentrated almost entirely in China leaves CIMC exposed to exactly the supply security concerns pushing buyers toward Vietnamese and Indian alternatives. Container demand is also violently cyclical, and utilisation can halve within a single year when ordering sentiment turns. Its scale advantage becomes a fixed cost burden in downturns, and diversification carries its own cyclical exposure.
DONG FANG INTERNATIONAL CONTAINERS

Moat: Reefer and specialised depth

Dong Fang holds particular strength in refrigerated and specialised containers, categories carrying materially better margin than dry boxes and requiring capability that takes years to establish. Its position strengthened as Maersk Container Industry wound down reefer manufacturing, absorbing volume from a departing competitor. Backing within the China Merchants group provides balance sheet depth through the industry's severe cycles.
DONG FANG INTERNATIONAL CONTAINERS

Risk: Refrigerant regulation and technology risk

Refrigerated containers face phase-down schedules on working refrigerants that force redesign on a regulatory timetable rather than a commercial one, with compliance costs falling on the manufacturer. Reefer machinery is supplied by external specialists, leaving Dong Fang dependent on their development cycles. Concentration in higher-value categories also means a downturn in perishable trade hits harder.

Players Tracked

Prominent Players

CIMC
Dong Fang International Containers
CXIC Group
Maersk Container Industry
Singamas Container Holdings

Other Key Players

Jindo Corporation
W&K Container
Charleston Marine Containers
TLS Offshore Containers
Welfit Oddy
Nantong Tank Container
CXIC Yangzhou Tongyun
Bslcontainers
Hoover Ferguson
Bertschi
Sicom Testing
China Eastern Containers
Thurm Container
Carrier Transicold
Thermo King

Recent Developments

SEPTEMBER 2022

Maersk announces wind-down of container manufacturing operations

A.P. Moller Maersk announced it would discontinue Maersk Container Industry's manufacturing activities after a planned sale to China International Marine Containers failed to secure regulatory clearance. This was a wind-down following an abandoned acquisition rather than a completed transaction, and it removed a significant non-Chinese reefer manufacturer from the market.
Signal: A blocked acquisition ending in closure co
OCTOBER 2023

Kigali Amendment refrigerant phase-down tightens for container equipment

Hydrofluorocarbon phase-down schedules under the Kigali Amendment progressed into steeper reduction steps affecting refrigeration equipment including marine reefer containers. This was a regulatory milestone under an existing treaty rather than any new legislation, and it obliged manufacturers to redesign refrigeration systems on a fixed compliance timetable.
Signal: Refrigerant regulation now sets reefer pro
MARCH 2024

Vietnamese container manufacturing capacity enters commercial production

New container manufacturing capacity in Vietnam reached commercial output, supplying shipping lines and leasing companies seeking supply outside China. This was organic capacity commissioning by regional manufacturers rather than any acquisition or joint venture, and buyers accepted higher unit costs in exchange for source diversification.
Signal: Buyers paying a premium purely for non-Chi

Corten Steel, Timber, Paint, Labour

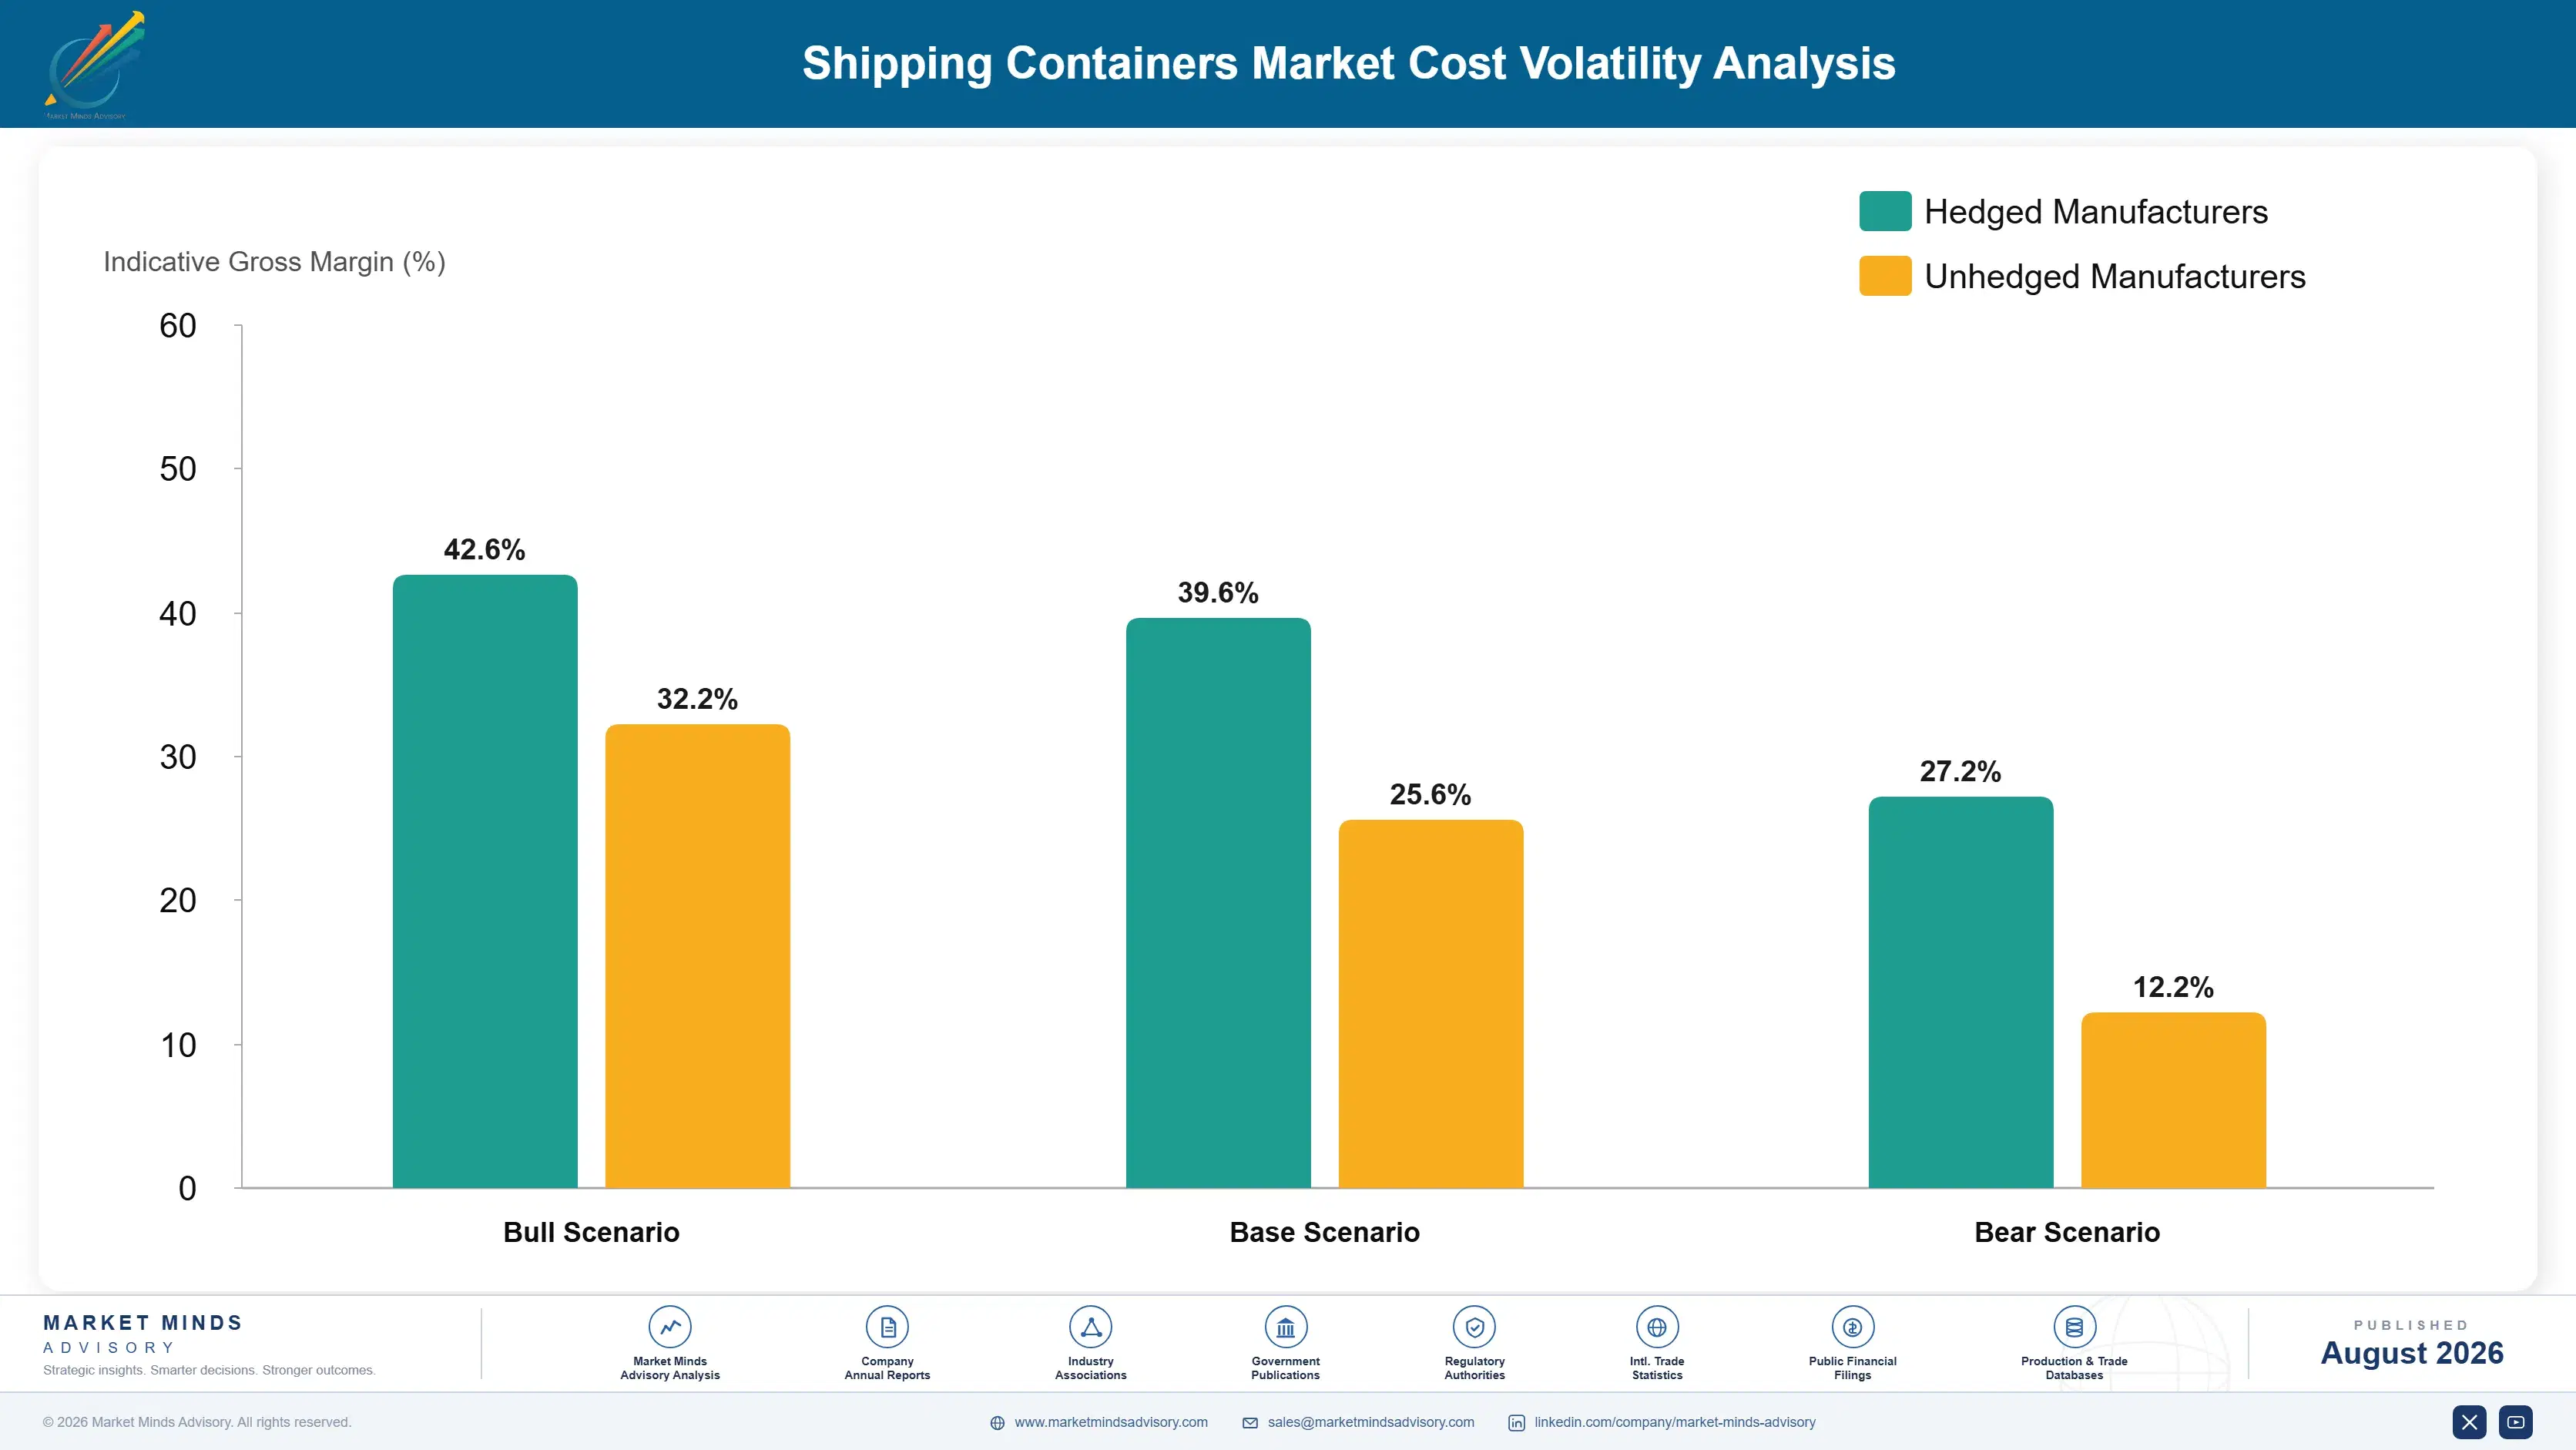
One input dominates everything else here. Corten weathering steel accounts for roughly 55% of finished container cost, purchased almost entirely from Chinese mills at Chinese domestic prices. Timber or bamboo flooring adds 8% to 12%, marine coatings and paint systems a further 6% to 10%. Manufacturing labour takes 10% to 15%, with refrigeration machinery dominating reefer cost entirely and pushing that category's structure somewhere different.
Steel movement passes through to container prices almost immediately, and the 2021 episode showed how violently. Corten prices rose sharply while port congestion trapped equipment, and new container prices roughly tripled before falling more than half as the surge unwound. CIMC disclosed the resulting margin swing across its 2021 and 2022 annual reporting. EIA data recorded parallel energy cost movement affecting steel production through the same window.

Exposure is remarkably uniform because almost everyone buys the same steel from the same market. That is precisely the difficulty for manufacturers outside China, who face identical input cost without the scale, logistics proximity, or domestic mill relationships. The hardest position is a Vietnamese or Indian producer importing Chinese steel to compete against Chinese factories, which is why diversification carries a premium.
shipping-containers-market-cost-volatility-analysis-1787324221241

Contract corten steel forward through price troughs

Steel is over half of container cost and moves in cycles that are severe but reasonably visible, unlike ordering sentiment which is not. Contracting volume forward when prices are depressed, and holding capacity for the recovery, captures a spread that spot buying surrenders. Leasing companies already run this logic on equipment, which shows the approach works.

Qualify regional steel sources for non-Chinese manufacturing sites

A container plant outside China that imports Chinese steel carries the input cost of its competitor plus freight, a position no operating efficiency can rescue. Qualifying Indian, Korean, or Southeast Asian corten supply removes that handicap even where unit cost is higher, because it decouples the plant from the competitor's domestic market and shortens its own supply chain.

Shift mix toward reefer and tank where steel matters less

Refrigeration machinery, insulation, and pressure vessel work dominate reefer and tank container cost, which dilutes steel exposure substantially against dry box production. Weighting output toward these categories reduces sensitivity to a single volatile input while improving margin per unit. The trade-off is capital intensity and certification burden, both of which take time to build.

Portfolio Architecture for Margin Defence

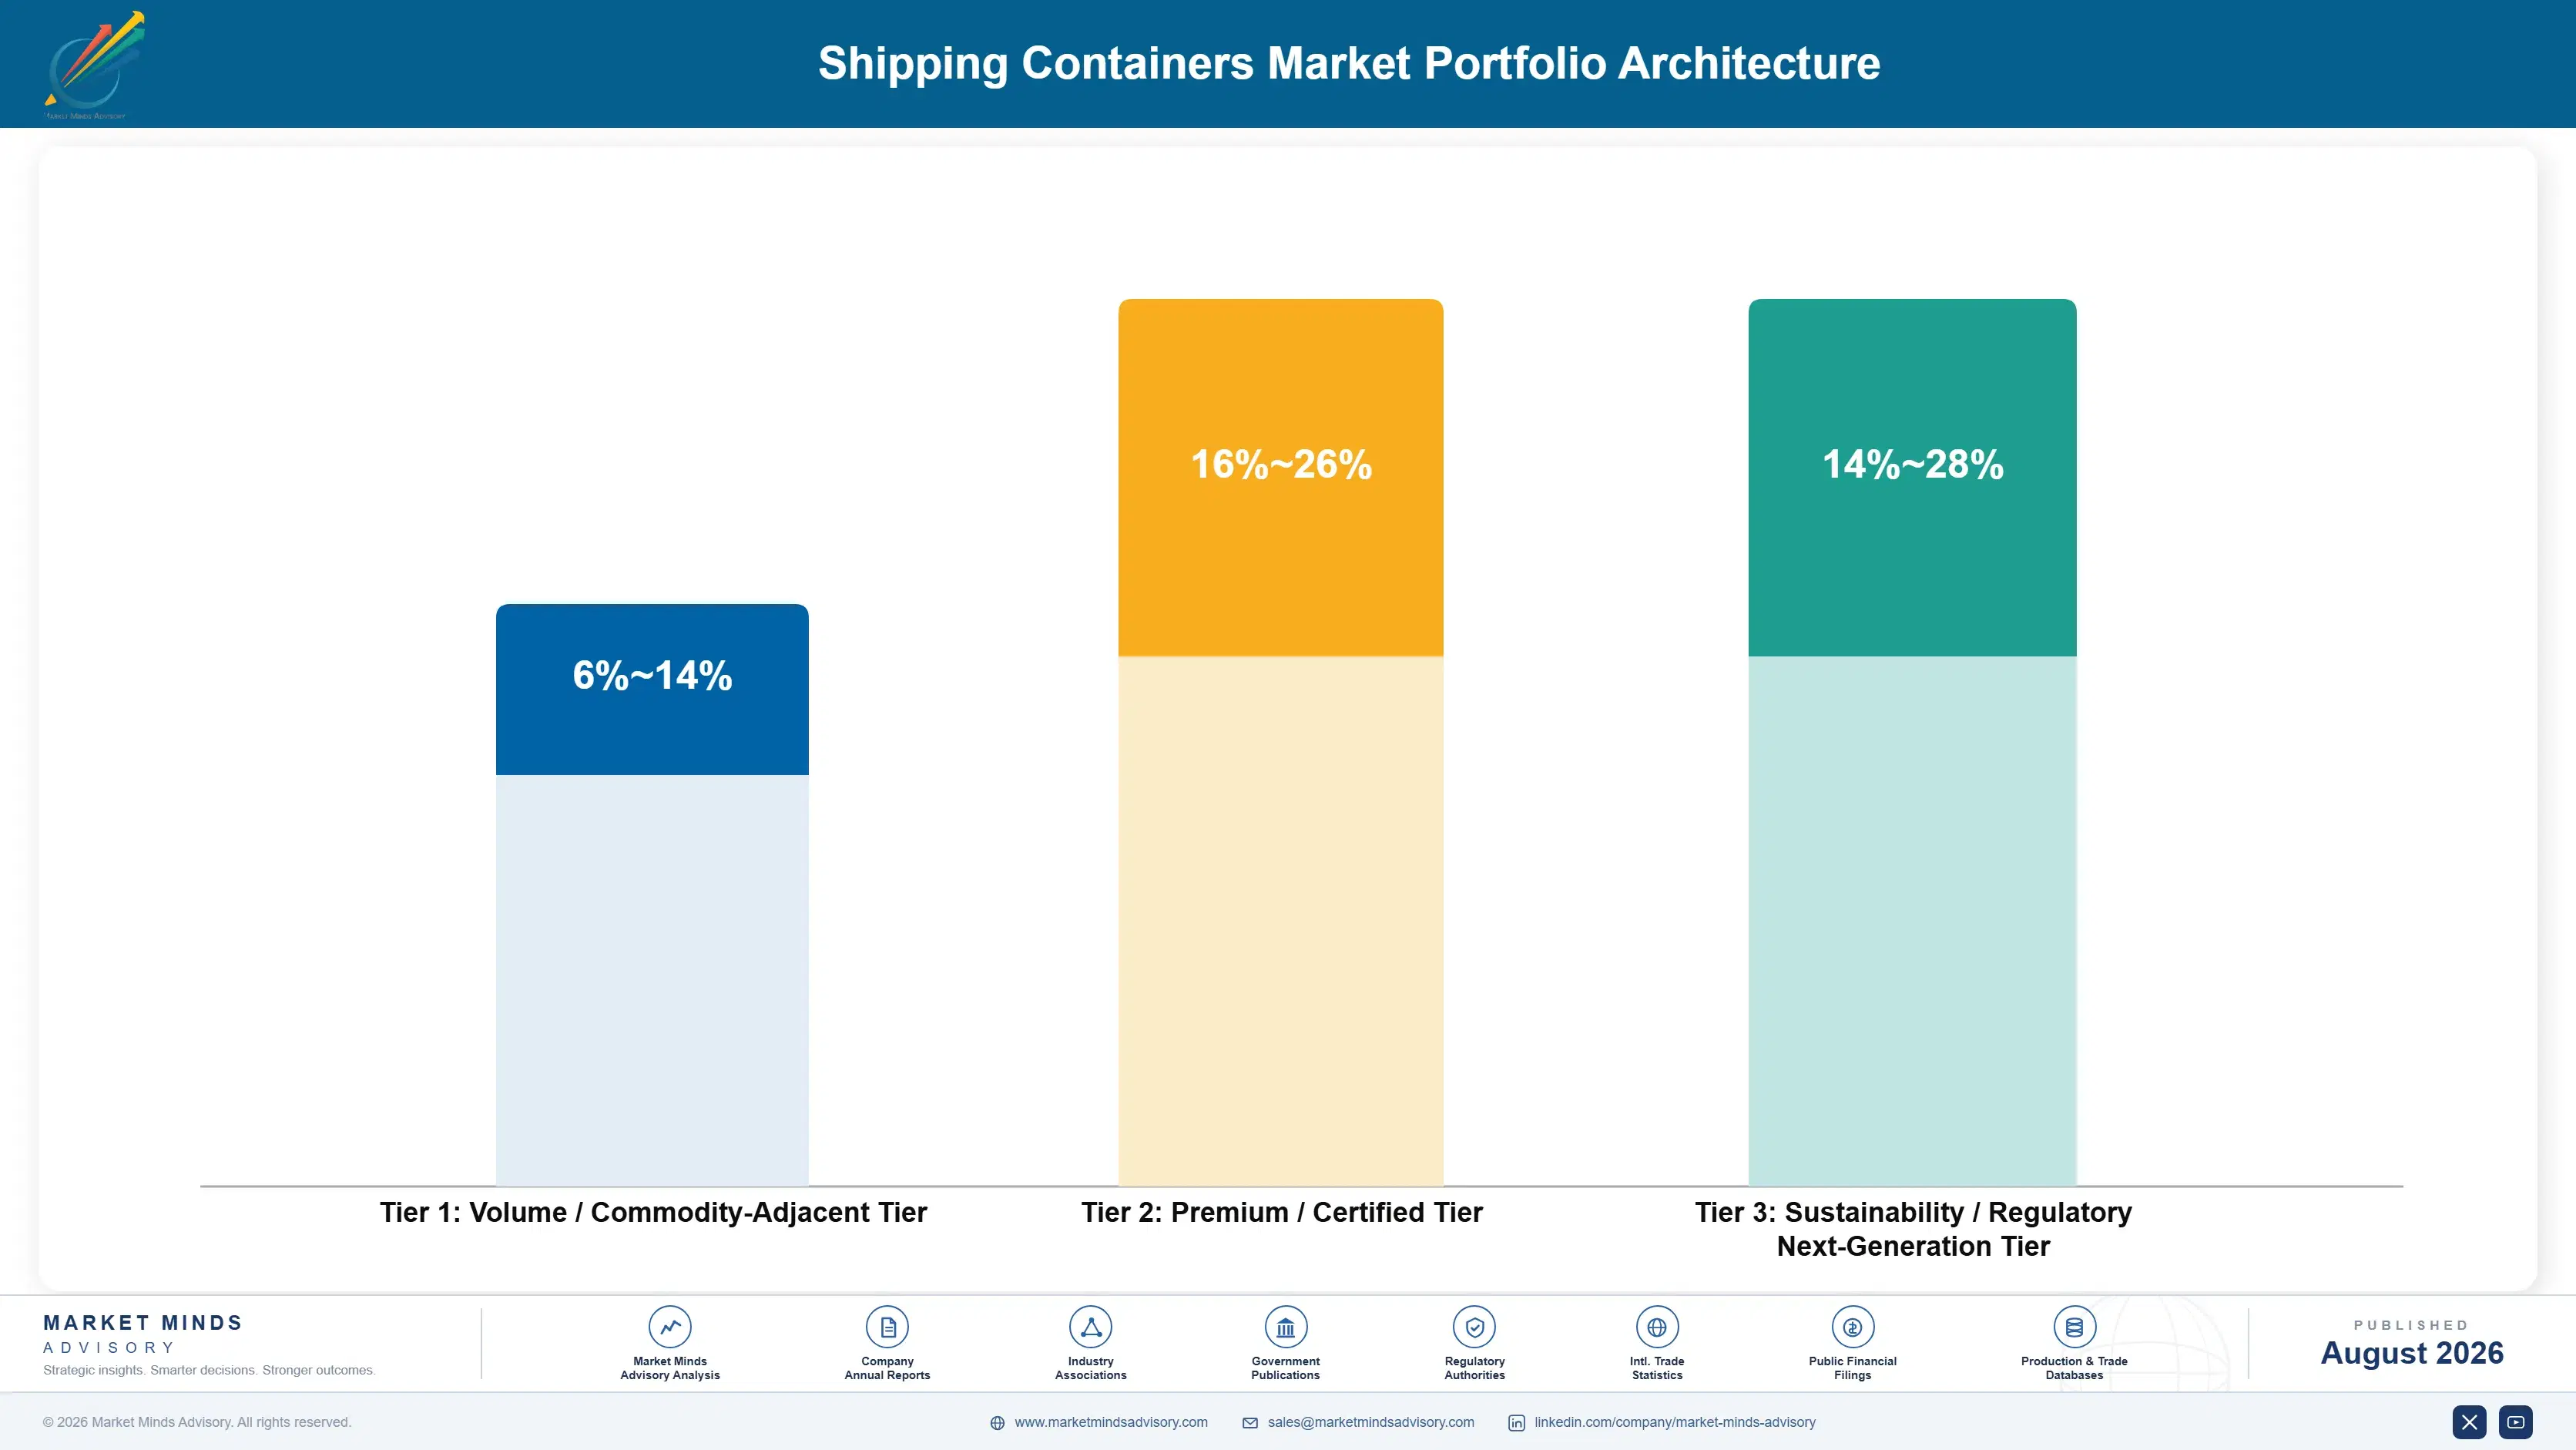
The portfolio splits into three tiers with sharply different economics. Standard dry containers are the volume tier, built to identical specification across several factories and competing on price alone, which leaves margin thin and utilisation-dependent. Refrigerated and tank containers earn materially more because refrigeration machinery, insulation, and pressure vessel certification all narrow the credible field. Specialised, conversion, and secondary-life equipment sits differently again.
The tension runs between volume that fills factories and specialised work that earns the return. Dry container production keeps expensive presses and welding lines loaded and maintains the leasing company relationships that place block orders, so abandoning it cedes scale and channel together. Yet every dry box competes purely on price against identical product. Manufacturers who handle this treat dry volume as utilisation and direct capital toward specialised categories.

High-value pools concentrate where certification or technology limits competition: pressure vessel qualified tank containers, pharmaceutical-validated reefers, and specialised units built for specific cargo. All three resist the price competition that defines dry boxes because the qualified field is narrow and requalification is slow. Equipment sold to a common ISO specification competes with every factory holding the same standard, which in practice means competing on Chinese cost.

Volume / Commodity-Adjacent Tier

Standard dry containers in twenty and forty foot configurations built to common ISO specification. The range is wide because margin swings violently with steel prices and factory utilisation, from near-zero in downturns to respectable during equipment shortages.
Gross Margin: 6-18%

Premium / Certified Tier

Refrigerated containers, tank containers, and specialised units requiring pressure vessel or food-grade certification. The range is wide because reefer margin depends heavily on refrigeration machinery sourcing while tank containers command sustained premiums on certification barriers.
Gross Margin: 18-32%

Sustainability / Regulatory / Next-Generation Tier

Low-refrigerant reefers, bamboo and composite flooring alternatives, refurbishment programmes, and conversion equipment for secondary-life applications. The range is wide because compliance-driven products earn well while refurbishment competes against an informal secondary trade.
Gross Margin: 20-38%
shipping-containers-market-portfolio-architecture-1787324221760

High-value Sub-segments and Strategic Watch-out

Refrigerated Containers

High value and high growth at 7.2%, the fastest type, as perishable and pharmaceutical trade converts from air freight to sea. Units cost several times a dry box, so value share far exceeds the 7% unit share, though refrigerant regulation forces redesign on a fixed timetable.
Gross Margin: 18-30%

Tank Containers

High value with strong growth at 6.4%, protected by pressure vessel certification and cargo-specific lining qualification that narrow the qualified field considerably. Service lives beyond twenty years make replacement demand a smaller share of total ordering here than in any other container category on the market.
Gross Margin: 22-34%

Standard Dry Containers

The volume core by an enormous margin, built to identical specification across several competing factories and sold on delivered price alone. Steady in aggregate but violently cyclical in margin, with factory utilisation and corten steel pricing between them determining whether a given year is profitable at all.
Gross Margin: 6-18%

Specialised and Open-Top Containers

The strategic watch-out, serving project cargo, heavy machinery, and out-of-gauge freight where order volumes are small, lumpy, and hard to plan against. Demand tracks industrial capital projects rather than trade flows, which makes it the least forecastable category and the hardest to schedule factory capacity around.
Gross Margin: 14-26%

How Container Orders Actually Commit

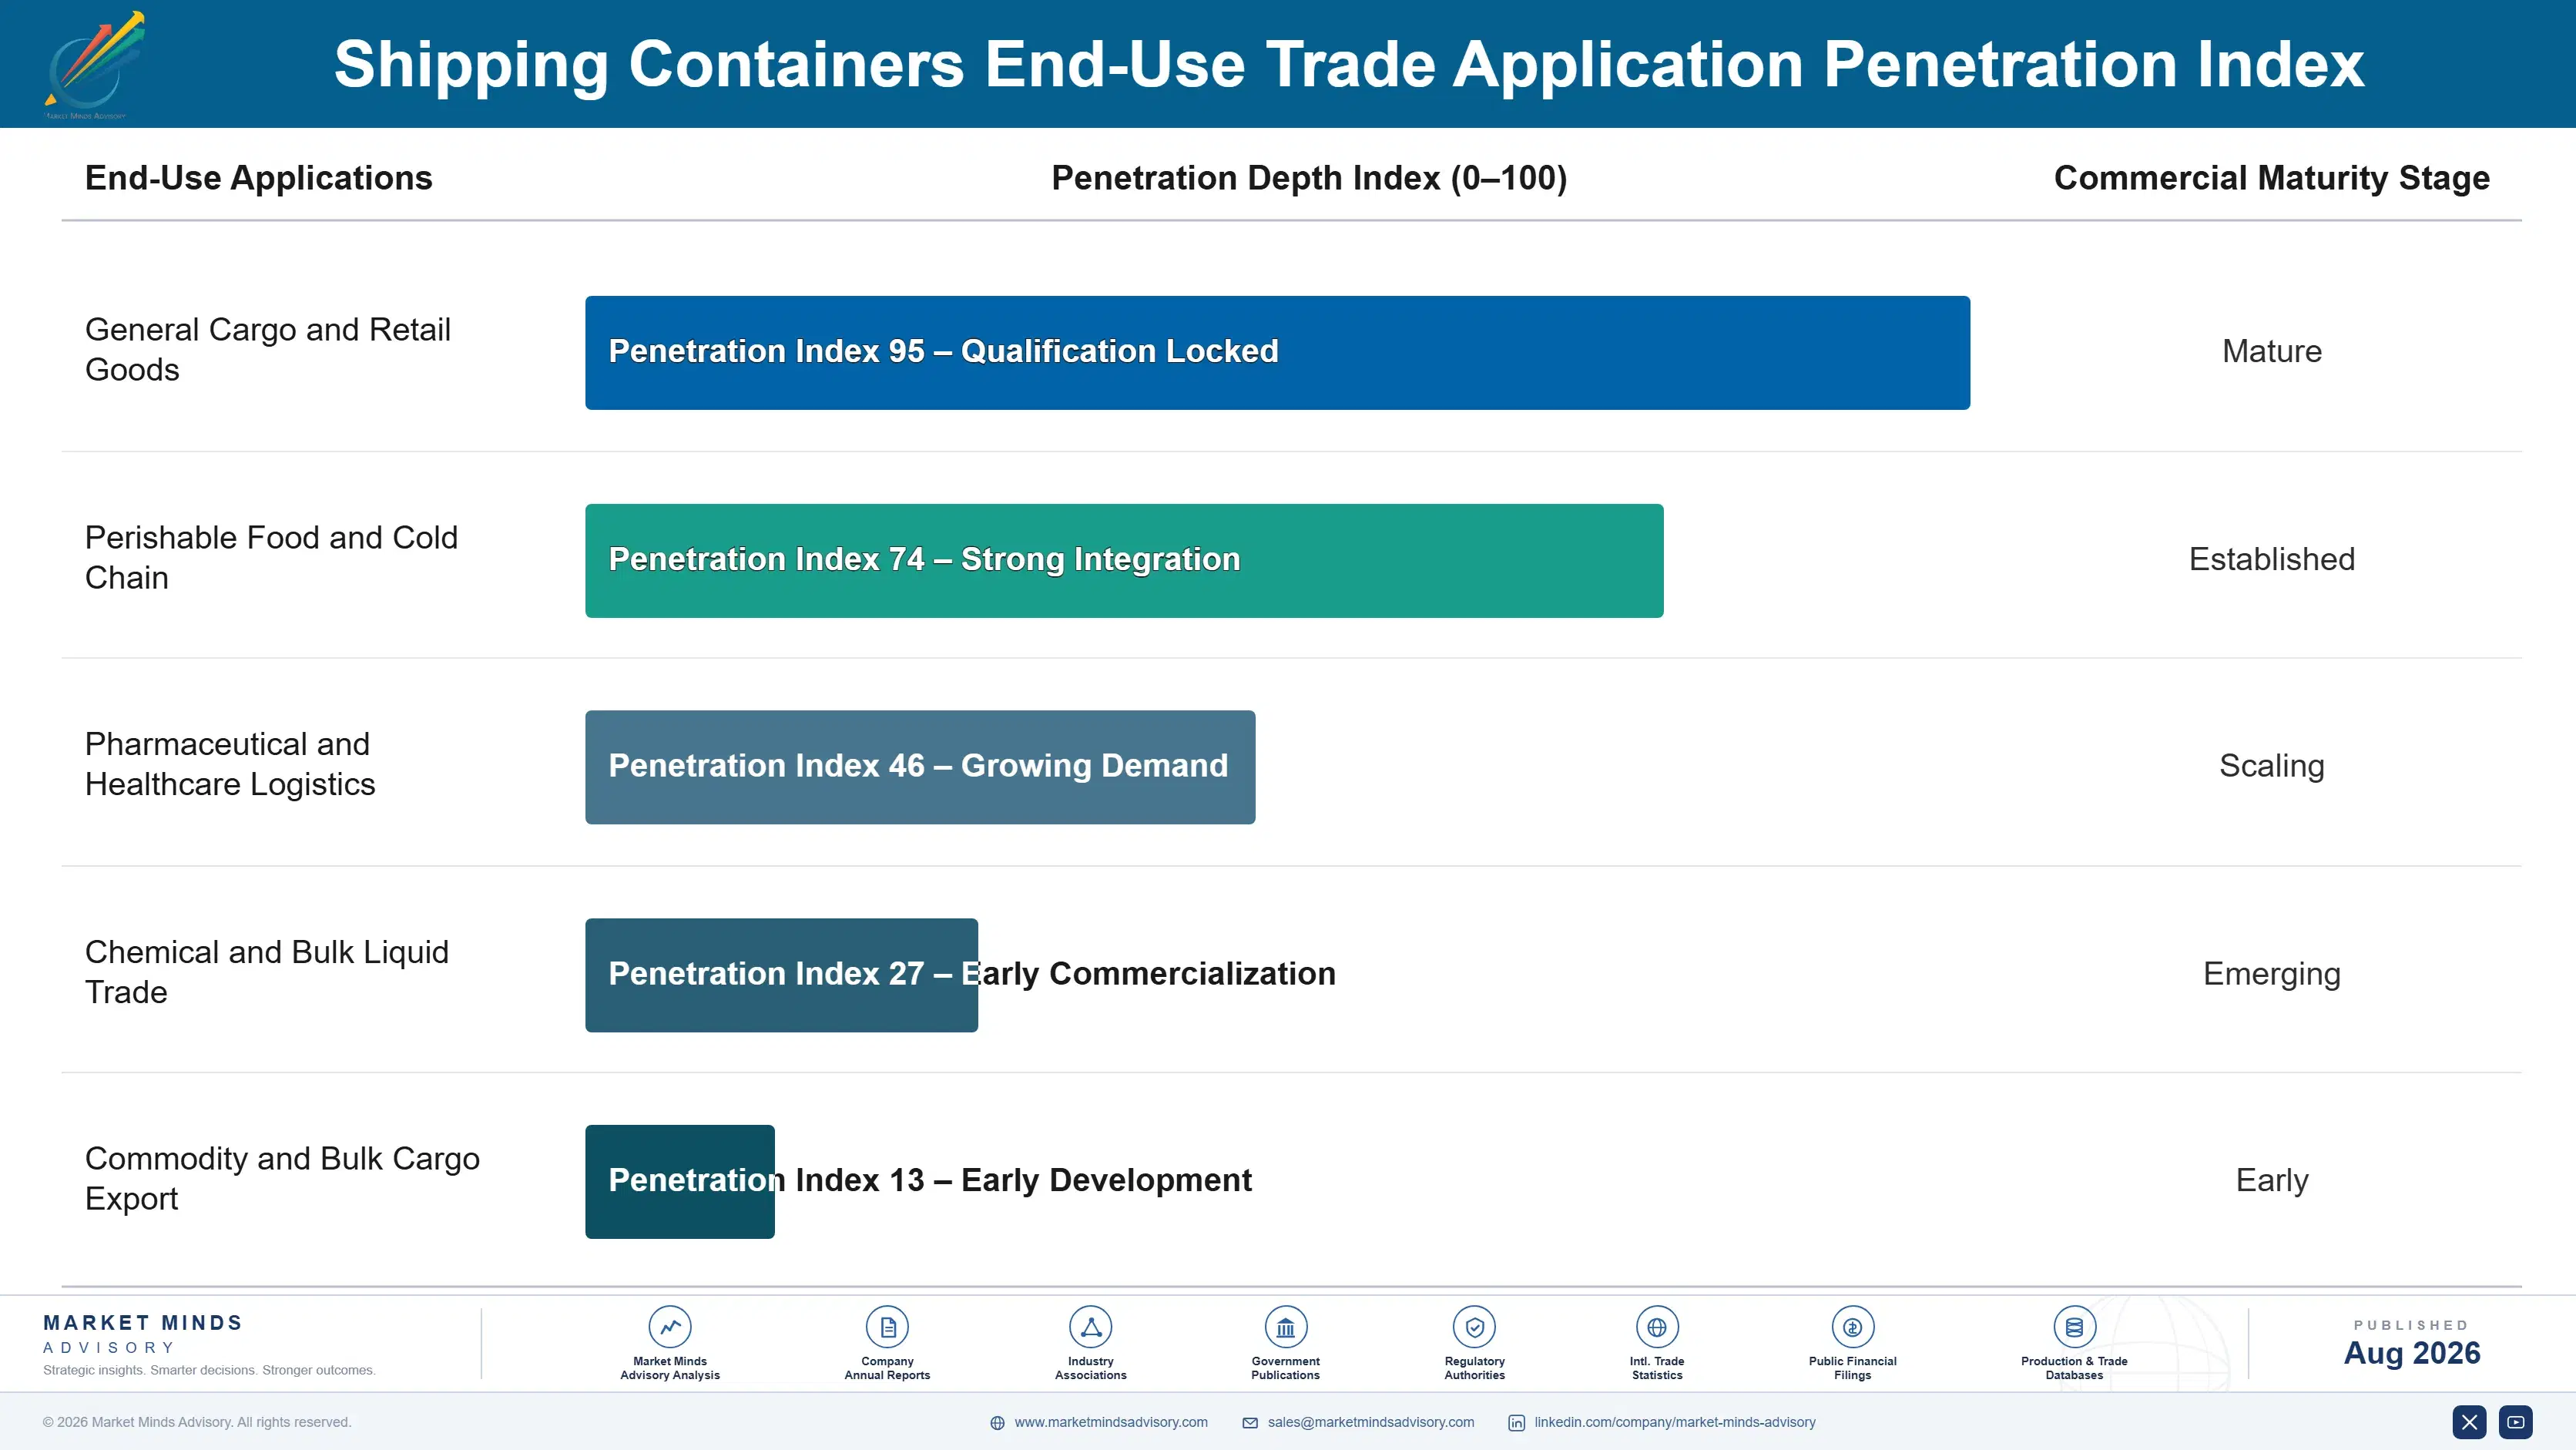
Demand commits in blocks, not in flows. Leasing companies and shipping lines order in tranches that fill factory capacity for months, and those decisions turn on equipment availability and price expectations rather than next quarter's cargo bookings. A single lessor commitment can absorb an entire plant's output. Manufacturers therefore plan against a handful of buyer relationships rather than any broad market, and losing one is disproportionately damaging.
Adoption depth varies sharply by owner type. Leasing companies commit deepest and most counter-cyclically, buying when prices collapse and holding equipment on long-term lease to lines who prefer not to own it. Large shipping lines order to secure control of critical equipment, particularly reefers on committed trades. Regional and feeder operators buy opportunistically in the secondary market. Conversion buyers sit outside marine trade entirely.

Buyer profiles have shifted from operational fleet managers toward treasury and procurement functions weighing capital allocation against leasing alternatives. The question is increasingly whether to own equipment at all, given roughly half the world fleet already sits on lessor balance sheets. Younger fleet managers also weigh supply security in ways their predecessors did not, which is what sustains Vietnamese and Indian capacity at a premium.
shipping-containers-market-end-use-penetration-index-1787324222261

Our Call On Container Manufacturing

These are among the four positions where our research anticipates prominent divergence between winners and laggards over the coming forecast period. Each is grounded in the demand model, the regulatory perimeter, and the announced capacity pipeline.
01 / CONCENTRATION SETS PRICE

One country's steel market determines global container cost

Chinese factories build the overwhelming majority of world container output from corten steel purchased at Chinese domestic prices, and that steel accounts for roughly 55% of finished container cost. That single fact makes Chinese steel pricing and Chinese factory utilisation the effective determinants of container cost everywhere else in the world. Manufacturers based outside China should therefore stop competing on dry box volume entirely and pursue the categories where certification rather than raw manufacturing scale sets the real barrier to entry.
02 / COHORT RETIREMENT LOOMS

The 2021 ordering surge retires as a single concentrated wave

Containers ordered during the pandemic-era equipment shortage all entered service within an unusually narrow window, and marine boxes typically work twelve to fifteen years before leaving service for good. Replacement demand therefore arrives compressed into the back half of this decade rather than spread evenly across it, as a normal fleet age distribution would otherwise produce. Manufacturers and lessors should plan capacity and capital deployment against that lumpy profile specifically, because the aggregate trade growth number conceals it entirely, year after year.
03 / REEFERS EARN BETTER

Seven per cent of units carries a far larger share of value

Refrigerated containers represent only about 7% of the world fleet by unit count but cost several times a dry box and grow at 7.2% against the market's 4.8%, driven by perishable and pharmaceutical trade converting steadily from air freight to sea. The category also faces a considerably narrower competitive field on refrigeration engineering and validation grounds. Manufacturers should weight capital investment deliberately toward reefer and tank equipment rather than chasing dry container volume, where identical product competes purely on delivered price.
04 / SECURITY BEATS COST

Buyers now pay premiums purely for non-Chinese supply

Shipping lines and leasing companies are now actively funding Vietnamese and Indian capacity at unit costs they would never otherwise accept, because concentration of nearly all world production in a single country has become a risk their boards will no longer carry quietly. That willingness is what makes diversification commercially viable at all, since the underlying economics alone never would justify it. New entrants should price against supply security rather than Chinese cost, and build the certification depth that keeps the premium defensible.

Engagement Snapshot From the Field

A live engagement with an industry participant carrying material or product regulatory and market exposure ahead of a defining policy shift, showing how our research translates into a defensible multi-year portfolio strategy.
MARKET MINDS ADVISORY · CLIENT ENGAGEMENT SUMMARY
Shipping Containers Producer Strategic Portfolio Review and Transition Roadmap 2026·Investment Scenario on Shipping Containers Exposure Evaluation 2025-26
CLIENT PROFILE
A global container leasing company with a fleet exceeding two million TEU engaged MMA as its purchasing concentration drew board scrutiny. The client reported annual revenue near USD 1.6 billion, with over 95% of recent equipment purchases sourced from Chinese factories and a fleet age profile heavily weighted toward the 2021 ordering surge (client-reported, unverified by MMA).
STRATEGIC CHALLENGE
The board wanted source diversification but could not accept the cost premium non-Chinese production carried, and nobody had quantified what the concentration risk was actually worth. Separately, the fleet's age profile meant an unusually large retirement wave was approaching, and the purchasing team had no plan for whether to pre-buy ahead of it or ride the resulting price cycle.
MMA APPROACH
MMA modelled the client's fleet retirement profile year by year against realistic container price scenarios, testing pre-buying against ordering into the cohort wave. We priced the diversification premium against a quantified disruption scenario rather than against abstract risk appetite. We also assessed Vietnamese and Indian capacity on genuine qualification status and delivery capability rather than on announced nameplate figures.
KEY FINDINGS
  1. The retirement cohort concentrated roughly 40% of fleet renewal into a four-year window, which would coincide with every competitor facing the same profile and bidding for the same capacity (client-reported, unverified by MMA).
  2. Pre-buying ahead of that window at trough prices materially outperformed ordering into it, even after carrying costs on idle equipment for eighteen months.
  3. The diversification premium was roughly 12% on unit cost, which the disruption modelling justified only for a minority share of purchasing rather than a wholesale shift.
  4. Announced non-Chinese capacity substantially exceeded what was genuinely qualified and deliverable, making sourcing plans built on nameplate figures unreliable (client-reported, unverified by MMA).
CLIENT PROFILE
A global container leasing company with a fleet exceeding two million TEU engaged MMA as its purchasing concentration drew board scrutiny. The client reported annual revenue near USD 1.6 billion, with over 95% of recent equipment purchases sourced from Chinese factories and a fleet age profile heavily weighted toward the 2021 ordering surge (client-reported, unverified by MMA).
STRATEGIC CHALLENGE
The board wanted source diversification but could not accept the cost premium non-Chinese production carried, and nobody had quantified what the concentration risk was actually worth. Separately, the fleet's age profile meant an unusually large retirement wave was approaching, and the purchasing team had no plan for whether to pre-buy ahead of it or ride the resulting price cycle.
MMA APPROACH
MMA modelled the client's fleet retirement profile year by year against realistic container price scenarios, testing pre-buying against ordering into the cohort wave. We priced the diversification premium against a quantified disruption scenario rather than against abstract risk appetite. We also assessed Vietnamese and Indian capacity on genuine qualification status and delivery capability rather than on announced nameplate figures.
KEY FINDINGS
  1. The retirement cohort concentrated roughly 40% of fleet renewal into a four-year window, which would coincide with every competitor facing the same profile and bidding for the same capacity (client-reported, unverified by MMA).
  2. Pre-buying ahead of that window at trough prices materially outperformed ordering into it, even after carrying costs on idle equipment for eighteen months.
  3. The diversification premium was roughly 12% on unit cost, which the disruption modelling justified only for a minority share of purchasing rather than a wholesale shift.
  4. Announced non-Chinese capacity substantially exceeded what was genuinely qualified and deliverable, making sourcing plans built on nameplate figures unreliable (client-reported, unverified by MMA).
RECOMMENDED STRATEGY
Phase 1: Phase 1 (0 to 12 months): Pre-buy against the retirement cohort at prevailing trough pricing rather than waiting to order into a period of concentrated industry demand. Phase 2: Phase 2 (12 to 30 months): Qualify Vietnamese and Indian suppliers for a defined minority share of purchasing, based on demonstrated delivery rather than announced capacity. Phase 3: Phase 3 (30 to 48 months): Weight incremental fleet investment toward reefer equipment, where lease rates and residual values both hold up considerably better.
OUTCOME
The client pre-bought ahead of its retirement cohort at trough pricing, avoiding the concentrated ordering window its competitors will face. Diversification proceeded on a defined minority share rather than wholesale, and the reefer weighting improved blended lease rates across the fleet without materially increasing capital deployed (client-reported, unverified by MMA).

Frequently Asked Questions

Foundational context covering the market sizes, CAGR, scope, country, region and competition that inform every finding below. This section is provided to cover basics and most often pre-purchase conversations, answered from the MMA Primary Research Dataset.

What is the current size of the Shipping Containers Market?

The global shipping containers market is valued at USD 11.4 billion in 2025, covering manufacture and first sale of ISO intermodal containers across dry, refrigerated, tank, and specialised types. Container leasing, terminal handling equipment, chassis, and container ships are excluded.

How large will the Shipping Containers Market be by 2036?

The market is forecast to reach USD 19.09 billion by 2036 in the base case, about 1.60 times the 2026 level. That represents incremental value of roughly USD 7.15 billion across the decade.

What is the CAGR for the Shipping Containers Market 2026 to 2036?

The market grows at a 4.8% CAGR in the base case, with bull and bear scenarios at 6.0% and 3.6%. The spread turns mainly on trade fragmentation and on whether the 2021 ordering cohort retires on schedule.

Which segment is growing fastest?

Refrigerated containers grow fastest at 7.2%, about 1.50 times the overall rate, as perishable and pharmaceutical trade converts from air freight to sea. Tank containers follow at 6.4% on chemical trade and drum substitution.

Who are the major companies in the Shipping Containers Market?

Leading manufacturers include CIMC, Dong Fang International Containers, CXIC Group, Maersk Container Industry, and Singamas Container Holdings. Concentration is extreme, with the top five holding roughly 78% of world production capacity.

Which country is growing fastest?

Vietnam grows fastest at a 9.4% CAGR, as new plants commissioned to serve buyers seeking supply outside China reach commercial output. India follows on government-backed capacity aimed at serving its own trade.

Report Segmentation Architecture

The full report scope spans multiple orthogonal segmentation dimensions, with cross-tabulated demand data provided for each dimension pair. Coverage extends further to regional breakdowns, trend trajectories, and the competitive detail needed to support segment-level decision-making.

By Container Type

  • Standard Dry Containers
  • Refrigerated Containers
  • Tank Containers
  • Specialised and Open-Top Containers
  • Folding and Collapsible Containers

By End-Use Cargo Category

  • General Merchandise and Manufactured Goods
  • Perishable Food and Agricultural Produce
  • Chemicals and Bulk Liquids
  • Pharmaceutical and Temperature-Controlled Goods
  • Project Cargo and Out-of-Gauge Freight

By Ownership Model

  • Leasing Company Fleet Purchase
  • Shipping Line Direct Ownership
  • Shipper and Beneficial Cargo Owner Purchase
  • Secondary Market and Conversion Buyers

By Region

  • North America
  • Western Europe
  • East Asia
  • South Asia and Pacific
  • Latin America
  • Middle East and Africa
  • Eastern Europe

Scope, Methodology, and Coverage

Every figure in this report is reproducible from documented input assumptions. The scope below maps the historical period, the forecast horizon, the segmentation dimensions, and the countries covered, alongside the underlying primary and qualitative methodology.
Historical Period
2020 to 2025
Forecast Period
2026 to 2036
Base Year
2025 (USD billions; MMA Primary Research Dataset, August 2026)
Market Definition
The shipping containers market comprises the manufacture and first sale of intermodal freight containers constructed to International Organization for Standardization dimensional and structural standards for carriage by sea, rail, and road, valued at manufacturer selling prices. It spans standard dry containers, refrigerated containers including their integrated refrigeration machinery, tank containers, specialised and open-top units, and folding or collapsible designs. Container leasing and financing services, secondary market resale, terminal handling and lifting equipment, chassis and road trailers, domestic containers outside ISO dimensions, and container vessels are excluded.
Quantitative Units
USD billions (current prices); production volume in TEU and units where applicable
Segmentation Dimensions
By Container Type; By End-Use Cargo Category; By Ownership Model; By Region
Regions Covered
North America, Western Europe, East Asia, South Asia and Pacific, Latin America, Middle East and Africa, Eastern Europe
Countries Covered
USA, China, Germany, France, UK, Japan, South Korea, India, Australia, Canada, Brazil, Mexico, Indonesia, Vietnam, Thailand, Malaysia, UAE, Saudi Arabia, South Africa, Nigeria, Turkey, Poland, Netherlands, Italy, Spain, Sweden, Switzerland, Argentina, Colombia, Singapore, and additional markets relevant to this sector
Key Companies Profiled
CIMC, Dong Fang International Containers, CXIC Group, Maersk Container Industry, Singamas Container Holdings, Jindo Corporation, W&K Container, Charleston Marine Containers, TLS Offshore Containers, Welfit Oddy, Nantong Tank Container, CXIC Yangzhou Tongyun, Bslcontainers, Hoover Ferguson, Bertschi, Sicom Testing, China Eastern Containers, Thurm Container, Carrier Transicold, Thermo King
Quantitative Methodology
Primary survey, n=3,800 respondents, Q4 2025, six countries; demand-side model with trade association cross-validation
Qualitative Methodology
47 expert interviews, Q4 2025; applied to validate demand model assumptions, identify emerging dynamics, and assess competitive positioning
Report Format
PDF and XLSX data workbook (Word format preview document)
Publisher
Market Minds Advisory
Report Code
MMA-2026-CON-166
Published
August 2026
Contact
sales@marketmindsadvisory.com | www.marketmindsadvisory.com

Purchase the full Shipping Containers Market Report (2026 to 2036).

The full MMA Shipping Containers report sizes the market across five container types, five cargo categories, four ownership models, and seven regions through 2036. It profiles 20 manufacturers on a consistent basis of container manufacturing revenue, scoring each on production scale, certification depth in specialised equipment, steel purchasing position, and leasing company relationships. Scenario models quantify how fleet age profile, steel pricing, and trade fragmentation move both ordering volume and achievable margin by type. The report also includes fleet retirement cohort modelling, container price cycle analysis against steel benchmarks, source diversification premium assessment, and secondary market residual value analysis for strategy and procurement teams.
Five-type and four-model market sizing to 2036
Twenty-manufacturer benchmark on consistent container manufacturing revenue
Fleet retirement cohort modelling by build year
Container price cycle analysis against corten steel benchmarks
Source diversification premium and supply security assessment
Secondary market residual value analysis by container type

Built For The People Who Decide

From boardroom strategy to bench-side execution, this report is read cover-to-cover by leaders shaping the next decade of their industry, turning demand scenarios, market dynamics and valuation benchmarks into decisions.
CXOs/ Presidents/ VPs/ Managers
M&A and Corporate Development
Strategy Teams and R&D Heads
Procurement and Product Directors
Regulatory and Compliance Leaders
Investor Relations and Equity Analysts