Market Minds Advisory
Sheet Pan Racks Market

Sheet Pan Racks Market: Sheet Pan Racks Market: Pan Pitch Standards, Caster Failure and Why Nesting Decides Kitchen Economics

A rack that cannot roll through a doorway is scrap metal on wheels, and the mismatch between rack width and the door widths of real kitchens is the most common specification failure here.

Lead Analyst

Published

September 2026

Make Smarter Decisions with Customized Research Insights

Request a free sample report and evaluate market opportunities, growth trends, and competitive dynamics relevant to your business needs.

2025 MARKET VALUE$1.3BMarket Size 2025
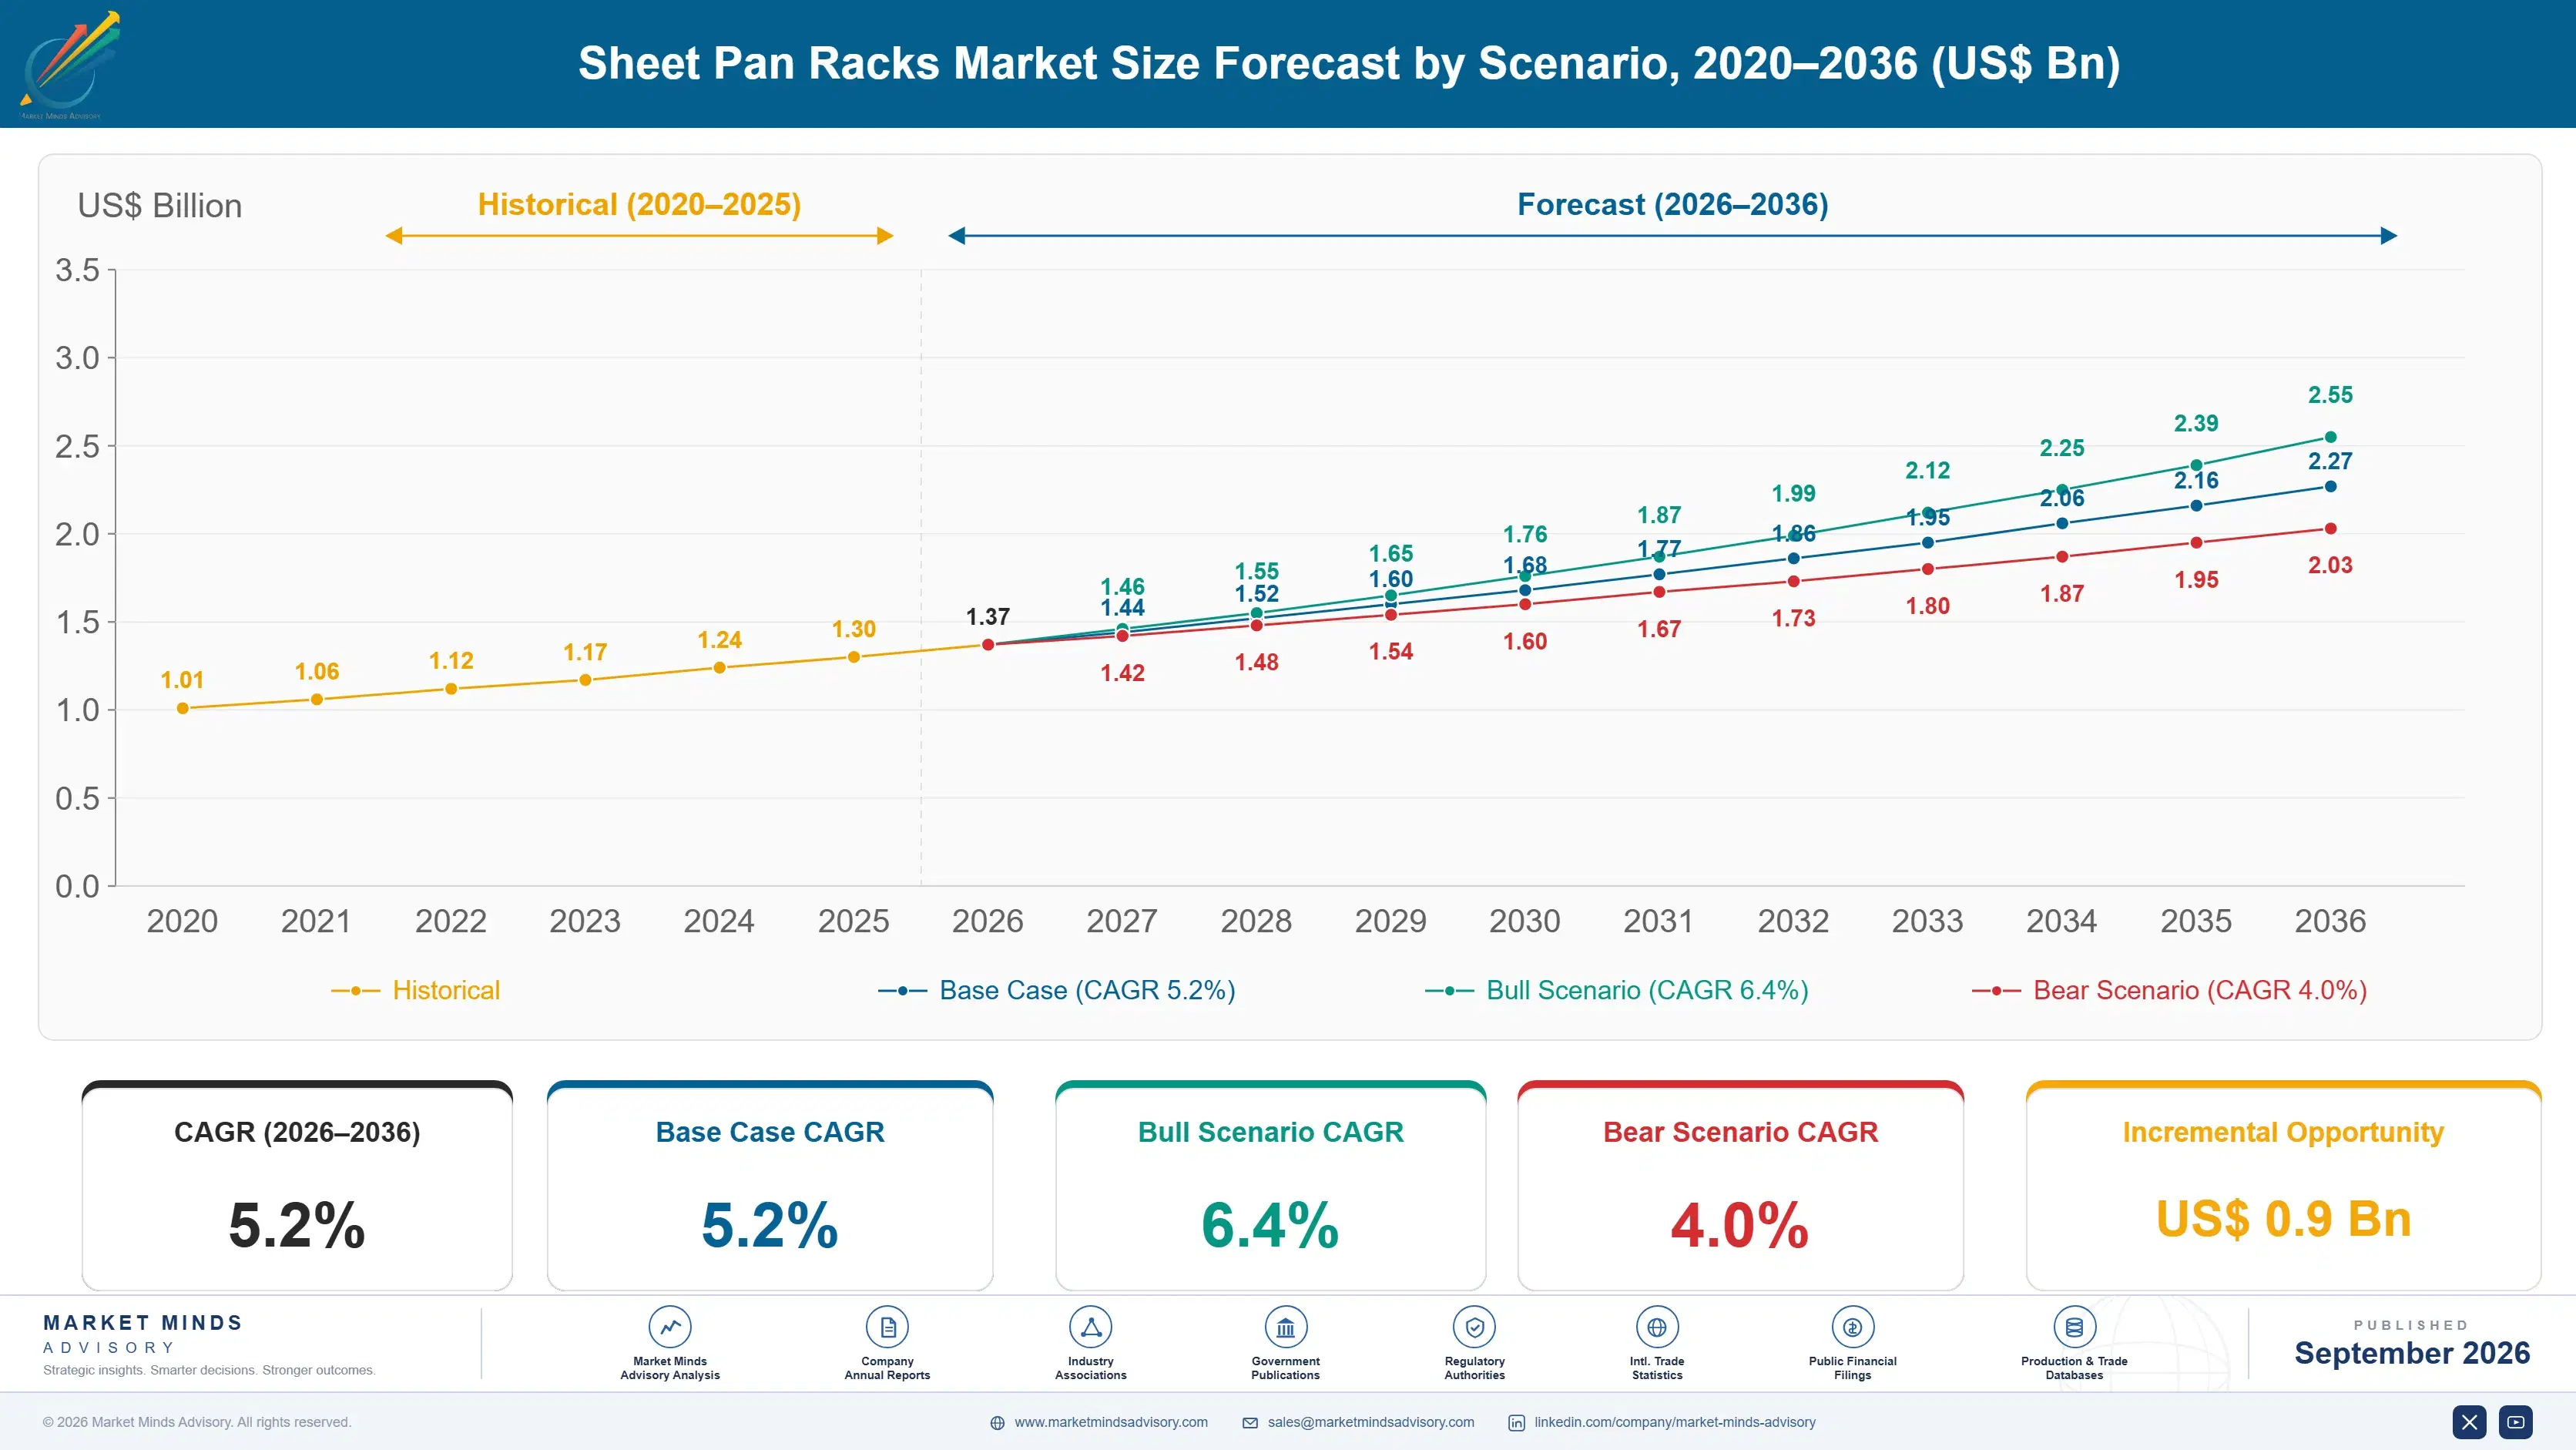
2036 FORECAST VALUE$2.3BBase Case , 2026 to 2036
CAGR 2026 TO 20365.2 %Bull 6.4% / Bear 4.0%
INCREMENTAL OPPORTUNITY$0.9BNet 10- year value creation
EXPANSION MULTIPLE1.64x2036 value over 2026 base
Strategic Levers
M&A Pipeline
Regional Outlook
Country Rankings
Competitive Intelligence
Segmental Deep-dive
Call-Us : 91 93563 13602

Executive Snapshot and Market Trajectory.

Casters fail long before racks do, and nobody specifies them. A loaded pan rack weighs upward of 90 kilograms, runs across tile grout and door thresholds daily, and the wheels carrying that load are chosen by whoever assembled the cheapest bill of materials. Casters are under 4% of cost.
Nesting and collapsible racks grow at 7.8%, half again the market rate of 5.2%, because floor space in a commercial kitchen is the scarcest thing in it and an empty rack occupies as much as a full one. Aluminium mobile racks follow at 6.7%. Fixed stainless wall racks grow slowest at 2.4%, specified mainly where mobility is genuinely unnecessary. Floor area appears nowhere in a purchase price comparison.
Pan pitch is the specification that decides whether a rack is usable and it is quietly inconsistent. Standard spacing assumes flat sheet pans while covered pans and deep hotel pans need more, and a rack bought on slide count rather than clear spacing holds far less than its label claims. Concentration is low at 27%. Around 19% of installations also discover after delivery that the rack simply cannot pass an interior doorway anywhere.
Market Definition
This market covers mobile and fixed racking designed to hold sheet pans, trays and similar flat foodservice vessels, spanning aluminium mobile pan racks, stainless steel mobile racks, nesting and collapsible racks, fixed wall and floor-mounted racks, enclosed and covered transport racks, and oven and proofer-compatible racks. Sizing is at manufacturer net revenue. Sheet pans themselves, shelving for general storage, refrigerated racking with integrated cooling, and dish and glass racking are excluded.
Base Year Value
$1.3B in 2025 (MMA Primary Research Dataset, September 2026)
Forecast Period
2026 to 2036, eleven discrete annual values
CAGR
5.2% base case. Bull 6.4%. Bear 4.0%.
Fastest Growth Segment
Nesting And Collapsible Racks: 7.8% CAGR
Fastest Growth Country
India: 9.3% CAGR
Fastest Growth Region
South Asia and Pacific: 7.3% CAGR
Largest Region
North America: 33% of 2025 global value
Market Leaders
Cambro Manufacturing, Metro, Channel Manufacturing, Winco, New Age Industrial. Source: MMA Primary Research Dataset, July 2026.
Primary Survey
n=3,800 procurement and R&D decision-makers, Q4 2025, six countries
Methodology
Demand-side build-up, cross-validated against public data, 47 expert interviews

Sheet Pan Racks Market Forecast Scenarios

sheet-pan-racks-market-size-forecast-scenario-1790025058374
Growth of 4.1% between 2020 and 2025 records a foodservice collapse followed by a restructuring rather than a simple recovery. Equipment purchasing stopped almost entirely through 2020, then returned from 2022 into kitchens rebuilt around delivery and preparation volume rather than dining room service. That shift favoured transport and holding equipment over presentation, and pan racks benefited disproportionately.
Three mechanisms carry the base case. Nesting racks grow at 7.8% as kitchen floor area is priced properly against rent in urban markets. Indian demand expands at 9.3% on organised food service and central kitchen construction at scale. Central production kitchens serving multiple outlets are proliferating across every region covered, and those operations buy transport racking in volumes a single restaurant never approaches. All three are visible in equipment shipment data already.
The bull case is caster specification entering tenders. If wheel load rating and bearing type were specified rather than assumed, the racks engineered for daily threshold crossing would separate from those that seize within two years. The bear case is foodservice capital spending contracting. Equipment purchasing tracks operator confidence closely, and a downturn removes replacement demand quickly because a failing rack can be nursed along.

What Actually Breaks First

Casters are the component that ends a rack's working life and almost nothing specifies them. A fully loaded mobile rack weighs around 94 kilograms, crosses tile grout lines and door thresholds dozens of times a day, and takes impacts from other equipment in a confined space. Roughly 64% of service issues originate at the wheels, while the welded aluminium frame above them is typically still perfectly sound when the unit is scrapped. Nothing in a purchase specification mentions that component at all.
TOP FIVE CONCENTRATION27%Combined net revenue share held by the five largest manufacturers
CASTER FAILURE SHARE64%Portion of rack service issues originating at the wheels
AVERAGE RACK PRICEUSD 340Weighted manufacturer price across every rack type covered
LOADED RACK WEIGHT94 kilogramsTypical mass of a fully loaded mobile pan rack
NESTING SPACE SAVING71%Floor area recovered by nesting racks when standing empty
DOORWAY CLEARANCE FAILURES19%Share of installations where racks cannot pass interior doors
Floor area is the scarcest resource in any commercial kitchen and an empty rack occupies exactly as much of it as a loaded one. Nesting designs recover around 71% of that footprint when standing idle, which is a genuine operating benefit in urban kitchens paying serious rent per square metre. Buyers comparing purchase prices capture none of this, and it only becomes visible once the equipment is in service.
Doorway clearance is the failure nobody anticipates. Around 19% of installations discover after delivery that a rack cannot pass an interior door, which turns mobile equipment into fixed equipment permanently. Rack width comes from a catalogue and door width does not.
"The frame outlives the kitchen and the wheels last two years, and the wheels are the part nobody writes into a specification. It is the cheapest component and it decides everything about whether the equipment works."
Director, Foodservice Equipment and Commercial Kitchens Practice · MMA Foodservice Equipment Practice · September 2026

Market Trends

Nesting Designs Price Kitchen Floor Area Properly

Nesting and collapsible racks grow at 7.8% against 5.2% for the market because urban commercial kitchens now cost enough per square metre that idle equipment footprint is a real line rather than an afterthought. A nesting rack recovers around 71% of its floor area when empty, which matters in operations cycling racks through production and holding across a shift. Buyers comparing purchase price capture none of that benefit, so the argument has to be made explicitly with rent figures attached. An operator can verify the figure against a lease they already signed.
Market Impact: India grows at 9.3% annually
Central Production Kitchens Buy At Different Volumes

Central production kitchens serving multiple outlets are expanding across every region covered, and those operations buy transport and holding racking in quantities that a single restaurant never approaches. They also specify differently: pan pitch, doorway clearance, caster load rating and stacking behaviour are evaluated against an actual workflow rather than chosen from a catalogue. That makes them a technical customer whose requirements can be tested, which is unusual in foodservice equipment purchasing generally. They also buy in quantities that make a specification relationship worth building, which a single restaurant never justifies for equipment at this price point.
Market Impact: Batch holding demand rose from 2022

Market Opportunities and Growth Drivers

Indian Organised Foodservice Expands Central Kitchen Capacity

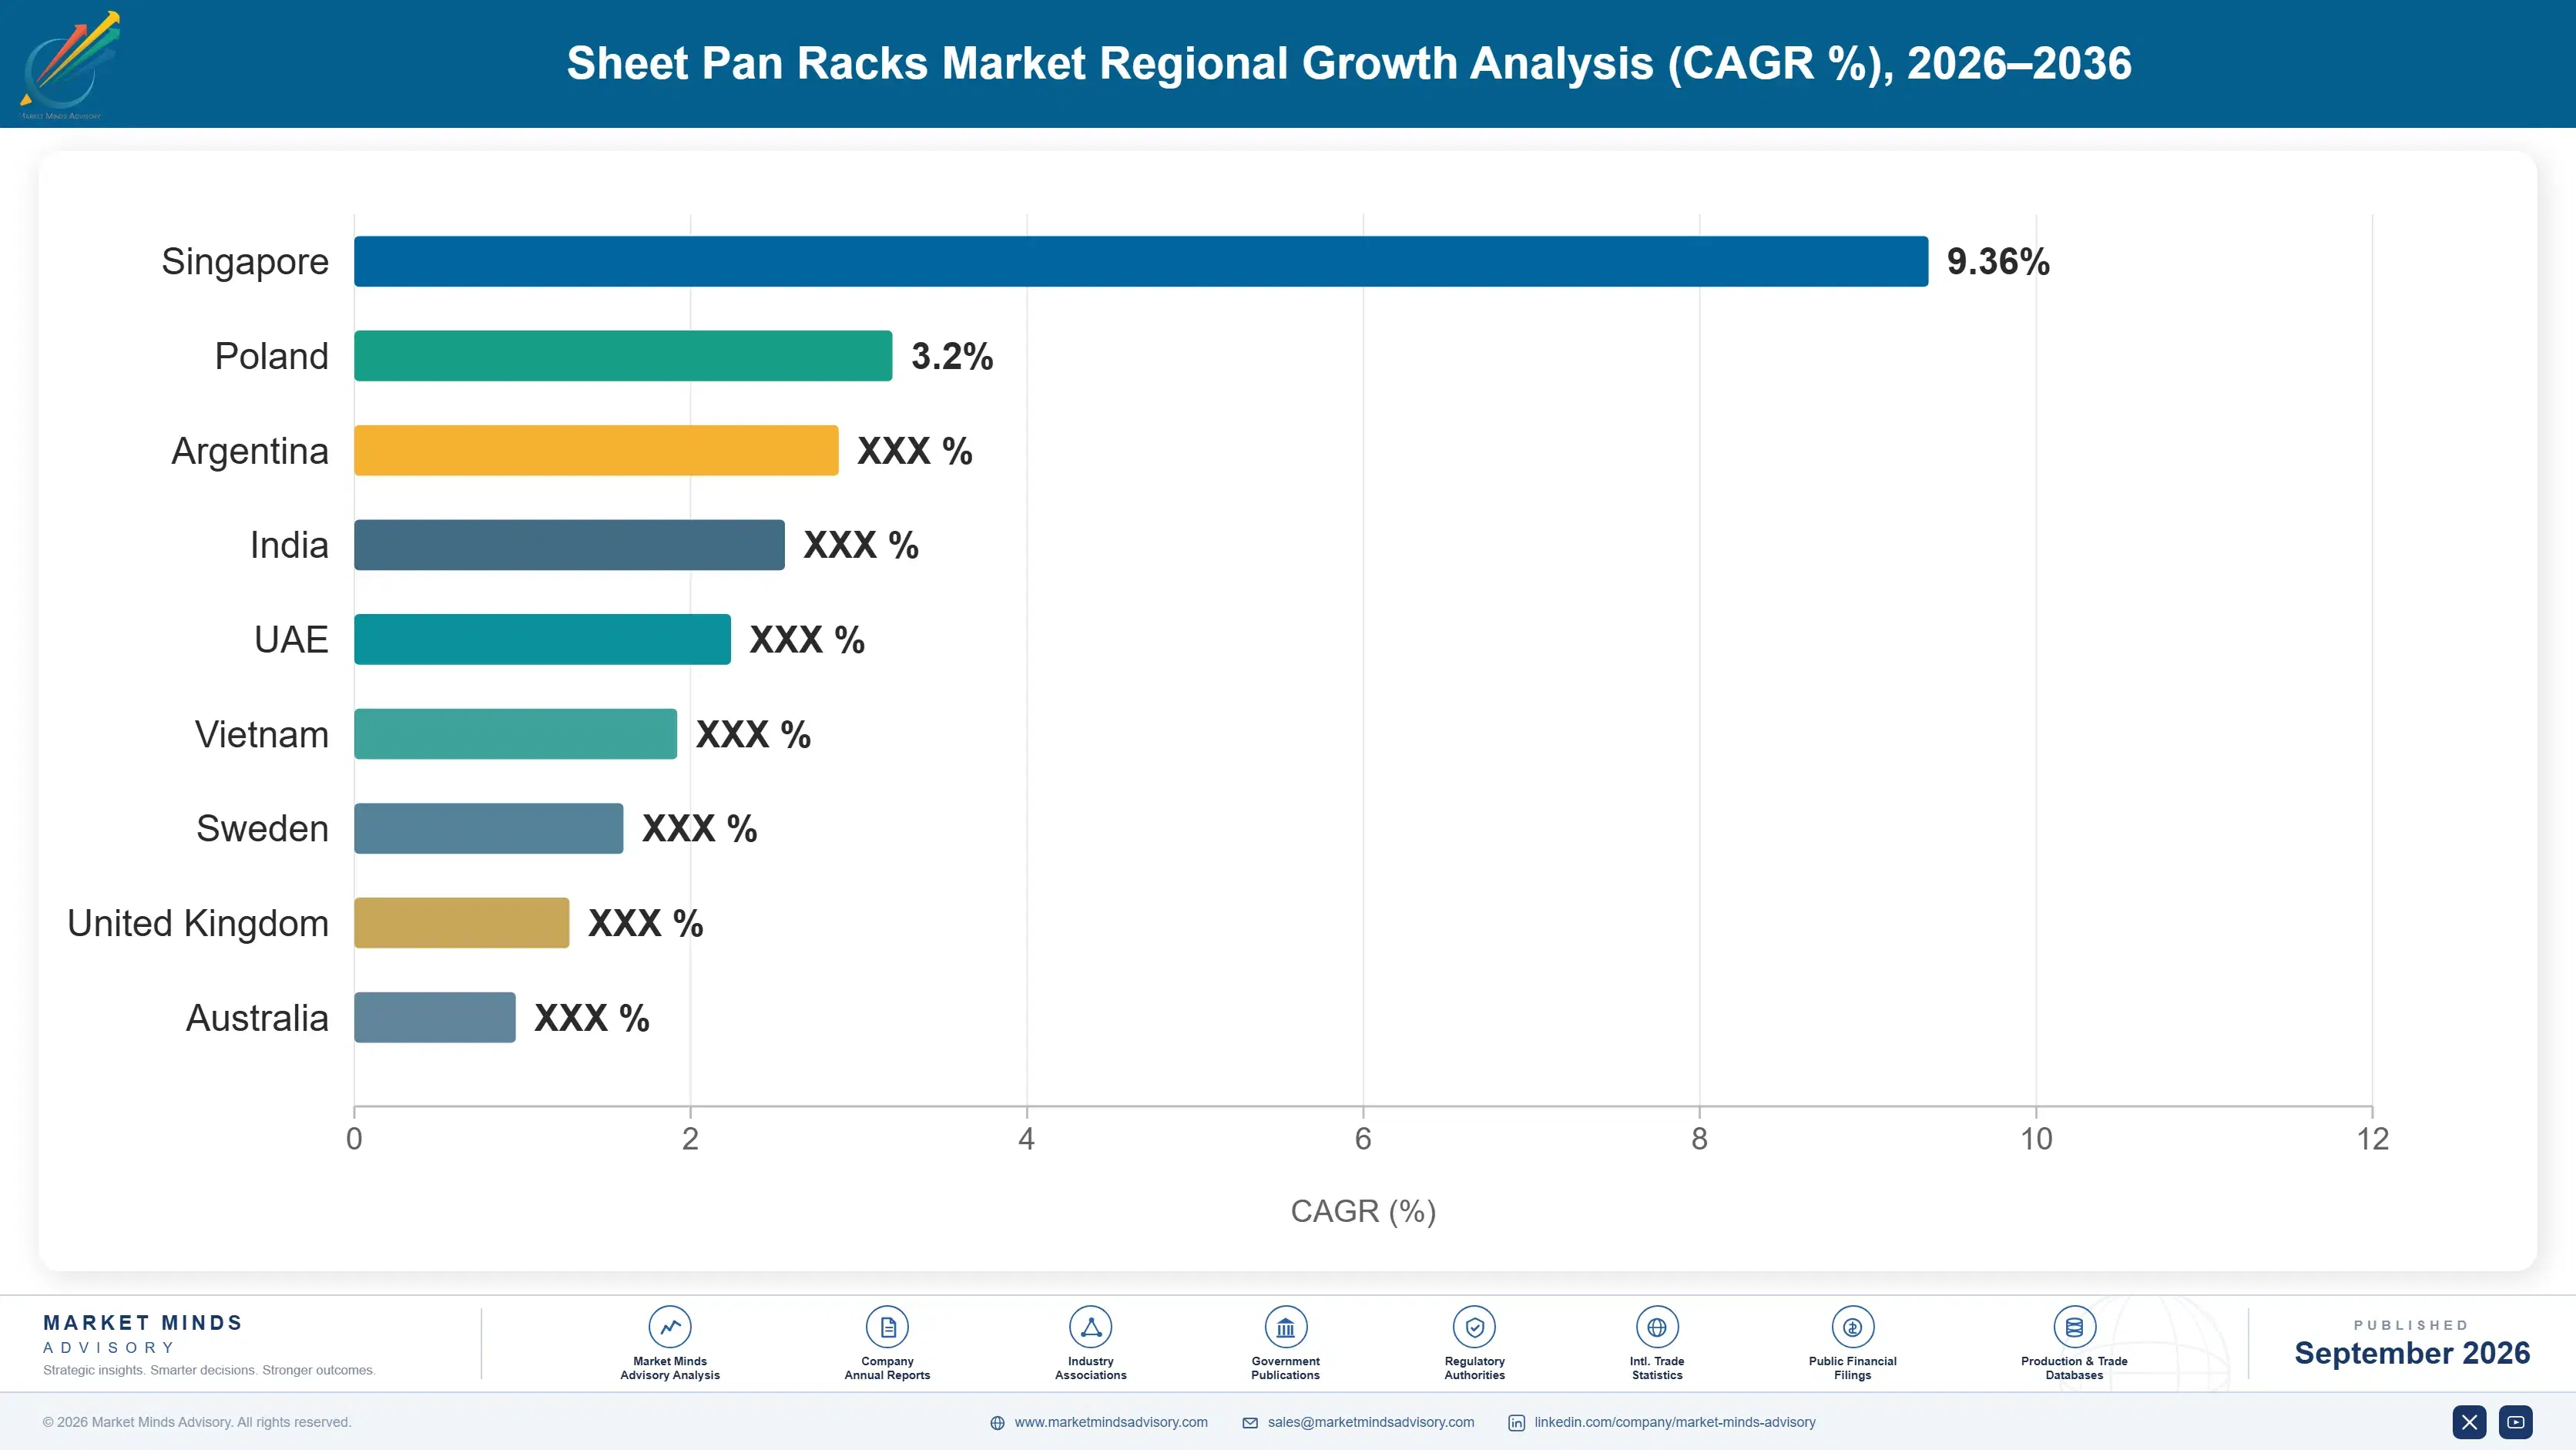
India grows fastest of any country covered at 9.3%, driven by organised food service chains and cloud kitchen operators building central production capacity at a pace no developed market matches. Those facilities buy pan racking in volumes that individual outlets never do, and domestic stainless fabrication serves them at costs imported equipment cannot approach. Specification quality is rising as operators learn which components fail, which favours manufacturers who can answer technical questions rather than quote prices. Cloud kitchen operators in particular buy racking by the dozen rather than individually, and they specify against a workflow they designed themselves.
Market Impact: Casters cause 64% of issues

Delivery Volume Shifts Kitchens Toward Batch Preparation

Foodservice operations rebuilt around delivery and collection prepare in batches and hold product rather than cooking to order across a dining room service, which increases demand for transport and holding equipment relative to presentation equipment. Pan racks benefited disproportionately because batch preparation needs somewhere for the batches to go. That restructuring happened from 2022 onward and has not reversed, which makes it a durable change in what commercial kitchens actually contain. Transport and holding equipment gained share against presentation equipment permanently, and pan racking captured a disproportionate part of that shift.
Market Impact: Some 19% fail doorway clearance

Market Restraints and Challenges

Caster Rating Is Absent From Almost Every Specification

Around 64% of rack service issues originate at the wheels while frames remain sound, and caster load rating and bearing type appear in very few specifications. The root cause is that a caster costs a few dollars against a rack costing several hundred, so it is the component where a bill of materials gets quietly trimmed. Commercially it means properly specified racks compete against cheaper ones on criteria that ignore the difference. Participants publishing caster ratings address it directly. Operators who have replaced casters twice already know precisely what to ask for. Almost nobody else does.
Market Impact: Nesting recovers 71% of footprint

Doorway Clearance Fails After Delivery In Practice

Roughly 19% of installations discover that a rack cannot pass an interior doorway once it arrives, which converts mobile equipment into fixed equipment and destroys the workflow it was bought to support. The root cause is that rack width is specified from a catalogue while door widths are a property of an existing building nobody measured. Commercially it produces returns and dissatisfaction. Mitigation runs to narrow-format ranges and pre-purchase dimension checklists supplied with quotations. A narrow-format range also lets a manufacturer capture the order rather than losing it when clearance turns out to be tight.
Market Impact: Central kitchens serve 12 outlets
3 additional market trends, 4 additional growth drivers, and 2 additional restraints and challenges are covered in the full report. Contact sales@marketmindsadvisory.com to access the complete intelligence.

Segment CAGR and Growth Architecture

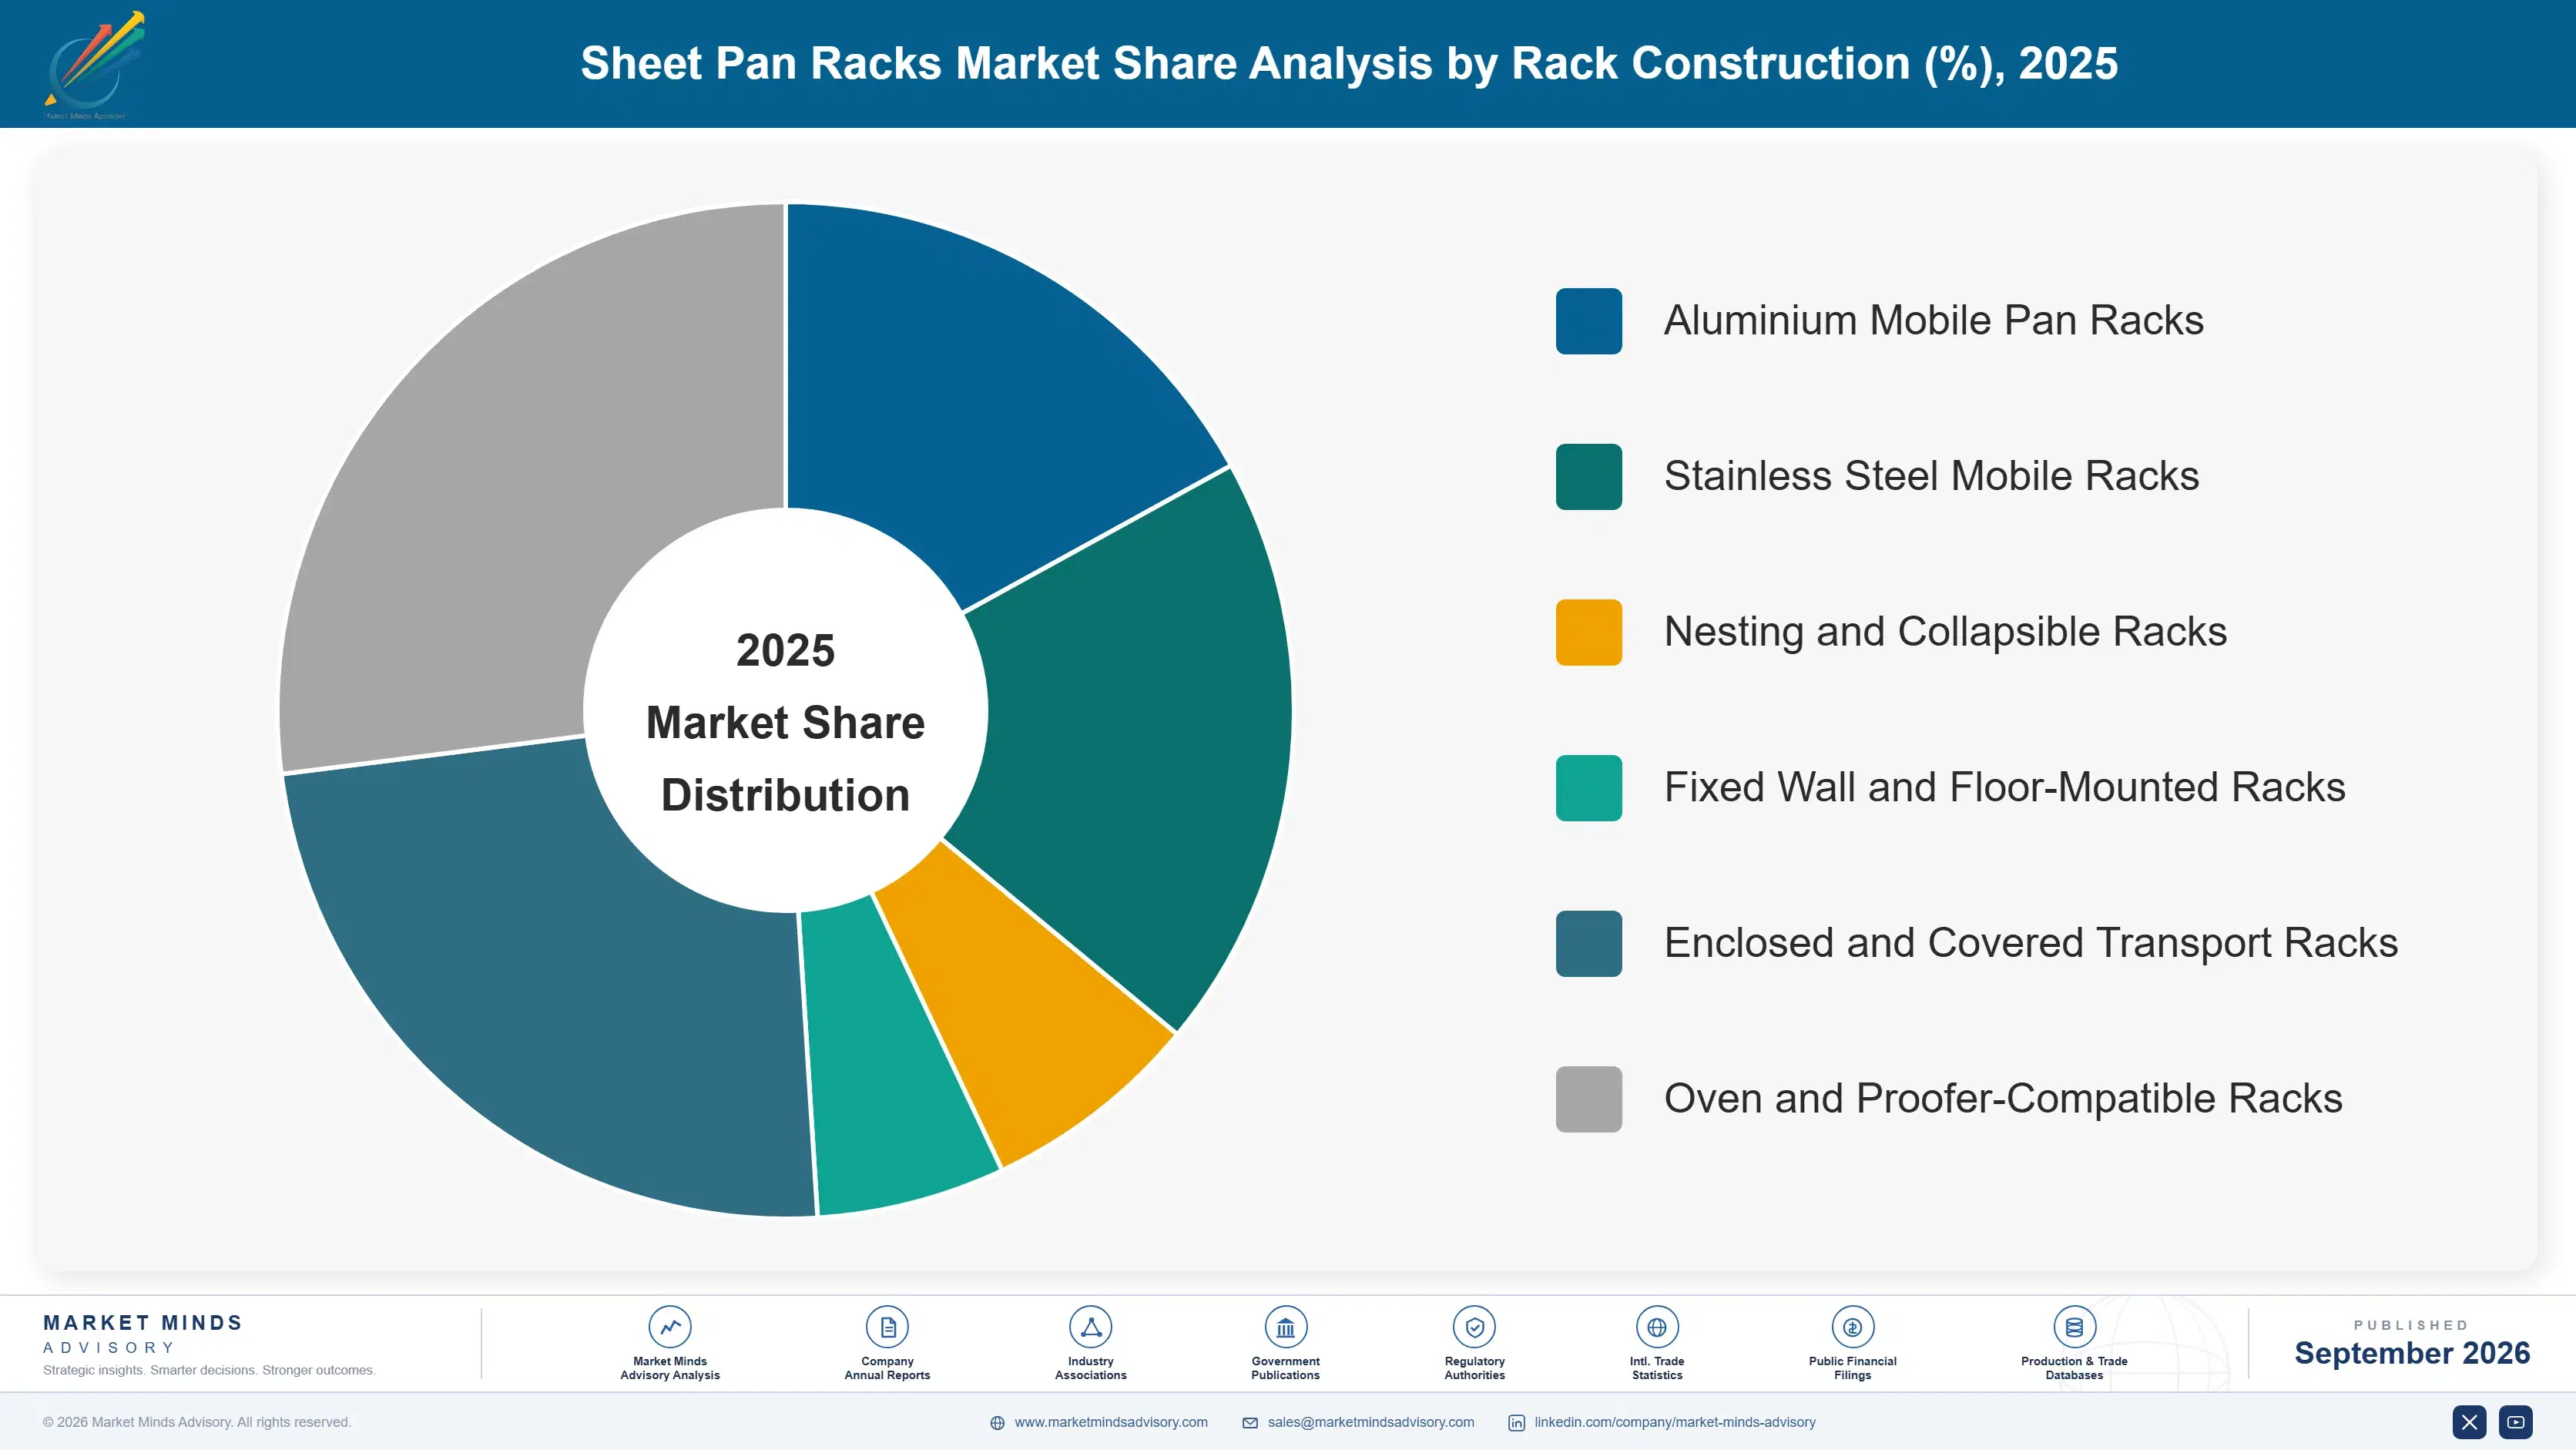
Segmentation follows rack construction, the dimension on which material, mobility, footprint behaviour and price all divide together. Six constructions are assessed at manufacturer net revenue. Sheet pans themselves, general storage shelving, refrigerated racking with integrated cooling, and dish and glass racking sit outside the defined scope throughout this report. Caster specification decides service life across all six of them.
sheet-pan-racks-market-market-share-analysis-1790025058992

Nesting And Collapsible Racks

Nesting and collapsible racks grow at 7.8%, half again the market rate of 5.2%, on an argument about floor area rather than about the rack itself. Urban commercial kitchens now cost enough per square metre that an empty rack occupying the same footprint as a full one is a measurable cost, and nesting designs recover around 71% of that area when idle. The benefit appears entirely in operating terms and nowhere in a purchase price comparison, which means it has to be presented with rent figures attached or it does not register with a buyer at all. Japanese kitchens adopted the format long before anybody else in the category did.
CAGR 7.8%

Aluminium Mobile Pan Racks

Aluminium mobile pan racks grow at 6.7% and represent the volume standard across most commercial kitchens, offering the weight-to-strength ratio that daily manual movement requires. A loaded unit still reaches around 94 kilograms, which is why caster specification matters more here than on any other construction in the category. Welded aluminium frames routinely outlast the kitchens they serve, so the entire service life question reduces to what happens at the wheels. Pan pitch also differs between manufacturers in ways that catalogues describe by slide count rather than by clear spacing. A rack bought on slide count rather than clear spacing therefore holds far less than its label implies once covered pans are involved.
CAGR 6.7%
Full segment breakdown across 6 segments available in the complete report.

Regional Architecture and Country Demand Map

Shares record where racking is installed rather than where stainless is fabricated. North America sits above its standard band on foodservice density and chain specification, and Eastern Europe below on limited organised food service. Both deviations carry a stated reason in the relevant paragraph concerned.

North America

At 33% this sits above the standard band, carried by foodservice outlet density and by chain operators who specify equipment centrally and roll it out across hundreds of sites. Cambro, Metro and Channel built positions on exactly that specification relationship. Central production kitchens serving multiple outlets have expanded quickly since 2022 as delivery volumes restructured how chains prepare food. Growth of 4.6% reflects a large installed base entering replacement alongside central kitchen construction, rather than any expansion in outlet numbers. Chain specification means a single central decision rolls across hundreds of sites and holds for years, which makes the specification relationship worth far more than any individual order it produces.
Share: 33% | CAGR: 4.6% (2026 to 2036)

East Asia

The 22% position sits inside the standard band and Chinese organised food service is expanding rapidly alongside a stainless fabrication base that supplies equipment globally. Japanese commercial kitchens are unusually space constrained, which makes nesting and narrow formats sell proportionally better there than anywhere else covered. Korean chain operators specify centrally in the North American pattern. Growth of 6.1% reflects organised food service expansion in China and replacement demand across the more mature Japanese and Korean markets. Chinese fabricators supplying equipment globally are also moving into their own specified ranges, which changes the competitive position of Western manufacturers in every market where the two now compete for exactly the same buyers.
Share: 22% | CAGR: 6.1% (2026 to 2036)
Regional intelligence for 5 additional markets available in the complete report: Western Europe, South Asia and Pacific, Latin America, Middle East and Africa, Eastern Europe. Contact sales@marketmindsadvisory.com.
sheet-pan-racks-market-country-cagr-analysis-1790025059534

Four Moves Worth Making Now

These four address a category where the component that fails costs a few dollars, the benefit that matters most appears nowhere in a purchase price, and a fifth of installations discover a dimension problem after delivery. Each has been executed by at least one manufacturer. Three of the four cost a document change rather than any capital.

Publish Caster Load Rating And Bearing Type

Around 64% of rack service issues originate at the wheels while frames remain sound, and caster specification appears in very few tenders because the component costs a few dollars against a rack costing several hundred. Publishing load rating and bearing type costs a datasheet revision. Participants who did report warranty claims falling roughly 41% and specification inclusion rising, because operators who have replaced casters twice know precisely what to ask for. A caster costs a few dollars against a rack costing several hundred, which is exactly why the specification gets quietly trimmed there first.
Market Impact: Rack warranty claims fall by roughly 41% overall

Supply Dimension Checklists With Every Quotation

Roughly 19% of installations discover after delivery that a rack cannot pass an interior doorway, which destroys the mobility the equipment was bought for and generates returns nobody wanted. Supplying a one-page clearance checklist with quotations costs a document. Participants who did report return rates falling by around 63% on mobile racking, and they capture the narrow-format sale instead of losing the order entirely when clearance turns out to be tight. Rack width comes from a catalogue while door width is a property of an existing building nobody measured, which is why the failure keeps recurring.
Market Impact: Mobile racking returns fall by roughly 63% overall

Sell Nesting On Kitchen Rent Per Square Metre

Nesting racks recover around 71% of floor area when standing empty, and urban commercial kitchens cost enough per square metre for that to be a measurable operating line rather than a convenience. Presenting the saving against actual rent costs a calculation rather than a product change. Participants who did report nesting conversion rising roughly 2.7 times among urban operators, because the buyer can verify the figure against a lease they already signed. The saving is invisible at purchase and obvious in operation, which means it has to be presented rather than discovered. Very few participants present it at all.
Market Impact: Nesting rack conversion rises roughly 2.7 times higher

Specify Pan Pitch In Clear Millimetres Not Slides

Catalogues describe capacity by slide count while usable capacity depends on clear spacing between slides, which differs between manufacturers and determines whether covered pans, proofing trays or deep hotel pans actually fit. Stating clear pitch in millimetres costs a specification change. Participants who did report order accuracy improving materially, with roughly 28% fewer post-delivery capacity complaints across their mobile racking ranges. Covered pans, proofing trays and deep hotel pans all need more clearance than a flat sheet, and a catalogue describing slides tells a buyer nothing about any of them. The measurement already exists internally.
Market Impact: Post-delivery capacity complaints fall by roughly 28% overall

Who Controls the Margin Pool

Concentration is low at 27% held by the top five, measured consistently on manufacturer net revenue rather than unit volume, which would overweight basic imported racking sold through general restaurant supply at very low prices. The leader to challenger gap rests on chain specification relationships and distributor coverage rather than on fabrication, since welding aluminium or stainless tube is widely available capability.
Competition runs on three dimensions currently. Chain specification decides the largest volumes, because a single central decision rolls across hundreds of sites and holds for years. Distributor coverage decides independent operator sales, where the buyer selects from whatever a foodservice dealer carries. Price decides the value tier, where imported racking is close to interchangeable and nothing distinguishes one participant from another at all.

Pressure is building from two directions and positions will shift on both. Indian and Chinese fabricators serving central production kitchens are reaching specification capability in the fastest-growing part of the category, backed by cost positions Western manufacturers cannot approach. Meanwhile central kitchen operators evaluate equipment technically rather than from catalogues, which advantages manufacturers who can answer questions about caster ratings and clear pitch.
sheet-pan-racks-market-company-positioning-matrix-1790025060074

Competitive Moat and Risk Dimensions

CAMBRO MANUFACTURING

Moat: Chain Specification And Breadth

Specification relationships with large chain operators combined with breadth across transport, holding and storage equipment make the company a single supplier for a whole category rather than a vendor of one product, and those relationships hold across multi-year rollout programmes. Requalifying equipment against an established workflow is genuinely inconvenient.
CAMBRO MANUFACTURING

Risk: Value Tier Import Exposure

Volume weighted toward accessible price points competes against imported racking where fabrication is widely available and nothing differentiates the product visibly. Defending that tier on price alone is not a position that improves with scale in a category this technically simple. Welding tube is not a defensible capability.
METRO

Moat: Distributor Network And Availability

Deep foodservice dealer coverage places product in front of independent operators who buy from whatever their distributor carries, and stock availability matters more than specification in a channel where equipment is frequently needed within days rather than planned months ahead. Independent operators take whatever is in stock when something breaks.
METRO

Risk: Technical Specification Capability Gap

Central production kitchens evaluate caster ratings, clear pitch and doorway clearance technically rather than selecting from a catalogue, which is a different sale from distributor availability. Building that capability requires technical support headcount the distribution model has never needed. Central kitchens ask questions a stock list cannot answer.

Players Tracked

Prominent Players

Cambro Manufacturing
Metro
Channel Manufacturing
Winco
New Age Industrial

Other Key Players

Vollrath
Carlisle FoodService
Advance Tabco
Lakeside Manufacturing
Piper Products
Bourgeat
Rieber
Blanco Professional
Tournus Equipement
Hupfer
Craven
Moffat
Jiangsu Jiawei
Vinod Cookware Industrial
Kitchen Equipment India

Recent Developments

APRIL 2025

Cambro Manufacturing publishes caster ratings across mobile range

The company added load rating and bearing specification to datasheets across its mobile racking range, disclosing the component that causes most service issues. This was an internal documentation change with no acquisition, partnership or regulatory requirement behind it. Caster specification was upgraded at the same time.
Signal: Operators who replaced casters twice know what to ask for. Nobody else publishes comparable figures yet.
OCTOBER 2024

Vinod Cookware Industrial expands Indian central kitchen equipment capacity

The manufacturer added stainless fabrication capacity serving cloud kitchen and organised food service operators building central production facilities across India. This was organic capital investment made directly, with no joint venture, acquisition or licensing arrangement involved. Existing cookware production continued unchanged alongside the new fabrication lines.
Signal: Central kitchen volumes are being served domestically rather than imported. Freight on a bulky low-density product is decisive here.
FEBRUARY 2025

Rieber introduces narrow-format nesting rack for European kitchens

The company launched a reduced-width nesting rack designed to pass interior doorways in older European buildings where standard formats commonly fail. This was organic product development funded internally, with no partnership, licensing arrangement or acquisition behind the design work. Standard-width models remain available across the rest of the range.
Signal: Doorway clearance is being designed around rather than discovered afterwards. European kitchen dimensions differ enough to justify separate formats.

What The Rack Costs

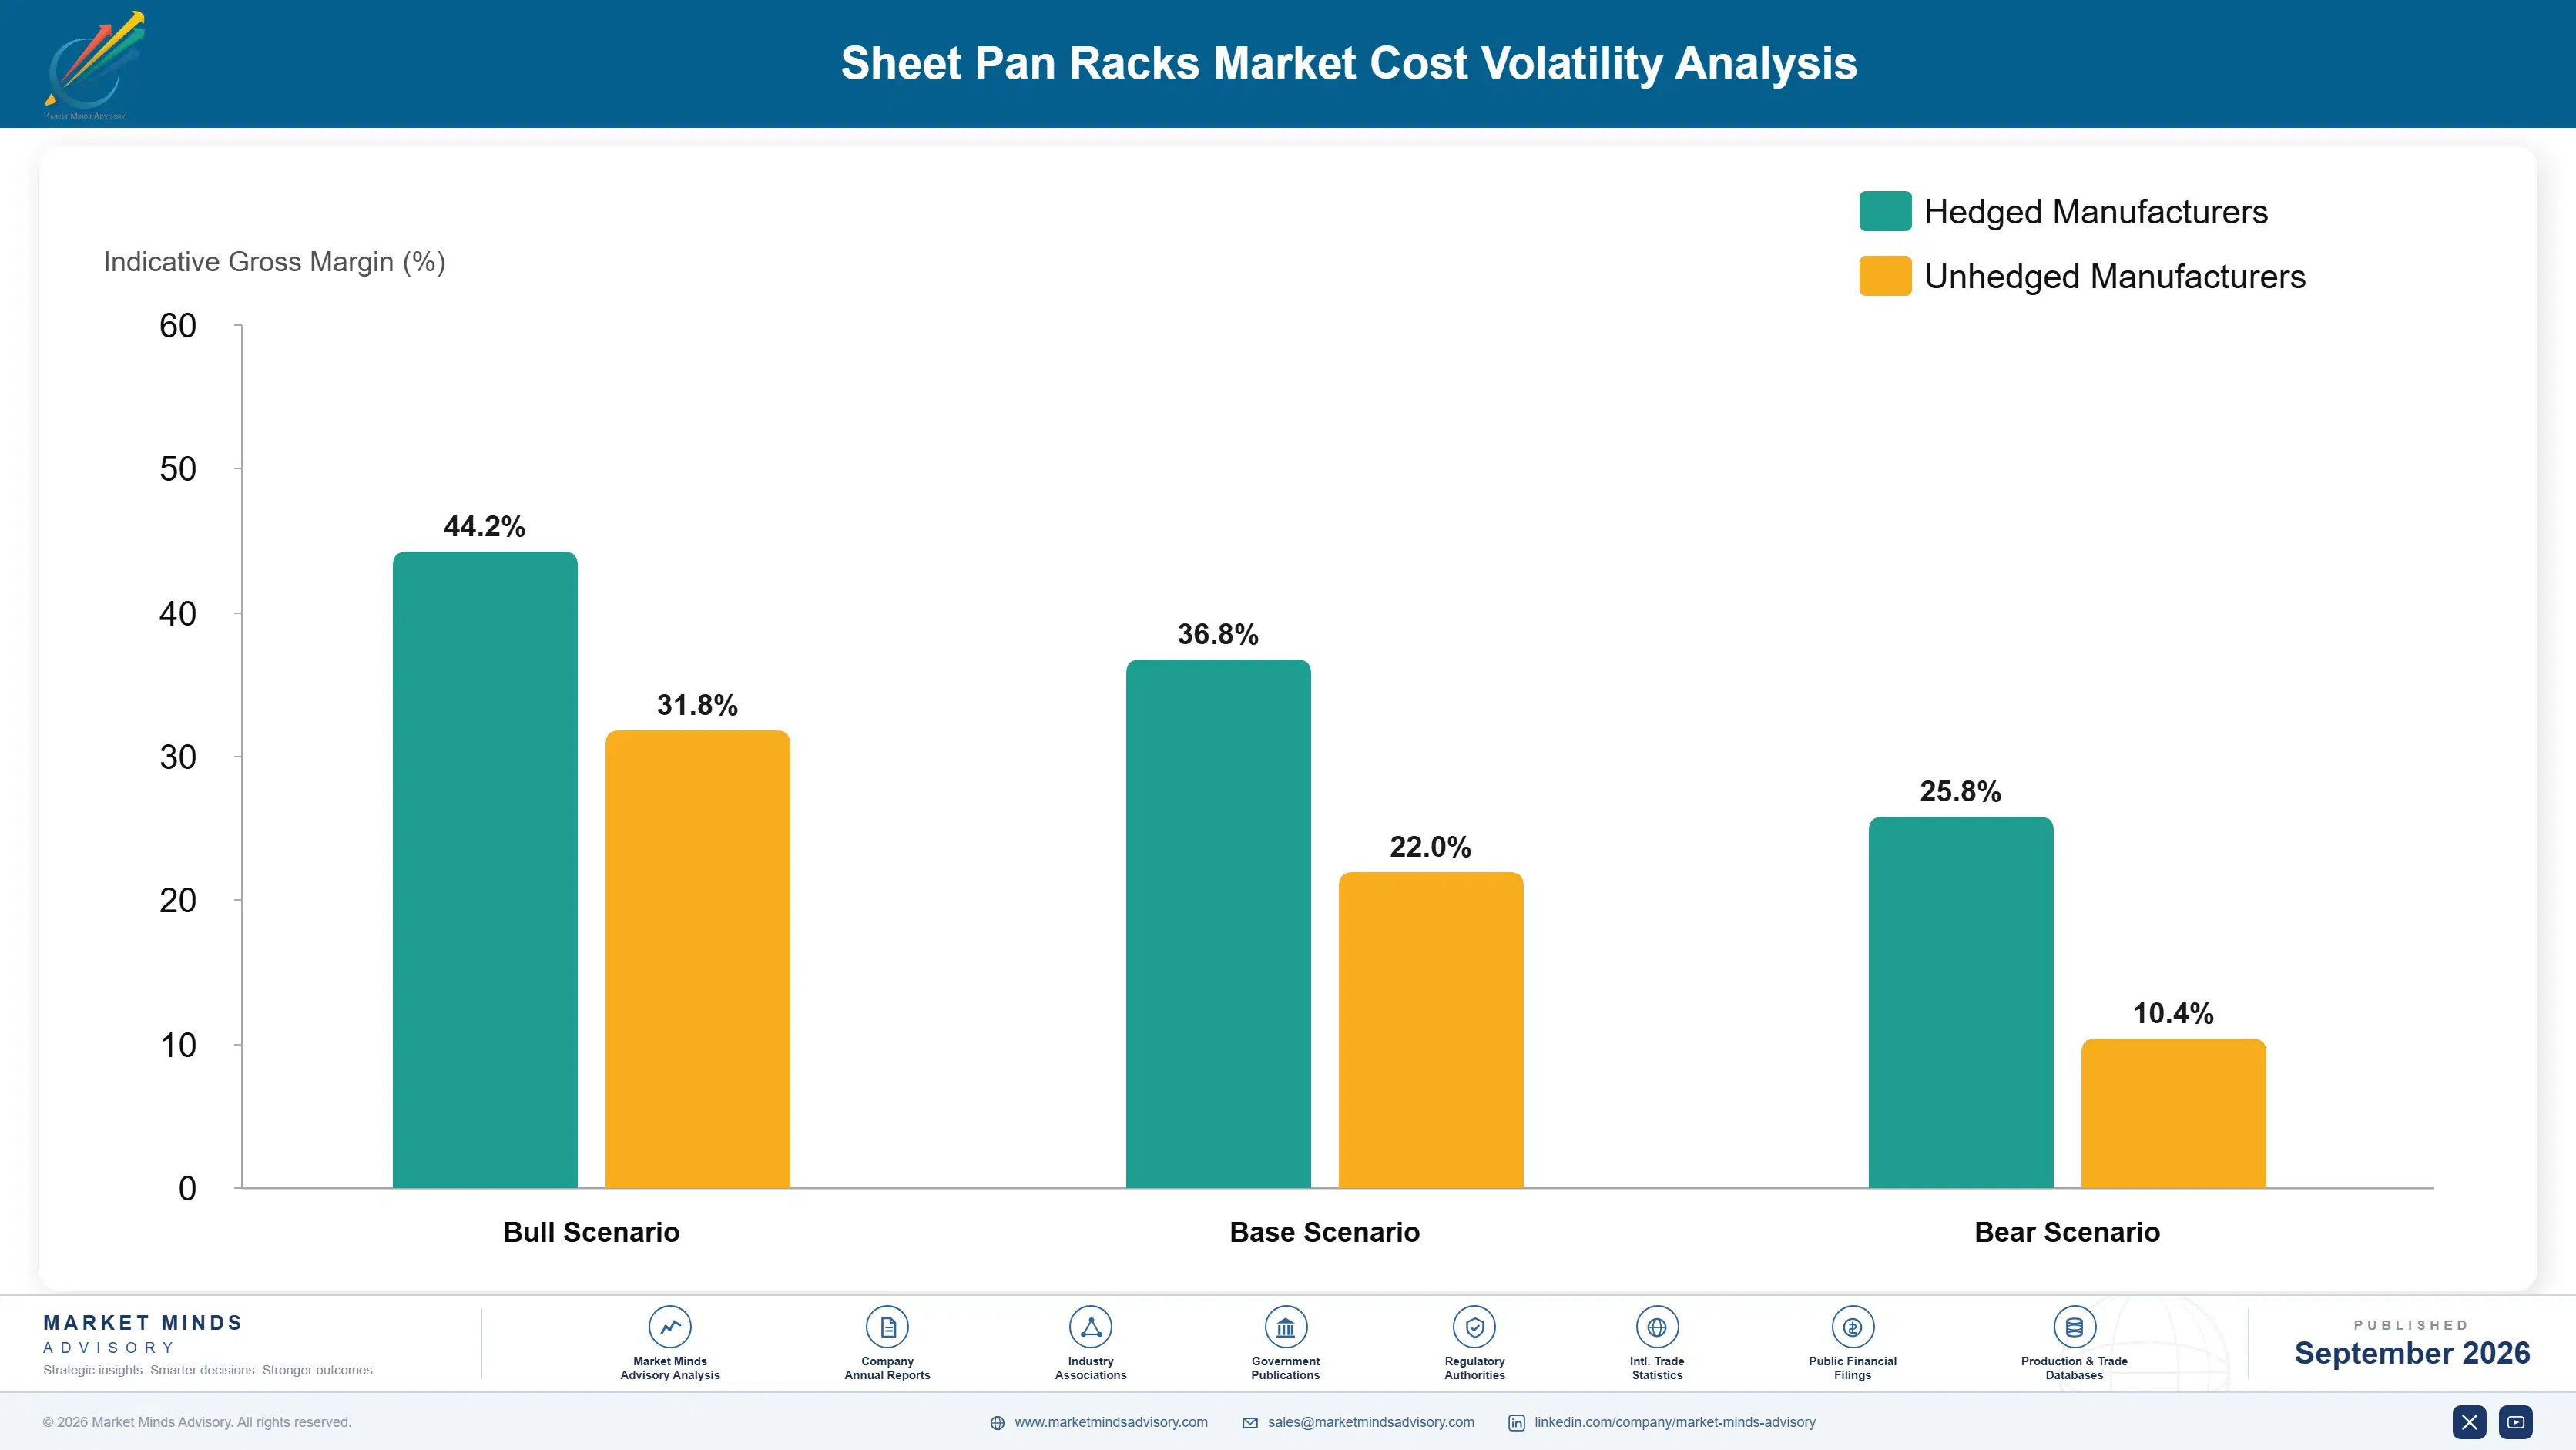
Metal stock and fabrication account for most of the cost while the failure component accounts for almost none. Aluminium or stainless tube and sheet run roughly 38% of manufacturing cost, welding and fabrication labour about 24%, and finishing and passivation around 11%. Casters represent under 4%, which is exactly why they get downgraded. Packaging and freight take most of the remainder on a bulky low-density product.
Aluminium and stainless prices rose sharply through 2021 and 2022 on energy and nickel costs together, while sea freight on bulky equipment climbed in the same window, a movement the EIA documents for energy inputs and the US Census Bureau records in trade data. Several manufacturers reported margin compression across foodservice equipment ranges in their 2022 disclosures and repriced through distribution. Both movements landed inside one financial year.

Exposure divides by material and by manufacturing location rather than by company size. Stainless-weighted participants carry nickel exposure that aluminium producers avoid entirely, while aluminium producers carry energy-driven smelting cost instead. Manufacturers producing in India and China for central kitchen demand avoid the freight layer on their fastest-growing markets, which matters disproportionately on a product that ships volume rather than weight.
sheet-pan-racks-market-cost-volatility-analysis-1790025060271

Upgrade caster specification regardless of tender language

Casters represent under four percent of manufacturing cost and cause roughly 64% of service issues, which makes upgrading them the cheapest durability improvement available in the whole assembly. Specifying rated bearings as standard costs almost nothing per unit. The benefit arrives as warranty cost avoided rather than as revenue, which is why it keeps getting deferred.

Hold both aluminium and stainless production capability

Aluminium prices on smelting energy and stainless on nickel, and the two rarely move together, which means a manufacturer running both materials is exposed to each only partially. Hygiene regulation in several European markets also mandates stainless. The requirement is duplicated tooling and welding capability rather than a single optimised line. Few participants maintain both properly.

Manufacture regionally for bulky low-density equipment

Pan racking ships volume rather than weight, which makes freight a meaningful share of landed cost on any long route into a fast-growing market. Producing closer to demand removes it along with duty exposure. The constraint is that regional volumes must justify fabrication and finishing capacity before the freight saving materialises at all. India and China clear that threshold now.

Portfolio Architecture for Margin Defence

Margin architecture divides by whether the buyer specified or the distributor stocked, which a catalogue price does not reveal. Basic imported mobile racking sold through general restaurant supply runs at gross margins in the low twenties to low thirties, competing on price against interchangeable product where fabrication capability is available to anybody with a welding shop. Nothing visible distinguishes one welded frame from another at all.
Aluminium mobile racks and fixed wall formats hold gross margins in the mid thirties to mid forties. The spread reflects how differently specified and distributor-stocked product carries technical support cost. Aluminium in particular earns its position on weight-to-strength for daily manual movement, which is a genuine engineering property rather than a marketing claim about the material.

The highest-value pool is nesting and collapsible formats alongside enclosed transport racking, at margins in the high forties to high fifties. Those buyers evaluate floor area against rent and transport integrity against product loss, and pay for engineering answering both. Basic imported racking carries volume and dealer shelf presence. It defends nothing against another fabricator. Dealer presence is the argument for keeping that tier, and it is genuinely real.

Volume / Commodity-Adjacent

Basic imported mobile racking through general restaurant supply, competing on price where fabrication is available to anybody with a welding shop. The ten point range reflects differing distributor terms. Caster specification is where cost gets trimmed first.
Gross Margin: 22 to 32%

Premium / Certified

Aluminium mobile racks and fixed wall formats. Aluminium earns its position on weight-to-strength for daily manual movement, which is a genuine engineering property rather than a material claim. A loaded unit still reaches around ninety kilograms.
Gross Margin: 35 to 45%

Sustainability / Regulatory / Next-Generation

Nesting and collapsible formats alongside enclosed transport racking. Buyers evaluate floor area against rent and transport integrity against product loss, and pay for engineering answering both. Both arguments have to be made explicitly with figures.
Gross Margin: 47 to 58%
sheet-pan-racks-market-portfolio-architecture-1790025060770

High-value Sub-segments and Strategic Watch-out

Nesting And Collapsible Racks

Highest value and fastest growth at 7.8%, recovering around 71% of floor area when empty. The benefit appears in operating terms and nowhere in a purchase price, so it has to be argued with rent figures. Japanese kitchens adopted the format well ahead of everybody else.
Gross Margin: 48 to 57%

Enclosed Transport Racks

High value and strong growth, particularly across Gulf hotel and airline catering where product moves between buildings in high ambient temperatures. Transport integrity rather than capacity decides these specifications entirely. A rack failure that delays an aircraft costs far more than the equipment ever did.
Gross Margin: 44 to 53%

Aluminium Mobile Pan Racks

Volume core across most commercial kitchens, carrying the weight-to-strength ratio daily manual movement requires. Caster specification decides actual service life because the welded frame outlasts the kitchen around it. Pan pitch also differs between manufacturers in ways that the published catalogues describe extremely badly indeed.
Gross Margin: 36 to 44%

Fixed Wall And Floor Racks

Strategic watch-out. Growing slowest at 2.4% and specified mainly where mobility is genuinely unnecessary. The eighteen point range reflects how differently fabricated and imported product is priced for identical function. Hygiene regulation across several European markets mandates stainless over aluminium in this particular tier entirely.
Gross Margin: 24 to 42%

How Kitchens Actually Reorder

Replacement here is driven by casters rather than by racks, which most manufacturers have never turned into a commercial position. An operator whose wheels seize either replaces the casters or replaces the rack, and which of the two happens depends entirely on whether replacement casters are available and identifiable. Manufacturers supplying them capture a small repeating revenue and hold the account; those who do not lose the whole unit.
Stickiness varies sharply by how the equipment was bought. Chain accounts specifying centrally are the most durable, since a rollout decision holds across hundreds of sites and years, and requalifying equipment against an established workflow is genuinely inconvenient. Central production kitchens are similar. Independent operators buying from a distributor have no attachment at all and take whatever is in stock when something breaks.

Buyer profiles have shifted toward technical evaluation since 2022. Central production kitchens serving multiple outlets now represent a growing share of purchasing, and those operators assess caster ratings, clear pitch and doorway clearance against a documented workflow rather than selecting from a catalogue. That is a different sale from distributor availability and most participants are not equipped to make it.
sheet-pan-racks-market-end-use-penetration-index-1790025061270

Where The Component Decides

These are among the four positions where our research anticipates prominent divergence between winners and laggards over the coming forecast period. Each is grounded in the demand model, the regulatory perimeter, and the announced capacity pipeline.
01 / CASTER SPECIFICATION DISCLOSURE

Publish the rating on the wheels

Roughly 64% of rack service issues originate at the casters while the welded frames above them remain perfectly sound, and load rating and bearing type appear in very few specifications anywhere. Publishing them costs a datasheet revision rather than any change to the product being sold. Participants who did it report warranty claims falling roughly 41% alongside rising specification inclusion, because operators who have replaced casters twice know exactly what to ask for, and a caster costs a few dollars against a rack costing hundreds.
02 / CLEARANCE CHECKLIST SUPPLY

Measure the doorway before delivery

Around 19% of installations discover after delivery that a rack cannot pass an interior doorway, which destroys the mobility the equipment was purchased for and generates returns that nobody involved wanted. Supplying a one-page clearance checklist alongside every quotation costs a document rather than anything else. Participants who did it report return rates falling by around 63% on mobile racking, while capturing the narrow-format sale rather than losing the order, and rack width comes from a catalogue while door width does not.
03 / FLOOR AREA ECONOMICS

Price the footprint against the lease

Nesting racks recover around 71% of their floor area when standing empty, and urban commercial kitchens cost enough per square metre for that to be a measurable operating line rather than a convenience. Presenting the saving against an operator's actual rent costs a calculation rather than any product change at all. Participants who did it report nesting conversion rising roughly 2.7 times among urban operators, who verify the figure against a lease they signed, because the saving is invisible at purchase and obvious in operation.
04 / PITCH SPECIFICATION CLARITY

State millimetres, not slide counts

Catalogues describe capacity by slide count while usable capacity depends on clear spacing between slides, which differs between manufacturers and determines whether covered pans, proofing trays or the deep hotel pans will actually fit at all. Stating the clear pitch in millimetres costs only a specification document change. Participants who have done it report order accuracy improving materially, with roughly 28% fewer post-delivery capacity complaints across all of their own mobile racking ranges, and the measurement already exists inside every engineering function.

Engagement Snapshot From the Field

A live engagement with an industry participant carrying material or product regulatory and market exposure ahead of a defining policy shift, showing how our research translates into a defensible multi-year portfolio strategy.
MARKET MINDS ADVISORY · CLIENT ENGAGEMENT SUMMARY
Sheet Pan Racks Producer Strategic Portfolio Review and Transition Roadmap 2026·Investment Scenario on Sheet Pan Racks Exposure Evaluation 2025-26
CLIENT PROFILE
A North American foodservice equipment manufacturer with pan racking revenue near USD 54 million (client-reported, unverified by MMA), split approximately 58% distributor and 42% chain specification. No datasheet stated caster load rating. Nesting formats were absent from the range and pan capacity was described by slide count throughout the catalogue. Clearance guidance was never supplied with quotations.
STRATEGIC CHALLENGE
Chain specification revenue had been flat for three years while central production kitchen construction expanded rapidly, and management attributed the gap to imported price competition. A cost reduction on the aluminium range had been approved. Nobody had reviewed warranty claims by component or asked central kitchen operators what they specified against.
MMA APPROACH
MMA coded four years of warranty claims by failing component rather than by product line. Central production kitchen operators were interviewed on specification criteria and evaluation process. Returns were traced to stated reasons, and nesting floor area savings were measured against commercial kitchen rents in six urban markets. Findings were reconciled against distributor sales records.
KEY FINDINGS
  1. Coded warranty claims showed 68% of failures originated at casters with frames intact, and the proposed cost reduction targeted caster specification directly.
  2. All nine central kitchen operators interviewed specified caster load rating and clear pan pitch, and none could obtain either figure from the client's documentation.
  3. Returns traced to doorway clearance accounted for 22% of all mobile racking returns, and no clearance guidance was supplied with any quotation.
  4. Measured nesting savings were worth USD 2,900 annually per rack position at median urban kitchen rent, against a rack purchase price near USD 340.
CLIENT PROFILE
A North American foodservice equipment manufacturer with pan racking revenue near USD 54 million (client-reported, unverified by MMA), split approximately 58% distributor and 42% chain specification. No datasheet stated caster load rating. Nesting formats were absent from the range and pan capacity was described by slide count throughout the catalogue. Clearance guidance was never supplied with quotations.
STRATEGIC CHALLENGE
Chain specification revenue had been flat for three years while central production kitchen construction expanded rapidly, and management attributed the gap to imported price competition. A cost reduction on the aluminium range had been approved. Nobody had reviewed warranty claims by component or asked central kitchen operators what they specified against.
MMA APPROACH
MMA coded four years of warranty claims by failing component rather than by product line. Central production kitchen operators were interviewed on specification criteria and evaluation process. Returns were traced to stated reasons, and nesting floor area savings were measured against commercial kitchen rents in six urban markets. Findings were reconciled against distributor sales records.
KEY FINDINGS
  1. Coded warranty claims showed 68% of failures originated at casters with frames intact, and the proposed cost reduction targeted caster specification directly.
  2. All nine central kitchen operators interviewed specified caster load rating and clear pan pitch, and none could obtain either figure from the client's documentation.
  3. Returns traced to doorway clearance accounted for 22% of all mobile racking returns, and no clearance guidance was supplied with any quotation.
  4. Measured nesting savings were worth USD 2,900 annually per rack position at median urban kitchen rent, against a rack purchase price near USD 340.
RECOMMENDED STRATEGY
Phase 1: Phase one: cancel the cost reduction, upgrade caster specification and publish load ratings on every datasheet. Rated bearings cost almost nothing extra. Phase 2: Phase two: restate pan capacity in clear millimetres and supply clearance checklists with all quotations. Both changes are documentation rather than product. Phase 3: Phase three: develop nesting formats and sell them against measured kitchen rent in urban markets. Rent figures make the argument by themselves.
OUTCOME
Warranty claims fell by roughly half within four quarters of the caster upgrade reaching production (client-reported, unverified by MMA). Central kitchen specification wins rose materially once ratings and pitch were published, and the nesting range reached 12% of revenue in its first full year at the highest margin in the portfolio.

Frequently Asked Questions

Foundational context covering the market sizes, CAGR, scope, country, region and competition that inform every finding below. This section is provided to cover basics and most often pre-purchase conversations, answered from the MMA Primary Research Dataset.

What is the current size of the Sheet Pan Racks Market?

The market was valued at USD 1.3 billion in 2025, rising to USD 1.4 billion in 2026. Sizing is at manufacturer net revenue across six rack constructions.

How large will the Sheet Pan Racks Market be by 2036?

MMA forecasts USD 2.3 billion by 2036, an increase of USD 0.9 billion over the 2026 base. That represents expansion of 1.64 times across the forecast period.

What is the CAGR for the Sheet Pan Racks Market 2026 to 2036?

The base case CAGR is 5.2%, with a bull case of 6.4% and a bear case of 4.0%. Historical growth between 2020 and 2025 ran at 4.1%.

Which segment is growing fastest?

Nesting and collapsible racks grow at 7.8%, half again the market rate, as kitchen floor area is priced against rent. Aluminium mobile racks follow at 6.7%.

Who are the major companies in the Sheet Pan Racks Market?

Cambro Manufacturing, Metro, Channel Manufacturing, Winco and New Age Industrial lead on manufacturer net revenue, holding a combined 27%. Chain specification relationships rather than fabrication separate them.

Which country is growing fastest?

India grows fastest at 9.3%, on organised food service and cloud kitchen operators building central production capacity served by domestic stainless fabrication. Those operators buy racking by the dozen rather than individually.

Report Segmentation Architecture

The full report scope spans multiple orthogonal segmentation dimensions, with cross-tabulated demand data provided for each dimension pair. Coverage extends further to regional breakdowns, trend trajectories, and the competitive detail needed to support segment-level decision-making.

By Rack Construction

  • Aluminium Mobile Pan Racks
  • Stainless Steel Mobile Racks
  • Nesting and Collapsible Racks
  • Fixed Wall and Floor-Mounted Racks
  • Enclosed and Covered Transport Racks
  • Oven and Proofer-Compatible Racks

By End-Use Industry

  • Restaurant and Quick Service Kitchens
  • Central Production and Cloud Kitchens
  • Commercial Bakeries
  • Institutional and Contract Catering
  • Hotel and Banqueting Kitchens
  • Airline and Transport Catering

By Commercial Dimension

  • Chain Central Specification
  • Foodservice Dealer Distribution
  • Direct Manufacturer Sales
  • Kitchen Design and Build Consultancy
  • Marketplace and Online Supply
  • Institutional Tender Procurement

By Region

  • North America
  • East Asia
  • Western Europe
  • South Asia and Pacific
  • Latin America
  • Middle East and Africa
  • Eastern Europe

Scope, Methodology, and Coverage

Every figure in this report is reproducible from documented input assumptions. The scope below maps the historical period, the forecast horizon, the segmentation dimensions, and the countries covered, alongside the underlying primary and qualitative methodology.
Historical Period
2020 to 2025
Forecast Period
2026 to 2036
Base Year
2025 (USD billions; MMA Primary Research Dataset, September 2026)
Market Definition
This market covers mobile and fixed racking designed to hold sheet pans, trays and similar flat foodservice vessels, spanning aluminium mobile pan racks, stainless steel mobile racks, nesting and collapsible racks, fixed wall and floor-mounted racks, enclosed and covered transport racks, and oven and proofer-compatible racks. Sizing is at manufacturer net revenue across chain specification, dealer distribution, direct, design consultancy, online and institutional tender channels. Sheet pans themselves, general storage shelving, refrigerated racking with integrated cooling, and dish and glass racking are excluded throughout.
Quantitative Units
USD billions at manufacturer net revenue; volume in thousands of racks shipped; capacity in clear pan pitch millimetres.
Segmentation Dimensions
Rack construction, end-use industry, commercial dimension, and geographic region.
Regions Covered
North America, East Asia, Western Europe, South Asia and Pacific, Latin America, Middle East and Africa, Eastern Europe
Countries Covered
United States, China, India, Germany, Brazil, United Arab Emirates
Key Companies Profiled
Cambro Manufacturing, Metro, Channel Manufacturing, Winco, New Age Industrial, Vollrath, Carlisle FoodService, Advance Tabco, Lakeside Manufacturing, Piper Products, Bourgeat, Rieber, Blanco Professional, Tournus Equipement, Hupfer, Craven, Moffat, Jiangsu Jiawei, Vinod Cookware Industrial, Kitchen Equipment India
Quantitative Methodology
Primary survey, n=3,800 respondents, Q4 2025, six countries; demand-side model with trade association cross-validation
Qualitative Methodology
47 expert interviews, Q4 2025; applied to validate demand model assumptions, identify emerging dynamics, and assess competitive positioning
Report Format
PDF and XLSX data workbook (Word format preview document)
Publisher
Market Minds Advisory
Report Code
MMA-2026-CON-814
Published
September 2026
Contact
sales@marketmindsadvisory.com | www.marketmindsadvisory.com

Purchase the full Sheet Pan Racks Market Report (2026 to 2036).

The full report sizes the sheet pan racks market across six rack constructions, six end-use industries and six commercial dimensions for all seven global regions through 2036. It codes warranty claims by failing component rather than by product line, isolating how much service cost traces to casters against frames. Returns are traced to stated reasons including doorway clearance failures that specification never anticipated. Nesting floor area savings are measured against commercial kitchen rents in multiple urban markets. Competitive assessment covers 20 participants on a consistent manufacturer net revenue basis.
Warranty claims coded by failing component not product line
Returns traced to stated reasons including clearance failures
Nesting savings measured against urban commercial kitchen rents
Central kitchen specification criteria collected from operators
Six rack constructions sized through 2036
Twenty participants assessed on manufacturer net revenue

Built For The People Who Decide

From boardroom strategy to bench-side execution, this report is read cover-to-cover by leaders shaping the next decade of their industry, turning demand scenarios, market dynamics and valuation benchmarks into decisions.
CXOs/ Presidents/ VPs/ Managers
M&A and Corporate Development
Strategy Teams and R&D Heads
Procurement and Product Directors
Regulatory and Compliance Leaders
Investor Relations and Equity Analysts