Market Minds Advisory
Set-top Box Market

Set-top Box Market: Set-top Box Market: Operator Devices, Hybrid Streaming Boxes and Terrestrial Receivers, 2026 to 2036

Televisions made the box technically unnecessary years ago, and operators keep deploying them anyway. The device is the last place an operator controls the interface, the data, and the customer relationship.

Lead Analyst

Published

September 2026

Make Smarter Decisions with Customized Research Insights

Request a free sample report and evaluate market opportunities, growth trends, and competitive dynamics relevant to your business needs.

2025 MARKET VALUE$14.6BMarket Size 2025
2036 FORECAST VALUE$21.1BBase Case , 2026 to 2036
CAGR 2026 TO 20363.4 %Bull 4.6% / Bear 2.2%
INCREMENTAL OPPORTUNITY$6.0BNet 10- year value creation
EXPANSION MULTIPLE1.40x2036 value over 2026 base
Strategic Levers
M&A Pipeline
Regional Outlook
Country Rankings
Competitive Intelligence
Segmental Deep-dive
Call-Us : 91 93563 13602

Executive Snapshot and Market Trajectory.

Some 68% of households already own a television that runs applications, which makes the set-top box technically redundant in most homes. Operators supply 71% of boxes below cost anyway. They are protecting a subscription relationship, not selling hardware. Losing the interface means losing the customer, eventually.
Hybrid operator streaming devices grow at 5.1%, half again the market rate of 3.4%, as operators replace legacy receivers with boxes that carry streaming applications alongside broadcast channels. That keeps the operator interface in front of the viewer rather than conceding it. East Asia holds 29% of shipment value, on manufacturing concentration and domestic deployment volume arriving in the same region. Conceding the menu means conceding the relationship.
Five manufacturers hold 52% of shipment value in a category where average selling prices sit near USD 38 and unit volumes are flat at best in every mature market. The commercial argument that sustains it is retention: operators measure 3.2 points less churn where their own device is installed, and that difference funds hardware nobody would otherwise buy. Each cycle forces that argument again, and manufacturers feel every negative decision immediately. Volumes are flat.
Market Definition
This market covers set-top boxes and connected television receiving devices, including cable set-top boxes, satellite set-top boxes, internet protocol television and managed broadband boxes, hybrid operator streaming devices, retail streaming media players, and digital terrestrial free-to-air receivers. It excludes televisions with integrated application platforms, broadband modems and routers sold without video functions, conditional access and content protection software licensed separately, and video streaming subscription services.
Base Year Value
$14.6B in 2025 (MMA Primary Research Dataset, September 2026)
Forecast Period
2026 to 2036, eleven discrete annual values
CAGR
3.4% base case. Bull 4.6%. Bear 2.2%.
Fastest Growth Segment
Hybrid Operator Streaming Devices: 5.1% CAGR
Fastest Growth Country
India: 6.4% CAGR
Fastest Growth Region
South Asia and Pacific: 5.4% CAGR
Largest Region
East Asia: 29% of 2025 global value
Market Leaders
Sagemcom, CommScope, Skyworth, Humax, and ZTE lead the field. Source: MMA Primary Research Dataset, July 2026.
Primary Survey
n=3,800 procurement and R&D decision-makers, Q4 2025, six countries
Methodology
Demand-side build-up, cross-validated against public data, 47 expert interviews

Set-top Box Market Forecast Scenarios

set-top-box-market-size-forecast-scenario-1790007968863
Between 2020 and 2025 unit volumes fell in every mature market while average selling prices held up better than expected. Cable and satellite subscriber losses removed boxes from homes faster than replacement cycles added them, and the boxes that were deployed became more capable and more expensive. Historical growth of 2.4% nets falling volumes against rising specification, an uncomfortable combination for manufacturers.
The base case at 3.4% rests on three mechanisms. Operators continue replacing legacy receivers with hybrid devices that carry streaming applications, because conceding the interface to the television means conceding the customer. Digital terrestrial migration continues across parts of Africa, South Asia, and Latin America where analogue switch-off is incomplete. And broadband operators entering television distribution deploy managed devices to guarantee a service quality that open streaming cannot promise. None of the three describes a growing customer base.
The bull case at 4.6% depends on operators accelerating hybrid replacement to defend against television manufacturers building direct content relationships, which would compress a replacement cycle currently running six years. The bear case at 2.2% is capitulation: operators concluding that application distribution on smart televisions costs less than subsidised hardware, and abandoning the device rather than defending it.

Redundant Hardware Nobody Will Abandon

The technical case for this product disappeared some time ago. Around 68% of households own a television that runs applications perfectly well, and the operator's content is generally available through one of them. Operators keep deploying boxes because the box is where they control the interface, the recommendations, the data, and the moment a customer decides what to watch. That moment is the only position in the home worth owning.
TOP FIVE CONCENTRATION52%Share of shipment value held by the leading manufacturers
OPERATOR SUBSIDY SHARE71%Boxes supplied below cost to protect subscription revenue
AVERAGE SELLING PRICEUSD 38Delivered manufacturer price across all deployed box types
SMART TELEVISION PENETRATION68%Households owning a television with integrated application support
BOX DEPLOYMENT LIFE6 yearsMedian period a deployed operator box remains in service
CHURN DIFFERENCE WITH BOX3.2 pointsRetention advantage where an operator device is installed
That control is worth about 3.2 percentage points of churn, which is why 71% of boxes are supplied below cost. The hardware is a retention instrument rather than a product, and the manufacturers selling it are effectively suppliers to a marketing budget. Average selling prices near USD 38 reflect operators buying the cheapest device that does the job.
The awkward part is that the argument is a defensive one and everybody involved knows it. Each replacement cycle, running about six years, forces an operator to decide again whether subsidised hardware beats distributing an application to a television the customer already owns. Some have stopped deciding in the box's favour, and the manufacturers feel it immediately. Several have already decided against it permanently.
"This industry exists because operators are frightened of what happens when the customer opens the television's own menu instead of theirs. That fear is entirely rational and it is not a growth story. The manufacturers who understand they are selling churn reduction rather than hardware price better than the rest."
Practice Director, Broadcast and Video Distribution · MMA Technology Practice · September 2026

Market Trends

Hybrid Devices Defend The Operator Interface Directly

A box carrying both broadcast channels and streaming applications keeps the operator's menu in front of the viewer at the moment they choose what to watch, which is the only position in the home that matters commercially. Legacy receivers cannot do this, so replacement is defensive rather than aspirational. Hybrid operator devices grow at 5.1% on that logic. The operator is buying interface control rather than picture quality, and manufacturers who present specification improvements instead of retention evidence are answering a question nobody asked them. Retention evidence is what the buyer actually wants to see.
Market Impact: Funds 71% subsidised supply
Broadband Operators Deploy Boxes For Quality Guarantees

Telecommunications operators entering television distribution ship managed devices because an application on a customer's television cannot guarantee anything about the network path, and a complaint about buffering reaches the operator regardless of where the fault sits. A managed box lets them control buffering, error correction, and diagnostics end to end. Internet protocol television devices grow at 4.2% as broadband operators bundle video with connectivity, and this buyer specifies for supportability rather than for the lowest delivered unit price. A complaint about buffering reaches the operator regardless of where the fault genuinely sits, which is the whole argument.
Market Impact: Drives 6.4% Indian growth

Market Opportunities and Growth Drivers

Retention Difference Funds Hardware Nobody Would Buy

Operators measure roughly 3.2 percentage points less churn on subscribers with their own device installed, and that difference funds 71% of boxes being supplied below cost. The mechanism is behavioural rather than technical: a customer whose television opens to the operator's interface makes fewer decisions about alternatives. Manufacturers competing on component specification miss this entirely. The operators who buy most confidently are those who have measured the churn difference in their own base rather than accepting it as received industry wisdom. Received wisdom is a weak foundation for a subsidy this large.
Market Impact: Redundant in 68% of homes

Terrestrial Migration Continues Across Emerging Markets

Analogue switch-off remains incomplete across parts of Africa, South Asia, and Latin America, and each completed migration requires receivers in households that will not buy a new television to solve the problem. Indian growth of 6.4% leads every country covered, combining migration with hybrid replacement across the largest pay-television subscriber base anywhere. These are very low priced devices, frequently subsidised by government programmes, and they contribute far more to unit volumes than to the value of the market. Households will not buy a new television to solve a broadcast migration problem.
Market Impact: Caps prices near USD 38

Market Restraints and Challenges

Televisions Already Do What The Box Does

Around 68% of households own a television running applications, and the operator's own service is usually available through one of them, which removes any technical requirement for separate hardware. The root cause is that television manufacturers built application platforms to differentiate their products and succeeded. Commercially this leaves operators funding devices on a defensive argument that some have stopped accepting. Manufacturers respond by building the retention evidence operators need to justify continued deployment, and by supplying the application software when operators abandon hardware entirely. Television manufacturers built these platforms to differentiate products, and succeeded.
Market Impact: Segment grows at 5.1%

Subsidised Supply Caps Manufacturer Pricing Permanently

With 71% of boxes given away below cost, operators buy the cheapest device meeting their specification, and average selling prices near USD 38 reflect exactly that. The root cause is that the box is a marketing expense rather than a product with a customer. Commercially this leaves manufacturers competing on unit cost against a shrinking installed base with no route to premium positioning. Participants respond by supplying software and interface platforms alongside hardware, by pursuing broadband operators who specify for supportability, and by accepting the category as managed decline. Premium positioning is not available.
Market Impact: Segment grows at 4.2%
3 additional market trends, 4 additional growth drivers, and 2 additional restraints and challenges are covered in the full report. Contact sales@marketmindsadvisory.com to access the complete intelligence.

Segment CAGR and Growth Architecture

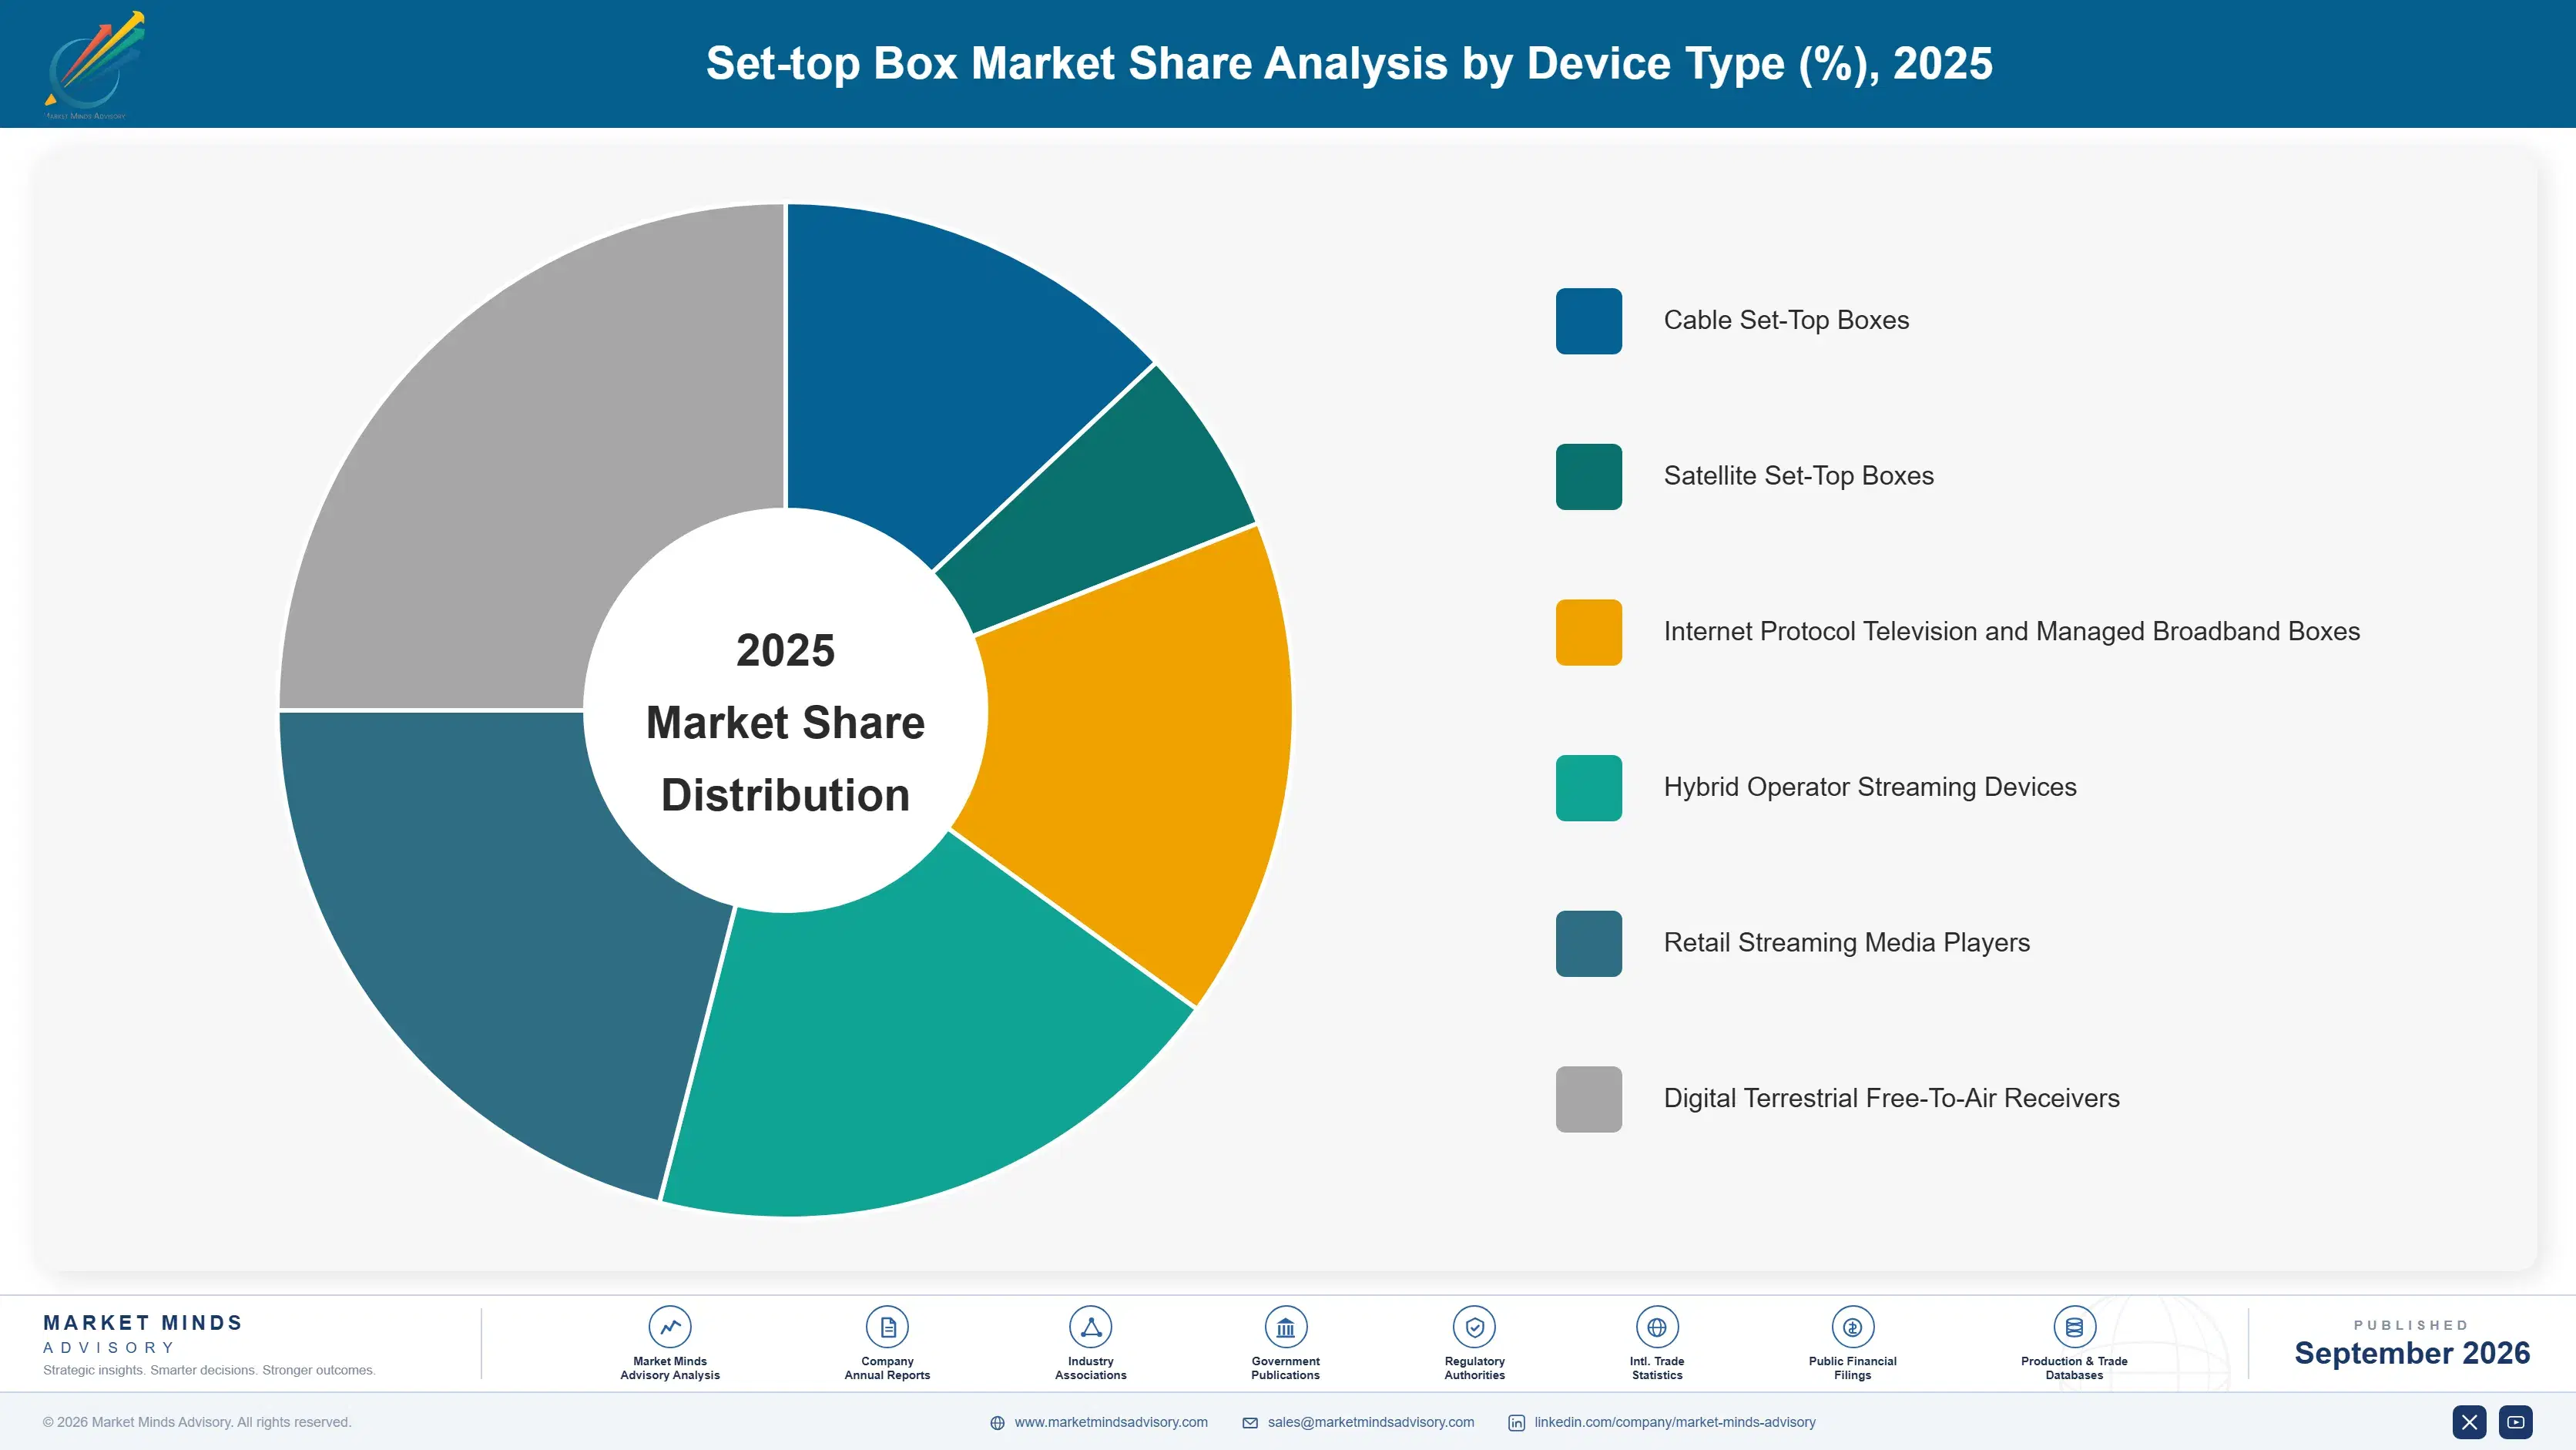
Segmentation follows device type and how it reaches the household. Six categories cover the market: cable set-top boxes, satellite set-top boxes, internet protocol television and managed broadband boxes, hybrid operator streaming devices, retail streaming media players, and digital terrestrial free-to-air receivers. Legacy cable and satellite volumes are in genuine decline. Hybrid replacement slows that decline without reversing it anywhere.
set-top-box-market-market-share-analysis-1790007969402

Hybrid Operator Streaming Devices

Hybrid devices grow at 5.1%, half again the market rate of 3.4%, and every deployment is a defensive decision rather than an expansion. A box carrying broadcast channels alongside streaming applications keeps the operator's interface in front of the viewer at the moment of choosing, which legacy receivers cannot do and which the television's own menu takes away entirely. Operators are buying interface control, measured in a churn difference of roughly 3.2 points, rather than any improvement in picture or capability. Manufacturers presenting component specification instead of retention evidence are answering a question the buyer never asked. Defence rather than growth explains every deployment. Nobody expands into this category deliberately.
CAGR 5.1%

Retail Streaming Media Players

Retail players grow at 4.6% on a completely different commercial logic from everything else here. The buyer is a household rather than an operator, and the manufacturer is not selling hardware at all but acquiring a platform user whose subsequent advertising and content revenue justifies pricing the device near cost. That model resembles the television manufacturers' own approach and competes directly against it. Volumes concentrate in markets with high streaming subscription penetration and older televisions, which is a shrinking combination as smart television ownership approaches saturation across mature markets. The device is priced near cost because the platform user is the actual product being acquired here. Smart television ownership keeps narrowing it.
CAGR 4.6%
Full segment breakdown across 6 segments available in the complete report.

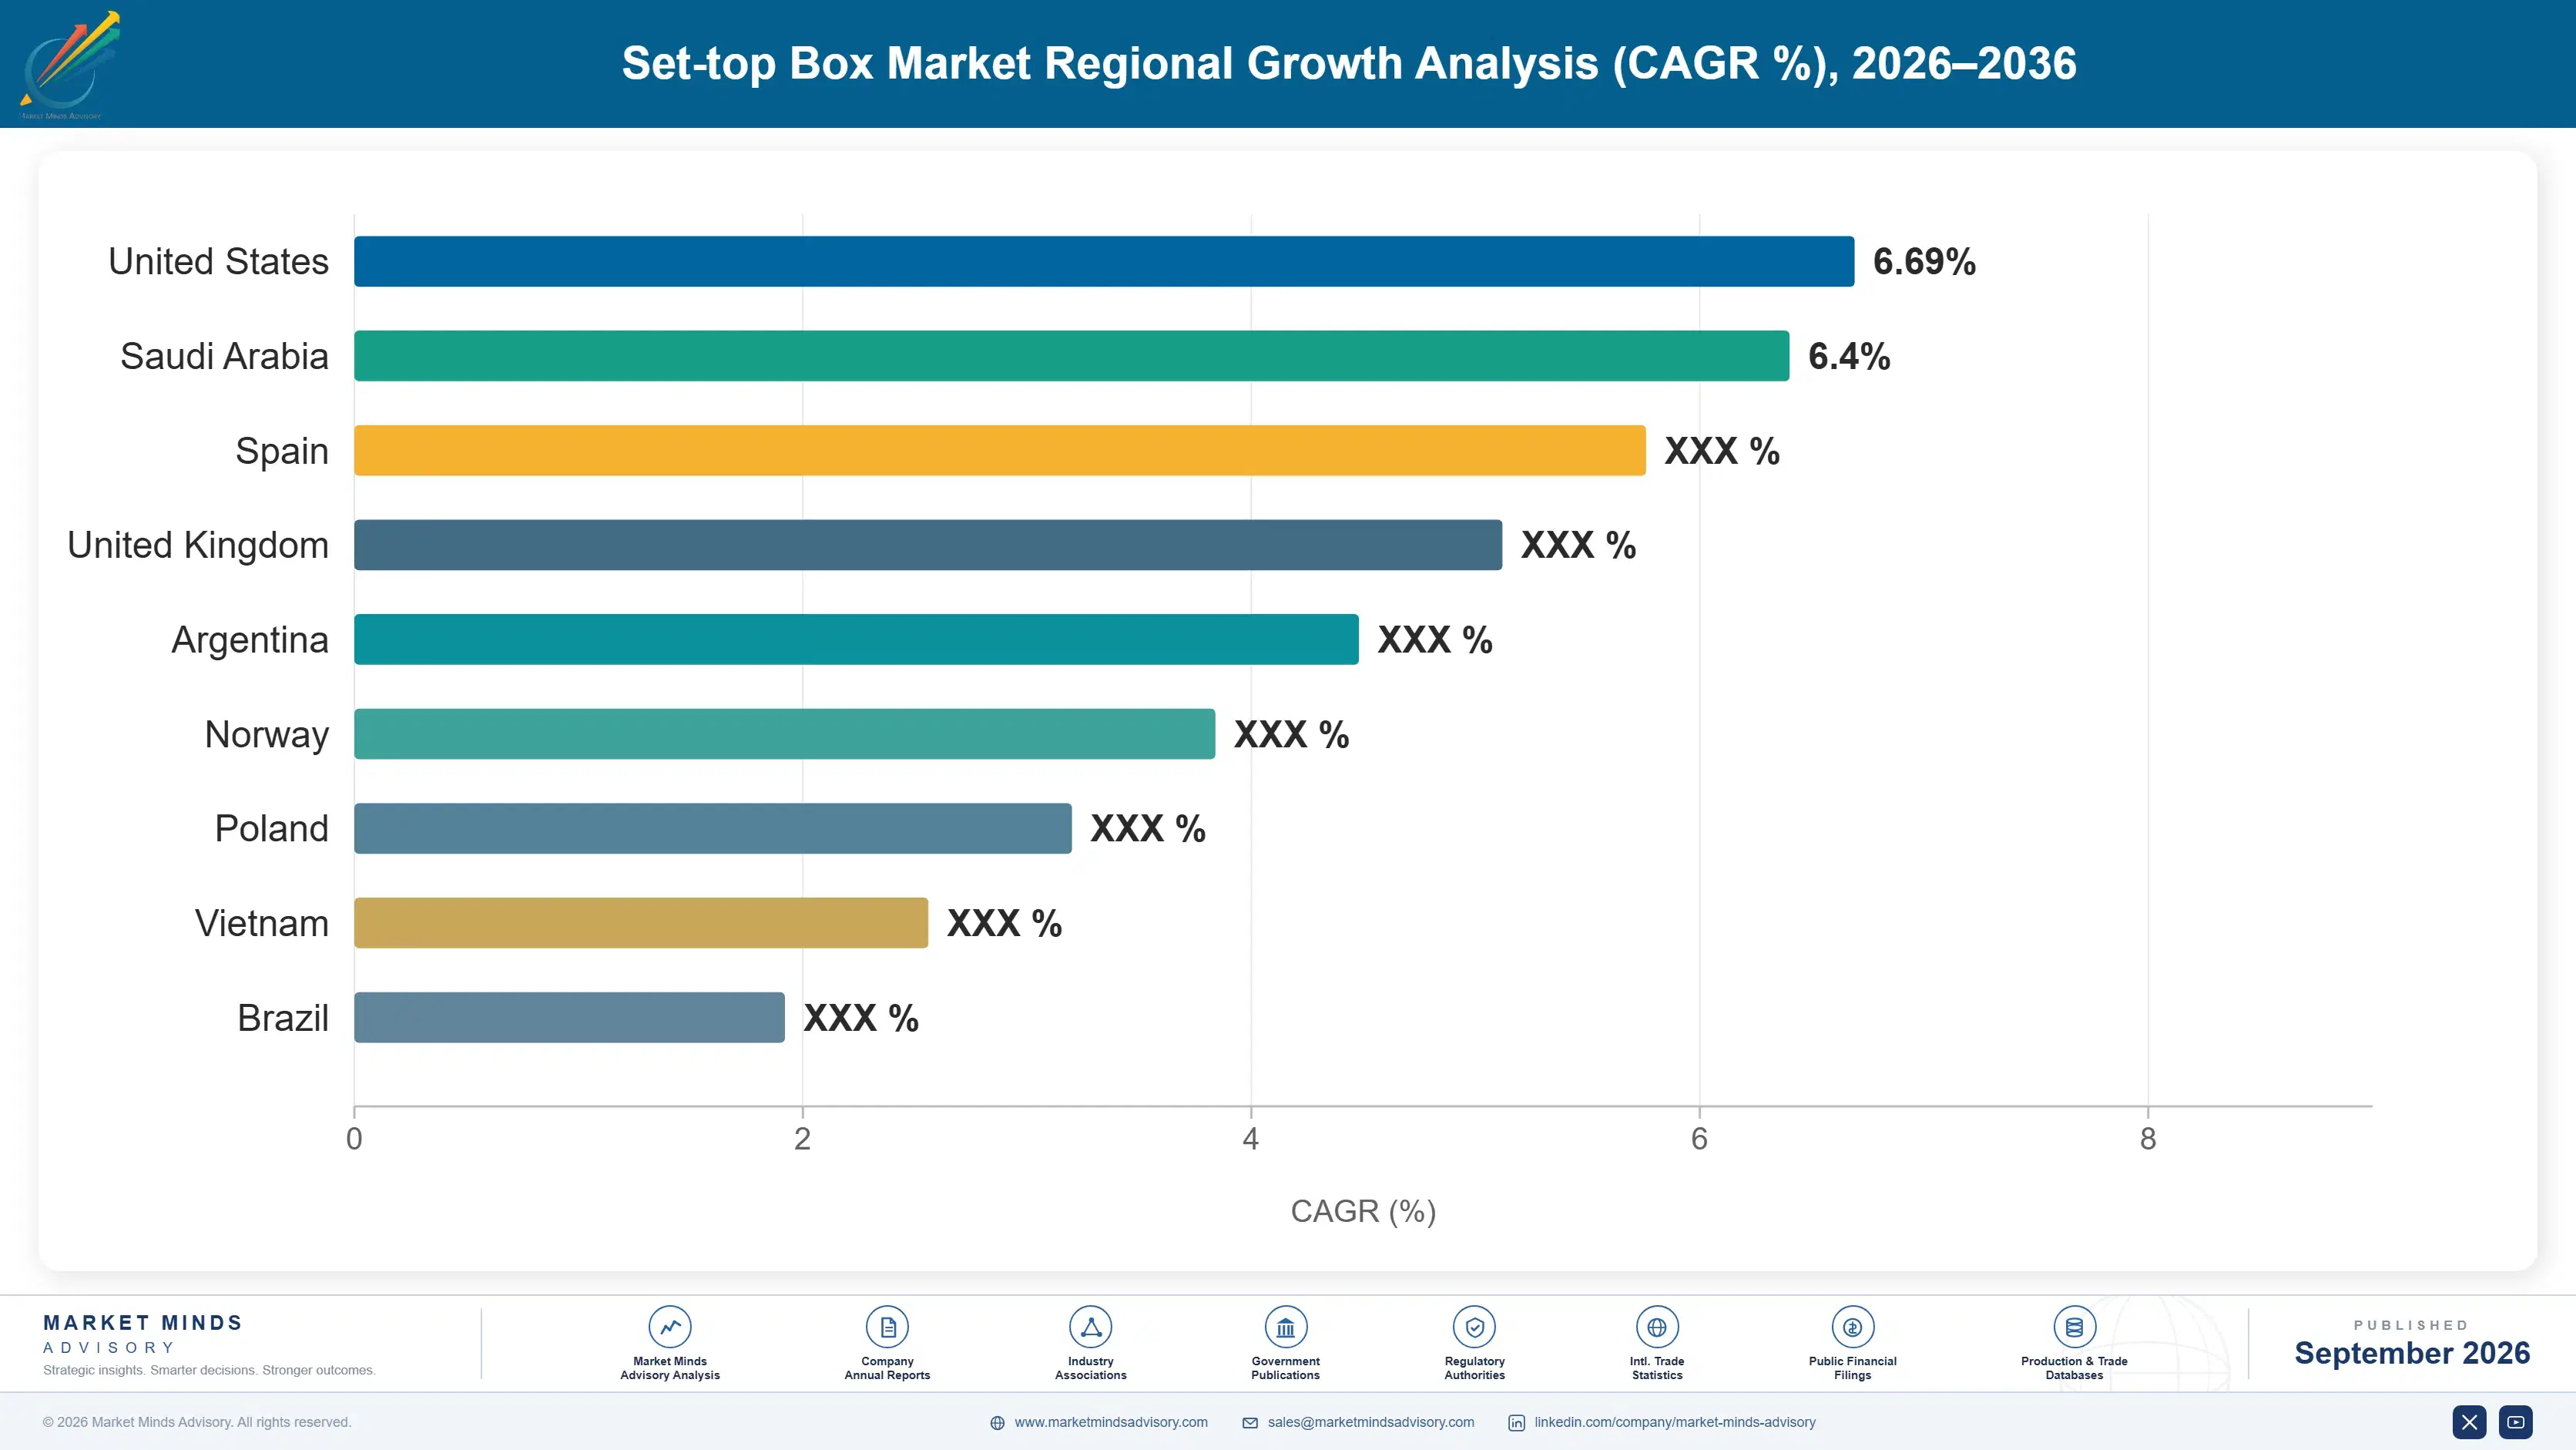
Regional Architecture and Country Demand Map

Regional shares reflect delivered shipment value, which follows subscriber base size and migration status rather than television market wealth. Deployment volume and device pricing pull in opposite directions across most of this table. Two regions fall outside the standard bands for exactly that reason. Read the shares accordingly.

East Asia

Manufacturing and deployment coincide here, which is why the region leads on shipment value without leading on subscriber spending. Chinese manufacturers supply most of the world's boxes while Chinese cable and internet protocol television operators deploy them at volumes nobody else approaches, generally at price points well beneath global averages. Japanese and Korean operators buy more capable devices for smaller subscriber bases. Growth of 4.3% runs above the world rate, driven by broadband operators bundling television with connectivity and by hybrid replacement across an ageing installed base. Chinese price points sit well beneath global averages, which suppresses the value share relative to units shipped. Broadband bundling drives the growth. Ageing bases need replacing.
Share: 29% | CAGR: 4.3% (2026 to 2036)

South Asia and Pacific

At 19% this region sits well above the standard band, and subscriber scale explains it entirely. India operates the largest pay-television subscriber base anywhere, and growth of 6.4% leads every country covered as operators replace legacy direct-to-home receivers with hybrid devices while terrestrial migration continues in parallel. Device prices are among the lowest globally, so unit volumes exceed what the value share suggests by a considerable margin. Australian deployment follows mature market patterns at very much smaller scale and with correspondingly higher specifications. Device prices are among the lowest anywhere, so unit volumes far exceed what the value share suggests. Australian deployment is far smaller. Specifications there run higher. Migration continues in parallel.
Share: 19% | CAGR: 5.4% (2026 to 2036)
Regional intelligence for 5 additional markets available in the complete report: North America, Western Europe, Latin America, Middle East and Africa, Eastern Europe. Contact sales@marketmindsadvisory.com.
set-top-box-market-country-cagr-analysis-1790007969914

How Manufacturers Defend Their Position

Four commercial moves matter in a category whose product is technically unnecessary and commercially subsidised. Each accepts that the operator is buying retention rather than hardware, and that competing on component specification against a marketing budget is a losing argument in every account. Competing on component specification against a marketing budget loses every time.

Supply Retention Evidence Alongside The Hardware

An operator deciding whether to keep deploying boxes needs a defensible number, and the 3.2 point churn difference is usually received industry wisdom rather than something they measured. Manufacturers running that analysis in the operator's own base, using their subscriber data, win renewals at roughly 2.6 times the rate of those quoting specifications. The work is analytical rather than engineering, and it converts a hardware negotiation into a business case discussion the manufacturer helped write. It converts a price negotiation into a business case the manufacturer helped write. Engineering has nothing to do with it.
Market Impact: Wins account renewals 2.6 times more often overall

Sell Interface Software Where Hardware Is Abandoned

Operators concluding that subsidised boxes cost more than they return still need an application on the customer's television, and that application has to be built, certified across manufacturers, and maintained. Manufacturers offering the software when the hardware relationship ends retain roughly 40% of the account revenue they would otherwise lose completely. It is a smaller business with better margin, and refusing to offer it simply hands the operator to somebody who will. Refusing to offer it hands the account to somebody who will. Better margin, smaller business. Somebody will supply it regardless.
Market Impact: Retains roughly 40% of the lost account revenue

Target Broadband Operators Specifying For Support

Telecommunications operators bundling video with connectivity buy managed devices to control buffering and diagnostics end to end, because a complaint reaches them whatever the actual fault. That buyer specifies for supportability rather than for lowest unit cost, which is the only segment in this market where a specification argument still wins. Manufacturers focusing here achieve average selling prices 55% to 80% above the category norm, on volumes that grow while cable and satellite deployment falls. Volumes there grow while cable and satellite deployment falls away. Specification arguments still work here.
Market Impact: Achieves prices 55% to 80% above category norm

Extend Deployment Life Rather Than Chasing Replacement

Boxes stay in service a median six years and operators would happily extend that, since every year avoided is capital not spent on hardware they resent buying. Manufacturers offering software update commitments and modular capability extension across longer lives win specification against cheaper competitors, and capture service revenue across the extended period. Those doing so report lifetime account value 30% to 45% higher despite shipping fewer units, which is an uncomfortable proposition for a manufacturing organisation to accept internally. Manufacturing organisations find this genuinely hard to accept internally. The customer wants exactly this.
Market Impact: Lifts lifetime account value by 30% to 45%

Who Controls the Margin Pool

Concentration is moderate and stable. Five manufacturers hold 52% of shipment value, measured consistently on that basis across all participants, and the field divides between European and Korean suppliers serving operator accounts on specification and Chinese manufacturers competing on delivered cost. The gap between the leader and the fifth is narrow, and it moves with individual operator contract awards rather than with any broader shift. Individual operator awards move the ranking more than anything else.
Competition currently turns on three things: evidence that deployment reduces churn measurably, software and interface capability that survives when hardware is abandoned, and supportability credentials for broadband operators bundling video. Component specification differentiates very little, since every credible manufacturer meets operator requirements at broadly comparable cost. Every credible manufacturer meets operator requirements at comparable cost.

Pressure comes from two directions. Television manufacturers are building direct content relationships that remove the operator interface entirely. Meanwhile retail streaming players compete for the same household position with platform economics that hardware manufacturers cannot match. Rankings will shift toward suppliers who sell software as readily as boxes, since that is where operator spending is heading. Operator spending is heading toward software rather than hardware.
set-top-box-market-company-positioning-matrix-1790007970443

Competitive Moat and Risk Dimensions

SAGEMCOM

Moat: European Operator Relationship Depth

Long-established relationships with European satellite, cable, and broadband operators, combined with integration experience across their specific conditional access and interface requirements, make replacement expensive in accounts where deployment spans millions of households. Those operators have defended the box more determinedly than any others, which suits the position well.
SAGEMCOM

Risk: Regional Concentration And Decline

European subscriber bases are contracting and hybrid replacement slows that without reversing it, so the strongest relationships sit in the slowest growing region of the seven. Expanding into Asian volume markets means competing against manufacturers whose cost position is built on domestic component supply and far larger production runs.
SKYWORTH

Moat: Cost Position And Volume Scale

Vertical manufacturing and enormous domestic production volume produce a delivered cost position that operators buying subsidised hardware value above almost anything else. In a category where 71% of boxes are given away and average selling prices sit near USD 38, being cheapest at an acceptable specification is a genuinely powerful position.
SKYWORTH

Risk: Software And Interface Depth

Operator spending is migrating toward interface software and application platforms that survive when hardware deployment ends, and that capability is not built through manufacturing scale. Competing there requires software organisations and operator integration experience that a cost-led manufacturer has limited history of developing internally. Manufacturing scale does not produce it.

Players Tracked

Prominent Players

Sagemcom
CommScope
Skyworth
Humax
ZTE

Other Key Players

Huawei
Amazon
Roku
Google
Apple
Xiaomi
Coship
Jiuzhou
SEI Robotics
Kaonmedia
EchoStar
Dish TV India
Askey
Arcadyan
Vestel

Recent Developments

FEBRUARY 2026

Sagemcom Awarded Hybrid Device Contract By European Satellite Operator

Sagemcom was selected to supply hybrid devices carrying broadcast channels alongside streaming applications for a European satellite operator, with the award justified internally on measured churn reduction rather than on any hardware specification comparison. Deployment covers several million households across two national markets. Replacement runs across four years.
Signal: Retention evidence rather than component specification is now deciding operator hardware awards outright right across Europe.
SEPTEMBER 2025

Skyworth Signs Supply Agreement With Indian Distribution Operator

Skyworth entered a multi-year supply agreement covering hybrid device replacement across an Indian direct-to-home operator's subscriber base, at delivered price points that European and Korean manufacturers declined to match on the volumes involved. Volumes run into the tens of millions across the agreement term. Delivery began immediately.
Signal: Cost position decides Asian volume awards, where subsidised deployment leaves no room for any specification premium.
MAY 2025

Humax Extends Interface Software Offer To Operators Without Hardware

Humax extended its interface and application software offering to operators distributing directly to smart televisions rather than deploying boxes, retaining a commercial relationship with accounts that had ended hardware procurement entirely. Certification across television manufacturers forms part of the scope. Maintenance and updates are included across the term.
Signal: Manufacturers are now selling software into accounts where their own hardware business has already disappeared entirely.

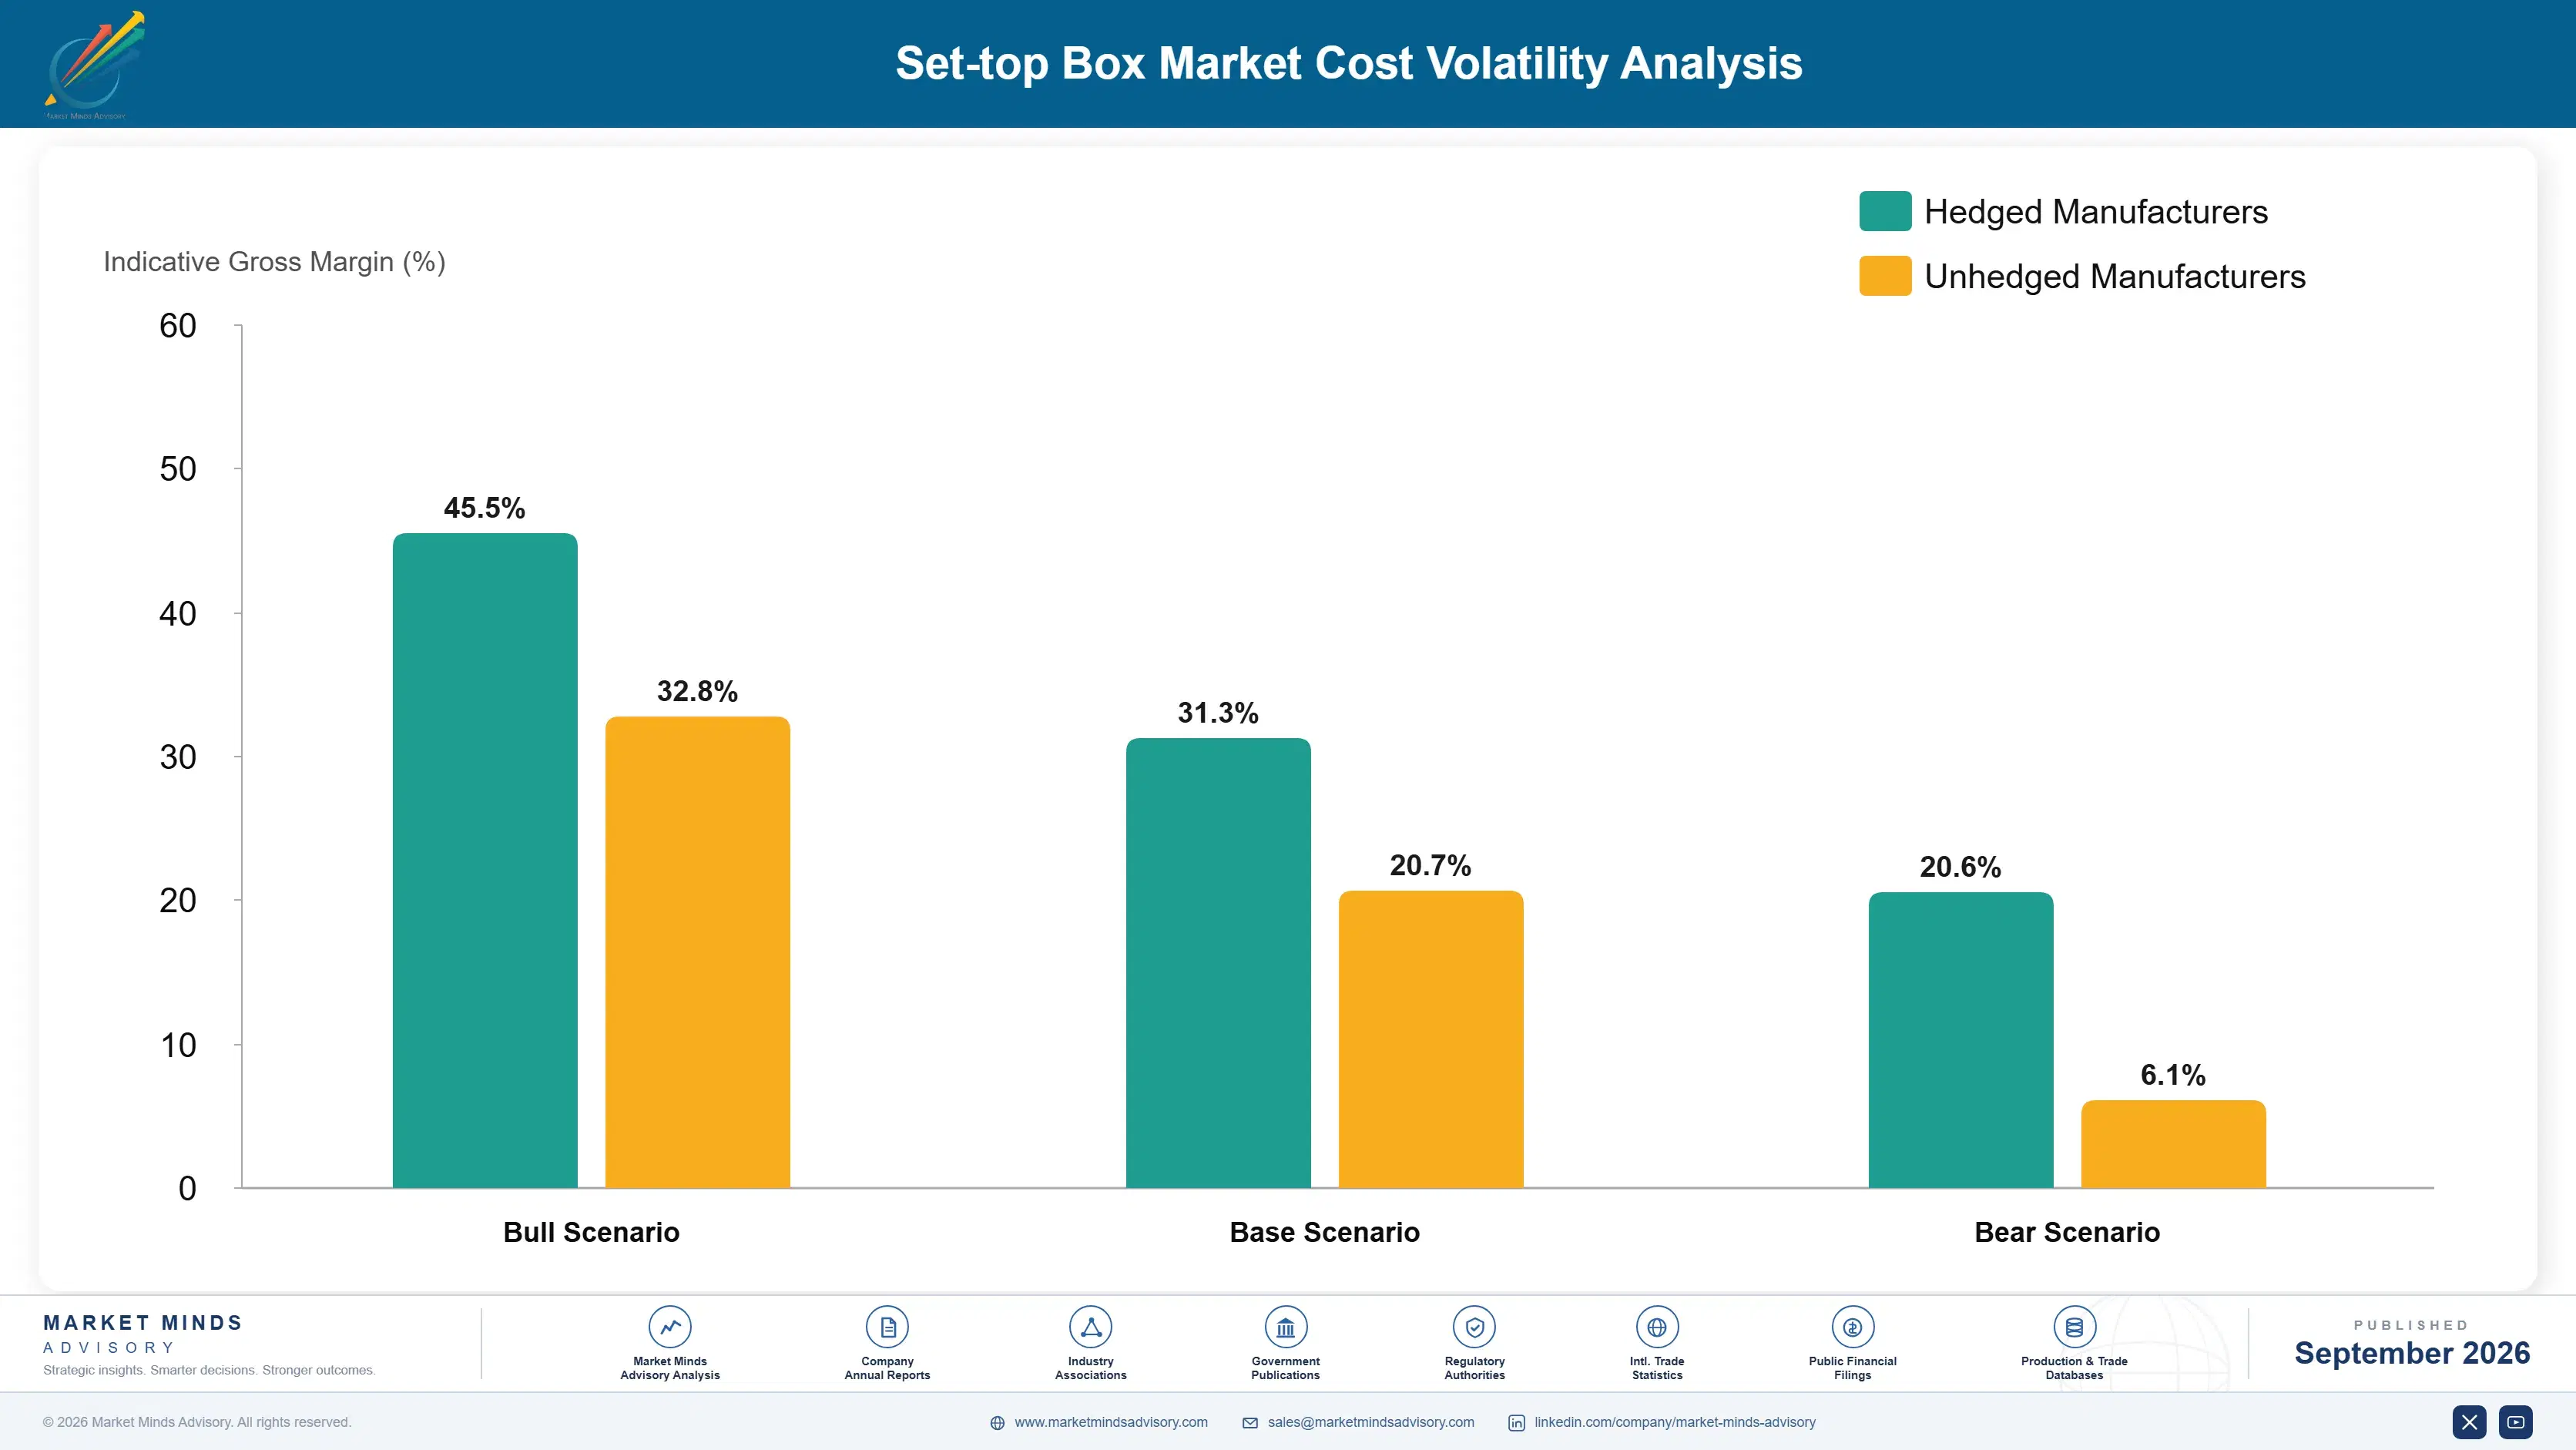
What Building A Box Costs

Three inputs dominate manufacturing cost. System on chip processors and memory run 38% to 46% of cost of goods sold, which is unusually concentrated for a consumer device. Tuners, radio frequency components, and power supplies take 16% to 22%. Enclosures, assembly, packaging, and logistics add a further 14% to 20%. Against selling prices near USD 38 there is little room between inputs and delivered price.
Memory pricing rose sharply through 2024 and 2025 as demand from artificial intelligence infrastructure absorbed supply, and several manufacturers described the resulting margin pressure in their annual reports for those years. Operators buying subsidised hardware resisted price increases almost entirely, so manufacturers absorbed the movement or reduced specification, and most did some of both across their product ranges. Most manufacturers did some of both. Specification reductions followed across ranges.

The competitive disadvantage mechanism runs through component sourcing rather than through assembly. A manufacturer buying processors and memory at merchant prices competes against vertically integrated producers with domestic supply relationships and far larger volumes. Exposure varies by manufacturer type. Chinese producers source domestically at scale. European and Korean manufacturers buy at market prices and defend position on integration and software rather than on delivered cost.
set-top-box-market-cost-volatility-analysis-1790007970641

Standardise Platforms Across Operator Variants

Operators specify conditional access, interface, and connectivity differently, which multiplies engineering and inventory if each is treated as a separate product. A common hardware platform with software differentiation spreads component volume and qualification cost across every variant, and manufacturers who did this report meaningfully better purchasing terms on the dominant components. Inventory complexity falls sharply.

Move Value Into Software And Interface Licensing

Against a delivered price near USD 38 with components taking most of it, hardware margin has very little room to improve. Software and interface licensing carries no component cost at all, and it survives in accounts where the operator eventually abandons hardware, which makes it the only revenue in this category with a future.

Design For Extended Deployment Rather Than Replacement

Operators keep boxes in service a median six years and want longer, since replacement is capital they resent spending. Designing for software update across a longer life wins specification and earns service revenue over the extended period, which offsets shipping fewer units and aligns the manufacturer with what the customer actually wants. Customer and manufacturer interests finally align.

Portfolio Architecture for Margin Defence

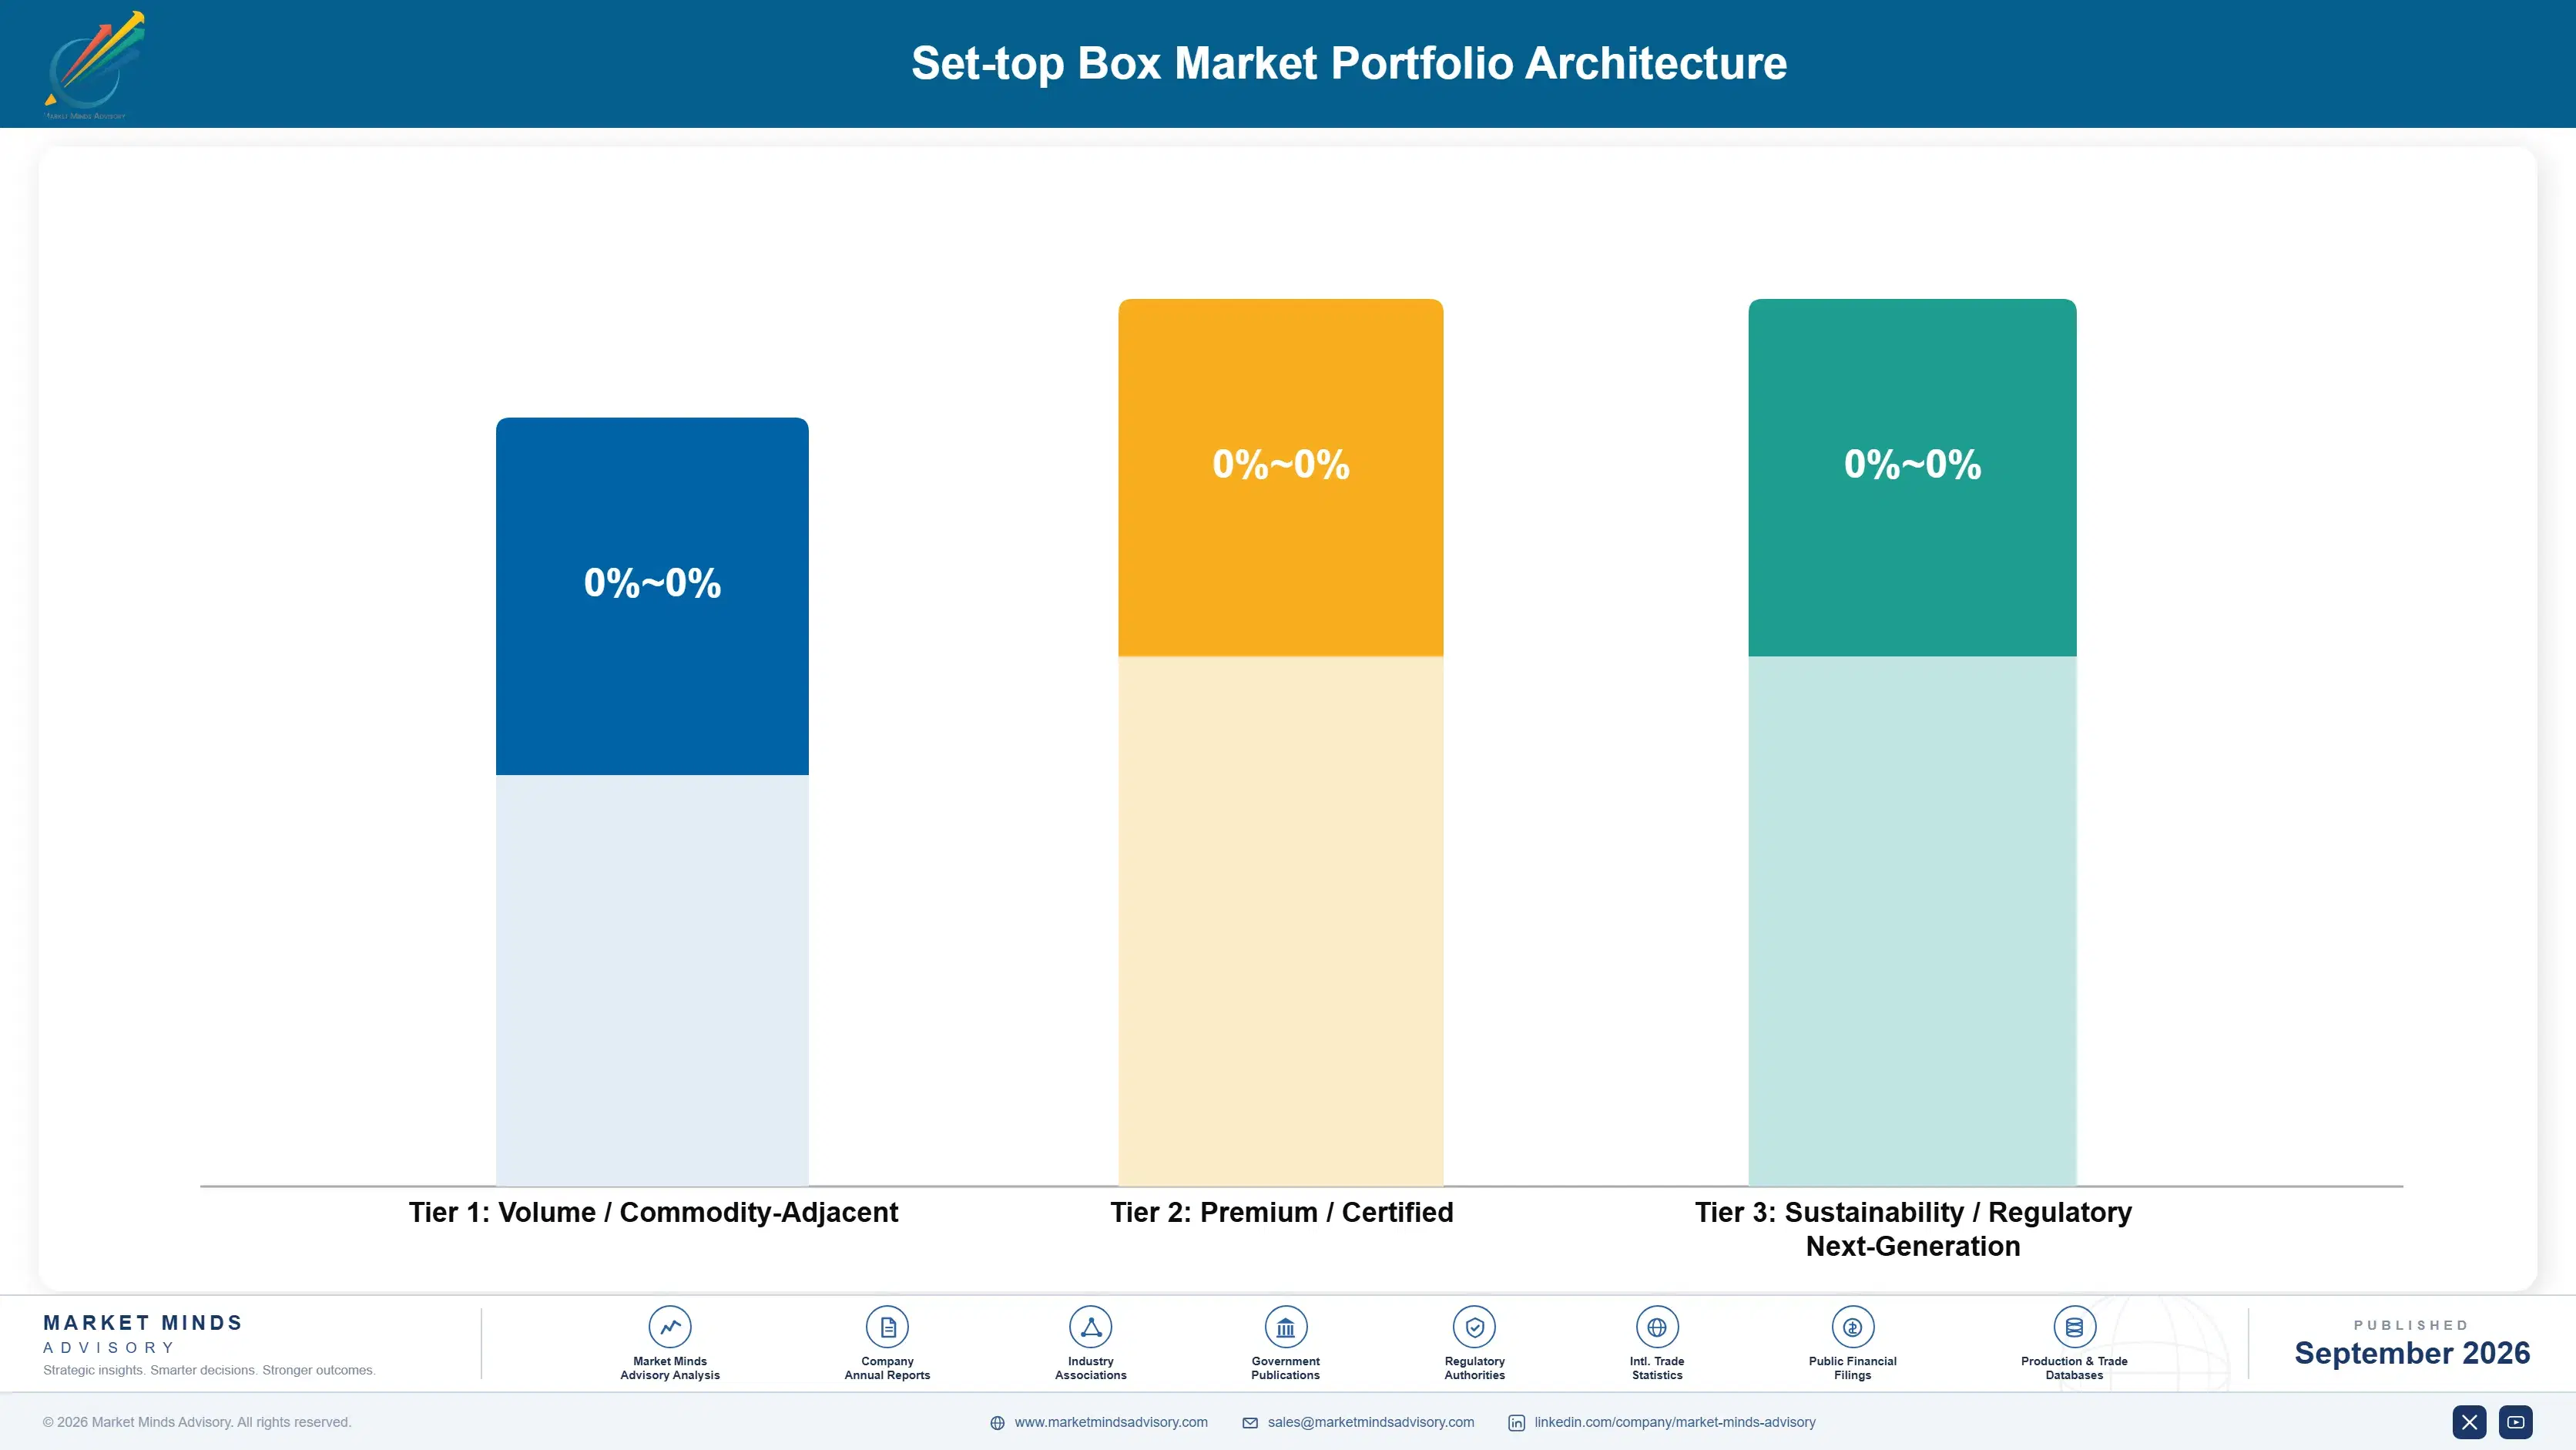
Margin follows how far the revenue sits from subsidised hardware. Cable, satellite, and terrestrial receivers are close to pure commodity, bought on delivered cost by operators giving them away, with components consuming most of a price near USD 38. Managed broadband devices earn better where supportability rather than price decides. Interface software and application licensing earn most, because no component cost applies and the revenue survives hardware abandonment.
The tension between volume and premium is severe because volume is disappearing. Legacy cable and satellite shipments still represent most units and the worst economics, and chasing them against vertically integrated Asian producers destroys margin. Software and broadband operator work carries far better economics on volumes too small to sustain a large manufacturing footprint, which is the central difficulty of the category.

High-value pools concentrate where the buyer is not simply minimising unit cost: broadband operators specifying for supportability, hybrid deployments justified on measured retention, and interface software in accounts abandoning hardware. These share a buyer with something specific to protect. Everywhere else the box is a marketing expense, and marketing expenses are negotiated hard every single year.

Volume / Commodity-Adjacent

Cable, satellite, and terrestrial receivers bought purely on delivered cost by operators supplying them below cost to subscribers. Components consume most of a price near USD 38. The nine-point range reflects whether the manufacturer sources components domestically or at merchant prices.
Gross Margin: 8% to 17%

Premium / Certified

Managed broadband devices and hybrid operator boxes where supportability, integration, and interface capability influence selection alongside price. The ten-point range separates manufacturers with common hardware platforms across operator variants from those engineering each account separately.
Gross Margin: 22% to 32%

Sustainability / Regulatory / Next-Generation

Interface software, application platforms, and extended lifecycle service revenue carrying no component cost and surviving hardware abandonment. The fourteen-point range reflects how differently manufacturers have priced software in accounts where they previously earned only on devices.
Gross Margin: 48% to 62%
set-top-box-market-portfolio-architecture-1790007971154

High-value Sub-segments and Strategic Watch-out

Interface And Application Software

Highest value in the category and the only revenue that survives an operator abandoning hardware entirely. No component cost applies at all. The fourteen-point range reflects wide variation in how manufacturers price software into accounts where they previously supplied only devices. Margin is genuinely software grade.
Gross Margin: 50% to 64%

Managed Broadband Operator Devices

Growing at 4.2% as telecommunications operators bundle video with connectivity and specify for supportability rather than lowest unit cost. Average selling prices run well above category norms. This is the only segment where a specification argument still wins an award outright. Diagnostic control is the argument.
Gross Margin: 24% to 34%

Hybrid Operator Replacement Devices

Fastest growth at 5.1% on defensive replacement of legacy receivers, justified by roughly 3.2 points of churn difference rather than any capability improvement. Retention evidence decides awards. The ten-point range separates platform standardised manufacturers from those engineering per operator. Each cycle is re-argued afresh. Nothing is settled.
Gross Margin: 18% to 28%

Legacy Cable And Satellite Receivers

The strategic watch-out. Unit volumes fall in every mature market, operators buy purely on delivered cost, and vertically integrated Asian producers hold the cost position. The nine-point range reflects component sourcing differences that do not change the underlying commercial trajectory at all. Decline is permanent here.
Gross Margin: 6% to 15%

What Keeps Operators Deploying

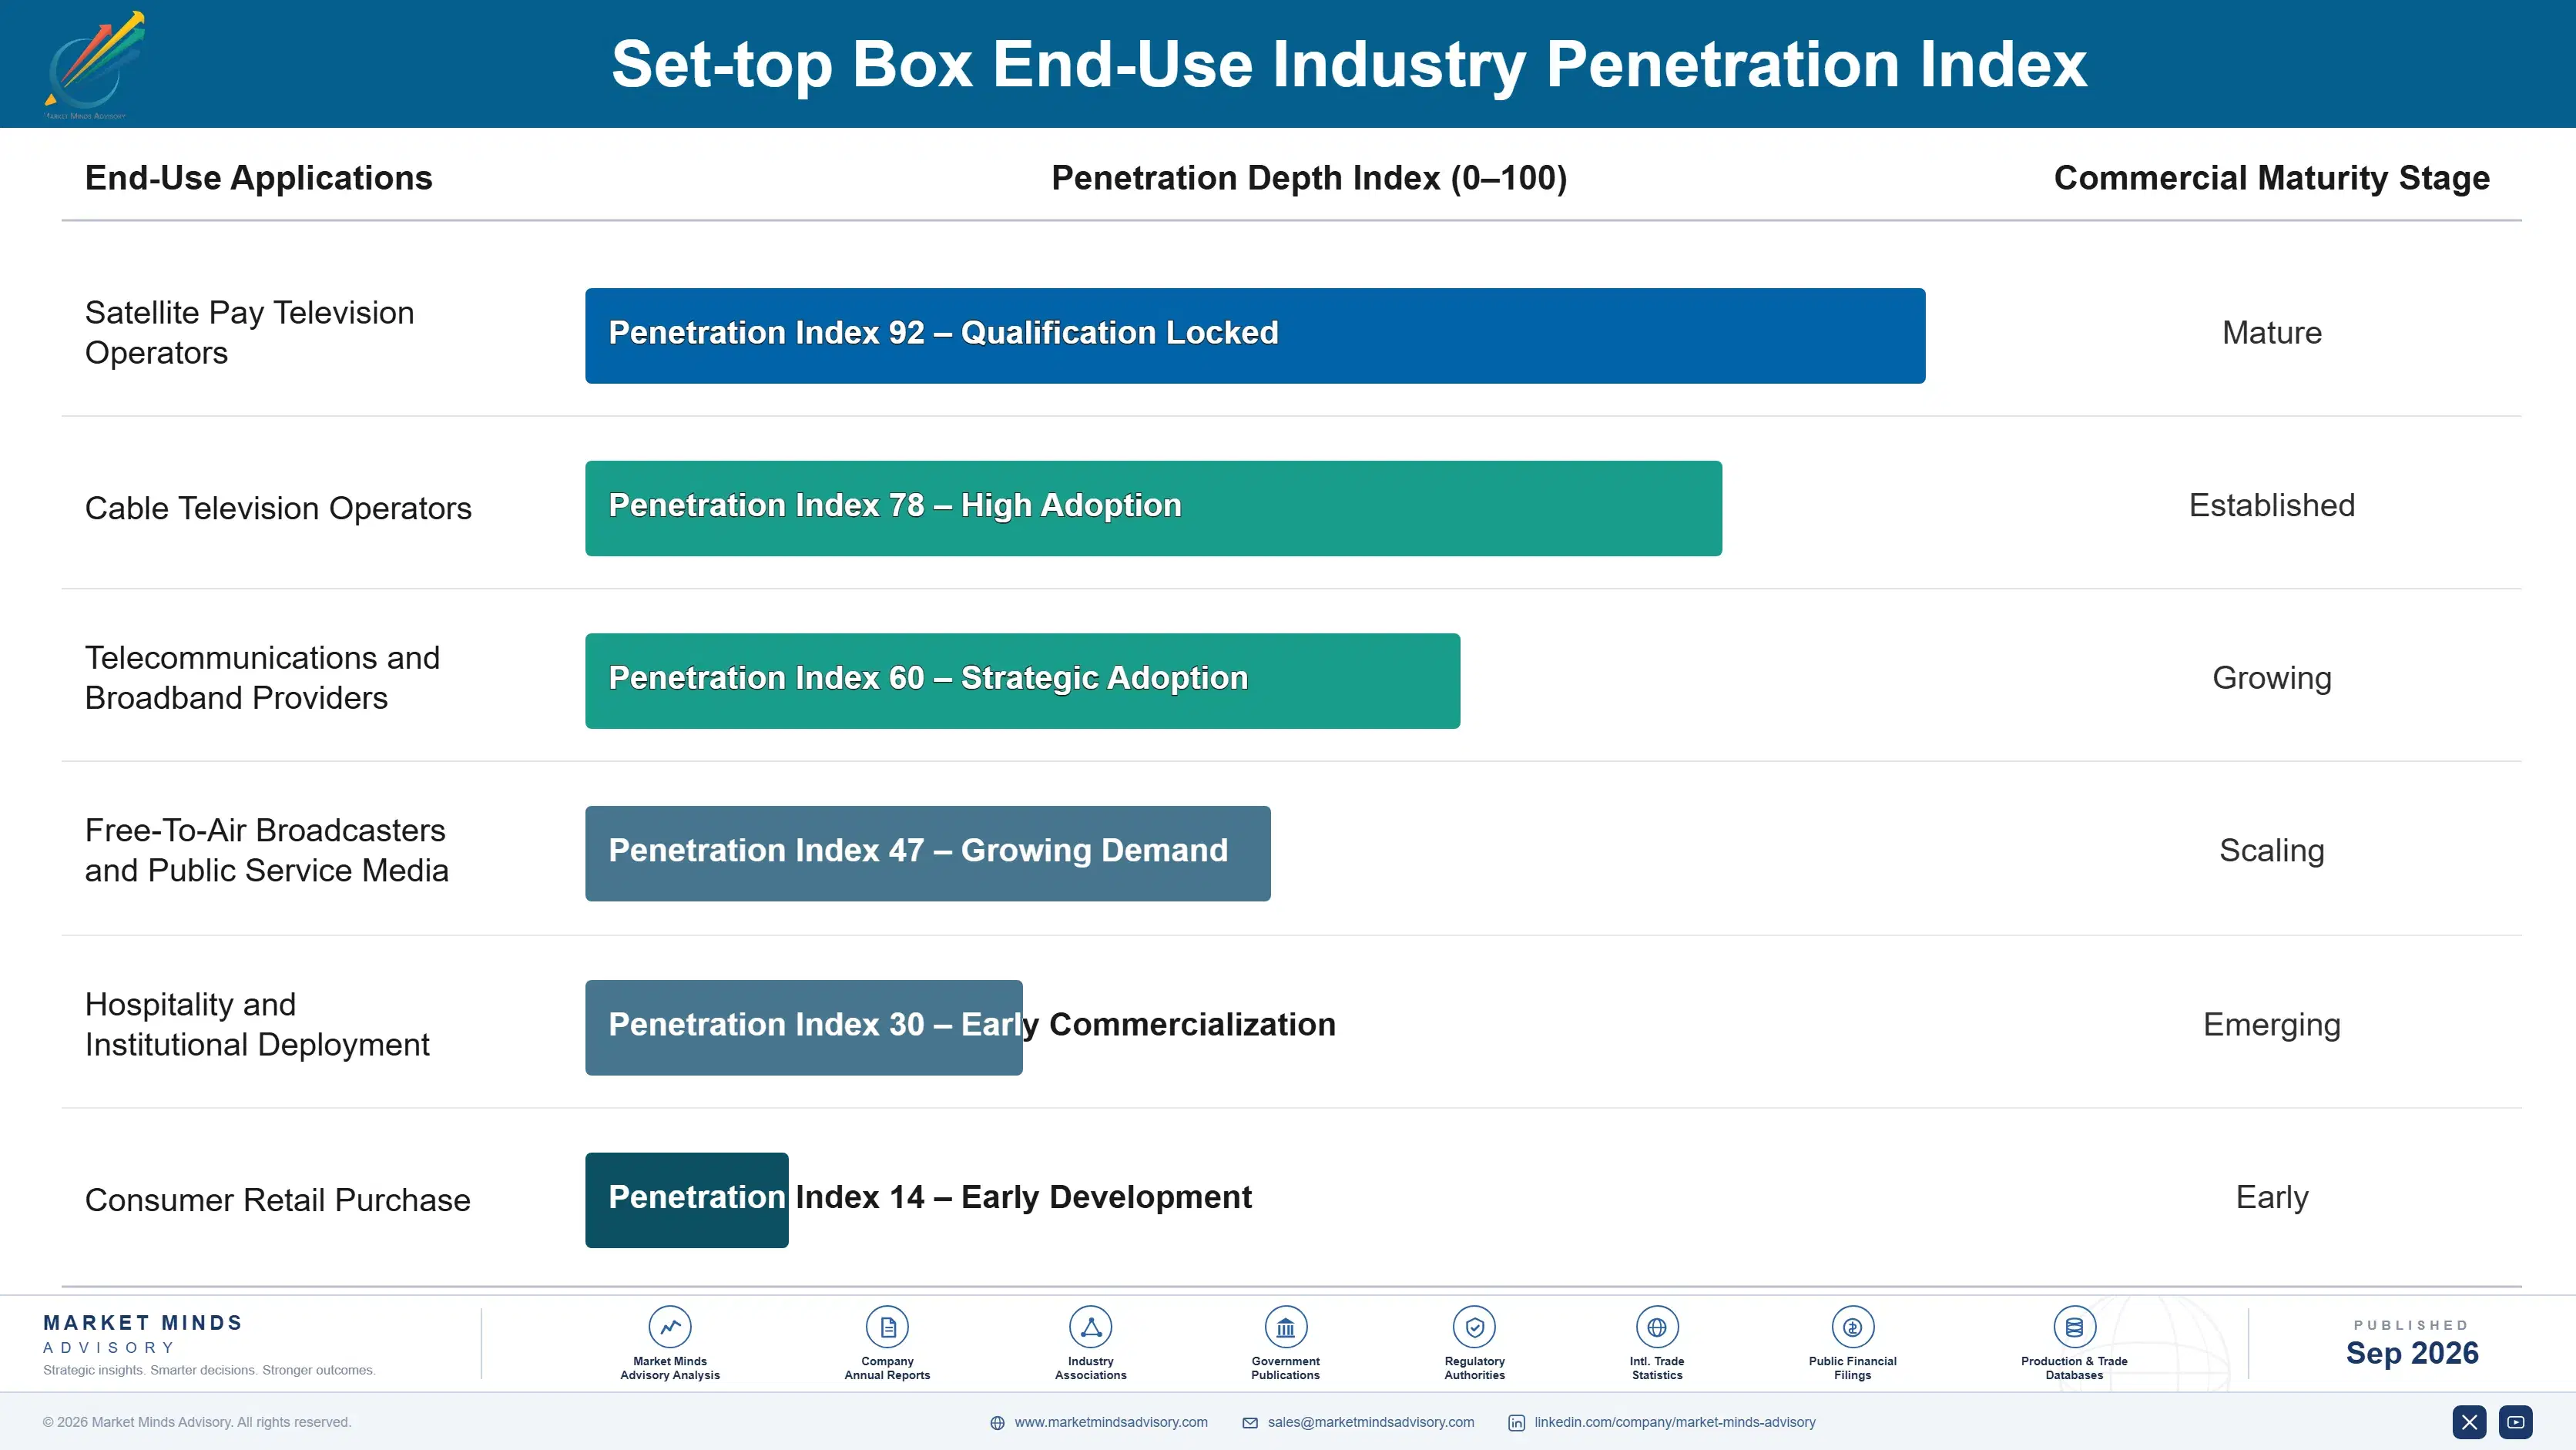
Demand recurs through replacement cycles running about six years, and each cycle forces an operator to decide again whether subsidised hardware beats distributing an application to a television the customer already owns. That is not an annuity in any comfortable sense. It is a defended position that has to be re-argued periodically, and manufacturers who supply the argument rather than only the hardware are the ones who keep winning it.
Commitment depth varies sharply by operator type. Satellite operators embed most deeply, since their conditional access and distribution model genuinely requires dedicated hardware in many households. Cable operators are less committed and several have moved to application distribution. Broadband operators are the most durable buyers, because managed devices give them diagnostic control over a service they are held responsible for regardless of fault.

The decision maker has moved upward and away from engineering. Device specification teams once selected boxes on technical merit and still evaluate. Finance and subscriber operations now decide whether to deploy at all, weighing subsidy cost against measured churn difference, and they are unmoved by capability arguments. Manufacturers selling to engineering are addressing people who no longer control whether the purchase happens.
set-top-box-market-end-use-penetration-index-1790007971653

Where This Market Rewards

These are among the four positions where our research anticipates prominent divergence between winners and laggards over the coming forecast period. Each is grounded in the demand model, the regulatory perimeter, and the announced capacity pipeline.
01 / RETENTION CASE CONSTRUCTION

Sell the churn number, not the hardware specification

Operators supply 71% of boxes below cost and justify it on roughly 3.2 points of churn difference, which most of them treat as received industry wisdom rather than something measured in their own subscriber base. Manufacturers running that analysis using the operator's data win renewals about 2.6 times more often than those quoting specifications. The work is analytical rather than engineering, and it converts a price negotiation into a business case the manufacturer helped write, and one they will defend internally afterwards.
02 / SOFTWARE CONTINUITY PLANNING

Follow the account when the hardware ends

An operator concluding that subsidised boxes cost more than they return still needs an application built, certified across television manufacturers, and maintained, and somebody will supply it. Manufacturers offering interface software when hardware procurement ends retain roughly 40% of account revenue they would otherwise lose entirely. It is a smaller business with far better margin, and declining to offer it simply hands the relationship to a competitor who will, and that competitor keeps the relationship permanently, along with everything that follows from it.
03 / SUPPORTABILITY BUYER FOCUS

Broadband operators still buy on capability

Telecommunications operators bundling video with connectivity deploy managed devices to control buffering and diagnostics end to end, because a complaint reaches them whatever the actual fault turns out to be. That buyer specifies for supportability rather than lowest unit cost, which makes it the only segment where a technical argument still wins. Manufacturers focusing there achieve selling prices 55% to 80% above category norms on volumes that are growing, against category volumes that are falling everywhere else year after year.
04 / LIFECYCLE ALIGNMENT STRATEGY

Longer deployment beats chasing faster replacement

Boxes remain in service a median six years and operators would extend that gladly, since every avoided replacement is capital not spent on hardware they resent buying in the first place. Manufacturers offering update commitments and modular capability extension win specification against cheaper competitors and capture service revenue across the longer period. Lifetime account value rises 30% to 45% despite shipping fewer units, which manufacturing organisations find genuinely difficult to accept, since fewer units is not what a factory wants to hear.

Engagement Snapshot From the Field

A live engagement with an industry participant carrying material or product regulatory and market exposure ahead of a defining policy shift, showing how our research translates into a defensible multi-year portfolio strategy.
MARKET MINDS ADVISORY · CLIENT ENGAGEMENT SUMMARY
Set-top Box Producer Strategic Portfolio Review and Transition Roadmap 2026·Investment Scenario on Set-top Box Exposure Evaluation 2025-26
CLIENT PROFILE
A European pay-television operator serving approximately 4.6 million subscribers across satellite and broadband delivery, with annual customer premises equipment spending near USD 210 million (client-reported, unverified by MMA). Deployment policy had not been reviewed in seven years, and finance had begun questioning whether subsidised hardware still justified its cost against smart television distribution. The quoted churn figure came from an industry publication.
STRATEGIC CHALLENGE
Marketing asserted that the operator device reduced churn materially while finance could not find the analysis supporting it, and the figure being quoted internally came from an industry publication rather than from the operator's own data. A decision on the next replacement cycle covering 1.8 million households was due within two quarters.
MMA APPROACH
MMA measured churn across matched subscriber cohorts with and without an operator device installed, controlling for tenure, package, and delivery method, and modelled deployment cost against retained revenue over the replacement cycle. Application distribution to smart televisions was assessed as an alternative on both cost and measured retention grounds. Cohorts were matched on tenure and package.
KEY FINDINGS
  1. The measured churn difference was 2.4 percentage points rather than the 3.2 points quoted internally, and it varied enormously between satellite and broadband delivered subscribers.
  2. Among broadband subscribers under three years tenure the device made no measurable retention difference at all, and those households accounted for 31% of the planned deployment.
  3. Satellite subscribers showed a 4.1 point difference, well above the assumed figure, concentrated among households with no reliable broadband alternative available to them.
  4. Application distribution to smart televisions would cost roughly a seventh of hardware deployment while retaining most of the interface control the operator was actually paying for.
CLIENT PROFILE
A European pay-television operator serving approximately 4.6 million subscribers across satellite and broadband delivery, with annual customer premises equipment spending near USD 210 million (client-reported, unverified by MMA). Deployment policy had not been reviewed in seven years, and finance had begun questioning whether subsidised hardware still justified its cost against smart television distribution. The quoted churn figure came from an industry publication.
STRATEGIC CHALLENGE
Marketing asserted that the operator device reduced churn materially while finance could not find the analysis supporting it, and the figure being quoted internally came from an industry publication rather than from the operator's own data. A decision on the next replacement cycle covering 1.8 million households was due within two quarters.
MMA APPROACH
MMA measured churn across matched subscriber cohorts with and without an operator device installed, controlling for tenure, package, and delivery method, and modelled deployment cost against retained revenue over the replacement cycle. Application distribution to smart televisions was assessed as an alternative on both cost and measured retention grounds. Cohorts were matched on tenure and package.
KEY FINDINGS
  1. The measured churn difference was 2.4 percentage points rather than the 3.2 points quoted internally, and it varied enormously between satellite and broadband delivered subscribers.
  2. Among broadband subscribers under three years tenure the device made no measurable retention difference at all, and those households accounted for 31% of the planned deployment.
  3. Satellite subscribers showed a 4.1 point difference, well above the assumed figure, concentrated among households with no reliable broadband alternative available to them.
  4. Application distribution to smart televisions would cost roughly a seventh of hardware deployment while retaining most of the interface control the operator was actually paying for.
RECOMMENDED STRATEGY
Phase 1: Phase one: continue full hardware deployment to satellite subscribers, where the measured retention difference substantially exceeds the assumed figure and justifies the subsidy. Phase 2: Phase two: move broadband subscribers under three years tenure to application distribution, avoiding hardware cost where no measurable retention benefit exists at all. Phase 3: Phase three: negotiate extended software support on deployed devices to lengthen the replacement cycle beyond six years across the retained hardware base.
OUTCOME
Planned equipment spending for the cycle fell 34% while blended churn was unchanged after twelve months (client-reported, unverified by MMA). Satellite deployment continued at full scale on evidence the operator now owns. The supplier that produced the cohort analysis retained the account through the review.

Frequently Asked Questions

Foundational context covering the market sizes, CAGR, scope, country, region and competition that inform every finding below. This section is provided to cover basics and most often pre-purchase conversations, answered from the MMA Primary Research Dataset.

What is the current size of the Set-top Box Market?

The market was worth USD 14.6 billion in 2025 and reaches USD 15.1 billion in 2026. Value covers delivered manufacturer shipments of receiving devices across all types.

How large will the Set-top Box Market be by 2036?

MMA forecasts USD 21.1 billion by 2036, an increase of USD 6.0 billion across the forecast period. That represents 1.40 times the 2026 base of USD 15.1 billion.

What is the CAGR for the Set-top Box Market 2026 to 2036?

The base case compound annual growth rate is 3.4%, with a bull case at 4.6% and a bear case at 2.2%. Historical growth from 2020 to 2025 ran at 2.4%.

Which segment is growing fastest?

Hybrid operator streaming devices grow at 5.1%, half again the market rate of 3.4%. Operators deploy them to keep their own interface in front of the viewer.

Who are the major companies in the Set-top Box Market?

Sagemcom, CommScope, Skyworth, Humax, and ZTE lead the field, holding 52% of shipment value between them. European and Asian manufacturers compete on quite different grounds.

Which country is growing fastest?

India grows at 6.4%, combining hybrid replacement across the largest pay-television subscriber base anywhere with terrestrial migration that remains incomplete across a number of states.

Report Segmentation Architecture

The full report scope spans multiple orthogonal segmentation dimensions, with cross-tabulated demand data provided for each dimension pair. Coverage extends further to regional breakdowns, trend trajectories, and the competitive detail needed to support segment-level decision-making.

By Device Type

  • Cable Set-Top Boxes
  • Satellite Set-Top Boxes
  • Internet Protocol Television and Managed Broadband Boxes
  • Hybrid Operator Streaming Devices
  • Retail Streaming Media Players
  • Digital Terrestrial Free-To-Air Receivers

By End-Use Industry

  • Satellite Pay Television Operators
  • Cable Television Operators
  • Telecommunications and Broadband Providers
  • Free-To-Air Broadcasters and Public Service Media
  • Hospitality and Institutional Deployment
  • Consumer Retail Purchase

By Commercial Dimension

  • Operator Subsidised Deployment
  • Operator Rental Provision
  • Consumer Retail Sale
  • Government Migration Programme
  • Interface Software Licensing
  • Extended Lifecycle Service Contract

By Region

  • East Asia
  • South Asia and Pacific
  • North America
  • Western Europe
  • Latin America
  • Middle East and Africa
  • Eastern Europe

Scope, Methodology, and Coverage

Every figure in this report is reproducible from documented input assumptions. The scope below maps the historical period, the forecast horizon, the segmentation dimensions, and the countries covered, alongside the underlying primary and qualitative methodology.
Historical Period
2020 to 2025
Forecast Period
2026 to 2036
Base Year
2025 (USD billions; MMA Primary Research Dataset, September 2026)
Market Definition
This market covers set-top boxes and connected television receiving devices, including cable set-top boxes, satellite set-top boxes, internet protocol television and managed broadband boxes, hybrid operator streaming devices, retail streaming media players, and digital terrestrial free-to-air receivers. It excludes televisions with integrated application platforms, broadband modems and routers sold without video functions, conditional access software licensed separately, and video streaming subscription services.
Quantitative Units
USD billions, delivered manufacturer shipment value
Segmentation Dimensions
Device type, end-use industry, commercial dimension, region
Regions Covered
East Asia, South Asia and Pacific, North America, Western Europe, Latin America, Middle East and Africa, Eastern Europe
Countries Covered
China, Japan, South Korea, Taiwan, India, Indonesia, Vietnam, Philippines, Australia, United States, Canada, Mexico, United Kingdom, Germany, France, Italy, Spain, Netherlands, Brazil, Colombia, Argentina, Chile, Saudi Arabia, United Arab Emirates, Nigeria, Kenya, South Africa, Poland, Romania, Czechia
Key Companies Profiled
Sagemcom, CommScope, Skyworth, Humax, ZTE, Huawei, Amazon, Roku, Google, Apple, Xiaomi, Coship, Jiuzhou, SEI Robotics, Kaonmedia, EchoStar, Dish TV India, Askey, Arcadyan, Vestel
Quantitative Methodology
Primary survey, n=3,800 respondents, Q4 2025, six countries; demand-side model with trade association cross-validation
Qualitative Methodology
47 expert interviews, Q4 2025; applied to validate demand model assumptions, identify emerging dynamics, and assess competitive positioning
Report Format
PDF and XLSX data workbook (Word format preview document)
Publisher
Market Minds Advisory
Report Code
MMA-2026-TEC-581
Published
September 2026
Contact
sales@marketmindsadvisory.com | www.marketmindsadvisory.com

Purchase the full Set-top Box Market Report (2026 to 2036).

The full report sizes the set-top box market across six device types, seven regions, and thirty countries, with forecasts to 2036 under base, bull, and bear cases. It examines why operators continue funding hardware that smart televisions made technically unnecessary, what the measured churn difference actually justifies, and where manufacturers can earn as deployment declines. Competitive analysis covers twenty participants evaluated consistently on shipment value, with detailed treatment of subsidised procurement economics and interface software as a survival route. Cost structure, margin architecture by device type, and regional deployment drivers are analysed in full. Primary research includes 3,800 survey responses and 47 expert interviews.
Six device types sized and forecast separately
Twenty participants evaluated on delivered shipment value
Regional deployment and migration drivers across seven geographies
Margin architecture by device type and revenue source
Churn difference analysis across matched subscriber cohorts
Deployment life and replacement cycle benchmarks by operator type

Built For The People Who Decide

From boardroom strategy to bench-side execution, this report is read cover-to-cover by leaders shaping the next decade of their industry, turning demand scenarios, market dynamics and valuation benchmarks into decisions.
CXOs/ Presidents/ VPs/ Managers
M&A and Corporate Development
Strategy Teams and R&D Heads
Procurement and Product Directors
Regulatory and Compliance Leaders
Investor Relations and Equity Analysts