Market Minds Advisory
Service Lifecycle Management Application Market

Service Lifecycle Management Application Market: Service Lifecycle Management Application Market: Parts Mismatch, Warranty Accounting and Integration Gaps, 2026 to 2036

Manufacturers earn most of their profit in the aftermarket and run it on the least sophisticated systems they own, planning intermittent service demand with forecasting logic built for production orders.

Lead Analyst

Published

September 2026

Make Smarter Decisions with Customized Research Insights

Request a free sample report and evaluate market opportunities, growth trends, and competitive dynamics relevant to your business needs.

2025 MARKET VALUE$5.4BMarket Size 2025
2036 FORECAST VALUE$16.4BBase Case , 2026 to 2036
CAGR 2026 TO 203610.6 %Bull 11.8% / Bear 9.4%
INCREMENTAL OPPORTUNITY$10.4BNet 10- year value creation
EXPANSION MULTIPLE2.74x2036 value over 2026 base
Strategic Levers
M&A Pipeline
Regional Outlook
Country Rankings
Competitive Intelligence
Segmental Deep-dive
Call-Us : 91 93563 13602

Executive Snapshot and Market Trajectory.

Around 58% of manufacturer profit comes from the aftermarket, and the aftermarket is managed with the worst systems in the company. Service parts are planned using forecasting logic designed for production, which is the wrong tool for demand that is intermittent and lumpy. Nobody fixed it because nobody was looking.
The consequence is measurable and large. Parts inventory runs at roughly 3.4 times what actual demand patterns require, held in the wrong locations while the right ones stock out, and that capital sits on a balance sheet nobody is examining. Service parts planning grows at 15.9%, half again the market rate of 10.6%, because it is the one module with a return a finance function verifies. Finance verifies that number and funds it.
Five vendors hold 47% of measured licence and subscription revenue. Warranty sells for the same reason: accrual is an audited balance sheet liability and only about 31% of warranty cost is recovered from the suppliers who caused it. Connected products changed the input rather than the process, since a prediction must cross 4 separate systems before it reaches a technician. Integration rather than prediction is the actual bottleneck here.
Market Definition
The service lifecycle management application market covers software that plans, executes and accounts for the aftermarket support of manufactured products, spanning service parts planning and inventory, warranty and claims management, field service management, service contract and entitlement management, repair returns and depot operations, and technical documentation and service knowledge. Sizing is measured at vendor licence, subscription and maintenance revenue. Enterprise resource planning, product design tools, manufacturing execution, customer relationship management sold independently and implementation consulting are excluded.
Base Year Value
$5.4B in 2025 (MMA Primary Research Dataset, September 2026)
Forecast Period
2026 to 2036, eleven discrete annual values
CAGR
10.6% base case. Bull 11.8%. Bear 9.4%.
Fastest Growth Segment
Service Parts Planning and Inventory: 15.9% CAGR
Fastest Growth Country
India: 17.2% CAGR
Fastest Growth Region
South Asia and Pacific: 12.8% CAGR
Largest Region
Western Europe: 30% of 2025 global value
Market Leaders
PTC, SAP, Siemens, Salesforce, IFS. Source: MMA Analysis based on company annual reports and measured licence and subscription revenue.
Primary Survey
n=3,800 procurement and R&D decision-makers, Q4 2025, six countries
Methodology
Demand-side build-up, cross-validated against public data, 47 expert interviews

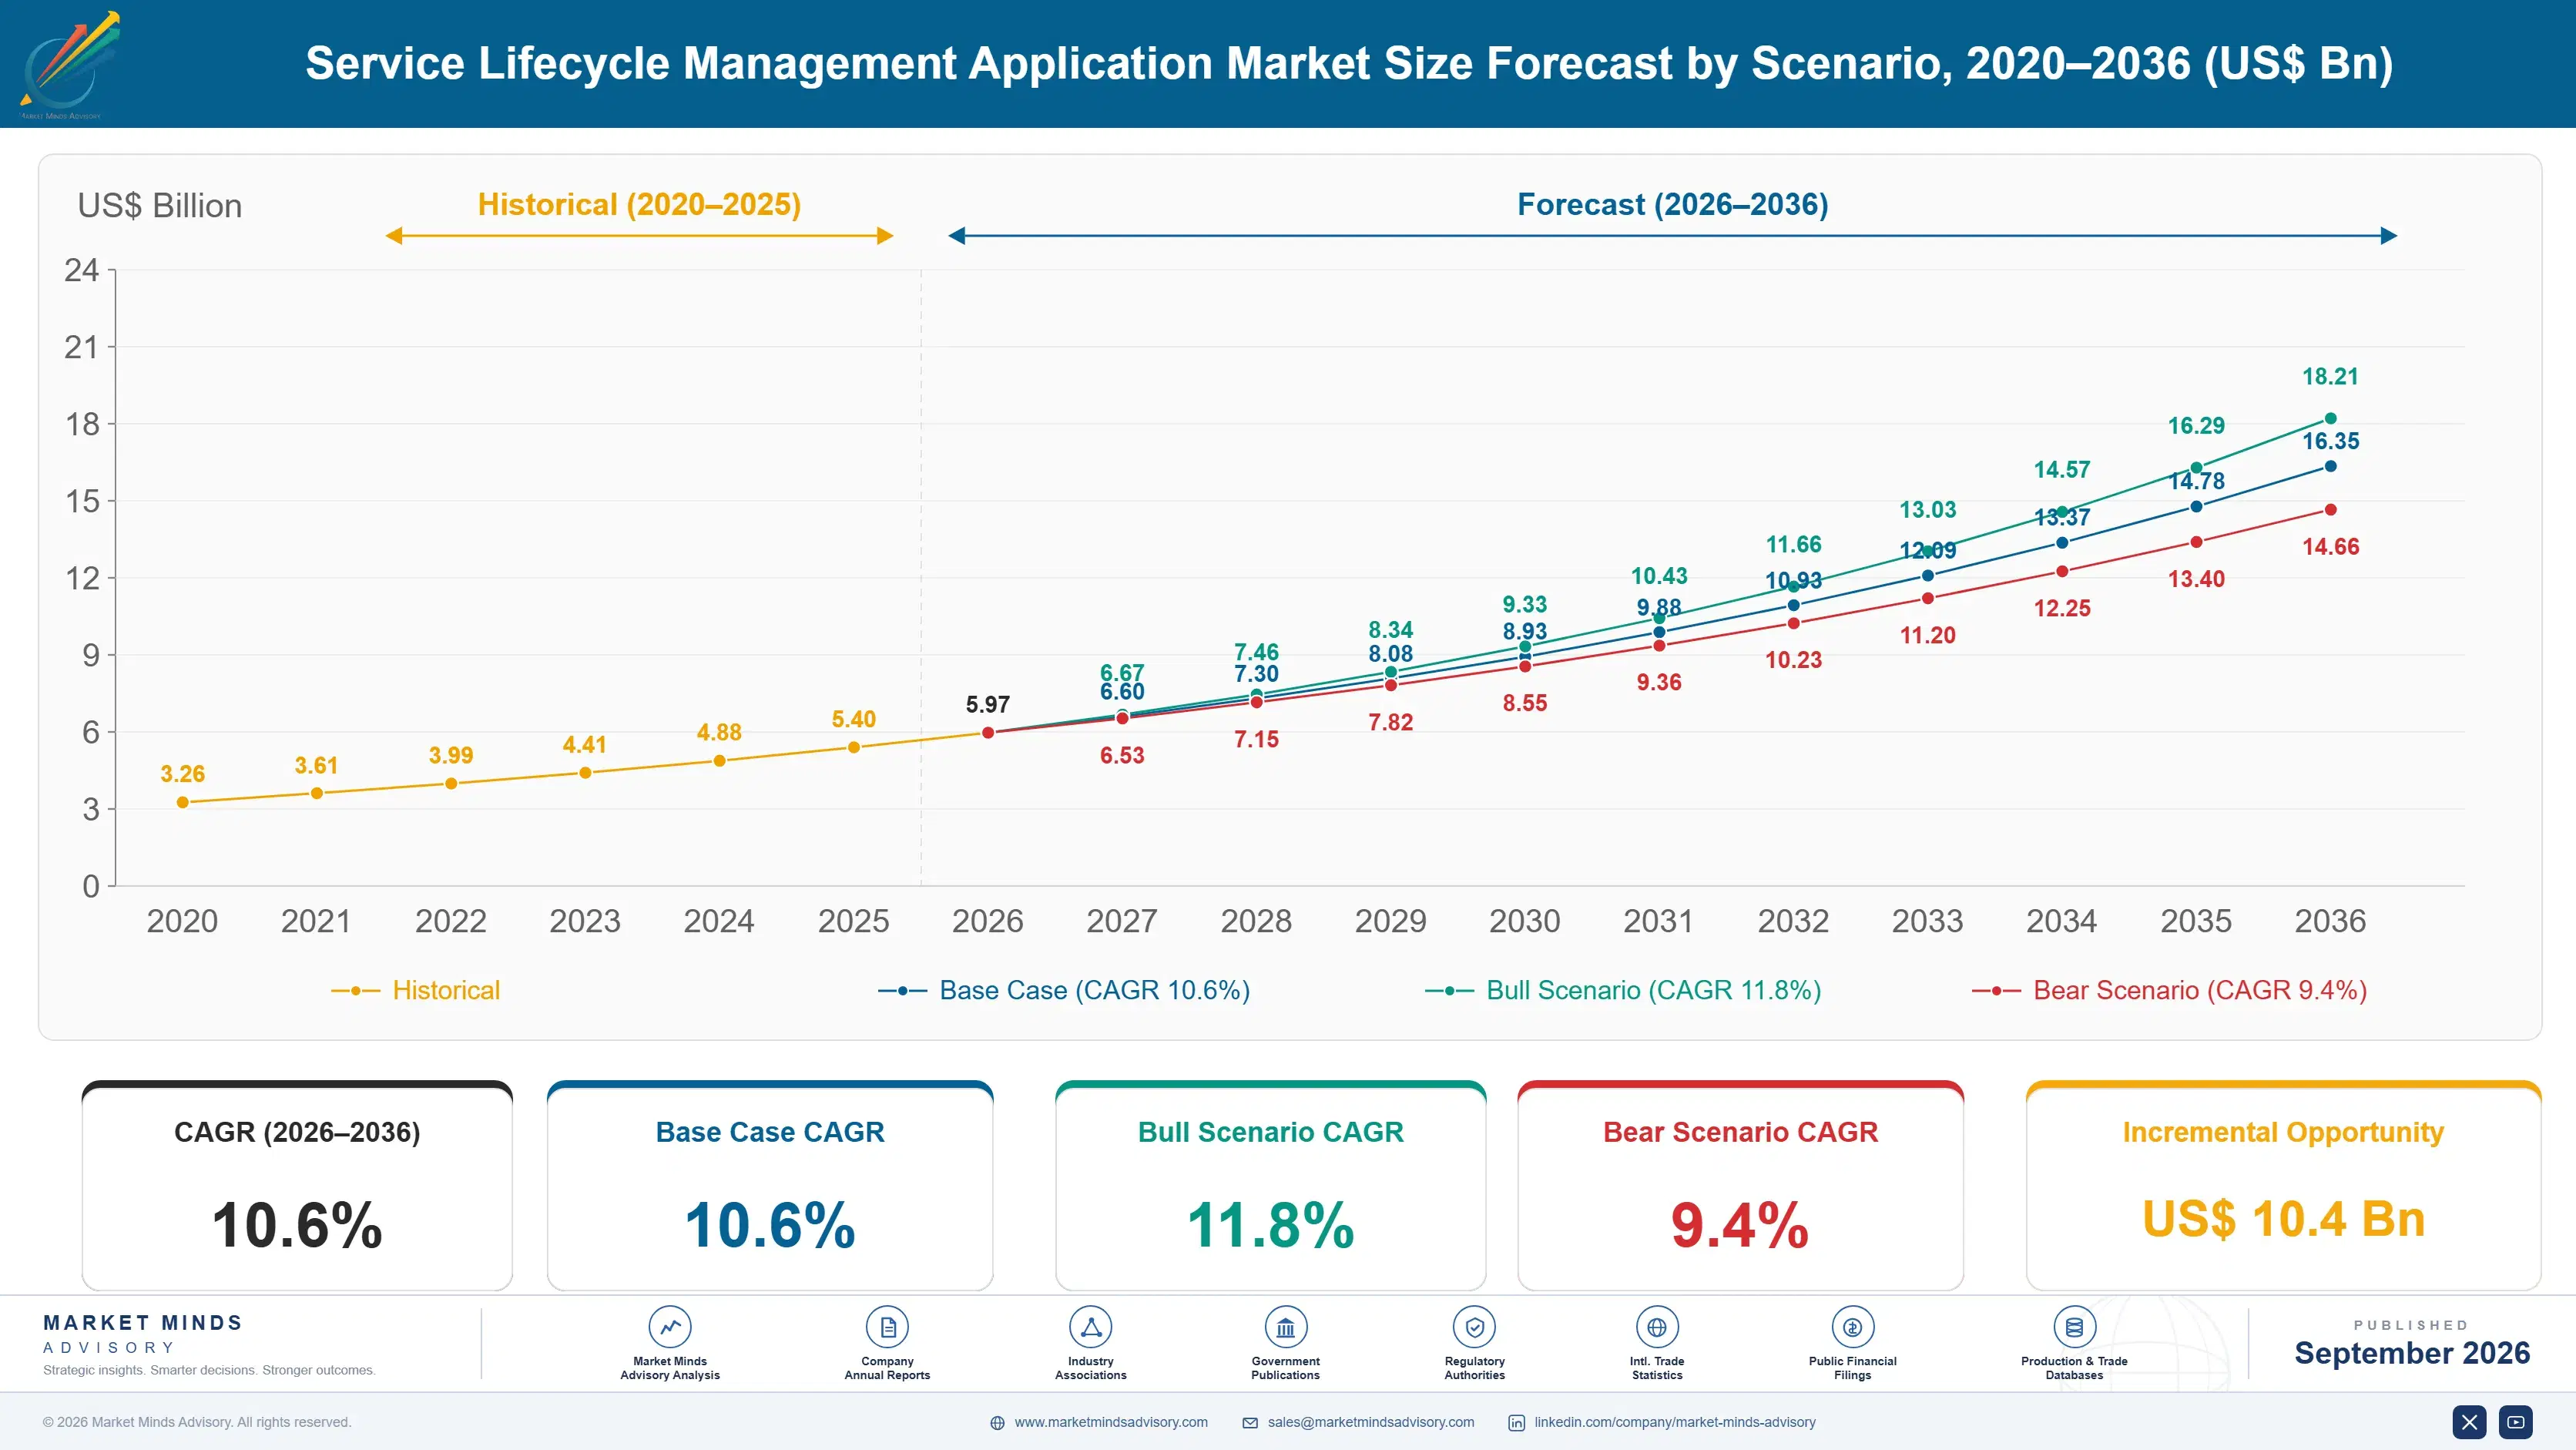
Service Lifecycle Management Application Market Forecast Scenarios

service-lifecycle-management-application-market-size-forecast-scenario-1788417855311
Between 2020 and 2025 the market compounded at 9.4%, with growth concentrated in the modules that touch money rather than the ones that touch technicians. Warranty and parts planning sold steadily because both produce a number a finance function can verify. Field service management sold on productivity arguments that convinced operations leaders and rarely convinced anybody controlling capital, which is why it grew more slowly than its promoters expected.
The 10.6% base case rests on three commercial mechanisms. Service parts capital is a large and visible balance sheet item that planning software demonstrably reduces, which makes it fundable in a way productivity claims are not. Warranty accrual accuracy and supplier recovery both reach the chief financial officer directly. And connected product telemetry is arriving whether manufacturers act on it or not, which creates pressure to integrate the systems that would let anybody use it.
The bull case is manufacturers treating aftermarket capital with the same rigour they apply to production inventory, which would fund parts planning across whole installed bases rather than in pilots. The bear case is aftermarket profit attracting competitive attack from independent parts suppliers and repairers, which would compress the margin pool this software exists to protect.

The Profitable Half Runs On The Worst Systems

Around 58% of manufacturer profit originates in the aftermarket, and almost every manufacturer runs that half of the business on systems that were bought last and integrated least. Service parts in particular are planned with logic built for production, which assumes demand arrives smoothly against orders. Service demand does the opposite: it is intermittent, lumpy, driven by installed base failure rates and impossible to forecast with the same arithmetic.
TOP FIVE CONCENTRATION47%Share of measured licence and subscription revenue held by leaders
AFTERMARKET PROFIT SHARE58%Portion of manufacturer profit originating in aftermarket service activity
PARTS OVERSUPPLY MULTIPLE3.4xService parts held against what demand patterns actually require
SUPPLIER RECOVERY RATE31%Portion of warranty cost successfully recovered from component suppliers
OUTCOME CONTRACT SHARE7%Portion of service revenue under availability or outcome agreements
INTEGRATION GAP4 systemsSeparate systems a prediction must cross to reach a technician
The result is inventory at roughly 3.4 times what demand patterns require, held in the wrong depots while the right ones stock out and expedite. That capital is large, visible on a balance sheet and almost never examined with the rigour applied to production inventory. It is the clearest recoverable value in this category, which is why parts planning grows at 15.9% against a market at 10.6%.
Warranty sells for a related reason that has nothing to do with service. Accrual is an audited liability, claims fraud is real, and only around 31% of warranty cost is recovered from the component suppliers who caused it, so the software reaches the chief financial officer rather than the service director. Modules arguing productivity reach an operations leader with a smaller budget.
"The aftermarket is where the money is and where the systems are worst, and everyone in the industry has known this for twenty years. What changed is that parts capital became visible enough for a finance director to ask about it, which is the only conversation that ever moves budget here."
Director, Aftermarket Systems and Industrial Software Practice · MMA Technology and Industrial Software Practice · September 2026

Market Trends

Service Demand Planning Splits From Production Logic

Production forecasting assumes demand arrives against orders and behaves smoothly enough for conventional statistical methods, while service demand is intermittent, lumpy and driven by installed base failure rather than by anything the sales function does. Applying one to the other produces inventory at roughly 3.4 times requirement in the wrong places, with stockouts and expediting alongside. Purpose-built service planning uses failure distributions and installed base position instead, which is different mathematics rather than a configuration option. Growth at 15.9% against a market at 10.6% reflects finance functions finally noticing the capital involved.
Market Impact: Protects 58% of profit
Warranty Reaches The Balance Sheet Not The Workshop

Warranty accrual is an audited liability rather than a service cost, which puts it in front of a chief financial officer rather than a service director, and the difference in budget and approval speed is considerable. Claims validation, fraud detection and supplier recovery all produce verifiable numbers, and only around 31% of warranty cost is currently recovered from the component suppliers responsible for it. That gap is money the manufacturer is entitled to and does not collect. Growth at 14.2% follows the audience rather than any improvement in the underlying software.
Market Impact: Grows at 17.2% annually

Market Opportunities and Growth Drivers

Aftermarket Profit Concentration Draws Executive Attention

Around 58% of manufacturer profit comes from the aftermarket while new equipment sales absorb most of the management attention and most of the systems investment, and that imbalance has become difficult to defend as equipment margins compress. Boards asking where profit actually originates discover an operation run on spreadsheets and inherited modules. That produces budget for the first time in many organisations. The attention arrives from finance rather than from service, which changes which modules get funded and which do not. Equipment margins compressing is what finally made the imbalance impossible to defend.
Market Impact: Undermines 3.4 times planning

Indian Manufacturers Build Service Networks From Nothing

Indian equipment and vehicle manufacturers are building aftermarket service networks at scale for the first time, and building them without legacy systems means selecting purpose-built software rather than adapting production tools. Growth of 17.2% makes India the fastest growing country in this market. Global capability centres also run aftermarket operations for Western manufacturers from India, which concentrates both the software decisions and the operational expertise. The absence of legacy is a genuine advantage rather than a gap to be filled. Selecting purpose-built software rather than adapting production tools is the natural consequence.
Market Impact: Splits across 4 vendors

Market Restraints and Challenges

Installed Base Data Is Usually Wrong

Service planning depends on knowing what equipment exists, where it is, what configuration it carries and how it has been used, and manufacturers routinely hold none of that accurately for products sold through distribution or modified in the field. The root cause is that the record was never maintained because nobody needed it while parts were simply overstocked. Commercial impact is planning software that cannot perform against data it was never given. Mitigation runs through installed base reconstruction projects, through telemetry that reports configuration directly, and through planning methods that tolerate incomplete population data rather than assuming completeness.
Market Impact: Cuts 3.4 times oversupply

Modules Come From Vendors Who Do Not Integrate

Parts planning, field service, warranty and documentation are frequently bought from four different vendors at four different times, and a prediction or a claim must cross all of them to produce any action. The root cause is that each module was purchased by a different function against a different budget. Commercial impact is capability that exists in pieces and delivers nothing end to end. Participants mitigate through platform consolidation, through integration layers built specifically for aftermarket data, and through acquisitions that assemble the modules a manufacturer would otherwise have to connect itself.
Market Impact: Recovers beyond 31% currently collected
4 additional market trends, 3 additional growth drivers, and 2 additional restraints and challenges are covered in the full report. Contact sales@marketmindsadvisory.com to access the complete intelligence.

Segment CAGR and Growth Architecture

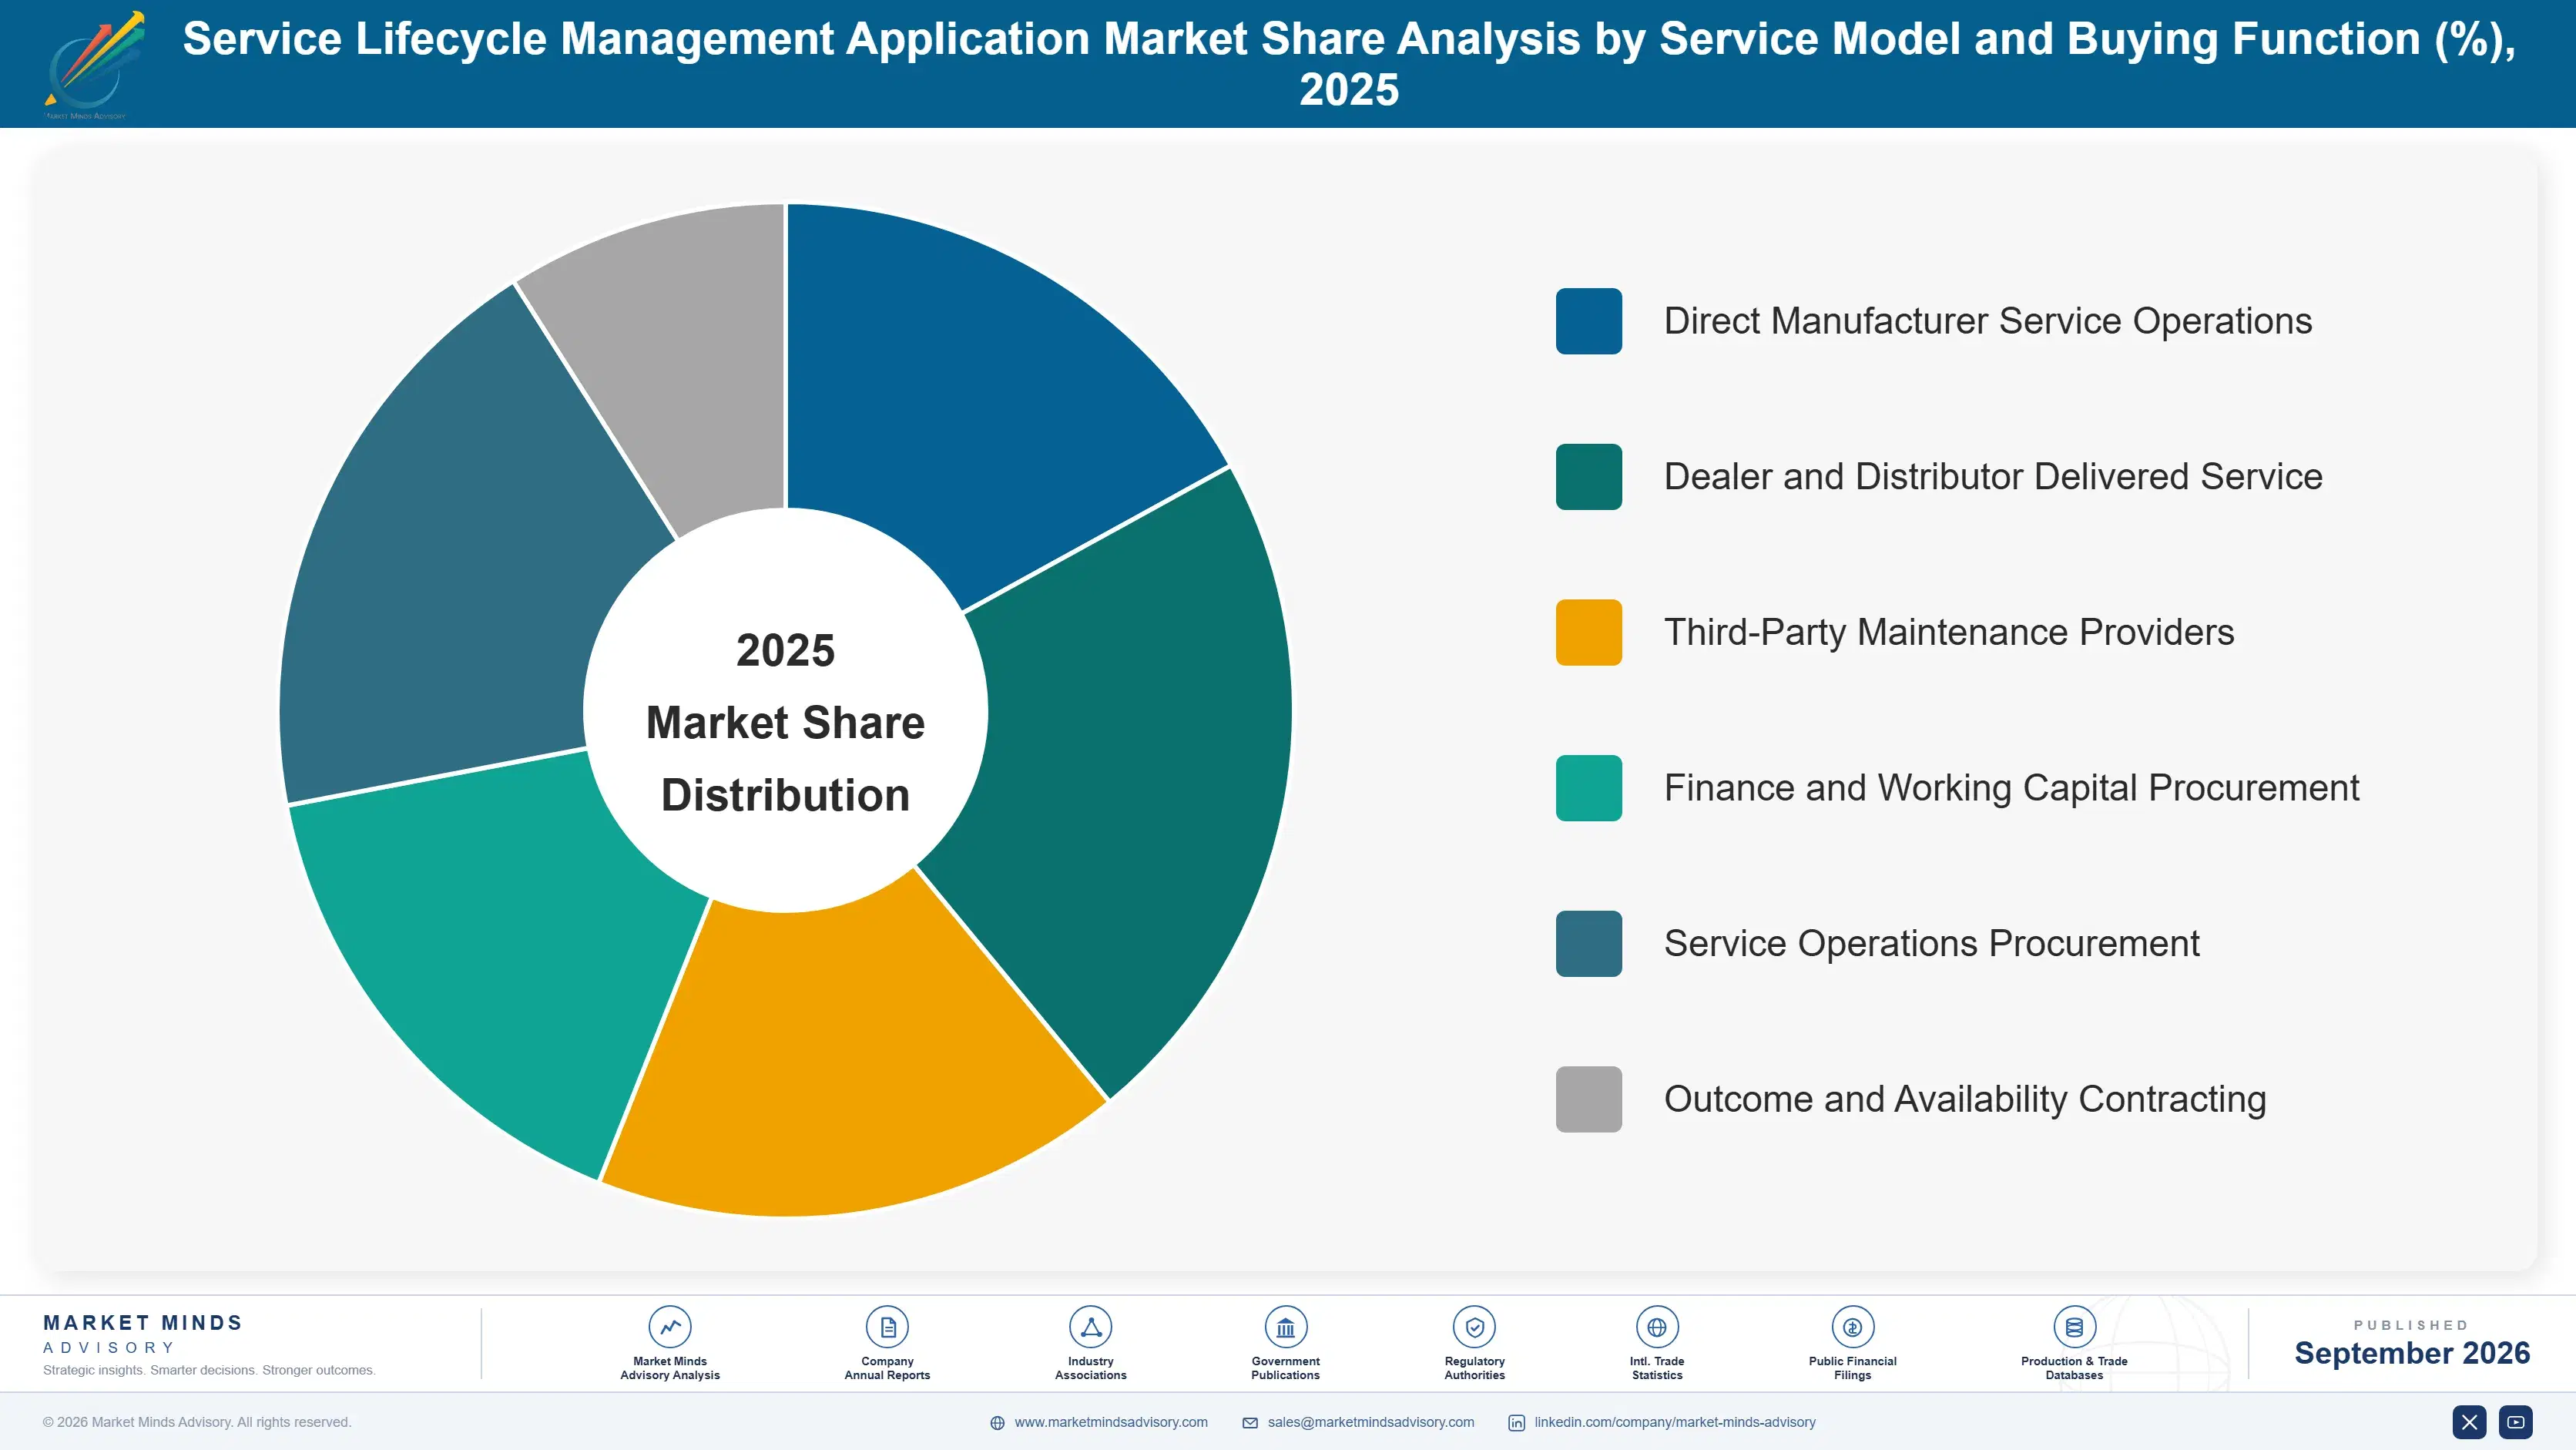
Segmentation follows the application module deployed, which determines who buys it, which budget pays and how the return is argued. Parts planning, warranty, field service, contracts, depot repair and technical documentation reach entirely different functions, and modules touching capital or audited liability behave quite unlike those arguing productivity. The divergence between them keeps widening.
service-lifecycle-management-application-market-market-share-analysis-1788417855860

Service Parts Planning and Inventory

This is the module with a return a finance function verifies rather than accepts. Service demand is intermittent and driven by installed base failure rather than by orders, so production forecasting produces inventory at roughly 3.4 times requirement in the wrong locations while the right depots stock out and expedite. Purpose-built planning using failure distributions and installed base position is different mathematics rather than a configuration choice. Growth at 15.9% is half again the market rate of 10.6%. The obstacle is data rather than method, since manufacturers frequently cannot say what equipment exists or where it currently sits. Finance rather than service funds this one, which changes everything about the sale.
CAGR 15.9%

Warranty and Claims Management

Warranty accrual is an audited balance sheet liability rather than a service cost, which puts this module in front of a chief financial officer with a larger budget and a shorter approval cycle than any service director commands. Claims validation, fraud detection and supplier recovery all produce numbers that can be checked afterwards. Only around 31% of warranty cost is recovered from the component suppliers responsible, which is money the manufacturer is entitled to and simply does not collect. Growth at 14.2% follows the audience rather than the technology, and the module has changed relatively little in a decade. Fraud detection and claims validation both produce numbers that can be checked afterwards.
CAGR 14.2%
Full segment breakdown across 6 segments available in the complete report.

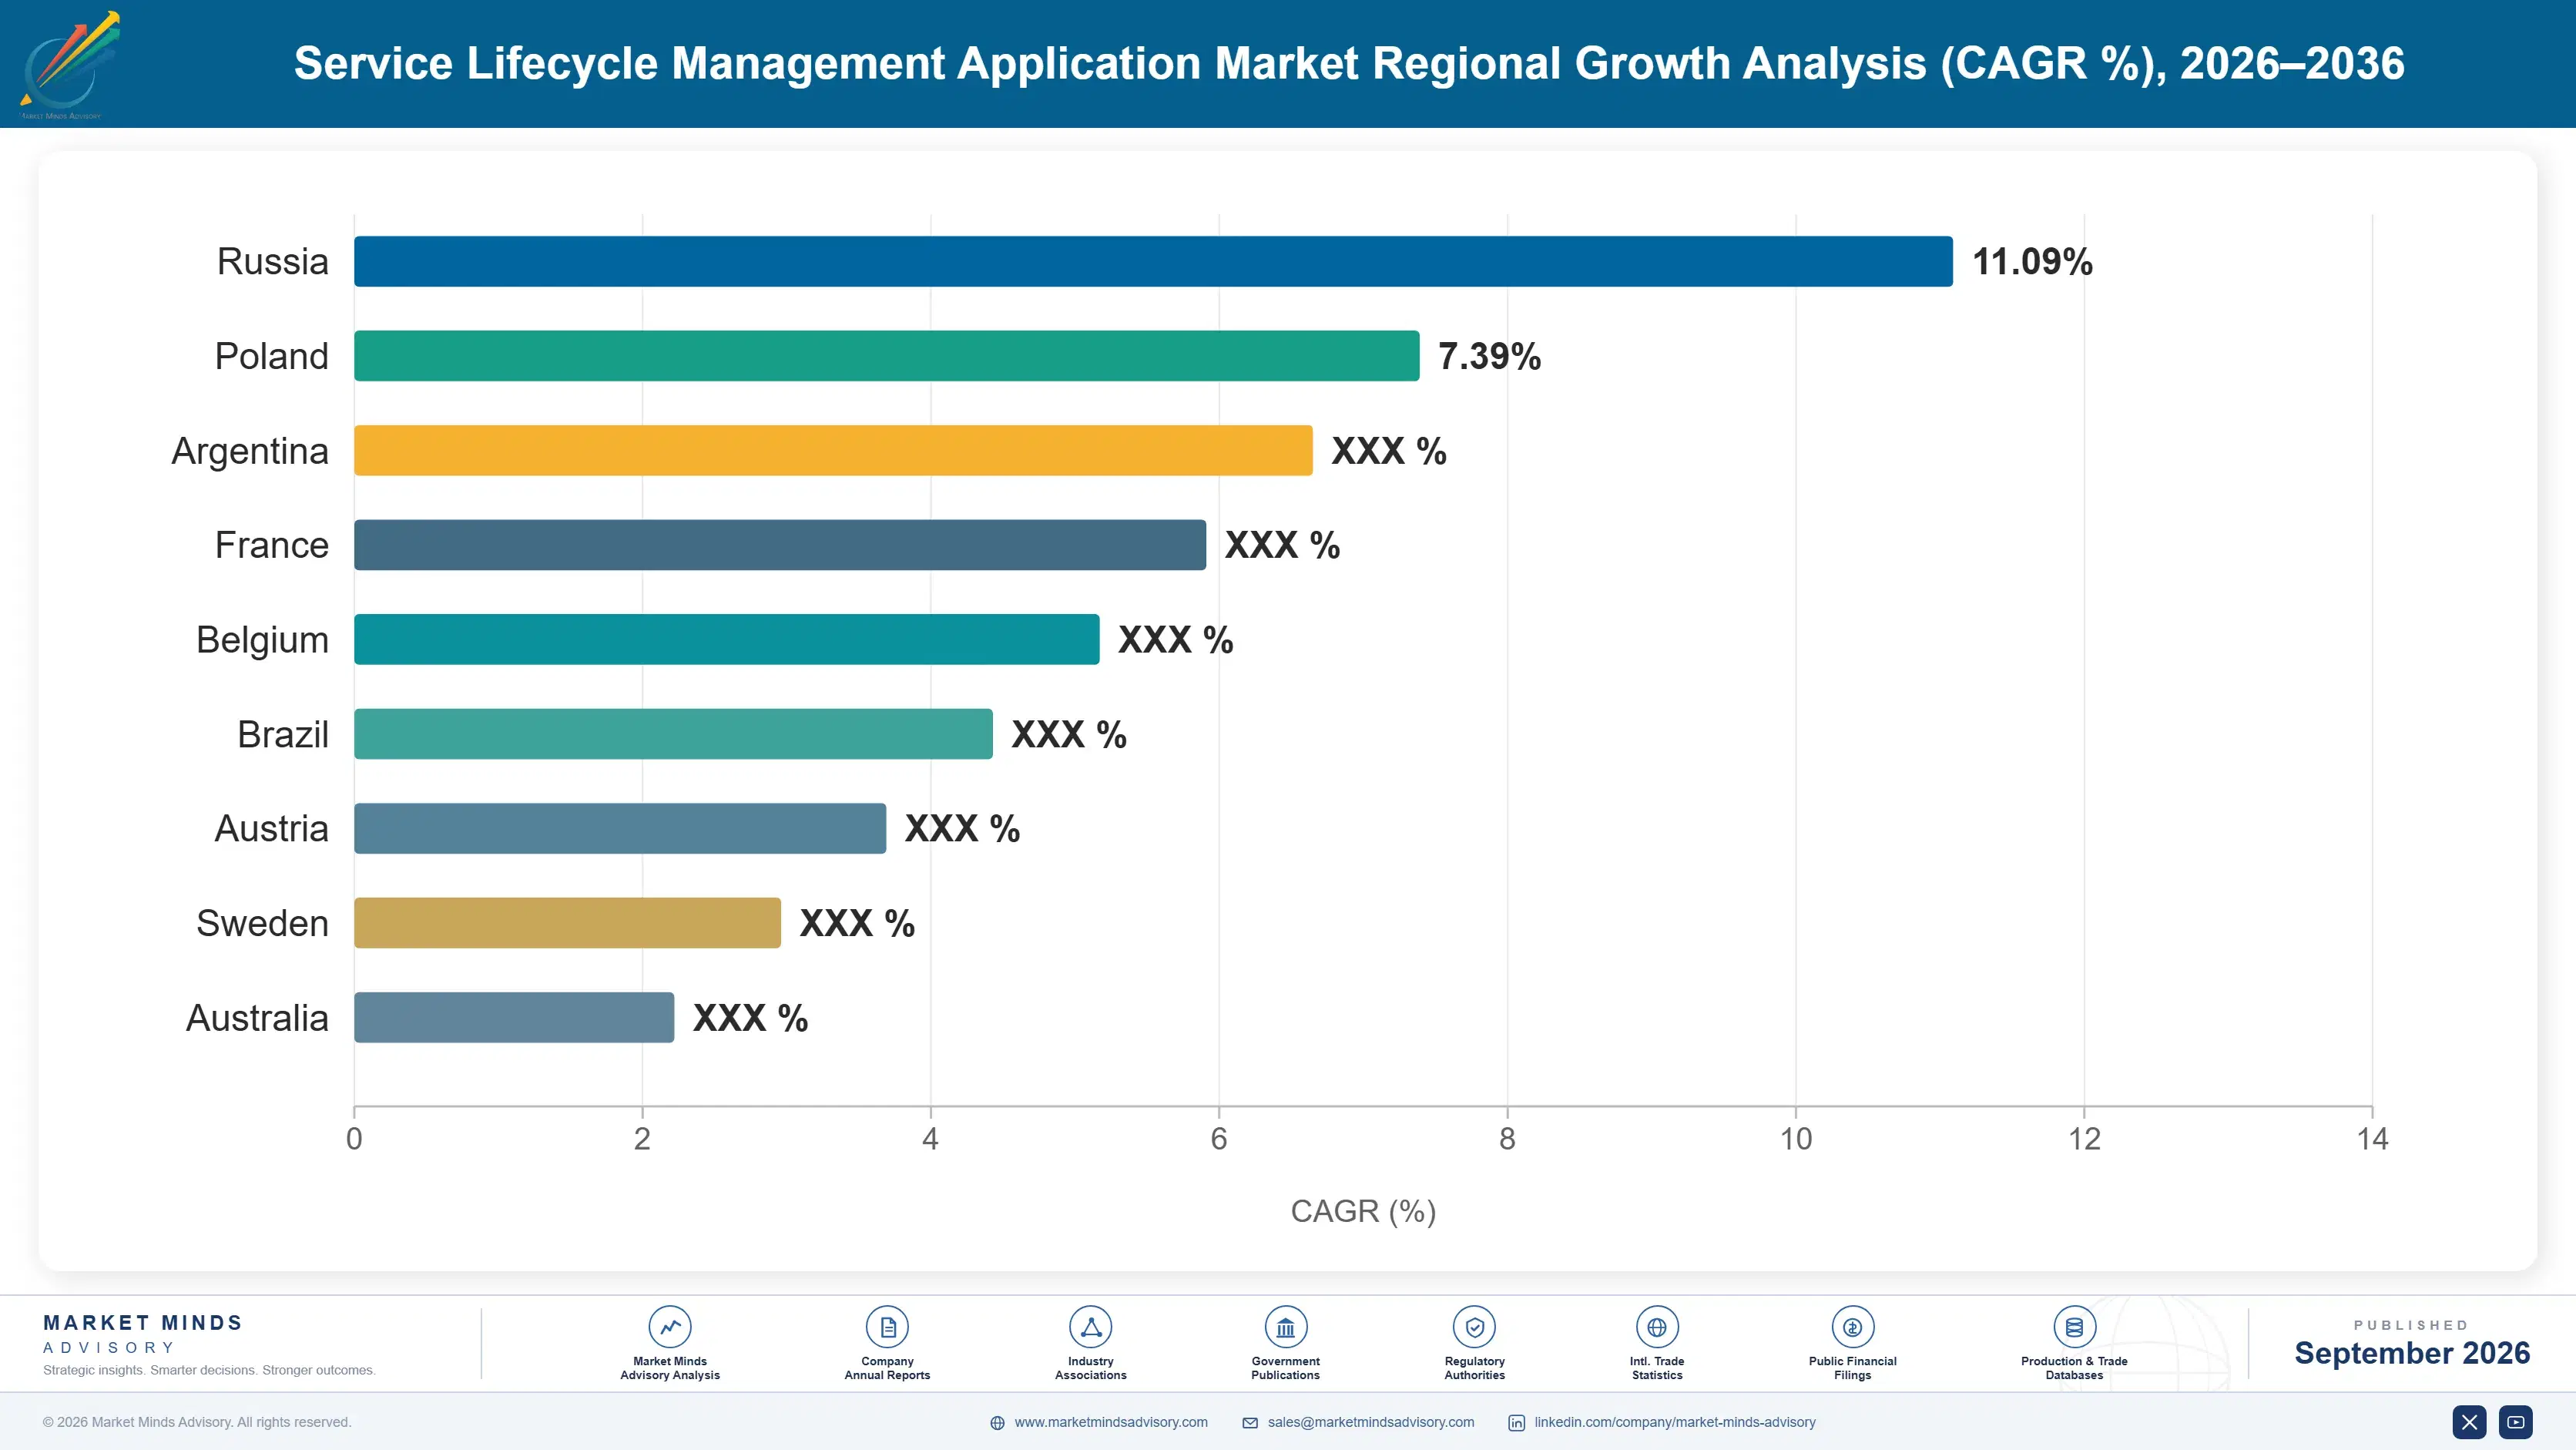
Regional Architecture and Country Demand Map

Demand follows installed base of complex equipment and the maturity of service-led business models rather than manufacturing output alone. Western Europe leads because its machinery manufacturers built service-led models earliest and hold the largest serviced installed bases. Manufacturing output alone is a poor guide. Service models decide it.

Western Europe

German, Swiss, Italian and Nordic machinery manufacturers built service-led business models earlier than anywhere and hold installed bases they have supported for decades, which puts the region at 30%, marginally above the standard band ceiling of 26%. Aftermarket profit dependence here is the highest anywhere and boards understand it well. Service parts networks across many countries create planning complexity that simpler geographies avoid entirely. Growth of 9.2% is the slowest of any region and reflects mature adoption rather than any reluctance, since most large manufacturers already run something. Service parts networks spanning many countries create planning complexity that simpler single-market geographies avoid entirely. Most large manufacturers here already run something, so replacement rather than first purchase drives what growth exists.
Share: 30% | CAGR: 9.2% (2026 to 2036)

North America

Aerospace, industrial equipment and medical device manufacturers carry the largest warranty liabilities and the most demanding regulatory service documentation obligations anywhere. Warranty modules sell particularly well here because accrual scrutiny from auditors and regulators is severe. Field service adoption is broad and shallow, with many organisations holding capability they use partially. Growth of 9.8% reflects a market where most large manufacturers have bought something and the opportunity is replacement and consolidation rather than any first purchase. Aerospace, industrial equipment and medical device manufacturers carry the largest warranty liabilities anywhere, and auditor scrutiny of accrual is correspondingly severe throughout the region. Field service adoption is broad and shallow, with many organisations holding capability they only partly use.
Share: 28% | CAGR: 9.8% (2026 to 2036)
Regional intelligence for 5 additional markets available in the complete report: East Asia, South Asia and Pacific, Latin America, Middle East and Africa, Eastern Europe. Contact sales@marketmindsadvisory.com.
service-lifecycle-management-application-market-country-cagr-analysis-1788417856418

Where Aftermarket Software Actually Sells

Four positions carry margin in a category where the value has always been obvious and the budget rarely appeared. Each involves reaching a finance audience rather than a service one, or assembling modules that manufacturers would otherwise have to connect for themselves at considerable cost. The value was always obvious and the budget rarely appeared.

Sell Parts Capital Reduction To Finance

Service inventory at roughly 3.4 times requirement is large, visible on a balance sheet and almost never examined with the rigour applied to production stock, which makes it the one aftermarket argument a finance director funds without hesitation. Purpose-built service planning demonstrably reduces it while improving availability, and the result appears in working capital within a year. Vendors arguing technician productivity reach an operations leader with a smaller budget and a slower approval cycle. The proposition changes entirely without the software changing at all. The proposition changes entirely without the software changing at all.
Market Impact: Reduces the current 3.4 times parts oversupply substantially

Pursue Warranty Supplier Recovery Much More Explicitly

Only around 31% of warranty cost is recovered from the component suppliers who caused the failure, which is money a manufacturer is contractually entitled to and simply does not collect for want of evidence and process. Recovery produces cash rather than avoided cost, which is the strongest possible argument in this category. It also reaches a chief financial officer directly because accrual is an audited liability. Vendors selling warranty as claims administration are describing the operational half and ignoring the financial one. Vendors selling this as claims administration describe the operational half and ignore the financial one.
Market Impact: Improves considerably on the 31% currently being recovered

Own The Integration Between Prediction And Action

Connected equipment makes failure prediction straightforward and useless, because a prediction crosses 4 separate systems from different vendors before it reaches anybody who can dispatch a part or a technician. The constraint was never the prediction and manufacturers are discovering this now. Vendors holding several modules can close that loop where single-module specialists cannot, whatever the quality of their individual product. Integration rather than analytics is where the budget is moving, and it favours breadth decisively. Integration rather than analytics is where the budget is genuinely moving, and it favours breadth decisively over any individual module.
Market Impact: Closes a gap now spanning 4 separate systems

Fix Installed Base Data Before Selling Planning

Planning software cannot perform against a record that does not say what equipment exists, where it sits or how it is configured, and manufacturers selling through distribution routinely hold nothing accurate. Implementations fail on this rather than on method, which damages references and lengthens sales cycles for everybody. Vendors offering installed base reconstruction as part of the engagement remove the failure mode that has embarrassed this category for years. It is unglamorous work that decides whether anything else delivers. Implementations fail on this rather than on method, which damages references badly. Reconstruction decides whether any of the 4 modules deliver.
Market Impact: Enables the full 3.4 times inventory reduction properly

Who Controls the Margin Pool

Measured on licence and subscription revenue, the basis used throughout this section, the top five hold 47%. That is moderate concentration and it reflects a category assembled from modules that arrived separately and are still frequently bought separately by different functions. The gap between leaders and everyone else is module breadth and installed base integration rather than any difference in the individual applications, which are broadly comparable.
Competition runs on breadth across the aftermarket, on integration with product and manufacturing data, and increasingly on whether a vendor can demonstrate working capital reduction rather than process improvement. Engineering software vendors compete from the product data side. Enterprise platform vendors compete from the financial and supply chain side. Specialists compete on parts planning mathematics that generalists have never matched properly.

Pressure comes from two directions. Parts planning specialists hold the fastest growing segment and the clearest financial argument, which platform vendors keep attempting to answer by acquisition. And integration between prediction and action is becoming the requirement, which favours breadth over any individual module's quality. Rankings shift where vendors assembled the whole aftermarket and reached finance buyers rather than selling modules to service departments.
service-lifecycle-management-application-market-company-positioning-matrix-1788417856950

Competitive Moat and Risk Dimensions

PTC

Moat: Aftermarket breadth and parts depth

Ownership of both service parts planning and field service capability alongside product data gives coverage across the aftermarket that competitors assemble from several vendors, which matters because integration rather than any single module is now the binding constraint. Parts planning mathematics built specifically for intermittent demand is genuinely difficult to replicate. Product data supplies the configuration information planning depends upon.
PTC

Risk: Acquired module integration debt

Capability assembled through acquisition creates overlapping products and integration work that customers encounter as inconsistency between modules rather than as the unified aftermarket the positioning describes. Enterprise platform vendors reach the finance buyer through relationships already in place. Outcome contracting investment made when the category looked promising now addresses roughly 7% of service revenue.
SAP

Moat: Financial system proximity

Warranty accrual, parts capital and service contract revenue all settle in the financial system the manufacturer already runs, which puts the company alongside the audited numbers that make this category fundable at all. The finance buyer who now controls aftermarket budget is an existing relationship rather than a new one. Supply chain capability supports parts distribution across international service networks.
SAP

Risk: Service planning mathematics depth

Intermittent demand planning uses different mathematics from production forecasting, and specialists building for it exclusively outperform adapted supply chain modules in ways customers measure directly in working capital. Field service capability trails dedicated vendors. Breadth also means aftermarket competes internally for development attention against considerably larger product lines within the same organisation.

Players Tracked

Prominent Players

PTC
SAP
Siemens
Salesforce
IFS

Other Key Players

Oracle
Syncron
Baxter Planning
Tavant Technologies
Infor
Microsoft
ServiceNow
Aquant
Zinier
OnProcess Technology
Dassault Systemes
Hitachi
Fujitsu
Wipro
Accenture

Recent Developments

JUNE 2025

Manufacturer restates warranty accrual after claims review

An equipment manufacturer restated its warranty provision following a review of claims validation and supplier recovery practice, an accounting event rather than any commercial transaction. Recovery from component suppliers had been running well below entitlement across several product lines for an extended period. Auditors required the review.
Signal: Warranty is an audited liability first, which is exactly why this module reaches the finance function.
JANUARY 2025

Platform vendor acquires service parts forecasting specialist

An enterprise software vendor acquired a company specialising in intermittent demand forecasting for service parts, an acquisition rather than any partnership or joint venture. Working capital reduction demonstrated at reference customers was cited alongside the mathematics as the commercial rationale. Working capital effects were quantified at reference customers before completion.
Signal: Platform vendors keep buying the parts planning mathematics, because building it properly has repeatedly defeated them.
SEPTEMBER 2024

Industrial manufacturer winds back outcome contracting programme

A large industrial manufacturer reduced the scope of an availability-based service contracting programme, a commercial decision rather than any corporate transaction. Actuarial risk assessment and revenue recognition treatment were both cited as more demanding than the original business case had assumed. Several contracts reverted to conventional maintenance terms.
Signal: A decade of outcome contracting announcements produced very little that survived contact with a finance function.

Engineering, Implementation And Data Work

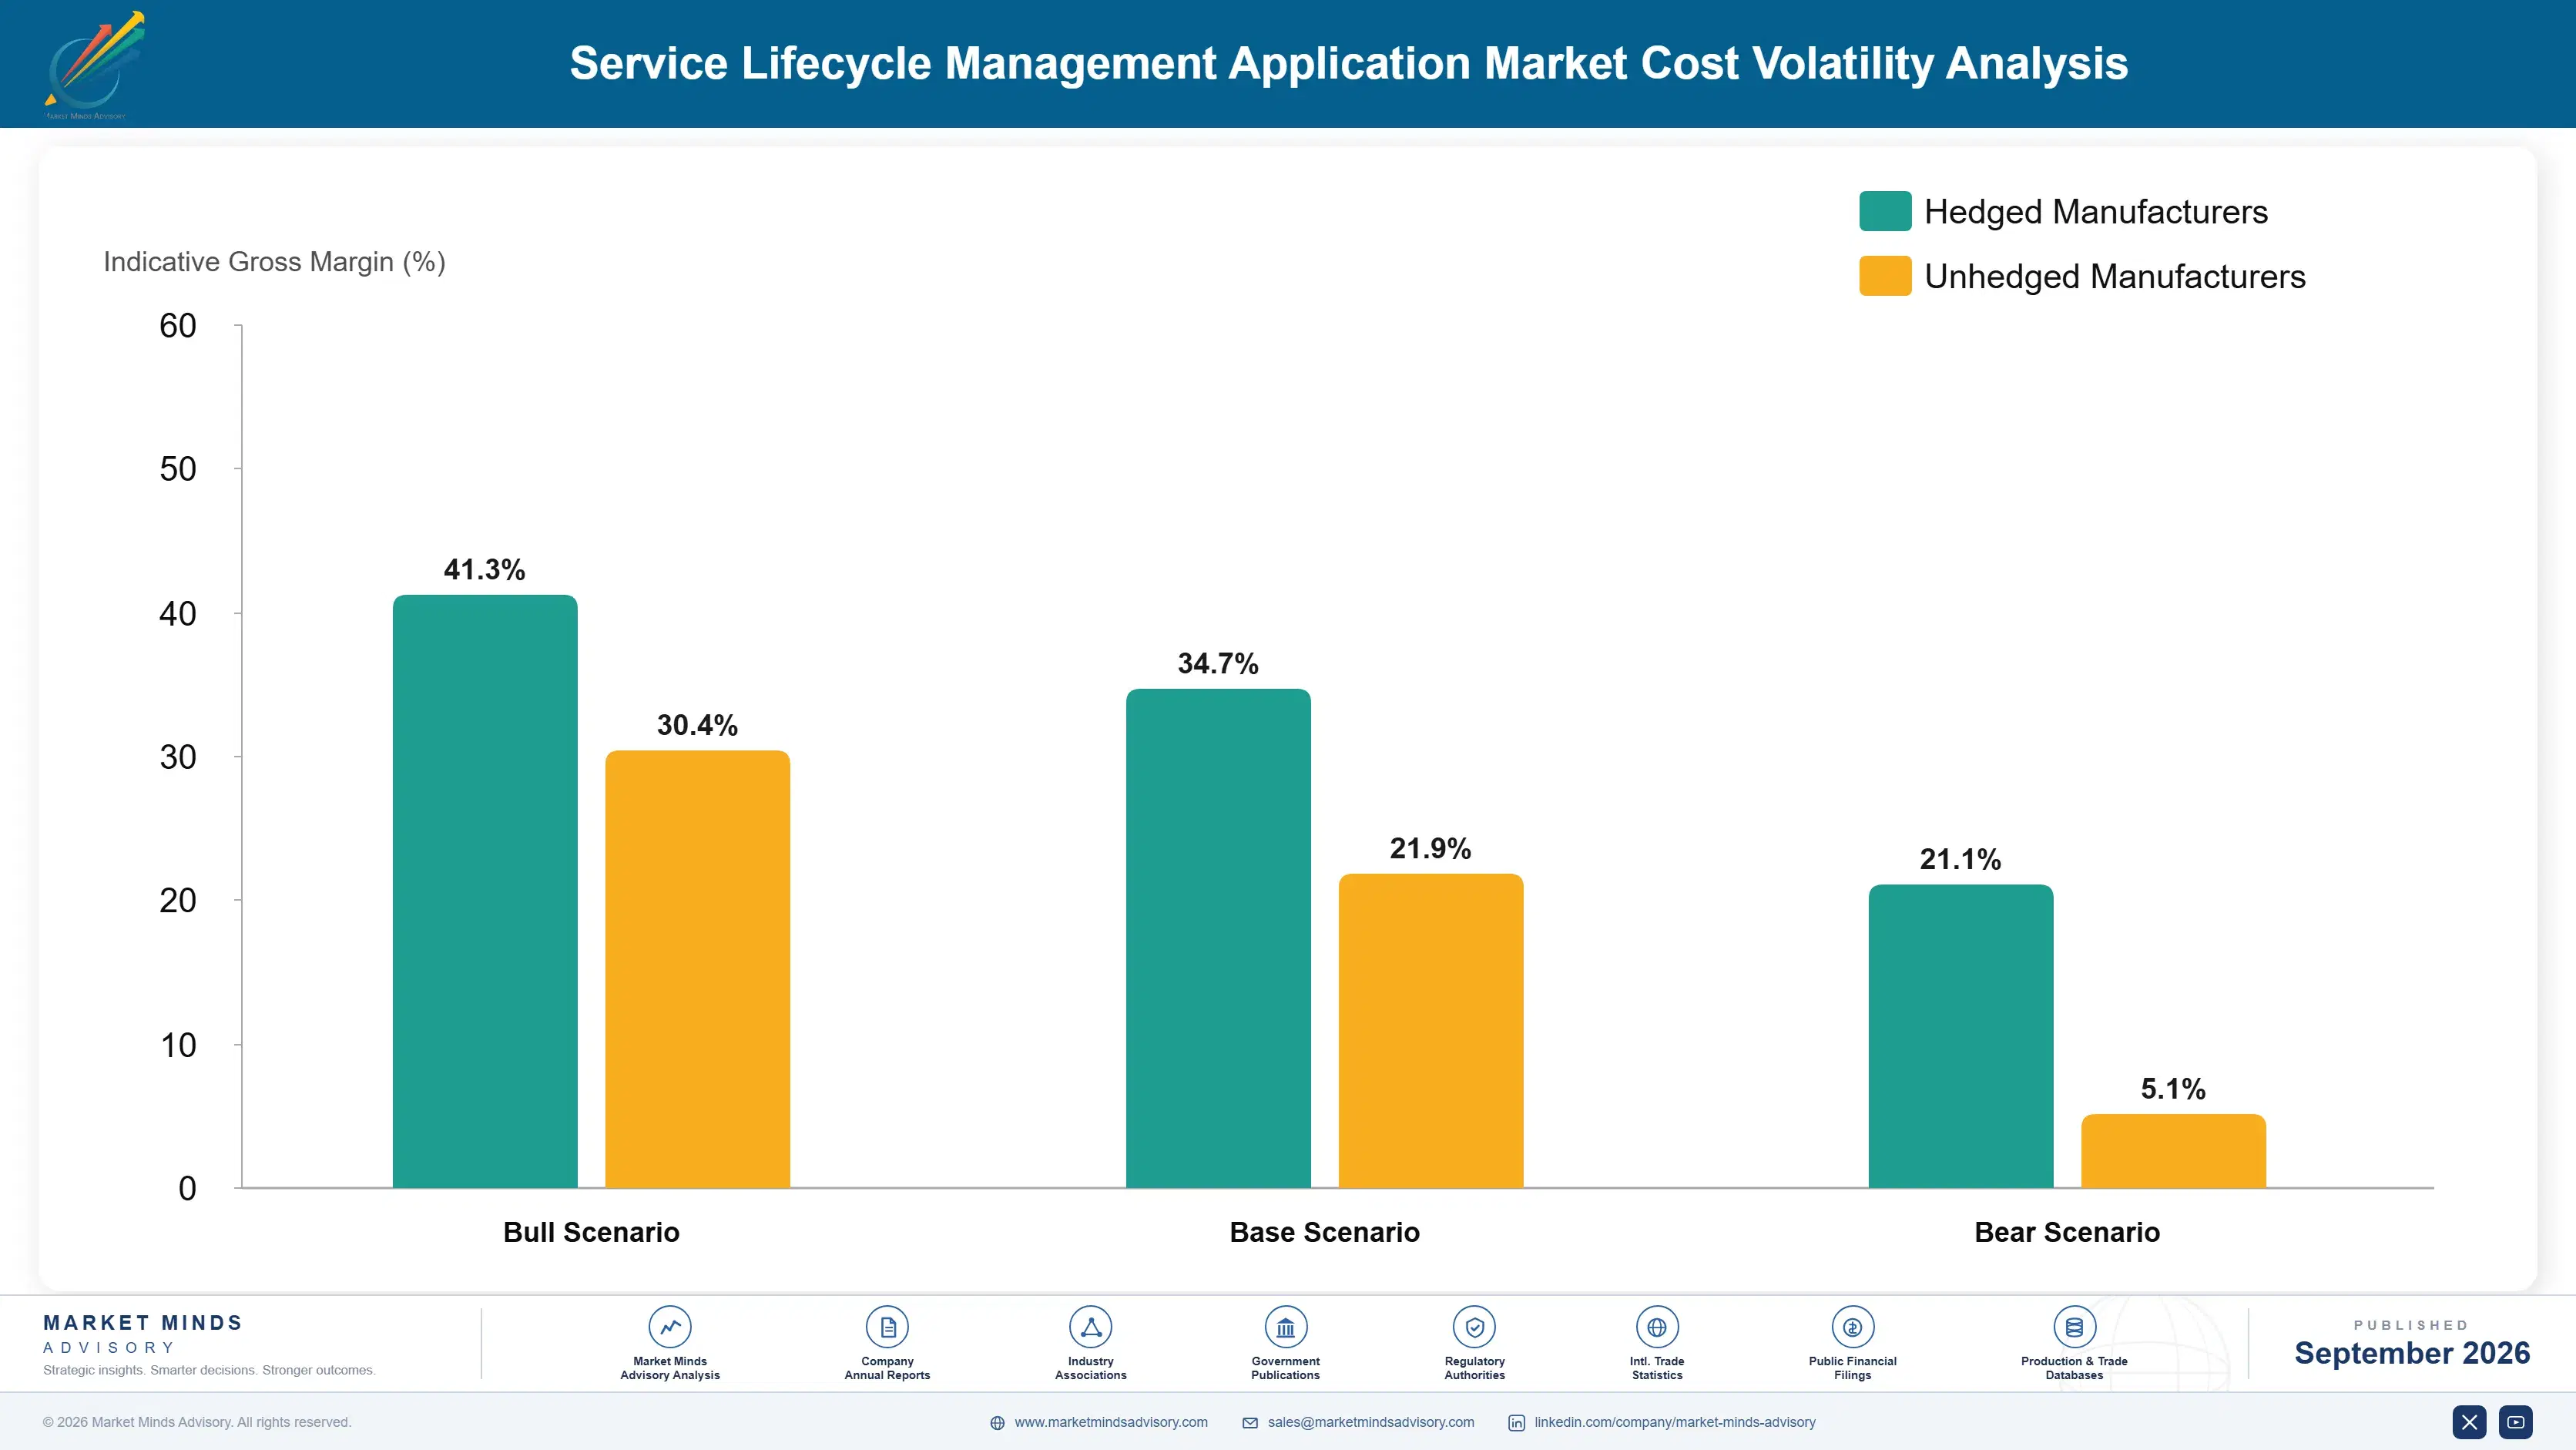
Software research and development accounts for roughly 36% of vendor cost, implementation and configuration services around 31%, installed base data reconstruction between 8 and 14%, and support, sales and overhead the balance. The services proportion is unusually high because aftermarket implementations depend on data that manufacturers frequently do not hold, and United States Bureau of Labor Statistics data shows the specialist consultant wages involved rising steadily.
Implementation consultant rates rose sharply as demand for supply chain and service specialists competed with wider enterprise software work, and several vendors disclosed services margin pressure in results covering the period. Data reconstruction effort also proved larger than scoped on numerous engagements, since the extent of missing installed base information is rarely known until an implementation is already underway and committed. Scoping overruns on data work became routine rather than exceptional.

The disadvantage mechanism is delivery model rather than scale. A vendor performing implementation with onshore consultants carries a cost base that offshore or partner-led delivery undercuts substantially on identical scope. Data reconstruction is the further asymmetry, since vendors treating it as customer responsibility watch implementations fail and lose references, while those absorbing it carry cost that competitors avoid until the failures start.
service-lifecycle-management-application-market-cost-volatility-analysis-1788417857150

Partner-led implementation with certified methods

Delivering implementation through certified partners rather than internal consultants removes a cost base that partner-led competitors undercut, provided the method is prescriptive enough that quality holds. It costs direct customer relationship depth, which vendors selling to finance buyers can afford rather less comfortably than they expect. Quality holds only where the method is genuinely prescriptive.

Installed base reconstruction as a productised offer

Packaging data reconstruction as a defined scope with a fixed method rather than treating it as discovery removes the overrun that damages both margin and references. It requires admitting the problem exists during a sales cycle, which vendors resist because competitors are promising implementations that will not work either. Competitors promise implementations that will not work either.

Telemetry-derived configuration replacing manual records

Connected equipment reporting its own configuration removes most of the reconstruction effort for products fitted with it, which shifts the problem to older installed base only. Coverage grows slowly because equipment lives for decades, so the benefit accrues over a period far longer than any implementation timeline. Equipment lives for decades, so coverage improves very slowly indeed.

Portfolio Architecture for Margin Defence

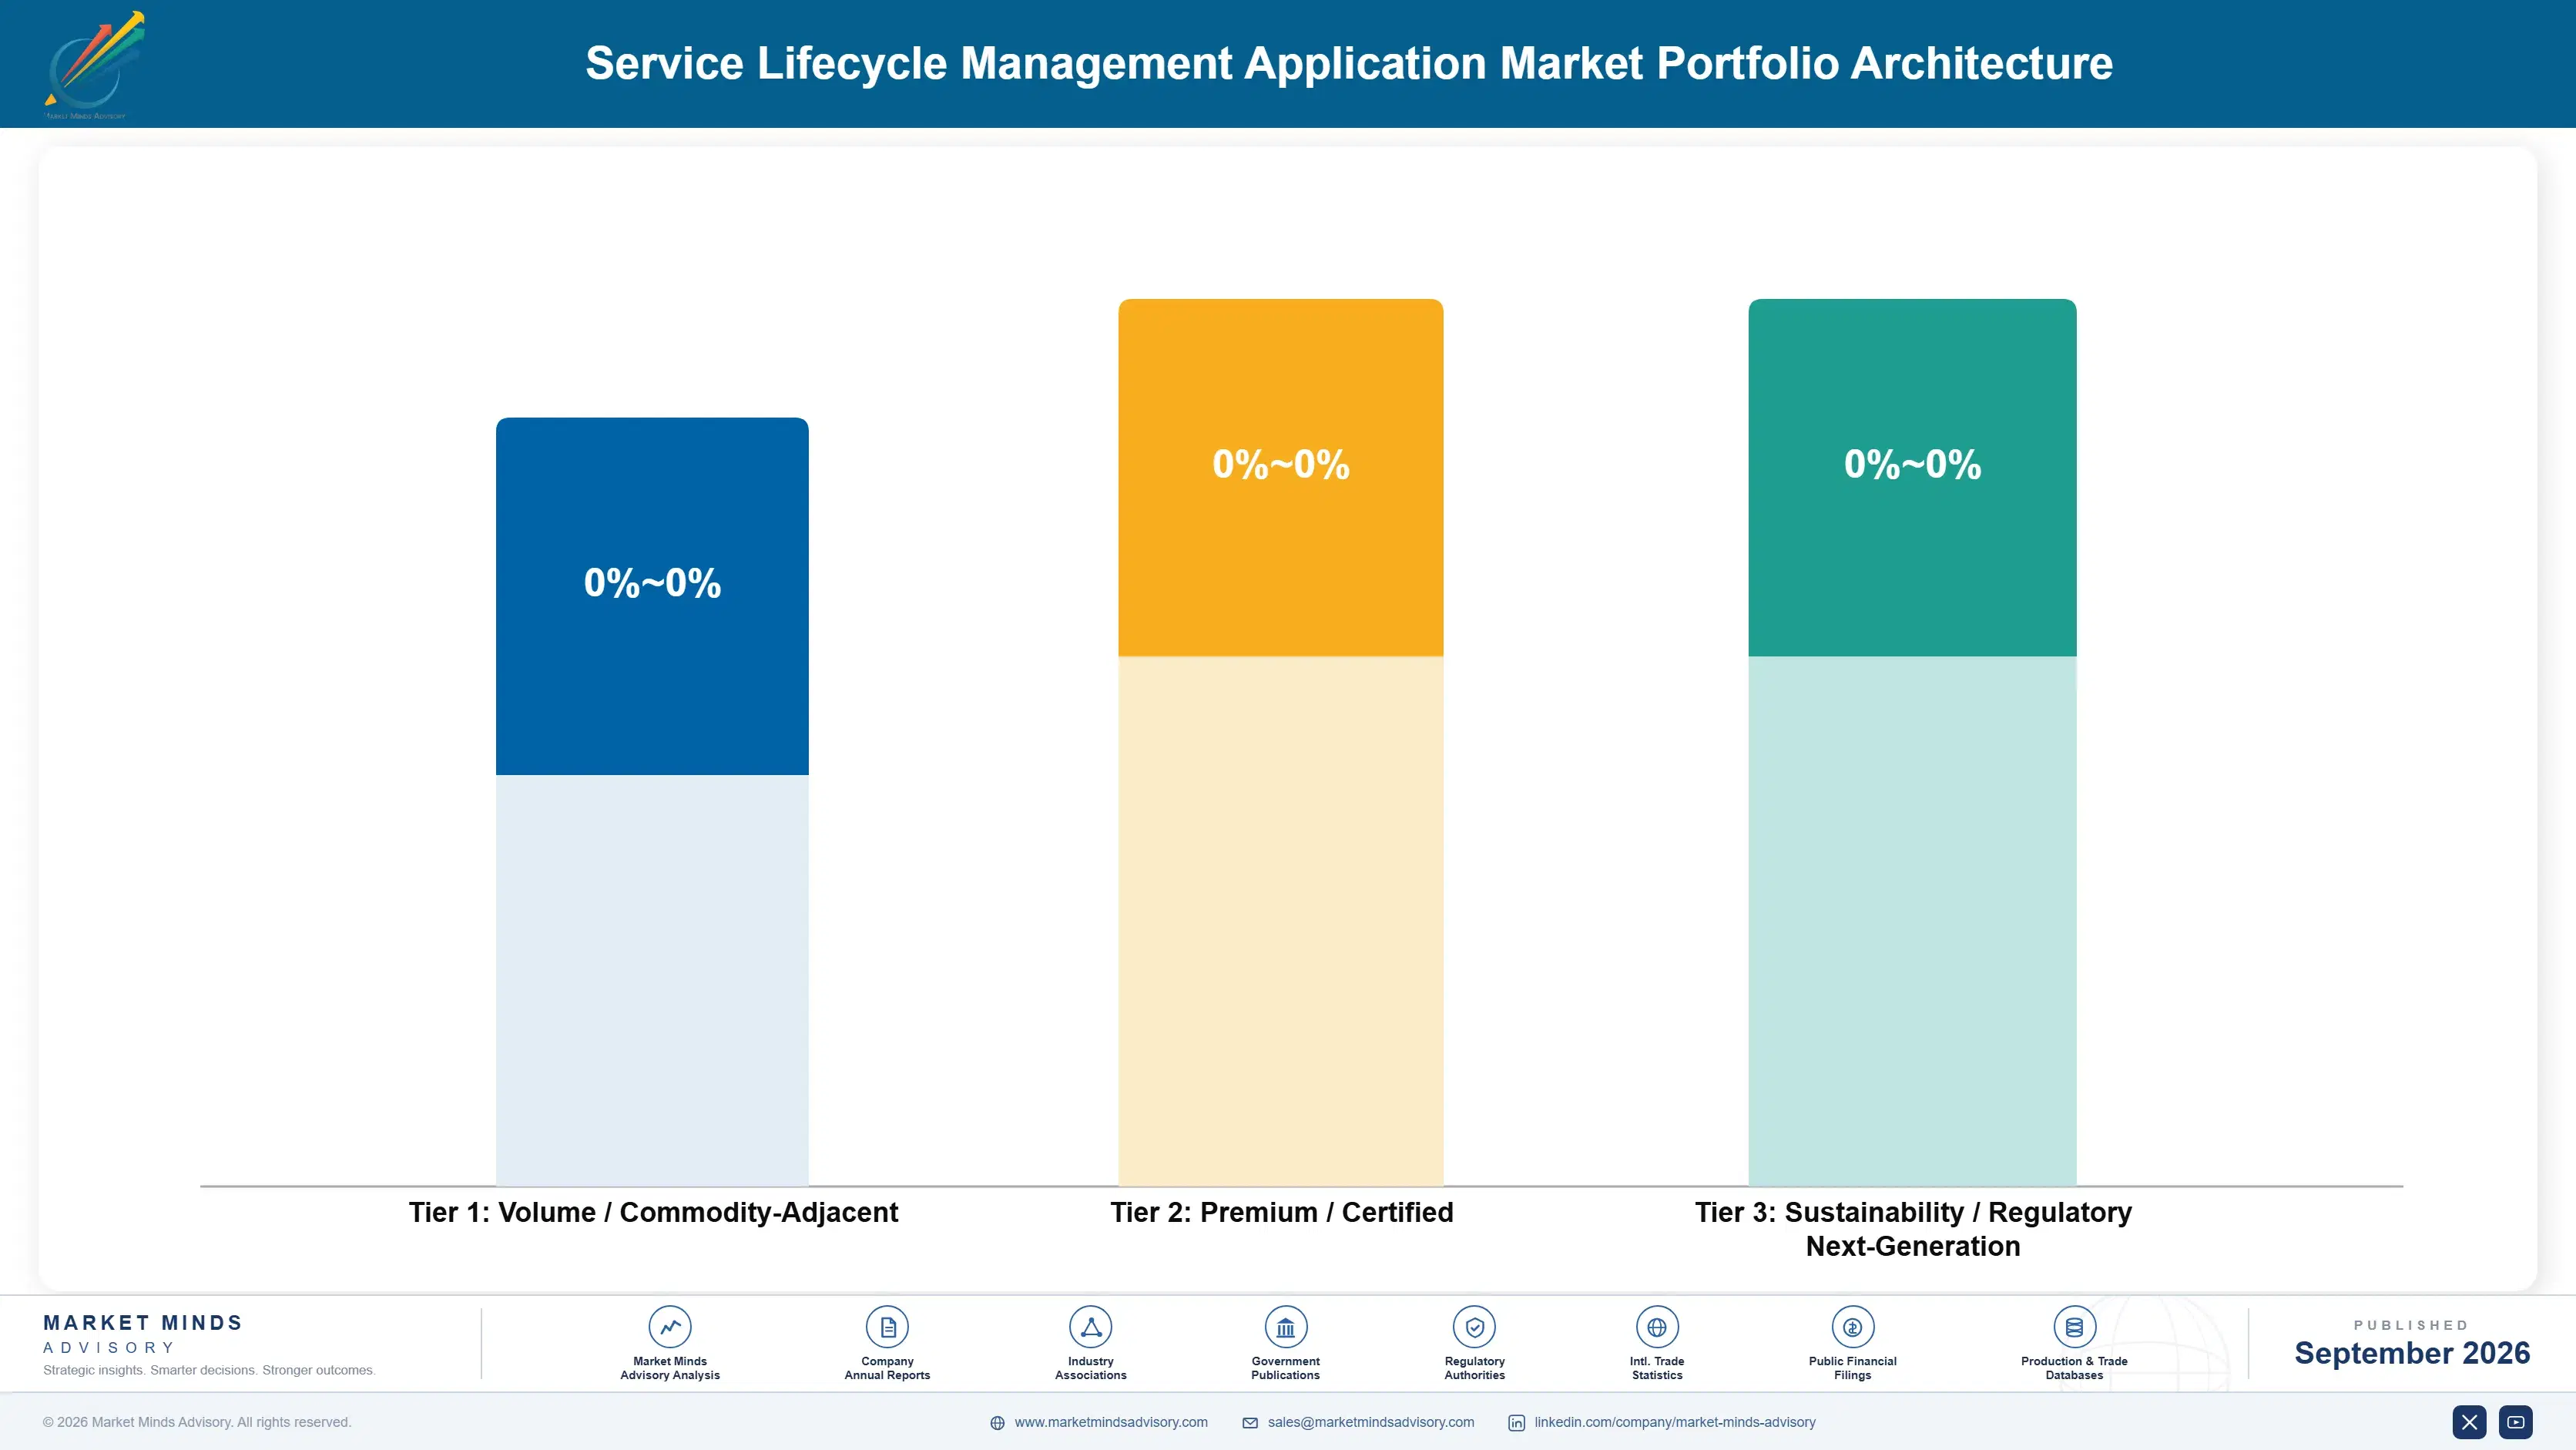
Margin separates by which budget the module reaches. Parts planning and warranty produce numbers a finance function verifies, which means a fundable business case, a shorter approval cycle and pricing against the capital or cash they release. Field service, documentation and depot modules argue productivity and process improvement to operations leaders holding smaller budgets, and they are priced against competitors rather than against any outcome.
The volume against premium tension runs through implementation. Services revenue is large, low margin and unavoidable, because aftermarket implementations depend on data manufacturers do not hold and somebody has to reconstruct it. Vendors treating that as customer responsibility watch implementations fail and lose references they cannot afford to lose. The correct reading treats data work as a cost of selling software rather than as a business, and most vendors still manage it as a profit centre.

High-value pools sit where money is released rather than saved: parts capital reduction, warranty supplier recovery and the integration that lets prediction reach action. Each is measured in cash and each reaches a buyer with authority to spend. The pools are narrower than the aftermarket generally and carry a disproportionate share of the profit available in this category.

Volume / Commodity-Adjacent

Field service scheduling, technical documentation and depot repair modules sold to operations functions on productivity arguments. Competed directly against comparable products, with smaller budgets and considerably longer approval cycles than finance-funded modules face.
Gross Margin: 48 to 58%

Premium / Certified

Service contract management and integrated aftermarket suites where breadth rather than any individual module carries the value. The 12 point range reflects how much of the aftermarket a vendor genuinely holds rather than partners for.
Gross Margin: 62 to 74%

Sustainability / Regulatory / Next-Generation

Service parts planning and warranty recovery sold against released capital and recovered cash. The 14 point range reflects how completely a verifiable financial return changes pricing power against a process improvement argument.
Gross Margin: 70 to 84%
service-lifecycle-management-application-market-portfolio-architecture-1788417857650

High-value Sub-segments and Strategic Watch-out

Service Parts Capital Reduction

Addresses inventory at roughly 3.4 times requirement, which is large, visible on a balance sheet and rarely examined. The one aftermarket argument a finance director funds without needing to be persuaded of anything first. The effect appears in working capital within a single year. Finance signs it off.
Gross Margin: 72 to 84%

Warranty Supplier Recovery

Collects money the manufacturer is contractually entitled to, since only around 31% of warranty cost is currently recovered from the suppliers responsible. Produces cash rather than avoided cost, which is the strongest argument available anywhere here. Accrual accuracy reaches auditors as well, which shortens the approval considerably.
Gross Margin: 68 to 80%

Aftermarket Integration Layers

Closes the gap where a prediction crosses four separate systems before reaching anybody able to act on it. Favours vendors holding several modules decisively over specialists with the best individual product. Manufacturers are only now discovering that prediction was never the constraint. Prediction was never it.
Gross Margin: 62 to 74%

Field Service Scheduling

Sold on productivity to operations leaders with smaller budgets and longer approval cycles than finance-funded modules ever face. Broadly adopted, partially used, and priced against competitors rather than against any measurable outcome. Operations leaders hold smaller budgets and considerably slower approval cycles. That gap decides everything.
Gross Margin: 48 to 58%

Who Funds Aftermarket Systems

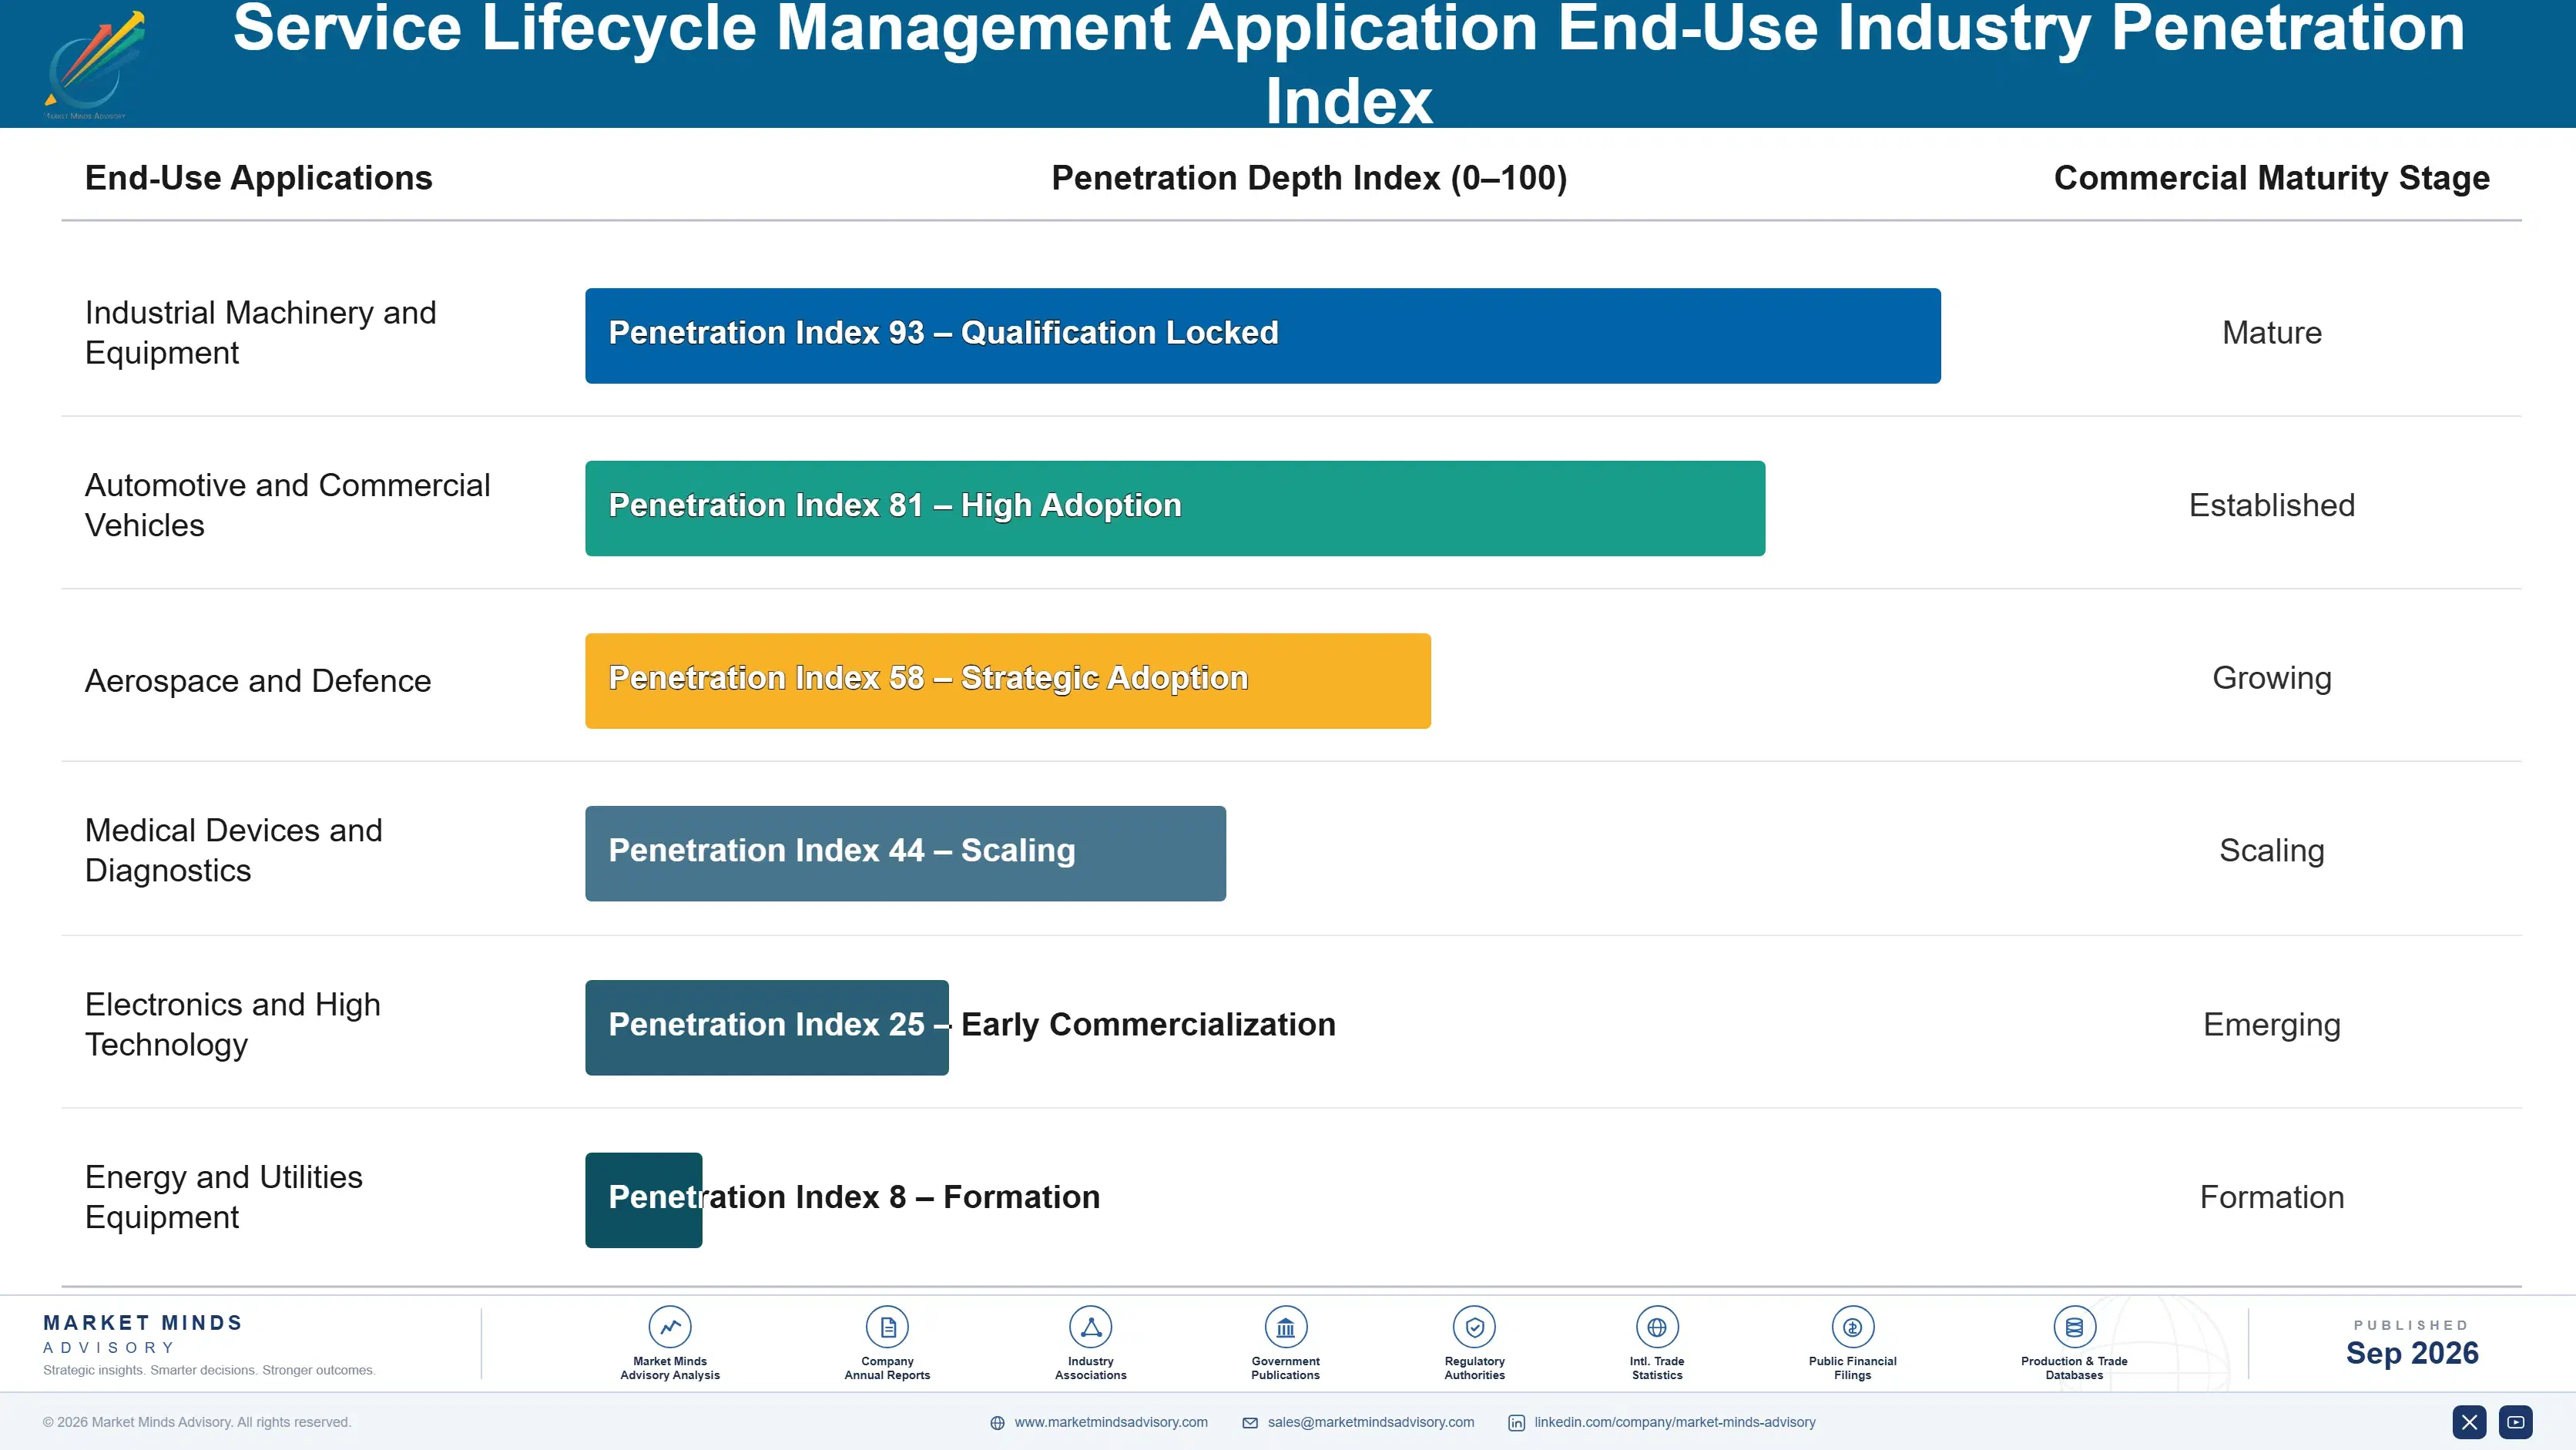
Annuity economics here are strong once implemented, because service systems become embedded in parts distribution, warranty accounting and technician operations that a manufacturer cannot easily rebuild elsewhere. Renewal is close to automatic and switching is rare outside major platform consolidations. The difficulty sits entirely in the initial purchase, which competes for capital against production systems that have always been funded first.
Adoption depth varies sharply by how a manufacturer sells. Direct-selling manufacturers with their own service organisations adopt deeply, because they hold the installed base data and capture the aftermarket margin directly. Manufacturers selling through dealers and distributors adopt shallowly, since the dealer holds the customer, the equipment record and frequently the parts inventory as well. That distinction predicts adoption far better than company size does.

The buyer profile has moved from service to finance and it changed everything about what sells. Service directors bought field capability on productivity arguments against modest budgets. Chief financial officers now fund parts planning and warranty against working capital and recovered cash, with larger budgets and shorter approval cycles. Vendors whose commercial organisation calls on service departments are reaching the audience that stopped controlling this spending.
service-lifecycle-management-application-market-end-use-penetration-index-1788417858148

Where Vendors Should Compete

These are among the four positions where our research anticipates prominent divergence between winners and laggards over the coming forecast period. Each is grounded in the demand model, the regulatory perimeter, and the announced capacity pipeline.
01 / FINANCE BUYER POSITIONING

Sell released capital, not technician productivity

Service inventory sitting at roughly 3.4 times what demand patterns require is large, visible on a balance sheet and almost never examined with the rigour applied to production stock, which makes it the one aftermarket argument a finance director will fund without hesitation. Purpose-built planning reduces it while improving availability, and the effect shows in working capital inside a year. Vendors arguing productivity reach an operations leader holding a far smaller budget and a much slower approval cycle behind it.
02 / WARRANTY RECOVERY FOCUS

Chase supplier recovery, not claims administration

Only around 31% of warranty cost is recovered from the component suppliers who actually caused the failure, which is money a manufacturer is contractually entitled to and simply fails to collect for want of evidence and process. Recovery produces cash rather than avoided cost, which is comfortably the strongest argument available anywhere in this whole software category today. Vendors selling warranty as claims administration are describing the operational half of it and quietly ignoring the financial one that actually funds it.
03 / INTEGRATION LAYER OWNERSHIP

Close the loop from prediction to dispatch

Connected equipment makes failure prediction straightforward and entirely useless, because a prediction crosses four separate systems from different vendors before reaching anybody who can dispatch a part or a technician to site. The constraint was never the prediction itself, and manufacturers are only now beginning to discover that properly. Vendors holding several modules close that loop where single-module specialists cannot, whatever the quality of any individual product might happen to be, which is precisely why breadth wins out here in the end.
04 / DATA RECONSTRUCTION INCLUSION

Fix the installed base record before implementing anything

Planning software cannot perform against a record that does not say what equipment exists, where it sits or how it has been configured, and manufacturers selling through distribution routinely hold nothing accurate at all. Implementations fail on this rather than on method, which damages references and lengthens sales cycles across the whole category. Including reconstruction in the engagement removes entirely the one persistent failure mode that has quietly embarrassed this industry for a good many years on end now, at real commercial cost.

Engagement Snapshot From the Field

A live engagement with an industry participant carrying material or product regulatory and market exposure ahead of a defining policy shift, showing how our research translates into a defensible multi-year portfolio strategy.
MARKET MINDS ADVISORY · CLIENT ENGAGEMENT SUMMARY
Service Lifecycle Management Application Producer Strategic Portfolio Review and Transition Roadmap 2026·Investment Scenario on Service Lifecycle Management Application Exposure Evaluation 2025-26
CLIENT PROFILE
A European industrial equipment manufacturer with an installed base across more than fifty countries and annual group revenue reported at approximately USD 4.3 billion (client-reported, unverified by MMA). Aftermarket generated the majority of group profit, and service parts were planned using the same forecasting configuration applied to production materials across the whole of the business, with predictable consequences.
STRATEGIC CHALLENGE
Service parts inventory had grown for five consecutive years while parts availability complaints also increased, which nobody could reconcile. A field service platform purchased three years earlier was used partially and had not improved either measure. Management could not establish where the aftermarket problem actually was. Nobody had looked properly.
MMA APPROACH
MMA analysed parts demand patterns against the forecasting method applied, measured inventory position against installed base distribution rather than against historical consumption, and quantified warranty supplier recovery against contractual entitlement across the client's principal component suppliers. Distributor records were examined separately, since equipment sold through channel partners carried the worst data quality anywhere in the population.
KEY FINDINGS
  1. Service parts were held at roughly 3.4 times what demand patterns required, and the excess sat in central warehouses while regional depots serving actual failures stocked out repeatedly.
  2. Production forecasting logic was the direct cause, since it assumed smooth order-driven demand while service demand was intermittent and driven entirely by installed base failure rates.
  3. Warranty recovery from component suppliers stood at around 31% of entitlement, and the shortfall exceeded the entire aftermarket systems budget by a very wide margin.
  4. Installed base records were incomplete for equipment sold through distributors, which was roughly 40% of the population and the part with the worst parts availability.
CLIENT PROFILE
A European industrial equipment manufacturer with an installed base across more than fifty countries and annual group revenue reported at approximately USD 4.3 billion (client-reported, unverified by MMA). Aftermarket generated the majority of group profit, and service parts were planned using the same forecasting configuration applied to production materials across the whole of the business, with predictable consequences.
STRATEGIC CHALLENGE
Service parts inventory had grown for five consecutive years while parts availability complaints also increased, which nobody could reconcile. A field service platform purchased three years earlier was used partially and had not improved either measure. Management could not establish where the aftermarket problem actually was. Nobody had looked properly.
MMA APPROACH
MMA analysed parts demand patterns against the forecasting method applied, measured inventory position against installed base distribution rather than against historical consumption, and quantified warranty supplier recovery against contractual entitlement across the client's principal component suppliers. Distributor records were examined separately, since equipment sold through channel partners carried the worst data quality anywhere in the population.
KEY FINDINGS
  1. Service parts were held at roughly 3.4 times what demand patterns required, and the excess sat in central warehouses while regional depots serving actual failures stocked out repeatedly.
  2. Production forecasting logic was the direct cause, since it assumed smooth order-driven demand while service demand was intermittent and driven entirely by installed base failure rates.
  3. Warranty recovery from component suppliers stood at around 31% of entitlement, and the shortfall exceeded the entire aftermarket systems budget by a very wide margin.
  4. Installed base records were incomplete for equipment sold through distributors, which was roughly 40% of the population and the part with the worst parts availability.
RECOMMENDED STRATEGY
Phase 1: Phase one: reconstruct the installed base record for distributor-sold equipment before implementing any planning system against data that does not exist. Phase 2: Phase two: replace production forecasting with purpose-built intermittent demand planning and reposition all parts inventory against actual installed base distribution. Phase 3: Phase three: build warranty supplier recovery as a funded process with evidence capture, rather than treating it as an occasional commercial negotiation.
OUTCOME
Within fourteen months the client had reconstructed the distributor installed base, cut service parts inventory by 28% while improving availability, and raised warranty supplier recovery to 54% (client-reported, unverified by MMA). Aftermarket systems now report into the finance function rather than into the service organisation, which changed how they are funded.

Frequently Asked Questions

Foundational context covering the market sizes, CAGR, scope, country, region and competition that inform every finding below. This section is provided to cover basics and most often pre-purchase conversations, answered from the MMA Primary Research Dataset.

What is the current size of the Service Lifecycle Management Application Market?

The market was valued at USD 5.4 billion in 2025 and reaches USD 5.97 billion in 2026. Modules touching capital and audited liability drive most of the growth.

How large will the Service Lifecycle Management Application Market be by 2036?

MMA forecasts USD 16.35 billion by 2036, an increase of USD 10.38 billion over the 2026 base. That represents an expansion multiple of 2.74 times.

What is the CAGR for the Service Lifecycle Management Application Market 2026 to 2036?

The base case CAGR is 10.6%, with a bull case of 11.8% and a bear case of 9.4%. The historical rate between 2020 and 2025 was 9.4%.

Which segment is growing fastest?

Service parts planning and inventory grows at 15.9%, half again the market rate of 10.6%. It is the one module producing a return a finance function actually verifies.

Who are the major companies in the Service Lifecycle Management Application Market?

PTC, SAP, Siemens, Salesforce and IFS lead on measured licence and subscription revenue. Together they account for roughly 47% of a moderately concentrated global market.

Which country is growing fastest?

India grows fastest at 17.2%, as domestic manufacturers build aftermarket networks without any legacy systems and capability centres run service operations on behalf of Western manufacturers at scale.

Report Segmentation Architecture

The full report scope spans multiple orthogonal segmentation dimensions, with cross-tabulated demand data provided for each dimension pair. Coverage extends further to regional breakdowns, trend trajectories, and the competitive detail needed to support segment-level decision-making.

By Application Module

  • Service Parts Planning and Inventory
  • Warranty and Claims Management
  • Field Service Management
  • Service Contract and Entitlement Management
  • Repair, Returns and Depot Operations
  • Technical Documentation and Service Knowledge

By End-Use Industry

  • Industrial Machinery and Equipment
  • Automotive and Commercial Vehicles
  • Aerospace and Defence
  • Medical Devices and Diagnostics
  • Electronics and High Technology
  • Energy and Utilities Equipment

By Service Model and Buying Function

  • Direct Manufacturer Service Operations
  • Dealer and Distributor Delivered Service
  • Third-Party Maintenance Providers
  • Finance and Working Capital Procurement
  • Service Operations Procurement
  • Outcome and Availability Contracting

By Region

  • Western Europe
  • North America
  • East Asia
  • South Asia and Pacific
  • Latin America
  • Middle East and Africa
  • Eastern Europe

Scope, Methodology, and Coverage

Every figure in this report is reproducible from documented input assumptions. The scope below maps the historical period, the forecast horizon, the segmentation dimensions, and the countries covered, alongside the underlying primary and qualitative methodology.
Historical Period
2020 to 2025
Forecast Period
2026 to 2036
Base Year
2025 (USD billions; MMA Primary Research Dataset, September 2026)
Market Definition
The service lifecycle management application market covers software that plans, executes and accounts for the aftermarket support of manufactured products, spanning service parts planning and inventory, warranty and claims management, field service management, service contract and entitlement management, repair returns and depot operations, and technical documentation and service knowledge. Sizing is measured at vendor licence, subscription and maintenance revenue. Enterprise resource planning, product design tools, manufacturing execution, customer relationship management sold independently and implementation consulting are excluded.
Quantitative Units
USD billions at vendor licence, subscription and maintenance revenue, with supporting installed base coverage and served equipment populations by region
Segmentation Dimensions
Application module, end-use industry, service model and buying function, region
Regions Covered
Western Europe, North America, East Asia, South Asia and Pacific, Latin America, Middle East and Africa, Eastern Europe
Countries Covered
Germany, Switzerland, Italy, Sweden, France, United Kingdom, Poland, Czech Republic, United States, Canada, Mexico, Brazil, Japan, South Korea, China, India, Australia, Saudi Arabia
Key Companies Profiled
PTC, SAP, Siemens, Salesforce, IFS, Oracle, Syncron, Baxter Planning, Tavant Technologies, Infor, Microsoft, ServiceNow, Aquant, Zinier, OnProcess Technology, Dassault Systemes, Hitachi, Fujitsu, Wipro, Accenture
Quantitative Methodology
Primary survey, n=3,800 respondents, Q4 2025, six countries; demand-side model with trade association cross-validation
Qualitative Methodology
47 expert interviews, Q4 2025; applied to validate demand model assumptions, identify emerging dynamics, and assess competitive positioning
Report Format
PDF and XLSX data workbook (Word format preview document)
Publisher
Market Minds Advisory
Report Code
MMA-2026-TEC-741
Published
September 2026
Contact
sales@marketmindsadvisory.com | www.marketmindsadvisory.com

Purchase the full Service Lifecycle Management Application Market Report (2026 to 2036).

The full report separates modules that produce verifiable financial returns from modules that argue process improvement, which is the distinction that explains why growth in this category is so unevenly distributed across it. It sizes six application modules with individual growth rates, seven regions built from installed base and service model maturity, and the parts oversupply that represents the largest recoverable value in the aftermarket. Competitive analysis covers twenty vendors on a consistent licence and subscription revenue basis, with module breadth and finance buyer access treated as the decisive variables. Input cost modelling breaks out engineering, implementation and data reconstruction exposure.
Six application modules with individual growth rates
Parts oversupply quantified against demand patterns
Warranty supplier recovery measured against entitlement
Integration gaps mapped between prediction and dispatch
Twenty vendors on consistent licence revenue basis
Engineering, implementation and data reconstruction cost exposure

Built For The People Who Decide

From boardroom strategy to bench-side execution, this report is read cover-to-cover by leaders shaping the next decade of their industry, turning demand scenarios, market dynamics and valuation benchmarks into decisions.
CXOs/ Presidents/ VPs/ Managers
M&A and Corporate Development
Strategy Teams and R&D Heads
Procurement and Product Directors
Regulatory and Compliance Leaders
Investor Relations and Equity Analysts